Abstract
T-cell development in the thymus undergoes the process of differentiation, selective proliferation, and survival from CD4−CD8− double negative (DN) stage to CD4+CD8+ double positive (DP) stage prior to the formation of CD4+ helper and CD8+ cytolytic T cells ready for circulation. Each developmental stage is tightly regulated by sequentially operating molecular networks, of which only limited numbers of transcription regulators have been deciphered. Here, we identified Zfp335 transcription factor as a new player in the regulatory network controlling thymocyte development in mice. We demonstrate that Zfp335 intrinsically controls DN to DP transition, as T-cell-specific deficiency in Zfp335 leads to a substantial accumulation of DN3 along with reduction of DP, CD4+, and CD8+ thymocytes. This developmental blockade at DN stage results from the impaired intracellular TCRβ (iTCRβ) expression as well as increased susceptibility to apoptosis in thymocytes. Transcriptomic and ChIP-seq analyses revealed a direct regulation of transcription factors Bcl6 and Rorc by Zfp335. Importantly, enhanced expression of TCRβ and Bcl6/Rorc restores the developmental defect during DN3 to DN4 transition and improves thymocytes survival, respectively. These findings identify a critical role of Zfp335 in controlling T-cell development by maintaining iTCRβ expression-mediated β-selection and independently activating cell survival signaling.
Research organism: Mouse
Introduction
T-cell development proceeds in a series of developmental stages, which is precisely orchestrated by multiple signaling and molecular networks (Hosokawa and Rothenberg, 2021; López-Rodríguez et al., 2015; Rothenberg, 2014). Prethymic progenitor cells originated from bone marrow migrate into the thymus and sequentially differentiate into CD4−CD8− (DN), CD4+CD8+ (DP), and the CD4+ or CD8+ (SP) stage. Based on the expression of CD44 and CD25, DN thymocytes are divided into several phenotypically distinct stages, including DN1 to DN4 (Rothenberg et al., 2008; Yang et al., 2010; Yui and Rothenberg, 2014; Kurd and Robey, 2016). In the presence of Notch signaling, early thymic progenitor (ETP)-DN1 cells transit into DN2a stage, initiating the T-cell lineage commitment, which is immediately accompanied by TCRβ gene arrangement. The majority of DN2 cells enter the DN3 stage with αβ lineage potential (Godfrey et al., 1993). Only DN3 cells with a complete pre-TCR complex, which consists of the functional TCRβ protein, pre-Tα (pTα) chain, and CD3 molecule, can successfully trigger the subsequent maturation into DN4 and DP thymocytes. Further differentiation into mature CD4+ or CD8+ T cells requires positive and negative selection at DP stage before they migrate to peripheral lymphoid organs (Dudley et al., 1994; Hoffman et al., 1996; von Boehmer and Fehling, 1997; Malissen et al., 1999).
Pre-TCR signals regulate thymocyte differentiation by mediating protection from apoptosis, stimulating proliferation, and inducing allelic exclusion at the TCRβ locus in post-β-selection DN3b cells and promoting DN to DP transition (Hoffman et al., 1996; Aifantis et al., 1997; Kruisbeek et al., 2000). Inactivation of pre-TCR components dampens T-lymphocyte development by arresting thymocytes at the DN3 stage and inducing apoptosis (Fehling et al., 1995; Malissen et al., 1995; Mombaerts et al., 1992a; Mombaerts et al., 1992b). Multiple transcription factors downstream of pre-TCR signaling are involved in T-cell differentiation and survival. The major pre-TCR signaling is conducted through the dose-dependent expression of Notch controlled by the Id3–E2A axis (Liu et al., 2021). Abrogation of either Notch or E2A expression may lead to the developmental block of thymocytes at multiple stages (Ikawa et al., 2006; Shah and Zúñiga-Pflücker, 2014; Belle and Zhuang, 2014). In addition, activation of NF-κB (Voll et al., 2000), Ets1 (Eyquem et al., 2004), and NFAT5 (Berga-Bolaños et al., 2013) by pre-TCR signals also contributes to the developmental block. The transcription factor T-cell factor 1 (TCF1), together with its downstream Bcl-11b, not only increases the potential to differentiate into T cells (Li et al., 2010; Ikawa et al., 2010), but also positively regulates thymocyte development via promoting TCRβ recombination and expression, as well as DP cell survival (Albu et al., 2007; Li et al., 2013). Apart from the essential role in the T follicular helper cell lineage commitment (Yu et al., 2009), Bcl6 induced by pre-TCR signals is also involved in the DN to DP transition and protection of DN4 cells from apoptosis (Solanki et al., 2020). Additionally, abrogation of Rorc expression in thymocytes leads to a decreased DP proportion and impaired DP survival in a Bcl-xl-dependent manner (Villey et al., 1999; Sun et al., 2000; Xi et al., 2006).
Although pre-TCR signaling is crucial for the β-selection checkpoint, it is not sufficient for progression to the DN3 stage. Other pathways or transcription factors coupled with or independent of conventional pre-TCR signaling are found to play important roles in the process (Ciofani et al., 2004). The developmental blockade in Smarca5- or Nkap-deficient thymocytes is confirmed by intact pre-TCR signals in these mice (Pajerowski et al., 2009; Zikmund et al., 2019). Overall, it remains largely unknown which factors are crucial for T-cell development through mechanisms independent of pre-TCR signaling.
Zfp335, also known as the nuclear hormone receptor coregulator (NRC) – interacting factor 1 (NIF-1), is a zinc finger protein with a 13 C2H2 zinc finger repeating structure consisting of 1337 amino acids (Han et al., 2016). The C2H2-ZF family encodes more than 700 proteins in the human genome, some of which play important roles in ontogenesis, immune cell differentiation, and disease occurrence (Li et al., 2010; Heizmann et al., 2018), yet the biological characteristics and functions of most members are unclear (Stubbs et al., 2011; Emerson and Thomas, 2009). Zfp335 regulates gene transcription by recruiting H3K4 methyltransferase complexes, interacting with coactivators, or directly binding to certain gene promoters (Han et al., 2016; Yang et al., 2012; Mahajan et al., 2002; Wolfe et al., 2000). Zfp335 plays important regulatory roles in early embryonic development and neurogenesis (Yang et al., 2012). Germline knockout of Zfp335 is embryonic lethal, while deletion of Zfp335 gene in nerve cells impairs the proliferation and differentiation of nerve progenitor cells in mice, eventually leading to severe microcephaly (Yang et al., 2012). Function of Zfp335 in T-cell development has been observed in the study of the Zfp335bloto allele, a missense mutation derived from ENU mutagenesis. While thymocyte development is not significantly affected by this hypomorph mutation, there is a significant reduction in the number of peripheral T cells due to defects in the maturation and migration of thymocytes (Han et al., 2014). Without loss of function studies, it remains to be determined whether Zfp335 is required for intrathymic T-cell development.
In this study, we investigated Zfp335 expression during different thymocyte stages, as well as its function at the β-selection checkpoint and during DN to DP transition. We found that in the thymus, Zfp335 has the highest expression in DN3 thymocytes. Zfp335 is indispensable for thymocyte β-selection and supports the transition from DN to DP stage by maintaining intracellular TCRβ (iTCRβ) expression, as well as by promoting DN and DP thymocyte survival via directly regulating Bcl6 and Rorc expression.
Results
Impaired thymic αβ T-cell development in Zfp335-deficient mice
To study the role of Zfp335 in T-cell development, we first assessed the expression of Zfp335 among different thymocyte subsets, including DN3, DN4, DP, CD4, CD8, NKT, and γδ T cells. We found that DN3 cells displayed a relatively high level of Zfp335 mRNA expression (Figure 1A). Flow cytometry analysis also revealed that Zfp335 protein had the highest expression in DN3 thymocytes (Figure 1—figure supplement 1A, B). Consistently, microarray data from ImmGen showed higher expression of Zfp335 specifically at the DN3a stage during T-cell development from ETP to CD4/CD8 SP (Figure 1—figure supplement 2A). Although RNA-seq data from ImmGen exhibited the highest expression of Zfp335 in DP thymocytes, a gradually increased expression was observed from ETP to DN3 (Figure 1—figure supplement 2B). Given the importance of DN3 stage during β-selection checkpoint, we obtained T-cell-specific Zfp335 mice by crossing Zfp335fl/fl strain with Lck-Cre strain (Figure 1—figure supplement 3A). Zfp335 deletion was confirmed by real-time PCR (qPCR) analysis in DN4 cells (Figure 1—figure supplement 3B). Strikingly, LckCre+Zfp335fl/fl (KO) mice exhibited significantly smaller thymi and drastically decreased thymocyte numbers than WT control (Figure 1B). Further analysis showed that both percentages and numbers of DP cells, as well as CD4 SP and CD8 SP cells, were considerably reduced in KO mice (Figure 1C–E). Conversely, the percentage of DN cells was increased by nearly 10–15-folds, although the total number was decreased (Figure 1C–E). In secondary lymphoid organs, we also observed reduced CD4+ and CD8+ cells in the spleen and lymph nodes (Figure 1F–J). Thus, Zfp335 is essential for the development of αβT cells in the thymus.
Figure 1. Impaired thymocyte development in Zfp335-deficient mice.
(A) DN3, DN4, DP, CD4, CD8, NKT, and γδT cells were sorted from C57BL/6 thymocytes by flow cytometry. The mRNA levels of Zfp335 were measured by qPCR. (B) Thymi from LckCre+Zfp335+/+ (WT) and LckCre+Zfp335fl/fl (KO) mice. Representative thymi and total cell number of thymocytes. Scale bar, 1 cm. (C–E) The different stages of thymocyte development in WT and KO mice were measured by flow cytometry. (C) Representative flow cytometry (FACS) plots of DN, DP, CD4, and CD8 thymocytes. (D) The percentages of DN, DP, CD4, and CD8 thymocytes. (E) The numbers of DN, DP, CD4, and CD8 thymocytes. (F–J) CD4+ and CD8+ cells in spleen and lymph nodes from WT and KO mice were measured by flow cytometry. (F) Representative FACS plots of CD4+ and CD8+ cells in spleen and lymph nodes. The percentage and number of CD4+ T cells (G) and CD8+ T cells (H) in the spleen from WT and KO mice. The percentage and number of CD4+ T cells (I) and CD8+ T cells (J) in the lymph nodes from WT and KO mice. Results represent three independent experiments. n = 4 mice per group. *p < 0.05, **p < 0.01, ***p < 0.001, and ****p < 0.0001.

Figure 1—figure supplement 1. Zfp335 protein expression in thymocytes.

Figure 1—figure supplement 2. The transcriptional profiling of Zfp335 expression in various subsets of thymocytes.

Figure 1—figure supplement 3. Verification of Zfp335 conditional knockout mouse strain.

Zfp335 intrinsically regulates T-cell development in the thymus
To address whether Zfp335 deletion intrinsically affects T-cell development, Lin−CD25+CD44− DN3 cells from WT or KO mice were harvested and plated with OP9-DL1 cells in the presence of Flt3L and IL-7, an in vitro model for T-cell development (Figure 2A; Kondo et al., 2017). On both days 2 and 4, KO group produced fewer DP cells than WT control (Figure 2B–D, Figure 2—figure supplement 1A). When DN3 cells from WT (CD45.1+) and KO (CD45.2+) mice were mixed and cocultured at a 1:4 ratio (KO cells were rapidly competed out when used at a 1:1 ratio), significantly lower percentage and cell proportion of DP cells were also observed in KO group (Figure 2E–G, Figure 2—figure supplement 1B). Furthermore, in vivo T-cell development was investigated by adoptively transferring T- and B-cell-depleted bone marrow cells from WT (CD45.1+) and KO (CD45.2+) mice with a 1:4 ratio into WT (CD45.1+CD45.2+) recipients (Figure 2H). When thymocytes were analyzed 6 weeks post transfer, both the percentages and cell numbers of DP, CD4, and CD8 cells were significantly reduced while DN percentage was increased in the mice that received KO cells (Figure 2I, J, Figure 2—figure supplement 1C). Consistently, when WT and KO bone marrow cells were mixed at a 1:4 ratio for cotransfer experiments, fewer DP cell proportion detected in KO compared to WT group (Figure 2K, L; Figure 2—figure supplement 1D). In addition, DN3 cells from KO mice also generated fewer γδ T cells, despite a higher percentage, in comparison to WT controls after culturing for 4 days (Figure 2—figure supplement 2A–C). Together, we demonstrate that Zfp335 intrinsically regulates thymocyte development from DN to DP stage.
Figure 2. An intrinsic block from DN to DP stage in Zfp335-deficient mice.
(A) Schematic overview of the in vitro OP9-DL1 stromal coculture assay for T-cell differentiation from WT (CD45.1+) and KO (CD45.2+) DN3 thymocytes to DP and SP thymocytes. (B–D) WT and KO DN3 thymocytes were cultured with OP9-DL1 feeder cells in vitro in the presence of IL-7 (1 ng/ml) and Flt3L (5 ng/ml) for 2 and 4 days. The DN and DP thymocytes were measured by flow cytometry (n = 3). (B) Representative FACS plots of DN, DP, CD4+, and CD8+ thymocytes. (C) The percentages of DN, DP, CD4+, and CD8+ thymocytes 2 days post culture in vitro. (D) The percentage of DN, DP, CD4+, and CD8+ thymocytes 4 days post culture in vitro. (E–G) A mixed population of WT and KO DN3 thymocytes at a 1:4 ratio was cocultured with OP9-DL1 feeder cells in vitro in the presence of IL-7 (1 ng/ml) and Flt3L (5 ng/ml) for 2 and 4 days. The DN and DP thymocytes were phenotyped by flow cytometry (n = 3). (E) Representative FACS plots of DN, DP, CD4+, and CD8+ thymocytes. (F) Percentages of DN, DP, CD4+, and CD8+ thymocytes 2 days post culture in vitro. (G) Percentages of DN, DP, CD4+, and CD8+ thymocytes 4 days postculture in vitro. (H) Schematic overview of the in vivo bone marrow chimeric mice model for T-cell differentiation from WT (CD45.1+) and KO (CD45.2+) progenitors cells to DP and SP thymocytes. (I, J) Full chimeric mice were generated by transplanting WT (CD45.1+) or KO (CD45.2+) bone marrow progenitor cells into lethally irradiated (8.5 Gy) WT recipient mice (CD45.1+CD45.2+). Six weeks after transplantation, thymi from recipient mice were harvested. (I) Representative FACS plots of DN, DP, CD4+, and CD8+ thymocytes. (J) The percentages of DN, DP, CD4+, and CD8+ thymocytes. (K, L) Full chimeric mice were generated by transplanting a mixed population of WT (CD45.1+) and KO (CD45.2+) bone marrow progenitor cells at a 1:4 ratio into lethally irradiated WT recipients (CD45.1+CD45.2+) with 8.5 Gy. Six weeks after transplantation, thymi from recipient mice were harvested. (K) Representative FACS plots of DN, DP, CD4+, and CD8+ thymocytes. (L) Percentages of DN, DP, CD4+, and CD8+ thymocytes. Results represent three independent experiments. n = 4 mice per group. *p < 0.05, **p < 0.01, ***p < 0.001, and ****p < 0.0001.

Figure 2—figure supplement 1. Zfp335 deletion caused defects of thymocyte development.

Figure 2—figure supplement 2. Effect of Zfp335 deletion on γδ T-cell percentages and cellularity in vitro.

Loss of Zfp335 blocks the transition from DN3 to DN4 stage
We further examined the impact of Zfp335 deletion on DN thymocyte development. Staining of CD44 and CD25 on pregated lineage (CD4/CD8/TCRβ/TCRδ/NK1.1/CD19/CD11b/CD11c)-negative thymocytes was performed in WT and KO mice. The results showed that a higher percentage of CD44−CD25+ DN3 cells but a lower percentage of CD44−CD25− DN4 cells were found in KO group compared to WT group (Figure 3A, B), in which the numbers of both DN3 and DN4 thymocytes were decreased (Figure 3C). The developmental blockade from DN3 to DN4 in Zfp335-deficient cells was verified by in vitro coculture assays on day 2 using OP9-DL1 cultured with WT and KO DN3 cells, respectively (Figure 3D, E) or mixed at a 1:4 ratio (Figure 3F, G) as described above. The in vivo bone marrow chimera models further confirmed the development block at the DN3 stage (Figure 3H–K), indicating that Zfp335 is indispensable for DN3 to DN4 transition during early-stage differentiation.
Figure 3. Zfp335-deficient thymocytes undergo a developmental block during DN3 to DN4 transition.

(A–C) Thymi were harvested from 6- to 8-week-old WT and KO mice. The different stages of DN thymocytes in WT and KO mice were measured by flow cytometry (n = 4). (A) Representative FACS plots of DN1 (CD25−CD44+), DN2 (CD25+CD44+), DN3 (CD25+CD44−), and DN4 (CD25−CD44−) thymocytes. (B) The percentages of DN3 and DN4 thymocytes. (C) The numbers of DN3 and DN4 thymocytes. (D–E) WT and KO DN3 thymocytes were cultured with OP9-DL1 feeder cells in vitro in the presence of IL-7 (1 ng/ml) and Flt3L (5 ng/ml) for 2 days. The expression of CD44 versus CD25 was measured by flow cytometry (n = 3). (D) Representative FACS plots of DN3 and DN4 thymocytes. (E) The ratio of DN3 to DN4 thymocytes 2 days post culture in vitro. (F–G) A mixed population of WT and KO DN3 thymocytes at a 1:4 ratio was cocultured with OP9-DL1 feeder cells in vitro in the presence of IL-7 (1 ng/ml) and Flt3L (5 ng/ml) for 2 days. The expression of CD44 versus CD25 was measured by flow cytometry (n = 3). (F) Representative FACS plots of DN3 and DN4 thymocytes. (G) The ratio of DN3 to DN4 thymocytes 2 days post culture in vitro. (H, I) Full chimeric mice were generated by transplanting WT (CD45.1+) or KO (CD45.2+) bone marrow progenitor cells into lethally irradiated (8.5 Gy) WT recipients (CD45.1+CD45.2+). Six weeks after transplantation, thymi from recipient mice were harvested. The expression of CD44 versus CD25 was measured by flow cytometry (n = 4). (H) Representative FACS plots of DN3 and DN4 cells. (I) The ratio of DN3 to DN4 thymocytes. (J, K) Full chimeric mice were generated by transplanting a mixed population of WT (CD45.1+) and KO (CD45.2+) bone marrow progenitor cells at a 1:4 ratio into lethally irradiated (8.5 Gy) WT recipient mice (CD45.1+CD45.2+). Six weeks after transplantation, thymi from recipient mice were harvested. The expression of CD44 versus CD25 was measured by flow cytometry (n = 4). (J) Representative FACS plots of DN3 and DN4 thymocytes. (K) The ratio of DN3 to DN4 thymocytes. Results represent three independent experiments. *p < 0.05, **p < 0.01, and ***p < 0.001.
Ablation of Zfp335 promotes apoptosis in thymocytes
During the β-selection, efficient proliferation of pre-T cells is necessary for DN to DP progression (Kreslavsky et al., 2012), during which the pre-TCR signal functions as a positive regulator of thymocyte survival, allowing for differentiation from pre-T cells into DP thymocytes. We sought to examine whether the defect in Zfp335 KO thymocyte development is due to impaired proliferation or survival. The in vivo BrdU incorporation assay showed comparable or even higher percentages of BrdU+ DN3 and DN4 cells (Figure 4A, B) as well as Ki67+ DN3 and DN4 cells (Figure 4—figure supplement 1). Nevertheless, when we examined thymocyte apoptosis, KO mice showed a remarkably higher percentages of Annexin V+ DN3 and DN4 cells compared to WT cells (Figure 4C, D). After coculture with OP9-DL1 for 4 days, both Zfp335-deficient DN3 and DN4 cells showed an increased percentage of Annexin V+ cells (Figure 4E, F). Further examination of the transition between the DN3a and DN3b stages found that the frequencies of both DN3a and DN3b were comparable between WT and Zfp335-deficient groups (Figure 4—figure supplement 2A–C). However, both cell populations showed enhanced cell apoptosis in Zfp335-deficient cells (Figure 4—figure supplement 2D–F), indicating that Zfp335 regulates thymocyte apoptosis in a TCR-independent manner. Moreover, in mixed bone marrow chimeras, Zfp335-deficient DN3 and DN4 cells also displayed significantly higher Annexin V+ cells (Figure 4G, H), indicating an intrinsic role of Zfp355 in regulating thymocyte survival.
Figure 4. Zfp335 deficiency promotes thymocyte apoptosis in vivo and in vitro.
(A, B) Thymi were harvested from 6- to 8-week-old WT and KO mice. The expression of BrdU in DN3 and DN4 thymocytes from WT and KO thymi was measured by flow cytometry (n = 3). (A) Representative FACS plots of BrdU expression in DN3 and DN4 thymocytes. (B) The percentages of BrdU+ thymocytes in DN3 and DN4 cells. (C, D) The binding of Annexin V in DN3 and DN4 thymocytes from WT and KO thymi was measured by flow cytometry (n = 3). (C) Representative FACS plots of Annexin V binding in DN3 and DN4 thymocytes. (D) The percentages of Annexin V+ DN3 and DN4 cells. (E, F) A mixed population of WT and KO DN3 thymocytes at a 1:4 ratio was cocultured with OP9-DL1 feeder cells in vitro in the presence of IL-7 (1 ng/ml) and Flt3L (5 ng/ml) for 4 days. The binding of Annexin V was measured by flow cytometry (n = 3). (E) Representative FACS plots of Annexin V+ DN3 and DN4 cells. (F) The percentage of Annexin V+ DN3 and DN4 cells. (G, H) Full chimeric mice were generated by transplanting a mixed population of WT (CD45.1+) and KO (CD45.2+) bone marrow progenitor cells at a 1:4 ratio into lethally irradiated WT recipient mice (CD45.1+CD45.2+) with 8.5 Gy. Five weeks after transplantation, thymi from recipient mice were harvested. The binding of Annexin V was measured by flow cytometry (n = 4). (G) Representative FACS plots of Annexin V+ DN3 and DN4 cells. (H) The percentage of Annexin V binding in DN3 and DN4 thymocytes. Results represent three independent experiments. **p < 0.01 and ****p < 0.0001.

Figure 4—figure supplement 1. Zfp335 deficiency has no effect on the proliferation of DN3 and DN4 cells.

Figure 4—figure supplement 2. Effect of Zfp335 deletion on DN3a and DN3b Cells.

Ectopic expression of TCRαβ overcomes DN3 stage block in Zfp335-deficient mice
The pre-TCR signal-controlled β-selection is essential for thymocyte differentiation from DN3 to DN4 stage (Zhao et al., 2019). We then examined the expression of genes involved in the pre-TCR complex in DN3 and DN4 cell populations. The expression of Ptcra (encoding pTα) was slightly increased while Trbc1, Trbc2, and Cd3e in DN3 and DN4 cells were comparable in WT and KO group (Figure 5—figure supplement 1A, B). Additionally, the expression of intracellular CD3 (iCD3) was also unaffected in both Zfp335-deficient DN3 and DN4 cells (Figure 5—figure supplement 2A, B). Interestingly, flow cytometry analysis showed no substantial difference in iTCRβ expression between WT and KO DN3 cells, whereas Zfp335-deficient mice displayed a significant decrease in the percentage of iTCRβ+ DN4 cells (Figure 5A, B). To further address whether Zfp335 deficiency affects TCRβ expression, we compared differential usage of TCRβ in DN4 cells between WT and KO mice, in which the expression of TCR Vβ5, Vβ6, Vβ8, and Vβ12 were decreased concomitantly (Figure 5C–F). However, genomic DNA analysis for V-DJβ5 and V-DJβ8 rearrangements showed no difference between WT and KO DN3 cells (Figure 5—figure supplement 3). Thus, the reduced iTCRβ expression may be a consequence of protein degradation.
Figure 5. OT1 transgenic TCR overexpression rescued Zfp335 deficiency-induced defect during DN3 to DN4 transition.
(A, B) Thymi were harvested from 6- to 8-week-old WT and KO mice. The expression of iTCRβ in DN3 and DN4 thymocytes was measured by flow cytometry (WT n = 3; KO n = 4). (A) Representative FACS plots of iTCRβ expression in DN3 and DN4 thymocytes. (B) Percentages and numbers of iTCRβ+ thymocytes in DN3 and DN4 cells. Representative FACS plots of intercellular TCR Vβ5 (C), Vβ6 (D), Vβ8 (E), and Vβ12 (F) expression in DN4 cells from WT and KO mice. (G–I) Thymi from WT, KO, OT1+ (OT1Tg), and OT1+LckCre+Zfp335fl/fl (OT1Tg KO) mice were harvested. The expressions of iTCRβ in DN3 (up) and DN4 (down) thymocytes were measured by flow cytometry (WT n = 3; KO n = 5; OT1Tg n = 3; OT1Tg KO n = 5). (G) Representative FACS plots of iTCRβ expression in DN3 and DN4 thymocytes. (H) The percentage of iTCRβ+ DN3 and DN4 cells in WT, KO, OT1Tg, and OT1Tg KO mice. (I) The numbers of iTCRβ+ DN3 and DN4 cells in WT, KO, OT1Tg, and OT1Tg KO mice. (J–L) The different stages of DN thymocytes in WT, KO, OT1Tg, and OT1Tg KO mice were measured by flow cytometry (WT n = 3; KO n = 5; OT1Tg n = 3; OT1Tg KO n = 5). (J) Representative FACS plots of DN3 and DN4 thymocytes. (K) The percentages of DN3 and DN4 thymocytes. (L) The numbers of DN3 and DN4 thymocytes. (M, N) The different stages of thymocyte development in WT, KO, OT1Tg, and OT1Tg KO mice were measured by flow cytometry (WT n = 3; KO n = 5; OT1Tg n = 3; OT1Tg KO n = 5). (M) Representative FACS plots of thymocytes. (N) The percentages of DN, DP, CD4+CD8−, and CD4−CD8+ thymocytes. Results represent three independent experiments. n = 3 per group. *p < 0.05, **p < 0.01, ***p < 0.001, and ****p < 0.0001.

Figure 5—figure supplement 1. Effect of Zfp335 deletion on pre-TCR complex expression in DN3 and DN4 cells.

Figure 5—figure supplement 2. Intercellular CD3 (iCD3) expression in Zfp335-deficient DN3 and DN4 thymocytes.

Figure 5—figure supplement 3. Effect of Zfp335 deletion on TCRβ rearrangement in DN3 thymocytes.

Figure 5—figure supplement 4. TCRβ overexpression could not rescue the increased DN cell apoptosis caused by Zfp335 deficiency.

Figure 5—figure supplement 5. OT1Tg failed to rescue thymocyte numbers.

Given that Zfp355 deficiency led to diminished iTCRβ expression in DN4 cells, we next investigated the effect of TCR overexpression on aberrant thymocyte development caused by Zfp335 deficiency. Offspring (LckCre+Zfp335fl/flOT1+) of LckCre+Zfp335fl/fl mice crossed to OT1 transgenic (Tg) mice was generated to constitutively express Tcra-V2 and Tcrb-V5 Tg gene (OT1Tg KO). Notably, forced expression of αβTCR successfully restored the decreased percentage of iTCRβ+ DN4 cells in the KO mice, despite with little impact on the number of iTCRβ+ DN4 cells (Figure 5G–I). Importantly, developmental arrest at the DN3 stage in Zfp335-deficient mice was fully rescued by OT1 transgene (Figure 5J–L). Unfortunately, DN3 and DN4 cells from OT1Tg KO mice still exhibited a similar degree of apoptosis with Zfp335-deficient cells (Figure 5—figure supplement 4), suggesting Zfp335 affects thymocyte apoptosis in a TCR-independent manner. Consistently, the proportions of DN, DP, CD4, and CD8 were still comparable in KO and OT1Tg KO mice (Figure 5M, N; Figure 5—figure supplement 5), demonstrating that the aberrant DP development has not yet been restored by αβTCR overexpression.
Zfp335 directly targets Bcl6 and Rorc in DN thymocytes
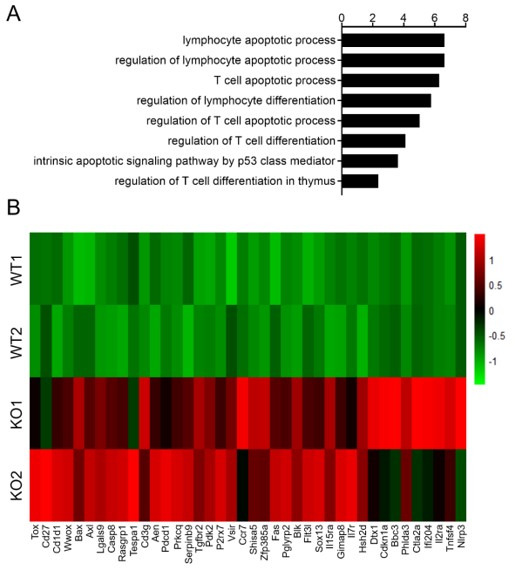
To address the underlying molecular mechanisms of Zfp335-mediated thymocyte development, we performed comprehensive RNA-seq analysis comparing DN4 cells from WT and KO mice. Volcano plot showed that Zfp335-deficient DN4 cells had a total 566 downregulated and 899 upregulated genes (fold change >1.25, p < 0.05) (Figure 6A, Supplementary file 1). Gene ontology (GO) analysis highlighted a large fraction of genes downregulated in KO group belonging to lymphocyte differentiation and apoptotic pathways (Figure 6B). Prominently downregulated genes associated with lymphocyte differentiation and apoptosis were summarized in the heatmap (Figure 6C). To further determine genes directly regulated by Zfp335, we analyzed Zfp335 by chromatin immunoprecipitation followed by deep sequencing (ChIP-seq). We screened a total of 2797 Zfp335-binding sites (Supplementary file 2) and the prevalence of binding peaks across genomic regions was displayed as a pie chart (Figure 6—figure supplement 1). To identify the Zfp335-targeting candidates, 119 profoundly downregulated genes were further selected out by a cutoff of twofold change, and 22 genes were overlapped with Zfp335-targeting genes from ChIP-seq data (Figure 6—figure supplement 2A, Supplementary file 3). Among these genes, top 10 genes were listed based upon their expression level from RNA-seq result (Figure 6—figure supplement 2B). qPCR analysis was performed to confirm their downregulation in KO DN4 cells (Figure 6—figure supplement 2C). Next, we focused on genes related to lymphocyte differentiation and apoptosis. In line with RNA-seq results (Figure 6C), qPCR analysis verified that Bcl6 and Rorc were significantly downregulated in KO DN4 cells (Figure 6D). Importantly, Zfp335 directly targeted the promoter regions of Bcl6 and Rorc in ChIP-seq analysis (Figure 6E), which were further verified by luciferase assay (Figure 6F). Taken together, in depth genomic analysis of DN thymocytes supports that Zfp335 directly regulates the transcription of Bcl6 and Rorc.
Figure 6. Zfp335 downstream target analysis in DN4 thymocytes.
(A) Volcano plot depicting log2 (fold change) (x-axis) and −log10 (p value) (y-axis) for differentially expressed genes (FC >1.25, p < 0.05) in DN4 thymocytes sorted from WT and KO mice; upregulated (red) and downregulated (blue). n = 2 per group. (B) Gene ontology (GO) analysis of genes that downregulated in Zfp335-deficient DN4 thymocytes, showing the GO terms related to lymphocyte differentiation and apoptosis (left), the number of genes overlapped with database from the indicated terms (middle left column), p values (middle column) and Q values (middle right column) and genes annotated to the indicated term (right). (C) Heatmap of representative genes related to lymphocyte differentiation and apoptosis. The scale ranges from minimum (green boxes) to medium (black boxes) to maximum (red boxes) relative expression. (D) The mRNA level of Bcl6 (top) and Rorc (bottom) in DN4 thymocytes from WT and KO mice (n = 3). (E) ChIP-seq analysis for binding of Zfp335 to the Bcl6 and Rorc loci in wild-type DN4 cells. (F) Luciferase assay for the binding of different domains of Zfp335 to the promoter regions of Bcl6 and Rorc. The pGL4.16 plasmid was transfected into 293T cells together with MSCV vector carrying different domains (n = 3). Data represent three independent experiments. *p < 0.05, **p < 0.01, and ****p < 0.0001.

Figure 6—figure supplement 1. ChIP-seq analysis of Zfp335-binding sites.

Figure 6—figure supplement 2. The intersection analysis of Zfp335 by RNA- and ChIP-seq.

Defects in thymocyte development caused by Zfp335 deficiency can be rescued by Bcl6 and Rorc
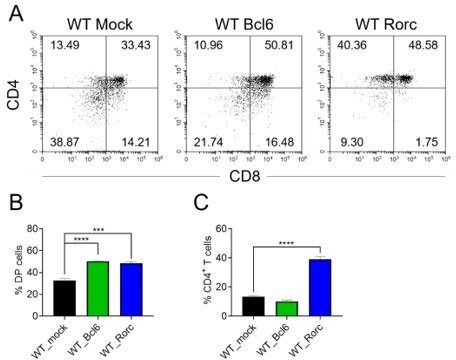
To determine whether Bcl6 and Rorc participate in the regulation of thymocyte development downstream of Zfp335, overexpression of Bcl6 and Rorc was conducted in vitro in the thymocyte development model (Figure 7A). DN3 cells from KO mice were cocultured with OP9-DL1 cells and transduced with retrovirus encoding Mock-GFP, Zfp335-GFP, Bcl6-GFP, or Rorc-GFP. After 3.5 days, overexpression of Bcl6 and Rorc resulted in a substantial DP generation, particularly in the Bcl6 group, resulting in a similar DP proportion to that in Zfp335-overexpressing cells (Figure 7B, C). Of note, overexpression of Psmg2, Dctn1, Ankle2, Cep76, Fgf13, and Ddx31 identified in the qPCR results (Figure 6—figure supplement 2B, C) in KO DN3 cells did not restore DP generation in vitro (Figure 7—figure supplement 1). Importantly, enhanced expression of Bcl6 in DN3 cells rescued DN thymocyte apoptosis (Figure 7D, E), while overexpression of both Bcl6 and Rorc rescued DP thymocytes from enhanced apoptosis (Figure 7F, G). p53, negatively regulated by Bcl6, is involved in lymphocyte apoptosis (Haks et al., 1999; Guidos et al., 1996; Mombaerts et al., 1995). Thus, we crossed Zfp335 KO strain with Trp53 KO strain to obtain double knockout mice, in which Trp53 deletion resulted in a partial recovery of DP percentage, but not cell number (Figure 7—figure supplement 2), further supporting the role of Bcl6 in Zfp335-controlled thymocyte survival. Together, these data demonstrate that Zfp335 controls DN thymocyte survival through direct regulation of Bcl6 and Rorc expression.
Figure 7. Identification of Bcl6 and Rorc as functional targets of Zfp335 for regulating thymocyte development.
(A) Schematic overview of the in vitro gene overexpression in KO DN3 thymocytes and following T-cell differentiation in OP9-DL1 coculture system. (B, C) Zfp335-deficient DN3 thymocytes (KO) were cultured with OP9-DL1 feeder cells in vitro, then transduced with either Mock, Zfp335-, Bcl6-, or Rorc-overexpressing vector for 3.5 days. The different stages of thymocyte development from GFP-positive cells were measured by flow cytometry (n = 3). (B) Representative FACS plots of DN and DP thymocytes from the indicated groups. (C) The percentage of DP thymocytes from GFP-positive cells. (D–G) KO DN3 thymocytes were cultured with OP9-DL1 feeder cells in vitro, then transduced with either Mock, Zfp335-, Bcl6-, or Rorc-overexpressing vector for 3.5 days. The expressions of Annexin V in DN and DP thymocytes were measured by flow cytometry (n = 3). (D) Representative FACS plots of Annexin V+ DN thymocytes from the indicated groups. (E) The percentage of Annexin V+ DN thymocytes from GFP-positive cells. (F) Representative FACS plots of Annexin V+ DP thymocytes from the indicated groups. (G) The percentage of Annexin V+ DP thymocytes from GFP-positive cells. Results shown represent three independent experiments. **p < 0.01, ***p < 0.001, and ****p < 0.0001.

Figure 7—figure supplement 1. Identification of the top 10 overlapped genes in KO DN3 thymocytes for the regulation of thymocyte development.

Figure 7—figure supplement 2. Examination of Trp53 as the target of Zfp335 during the regulation of thymocyte development.

Figure 7—figure supplement 3. Intracellular TCRβ (iTCRβ) expression in DN4 cells infected by Zfp335, Bcl6, and Rorc overexpression retrovirus.

Discussion
In this study, we reveal that Zfp335 is essential for thymocyte development, particularly during DN to DP transition. Zfp335 deficiency in T cells led to a significant loss of DP, CD4 SP, and CD8 SP cells while an accumulation of DN3 cells. Mechanistically, the developmental blockade is attributed to both impaired pre-TCR signal and increased susceptibility to apoptosis. Serving as a transcription factor, Zfp335 directly promotes Bcl6 and Rorc expression in DN thymocytes to ensure their survival during early development.
Zfp335 was previously demonstrated to be crucial for early embryonic development as homozygous deletion of this gene resulted in neonatal death (Garapaty et al., 2009). Conditional knockout of Zfp335 in neural system led to severely reduced cortical size and impaired neurogenesis. Mechanistically, Zfp335 was required for neural progenitor cell self-renewal and proliferation, and neuronal differentiation (Yang et al., 2012) and neuronal morphogenesis (Zhao et al., 2015). Besides, deficiency of naive T cells in mice carrying a hypomorph allele of Zfp335 (Zfp335bloto) uncovered its role in immune system (Han et al., 2014). So far, there is still very limited information about the functions of Zfp335 in other aspects of immune system. Here, we found that Zfp335 is absolutely required for multiple steps of early T-cell development. Of note, it will be worth investigating whether and how Zfp335 is involved in the regulation of mature T-cell differentiation and functions under static and immunized conditions in future.
We have shown that Zfp335 expression was upregulated specifically in DN3 thymocytes and significantly decreased in the subsequent stages, suggesting a critical role at the DN3 stage. Of note, loss of Zfp335 led to a dramatic reduction in both thymus size and thymocyte number. The accumulation of DN3 cells results from an intrinsic mechanism that hinders the transition from DN3 to DN4 stage, leading to the reduction of DP thymocytes and mature T cells in the periphery. These data are in line with another recent study reporting that Zfp335 mutation led to a reduction in peripheral T cells as a result of defective naive T cells and SP thymocytes (Han et al., 2014). However, given the intact thymic selection with Zfp335 mutation, the report was inconsistent with our observation of decreased β-selection with Zfp335 deficiency. The discrepancy is likely due to the different approaches used to disrupt Zfp335 function since a single-nucleotide missense mutation of Zfp335 may affect its function differently. Nevertheless, by knocking out the entire Zfp335 protein, we provide evidence that Zfp335 is indispensable for early thymocyte development.
Thymocyte β-selection is a critical developmental checkpoint allowing for the progression from DN3 to DN4 stage and the maintenance of DP cell numbers, which is primarily dependent on TCRβ and pre-TCR signals constituted with a functional iTCRβ paired with a pTα chain (Yamasaki and Saito, 2007). Pre-TCR signaling regulates thymocytes differentiation, proliferation, and survival in the full developmental process (Koch and Radtke, 2011). In addition, there are reports that other pathways or transcription factors coupled with or independent of conventional pre-TCR signaling are found to play important roles in the process (Ciofani et al., 2004; Pajerowski et al., 2009; Zikmund et al., 2019). While Zfp335-deficient DN4 cells exhibited no defects in the rearrangement of TCRβ chain genes and pTα gene expression, our results clearly demonstrated that Zfp335 deficiency markedly impaired iTCRβ expression and led to an unbiased reduction of the majority of Vβ genes in DN4 populations. Future studies will investigate the mechanisms how Zfp335 regulates iTCRβ expression. Importantly, forced iTCRβ expression in DN3 and DN4 cells by transduction of OT1-TCR completely rescued the developmental impairment during the DN3-DN4 transition in Zfp335-deficient mice despite the failure to rescue the DN3, DN4, and DP population size. This suggests that Zfp335 controls the DN3–DN4 transition dependent on pre-TCR signals, but other mechanisms may also regulate the DP population size.
The large population of DP thymocytes is maintained by both cell proliferation and survival mechanisms. Zfp335-deficient DN3 and DN4 cells showed slightly higher or unchanged incorporation of BrdU, suggesting that cell proliferation was not affected. However, our data revealed a significant increase in apoptosis in Zfp335-deficient DN3 and DN4 thymocytes. Transcriptomic analysis (RNA-seq and qPCR) unveiled the downregulation of Bcl6 and Rorc signaling which are critically involved in thymocyte apoptosis (Solanki et al., 2020; Xi et al., 2006). Indeed, we have demonstrated that Zfp335, a transcription factor, direct bound to the promoter regions of Bcl6 and Rorc genes. More importantly, enhanced expression of Bcl6 and Rorc could improve thymocyte survival and substantially restore the DP thymocyte population. Trp53 deletion resulted in a partial recovery of DP cells, further supporting the role of Bcl6 in Zfp335-controlled thymocyte survival. Of note, Zfp335 may also control thymocyte survival through directly regulating other targets.
In our study, Zfp335 is indispensable for thymocyte β-selection given that T-cell-specific deficiency in Zfp335 leads to impaired iTCRβ expression, blockade of thymocytes at DN stage as well as a substantial DN cell apoptosis. Though enhanced expression of TCRβ restores the developmental defect during DN3 to DN4 transition, it had little impact on the population size of DN3, DN4, and DP cells, suggesting the regulation of Zfp335 on DN cell apoptosis through mechanisms more than β-selection. Indeed, we provided the evidence that Zfp335-controlled DN cell survival through regulating Bcl6 and Rorc expression. Moreover, Zfp335 regulates TCRβ expression independent on Bcl6 and Rorc since overexpression of neither Bcl6 or Rorc in Zfp335-deficient DN3 thymocytes could restore the decreased iTCRβ expression (Figure 7—figure supplement 3).
Several key factors have been shown to involve in the regulation of T-cell developmental process from DN3 to DP stages. Notch signaling is required for early T-cell commitment and β-selection (Radtke et al., 2010; Ciofani and Zúñiga-Pflücker, 2005; Hosokawa and Rothenberg, 2018), which is subsequently weaken by Bcl6 repression for the differentiation from DN to DP stage development (Solanki et al., 2020). Consistently, our results found that Zfp335 could directly target Bcl6, and Zfp335 deficiency led to decreased expression of Bcl6 and upregulation of Notch target genes such as Dtx1 and Notch1 (data not shown), which collectively contributing to the developmental block from DN to DP stage. In addition, Tcf1 plays a vital role in T-cell lineage commitment since Tcf1−/− DN3 thymocytes failed to progress to DN4 and subsequent DP stage through regulating Bcl11b and Gata3 expression (Garcia-Perez et al., 2020). Bcl11b and Gata3 also differentially regulate the differentiation and survival of thymocytes at DN3, DN4, and subsequent ISP stages via TCR or/and survival signals (Inoue et al., 2006; Pai et al., 2003). However, we did not detect reduced expression of Tcf1, Bcl11b, or Gata3 in Zfp335-deficient DN4 cells, suggesting that Zfp335 regulates DN3 to DP thymocyte development independent on these molecules.
In conclusion, our study reveals that the C2H2 zinc finger protein Zfp335 plays a novel and crucial role during thymocyte development, specifically during the transition from DN to DP stage. Mechanistically, Zfp335 promotes Bcl6 and Rorc signaling to prevent thymocytes apoptosis and ensure the survival and differentiation of thymocytes. Collectively, we provide evidence that Zfp335 is essential for thymocyte development through both pre-TCR-dependent and -independent mechanisms.
Materials and methods
Key resources table.
| Reagent type (species) or resource | Designation | Source or reference | Identifiers | Additional information |
|---|---|---|---|---|
| Genetic reagent (M. musculus) | C57BL/6J background | Jackson Laboratory | Stock No. 000664 | |
| Genetic reagent (M. musculus) | C57BL/6-Zfp335tm1Caw | Jackson Laboratory | Stock No. 022413 | |
| Genetic reagent (M. musculus) | C57BL/6-Tg(TcraTcrb)1,100Mjb/J | Jackson Laboratory | Stock No. 003831 | Common Name: OT-1 |
| Genetic reagent (M. musculus) | B6.Cg-Tg(Lck-cre)548Jxm/J | Jackson Laboratory | Stock No. 003802 | |
| Genetic reagent (M. musculus) | C3Ou.129S2(B6)-Trp53tm1Tyj/J | Jackson Laboratory | Stock No. 002547 | |
| Antibody | anti-mouse CD4 APC/Cyanine7 (Rat monoclonal) | Biolegend | Cat# 100414; RRID:AB_312699 | cell surface staining 1:400 |
| Antibody | anti-mouse CD8a PE (Rat monoclonal) | Biolegend | Cat# 100708; RRID:AB_312747 | cell surface staining 1:400 |
| Antibody | anti-mouse CD8a Pacific Blue (Rat monoclonal) | Biolegend | Cat# 100725; RRID:AB_493425 | cell surface staining 1:400 |
| Antibody | anti-mouse CD8a PE/Cyanine7 (Rat monoclonal) | Biolegend | Cat# 100722; RRID:AB_312761 | cell surface staining 1:400 |
| Antibody | anti-mouse TCR Vβ5.1, 5.2 PE (Mouse monoclonal) | Biolegend | Cat# 139504, RRID:AB_10613279 | cell surface staining 1:400 |
| Antibody | anti-mouse TCR Vβ6 PE (Rat monoclonal) | Biolegend | Cat# 140004; RRID:AB_10643583 | cell surface staining 1:400 |
| Antibody | anti-mouse TCR Vβ8.1, 8.2 PE (Mouse monoclonal) | Biolegend | Cat# 140104; RRID:AB_10639942 | cell surface staining 1:400 |
| Antibody | anti-mouse TCR Vβ12 PE (Mouse monoclonal) | Biolegend | Cat# 139704; RRID:AB_10639729 | cell surface staining 1:400 |
| Antibody | anti-mouse TCR β chain APC/Cyanine7 (Armenian Hamster monoclonal) | Biolegend | Cat# 109220; RRID:AB_893624 | cell surface staining 1:400 |
| Antibody | anti-mouse TCR β chain PE/Cyanine5 (Armenian Hamster monoclonal) | Biolegend | Cat# 109210; RRID:AB_313433 | cell surface staining 1:400 |
| Antibody | anti-mouse TCR β chain PE/Cyanine7 (Armenian Hamster monoclonal) | Biolegend | Cat# 109222; RRID:AB_893625 | cell surface staining 1:400 |
| Antibody | anti-mouse TCR γ/δ FITC (Armenian Hamster monoclonal) | Biolegend | Cat# 118106; RRID:AB_313830 | cell surface staining 1:400 |
| Antibody | anti-mouse TCR γ/δ PerCP/Cyaninne5.5 (Armenian Hamster monoclonal) | Biolegend | Cat# 118118; RRID:AB_10612756 | cell surface staining 1:400 |
| Antibody | anti-mouse TCR γ/δ APC (Armenian Hamster monoclonal) | Biolegend | Cat# 118116; RRID:AB_1731813 | cell surface staining 1:400 |
| Antibody | anti-mouse/human CD44 PE/Cyanine7 (Rat monoclonal) | Biolegend | Cat# 103030; RRID:AB_830787 | cell surface staining 1:400 |
| Antibody | anti-mouse CD25 PE (Rat monoclonal) | Biolegend | Cat# 102008; RRID:AB_312857 | cell surface staining 1:400 |
| Antibody | anti-mouse CD25 PE/Cyanine5 (Rat monoclonal) | Biolegend | Cat# 102010; RRID:AB_312859 | cell surface staining 1:400 |
| Antibody | anti-mouse CD4 FITC (Rat monoclonal) | Biolegend | Cat# 100510; RRID:AB_312713 | cell surface staining 1:400 |
| Antibody | anti-mouse CD8a FITC (Rat monoclonal) | Biolegend | Cat# 100706; RRID:AB_312745 | cell surface staining 1:400 |
| Antibody | anti-mouse TCR β chain FITC (Armenian Hamster monoclonal) | Biolegend | Cat# 109206; RRID:AB_313429 | cell surface staining 1:400 |
| Antibody | anti-mouse NK-1.1 FITC (Mouse monoclonal) | Biolegend | Cat# 108706; RRID:AB_313393 | cell surface staining 1:400 |
| Antibody | anti-mouse CD19 FITC (Rat monoclonal) | Biolegend | Cat# 115506; RRID:AB_313641 | cell surface staining 1:400 |
| Antibody | anti-mouse CD11b FITC (Rat monoclonal) | Biolegend | Cat# 101206; RRID:AB_312789 | cell surface staining 1:400 |
| Antibody | anti-mouse CD11c FITC (Armenian Hamster monoclonal) | Biolegend | Cat# 117306; RRID:AB_313775 | cell surface staining 1:400 |
| Antibody | anti-mouse TER-119/Erythroid Cells FITC (Rat monoclonal) | Biolegend | Cat# 116206; RRID:AB_313707 | |
| Antibody | anti-mouse TCR β chain Pacific Blue (Armenian Hamster monoclonal) | Biolegend | Cat# 109226; RRID:AB_1027649 | |
| Antibody | anti-mouse CD45.1 APC/Cy7 (Mouse monoclonal) | Biolegend | Cat# 110716; RRID:AB_313505 | cell surface staining 1:400 |
| Antibody | anti-mouse CD45.2 PE (Mouse monoclonal) | Biolegend | Cat# 109808; RRID:AB_313445 | |
| Antibody | anti-mouse CD45.2 APC (Mouse monoclonal) | Biolegend | Cat# 109814; RRID:AB_389211 | |
| Antibody | anti-mouse CD3 Pacific Blue (Armenian Hamster monoclonal) | Biolegend | Cat# 640918; RRID:AB_493645 | |
| Antibody | anti-mouse CD27 FITC (Armenian Hamster monoclonal) | Biolegend | Cat# 124208; RRID:AB_1236466 | |
| Antibody | anti-BrdU FITC (Mouse monoclonal) | Biolegend | Cat# 364104; RRID:AB_2564481 | |
| Antibody | anti-BrdU FITC (3D4) | Biolegend | Cat# 364104; RRID:AB_2564481 | |
| Antibody | anti-mouse Ki-67 PE (16A8) | Biolegend | Cat# 652404; RRID:AB_2561525 | |
| Antibody | Anti-Zfp335 antibody | Novus | Cat# NB100-2579 | |
| Peptide, recombinant protein | Annexin V Pacific Blue | Biolegend | Cat# 640918; RRID:AB_1279044 | |
| Peptide, recombinant protein | DNaseI | Solarbio | Cat# D8071 | |
| Commercial assay or kit | Fixation Buffer | Biolegend | Cat# 420,801 | |
| Commercial assay or kit | Intracellular Staining Permeabilization Wash Buffer (10×) | Biolegend | Cat# 421,002 | |
| Commercial assay or kit | MojoSort Streptavidin Nanobeads | Biolegend | Cat# 480,016 | |
| Commercial assay or kit | Fixation/Permeabilization Solution Kit with BD GolgiPlug | BD biosciences | Cat# 555,028 | |
| Commercial assay or kit | One-Day Chromatin Immunoprecipitation Kits | MILLIPORE | Cat# 17-10085 | |
| Commercial assay or kit | Quick-RNA MicroPrep Kit | QIAGEN | Cat# R1051 | |
| Commercial assay or kit | Fixation Buffer | Biolegend | Cat# 420,801 | |
| Software, algorithm | FlowJo software v10.7 | FlowJo LLC | https://www.flowjo.com/; RRID:SCR_008520 | |
| Software, algorithm | GSEA | Broad Institute | https://www.broadinstitute.org/gsea; RRID:SCR_003199 | |
| Software, algorithm | Prism8 (v8.1.0) | GraphPad Software | https://www.graphpad.com/ | |
| Software, algorithm | RStudio | RStudio | https://rstudio.com/; RRID: SCR_000432 | |
Mice
Zfp335f/f, LckCre, Trp53DKO, and OT-1 strains were purchased from The Jackson Laboratory (Bar Harbor, ME, USA). LckCre mice were crossed with Zfp335f/f mice to generate LckCre+Zfp335f/f (KO) mice and LckCre+Zfp335+/+ (WT) mice. Mice aged 6–8 weeks were used for analyses in the study. All mice were housed in specific-pathogen-free conditions by the Xi’an Jiaotong University Division of Laboratory Animal Research. All animal procedures were approved by the Institutional Animal Care and Use Committee of Xi’an Jiaotong University.
Antibodies and reagents
The following antibodies and kits were purchased from Biolegend (San Diego, CA, USA): APC/Cy7 anti-CD4 (clone GK1.5), PE anti-CD8α (clone 53–6.7), Pacific Blue anti-CD8α (clone 53–6.7), PE/Cyanine7 anti-CD8α (clone 53–6.7), PE anti-TCRVβ5.1, 5.2 (clone MR9-4), PE anti-TCRVβ6 (clone RR4-7), PE anti-TCRVβ8.1, 8.2 (clone MR5-2), PE anti-TCRVβ12 (clone MR11-1), APC/Cyanine7 anti-TCRβ (clone H57-597), PE/Cyanine5 anti-TCRβ (clone H57-597), PE/Cy7 anti-TCRβ (clone H57-597), FITC anti-TCRγδ (clone GL3), PE/Cyanine5 anti-TCRγδ (clone GL3), APC anti-TCRγδ (clone GL3), PE/Cy7 anti-CD44 (clone IM7), PE anti-CD25 (clone PC61), PE/Cyanine5 anti-CD25 (clone PC61), FITC anti-CD4 (clone GK1.5), FITC anti-CD8 (clone 53-6.7), FITC anti-TCRβ (clone H57-597), FITC anti-NK1.1 (clone PK136), FITC anti-CD19 (clone 6D5), FITC anti-CD11b (clone M1/70), FITC anti-CD11c (clone N418), FITC anti-TER-119/Erythroid Cells (TER-119), Pacific Blue anti-TCRβ (clone H57-597), APC/Cy7 anti-CD45.1 (clone A20), PE anti-CD45.2 (clone 104), APC anti-CD45.2 (clone 104), Pacific Blue anti-Annexin V (Cat # 640918), Pacific Blue anti-CD3 (clone 17A2), FITC anti-CD27 (clone LG.3A10), FITC anti-BrdU (clone Bu20a), and the Fixation/Permeabilization Solution Kit (Cat # 554722). PE anti-Ki67 monoclonal antibody (clone SolA15) was purchased from eBioscience (San Diego, CA, USA). Quick-RNA Microprep Kit (Cat # R1051) was obtained from Zymo Research (Irvine, CA, USA).
FACS analysis and Sorting
Lymphocytes from LckCre+Zfp335+/+ and LckCre+Zfp335fl/fl mice were isolated. For surface staining, single cell suspension was prepared. A total of 1 × 10⁶ cells were stained in the dark at 4℃ for 30 min with indicated antibodies. The analysis was performed on a CytoFLEX flow cytometer (Beckman Coulter; Brea, CA, USA). DN3 (Lin−CD25+CD44−) and DN4 (Lin−CD25−CD44−) cells were collected by BD FACSAria Ⅱ cell sorter (BD Biosciences, San Jose, CA, USA). FACS data were recorded and analysed using CytExpert software (Version 2.3.0.84; Beckman Coulter; Indianapolis, IN, USA).
Intracellular staining
DN and DP thymocytes were phenotyped using a combination of surface antibodies against lineage markers (CD4, CD8α, TCRβ, TCRγδ, NK1.1, CD19, CD11b, CD11c, and Ter119), together with CD44 and CD25 antibodies. For intracellular cytokine staining, the thymocytes were fixed and permeabilized using a Fixation/Permeabilization Solution Kit (Biolegend), followed by staining using indicated antibodies. The cells were analyzed on a CytoFLEX flow cytometer (Beckman Coulter).
Quantitative RT-PCR
Cell lysis was performed with RNA extraction and cDNA synthesis using Quick-RNA Microprep Kit (Zymo Research) and ReverTra Ace qPCR RT Master Mix Kit (TOYOBO), respectively. The qRT-PCR reactions were carried out using StepOnePlus Real-Time PCR Systems (ABI) with SYBR mixture (Genstar) to determine relative gene expression. The sequences for the primers are list in Supplementary file 4.
Bone marrow transplantation
Lineage-negative BM cells from CD45.1+ mice and LckCre+Zfp335fl/fl mice (CD45.2+) were sorted, and mixed at a 1:4 ratio and cotransferred into lethally irradiated (8.5 Gy) recipient mice (CD45.1+CD45.2+). Six weeks after bone marrow transplantation, thymocytes from recipient mice were harvested for FACS analysis.
In vitro OP9-DL1 cell coculture
Both Lin−CD25+CD44− DN3 cells and Lin−CD25−CD44− DN4 cells were sorted from the thymi of LckCre+Zfp335+/+ and LckCre+Zfp335fl/fl mice and cocultured with OP9-DL1 feeder cells in α-MEM medium in the presence of IL-7 (1 ng/ml, PeproTech) and Flt3-L (5 ng/ml, PeproTech). On days 2 and 4, total cells were collected and stained with indicated antibodies for FACS analysis.
Retroviral transduction of DN3 thymocytes
Retroviruses were produced from BOSC cells transfected with Mock-GFP, Zfp335-GFP, Bcl6-GFP, and Rorc-GFP retroviral plasmids. For retroviral transduction, Lin−CD25+CD44− DN3 thymocytes were sorted by FACSAria flow cytometry (BD) and cocultured with OP9-DL1 feeder cells overnight in the presence of 1 ng/ml IL-7 and 5 ng/ml Flt3L. Retroviral infection was performed 16 hr later by centrifugation (2500 rpm for 90 min at 37°C) in the presence of retroviral supernatants and 8 µg/ml polybrene. After spinning, supernatants were replaced by α-MEM medium with 10% FCS supplemented with 1 ng/ml IL-7 and 5 ng/ml Flt3L. 3.5 days later, GFP+ cells were examined using flow cytometry analysis.
Luciferase assay
To assess whether Zfp335 regulates Bcl6 and Rorc by directly binding to their promoter regions, the DNA fragments were cloned into the pGL4.16 (luc2CP/Hgro) vector (Promega) which contains the luciferase reporter gene luc2CP. The pGL4.16 plasmid, control vector pGL4.74 (hRluc/TK) encoding the luciferase reporter gene hRluc (Renilla reniformis), along with plasmids expressing candidate genes were transfected separately into 293T cell line (ATCC). Forty-eight hours post-transfection, the luciferase activity of both Firefly and Renilla luciferase was measured using a Dual-Luciferase Reporter kit (Promega) on SYNERGY Neo2 multimode reader (BioTek).
RNA-seq library preparation and sequencing
Lin−CD25−CD44− DN4 cells were sorted from the thymi of LckCre+Zfp335+/+ and LckCre+Zfp335fl/fl mice. The DN4 cell numbers in each group were as followed: WT1, 8 × 10⁵ cells pulled from 4 mice; WT2, 9 × 10⁵ cells from 5 mice; KO1, 6.7 × 10⁵ cells from 13 mice; KO2, 7 × 10⁵ cells from 15 mice. RNA isolation was performed using the RNeasy Mini Kit (Qiagen) according to the manufacturer’s protocol. RNA quality and quantity were detected by the Qubit RNA broad range assay in the Qubit Fluorometer (Invitrogen). After quality control using RNase-free agarose gel and Agilent 2100 (Agilent Technologies, Palo Alto, CA, USA), RNA-seq libraries were prepared by using 200 ng total RNA with TruSeq RNA sample prep kit (Illumina). Oligo(dT)-enriched mRNAs were fragmented randomly with fragmentation buffer, followed by first- and second-strand cDNA synthesis. After a series of terminal repair, the double-stranded cDNA library was obtained through PCR enrichment and size selection. cDNA libraries were sequenced with the Illumina Hiseq 2000 sequencer (Illumina HiSeq 2000 v4 Single-Read 50 bp) after pooling according to its expected data volume and effective concentration.
Two biological replicates were performed in the RNA-seq analysis. Raw reads were then aligned to the mouse genome (GRCm38) using Tophat2 RNA-seq alignment software, and unique reads were retained to quantify gene expression counts from Tophat2 alignment files. Data were analyzed and preprocessed in the R environment. Differential expression analysis was performed using R package DESeq2 (adjusted p value < 0.05 and fold change >1.25). Heat maps and volcano plots were visualized using the R package.
ChIP-seq library preparation and sequencing
Both Lin−CD25+CD44− DN3 cells and Lin−CD25−CD44− DN4 cells were sorted from the thymi of 100 WT mice by FACSAria flow cytometry (BD). Anti-Zfp335 antibody (Novus) and Millipore 17-10,085 ChIP kit were used in the ChIP assay. Immunoprecipitated DNA was used for Illumina ChIP-seq sample preparation. In brief, 5 × 10⁷ cells were crosslinked to chromatin with 1% formaldehyde. Reaction was stopped with 0.125 M glycine. Cells were then resuspended in cold nuclear lysis buffer and sonicated to obtain DNA with ~300–500 bp size, followed by precipitation by incubation with immunoprecipitation-grade anti-Zfp335 antibody and Magnetic Protein A/G Beads overnight. The following day, beads were sequentially washed by low-salt, high-salt, LiCl, and TE buffers. Bound complexes were eluted in 150 μl of elution buffer at 62°C for 2 hr with shaking, followed by reversal of formaldehyde crosslinking at 95°C for 10 min. DNA was eventually purified with spin columns.
The concentration of immunoprecipitated DNA was detected by the Qubit DNA broad range assay in the Qubit Fluorometer (Invitrogen). 10 ng immunoprecipitated DNA was prepared for sequencing using the Illumina ChIP-seq sample preparation protocol. Blunt-end DNA fragments were ligated to Illumina adaptors, amplified, and sequenced using the SE150 model. Raw reads were filtered firstly to remove low-quality or adaptor sequences by SOAPnuke (version 1.5.6). Clean reads were mapped to the reference genome of GRCm39 with SOAPaligner/soap2 (version 2.21t) using default settings. The MACS2 software (Version 2.1.1) was used to process peak calling. MACS (Model-based Analysis of ChIP-Seq) is a commonly used computational method which is designed to identify peaks from ChIP-seq data. MACS assigns every candidate region an enrichment p value, and targeted genes are identified as final peaks passing the threshold p value < 1e−5 (Feng et al., 2012; Feng et al., 2011). The different enrichment peaks from different samples were plotted by MAnorm (version 1.1). Genomic graphs were generated and viewed with the IGV (Integrative Genomics Viewer).
Statistical analysis
Data were presented as mean ± standard error of the mean. Statistical analyses were applied to biologically independent mice or technical replicates for each experiment which was independently repeated at least three times. Two-tailed Student’s t-test was used for all statistical calculations using GraphPad Prism seven software. All bar graphs include means with error bars to show the distribution of the data. The level of significance is indicated as follows: *p < 0.05, **p < 0.01, ***p < 0.001, and ****p < 0.0001.
Acknowledgements
We thank Drs. Xiaofei Wang and Guohua Zhang for Flow cytometry analysis and cell sorting. We also thank the Mouse Facility of Xi’an Jiaotong University.
Funding Statement
The funders had no role in study design, data collection, and interpretation, or the decision to submit the work for publication.
Contributor Information
Baojun Zhang, Email: bj.zhang@mail.xjtu.edu.cn.
Sarah Russell, Peter MacCallum Cancer Centre, Australia.
Tadatsugu Taniguchi, Institute of Industrial Science, The University of Tokyo, Japan.
Funding Information
This paper was supported by the following grants:
National Natural Science Foundation of China 3217080356 to Baojun Zhang.
National Natural Science Foundation of China 81771673 to Baojun Zhang.
Major International Joint Research Programme 81820108017 to Baojun Zhang.
Additional information
Competing interests
No competing interests declared.
No competing interests declared.
Author contributions
Formal analysis, Investigation, Validation, Visualization, Writing – original draft, Writing – review and editing.
Investigation, Writing – original draft.
Investigation, Validation, Writing – original draft, Writing – review and editing.
Investigation, Validation, Writing – original draft.
Investigation.
Investigation.
Investigation.
Formal analysis, Software.
Investigation.
Investigation.
Investigation.
Conceptualization, Funding acquisition, Project administration, Supervision, Visualization, Writing – original draft, Writing – review and editing.
Ethics
All mice were housed in specific-pathogen-free conditions by the Xi'an Jiaotong University Division of Laboratory Animal Research. All animal procedures were approved by the Institutional Animal Care and Use Committee of Xi'an Jiaotong University (2017-1012).
Additional files
Data availability
The sequencing data presented in this paper are available for download on GEO data repository with accession numbers GSE184532 and GSE184705. Source data files have been provided for relevant figures.
The following datasets were generated:
Wang X, Jiao AJ, Sun LN, Wh LI, Yang B, Yh SU, Ding RY, Zhang CG, Liu HY, Yang XF, Sun CM, Zhang BJ. 2021. Zinc finger protein Zfp335 controls thymocyte differentiation and survival through b-selection-dependent and -independent mechanisms. NCBI Gene Expression Omnibus. GSE184532
Wang X, Jiao AJ, Sun LN, Wh LI, Yang B, Yh SU, Ding RY, Zhang CG, Liu HY, Yang XF, Sun CM, Zhang BJ. 2021. Zinc finger protein Zfp335 controls thymocyte differentiation and survival through b-selection-dependent and -independent mechanisms. NCBI Gene Expression Omnibus. GSE184705
References
- Aifantis I, Buer J, von Boehmer H, Azogui O. Essential role of the pre-T cell receptor in allelic exclusion of the T cell receptor beta locus. Immunity. 1997;7:601–607. doi: 10.1016/s1074-7613(00)80381-7. [DOI] [PubMed] [Google Scholar]
- Albu DI, Feng D, Bhattacharya D, Jenkins NA, Copeland NG, Liu P, Avram D. BCL11B is required for positive selection and survival of double-positive thymocytes. The Journal of Experimental Medicine. 2007;204:3003–3015. doi: 10.1084/jem.20070863. [DOI] [PMC free article] [PubMed] [Google Scholar]
- Belle I, Zhuang Y. E proteins in lymphocyte development and lymphoid diseases. Current Topics in Developmental Biology. 2014;110:153–187. doi: 10.1016/B978-0-12-405943-6.00004-X. [DOI] [PMC free article] [PubMed] [Google Scholar]
- Berga-Bolaños R, Alberdi M, Buxadé M, Aramburu J, López-Rodríguez C. NFAT5 induction by the pre-T-cell receptor serves as a selective survival signal in T-lymphocyte development. PNAS. 2013;110:16091–16096. doi: 10.1073/pnas.1215934110. [DOI] [PMC free article] [PubMed] [Google Scholar]
- Ciofani M, Schmitt TM, Ciofani A, Michie AM, Cuburu N, Aublin A, Maryanski JL, Zúñiga-Pflücker JC. Obligatory role for cooperative signaling by pre-TCR and Notch during thymocyte differentiation. Journal of Immunology (Baltimore, Md. 2004;172:5230–5239. doi: 10.4049/jimmunol.172.9.5230. [DOI] [PubMed] [Google Scholar]
- Ciofani M, Zúñiga-Pflücker JC. Notch promotes survival of pre–T cells at the β-selection checkpoint by regulating cellular metabolism. Nature Immunology. 2005;6:881–888. doi: 10.1038/ni1234. [DOI] [PubMed] [Google Scholar]
- Dudley EC, Petrie HT, Shah LM, Owen MJ, Hayday AC. T cell receptor beta chain gene rearrangement and selection during thymocyte development in adult mice. Immunity. 1994;1:83–93. doi: 10.1016/1074-7613(94)90102-3. [DOI] [PubMed] [Google Scholar]
- Emerson RO, Thomas JH. Adaptive evolution in zinc finger transcription factors. PLOS Genetics. 2009;5:e1000325. doi: 10.1371/journal.pgen.1000325. [DOI] [PMC free article] [PubMed] [Google Scholar]
- Eyquem S, Chemin K, Fasseu M, Bories JC. The Ets-1 transcription factor is required for complete pre-T cell receptor function and allelic exclusion at the T cell receptor beta locus. PNAS. 2004;101:15712–15717. doi: 10.1073/pnas.0405546101. [DOI] [PMC free article] [PubMed] [Google Scholar]
- Fehling HJ, Krotkova A, Saint-Ruf C, von Boehmer H. Crucial role of the pre-T-cell receptor alpha gene in development of alpha beta but not gamma delta T cells. Nature. 1995;375:795–798. doi: 10.1038/375795a0. [DOI] [PubMed] [Google Scholar]
- Feng J, Liu T, Zhang Y. Using MACS to identify peaks from ChIP-Seq data. Current Protocols in Bioinformatics. 2011;Chapter 2:Unit. doi: 10.1002/0471250953.bi0214s34. [DOI] [PMC free article] [PubMed] [Google Scholar]
- Feng J, Liu T, Qin B, Zhang Y, Liu XS. Identifying ChIP-seq enrichment using MACS. Nature Protocols. 2012;7:1728–1740. doi: 10.1038/nprot.2012.101. [DOI] [PMC free article] [PubMed] [Google Scholar]
- Garapaty S, Xu C-F, Trojer P, Mahajan MA, Neubert TA, Samuels HH. Identification and characterization of a novel nuclear protein complex involved in nuclear hormone receptor-mediated gene regulation. The Journal of Biological Chemistry. 2009;284:7542–7552. doi: 10.1074/jbc.M805872200. [DOI] [PMC free article] [PubMed] [Google Scholar]
- Garcia-Perez L, Famili F, Cordes M, Brugman M, van Eggermond M, Wu H, Chouaref J, Granado DSL, Tiemessen MM, Pike-Overzet K, Daxinger L, Staal FJT. Functional definition of a transcription factor hierarchy regulating T cell lineage commitment. Science Advances. 2020;6:eaaw7313. doi: 10.1126/sciadv.aaw7313. [DOI] [PMC free article] [PubMed] [Google Scholar]
- Godfrey DI, Kennedy J, Suda T, Zlotnik A. A developmental pathway involving four phenotypically and functionally distinct subsets of CD3-CD4-CD8- triple-negative adult mouse thymocytes defined by CD44 and CD25 expression. Journal of Immunology (Baltimore, Md. 1993;150:4244–4252. [PubMed] [Google Scholar]
- Guidos CJ, Williams CJ, Grandal I, Knowles G, Huang MT, Danska JS. V(D)J recombination activates a p53-dependent DNA damage checkpoint in scid lymphocyte precursors. Genes & Development. 1996;10:2038–2054. doi: 10.1101/gad.10.16.2038. [DOI] [PubMed] [Google Scholar]
- Haks MC, Krimpenfort P, van den Brakel JH, Kruisbeek AM. Pre-TCR signaling and inactivation of p53 induces crucial cell survival pathways in pre-T cells. Immunity. 1999;11:91–101. doi: 10.1016/s1074-7613(00)80084-9. [DOI] [PubMed] [Google Scholar]
- Han BY, Wu S, Foo CS, Horton RM, Jenne CN, Watson SR, Whittle B, Goodnow CC, Cyster JG. Zinc finger protein Zfp335 is required for the formation of the naïve T cell compartment. eLife. 2014;3:3549. doi: 10.7554/eLife.03549. [DOI] [PMC free article] [PubMed] [Google Scholar]
- Han BY, Foo CS, Wu S, Cyster JG. The C2H2-ZF transcription factor Zfp335 recognizes two consensus motifs using separate zinc finger arrays. Genes & Development. 2016;30:1509–1514. doi: 10.1101/gad.279406.116. [DOI] [PMC free article] [PubMed] [Google Scholar]
- Heizmann B, Kastner P, Chan S. The Ikaros family in lymphocyte development. Current Opinion in Immunology. 2018;51:14–23. doi: 10.1016/j.coi.2017.11.005. [DOI] [PubMed] [Google Scholar]
- Hoffman ES, Passoni L, Crompton T, Leu TM, Schatz DG, Koff A, Owen MJ, Hayday AC. Productive T-cell receptor beta-chain gene rearrangement: coincident regulation of cell cycle and clonality during development in vivo. Genes & Development. 1996;10:948–962. doi: 10.1101/gad.10.8.948. [DOI] [PubMed] [Google Scholar]
- Hosokawa H, Rothenberg EV. Cytokines, Transcription Factors, and the Initiation of T-Cell Development. Cold Spring Harbor Perspectives in Biology. 2018;10:a028621. doi: 10.1101/cshperspect.a028621. [DOI] [PMC free article] [PubMed] [Google Scholar]
- Hosokawa H, Rothenberg EV. How transcription factors drive choice of the T cell fate. Nature Reviews. Immunology. 2021;21:162–176. doi: 10.1038/s41577-020-00426-6. [DOI] [PMC free article] [PubMed] [Google Scholar]
- Ikawa T, Kawamoto H, Goldrath AW, Murre C. E proteins and Notch signaling cooperate to promote T cell lineage specification and commitment. The Journal of Experimental Medicine. 2006;203:1329–1342. doi: 10.1084/jem.20060268. [DOI] [PMC free article] [PubMed] [Google Scholar]
- Ikawa T, Hirose S, Masuda K, Kakugawa K, Satoh R, Shibano-Satoh A, Kominami R, Katsura Y, Kawamoto H. An essential developmental checkpoint for production of the T cell lineage. Science (New York, N.Y.) 2010;329:93–96. doi: 10.1126/science.1188995. [DOI] [PubMed] [Google Scholar]
- Inoue J, Kanefuji T, Okazuka K, Watanabe H, Mishima Y, Kominami R. Expression of TCR alpha beta partly rescues developmental arrest and apoptosis of alpha beta T cells in Bcl11b-/- mice. Journal of Immunology (Baltimore, Md. 2006;176:5871–5879. doi: 10.4049/jimmunol.176.10.5871. [DOI] [PubMed] [Google Scholar]
- Koch U, Radtke F. Mechanisms of T cell development and transformation. Annual Review of Cell and Developmental Biology. 2011;27:539–562. doi: 10.1146/annurev-cellbio-092910-154008. [DOI] [PubMed] [Google Scholar]
- Kondo T, Morita R, Okuzono Y, Nakatsukasa H, Sekiya T, Chikuma S, Shichita T, Kanamori M, Kubo M, Koga K, Miyazaki T, Kassai Y, Yoshimura A. Notch-mediated conversion of activated T cells into stem cell memory-like T cells for adoptive immunotherapy. Nature Communications. 2017;8:15338. doi: 10.1038/ncomms15338. [DOI] [PMC free article] [PubMed] [Google Scholar]
- Kreslavsky T, Gleimer M, Miyazaki M, Choi Y, Gagnon E, Murre C, Sicinski P, von Boehmer H. β-Selection-induced proliferation is required for αβ T cell differentiation. Immunity. 2012;37:840–853. doi: 10.1016/j.immuni.2012.08.020. [DOI] [PMC free article] [PubMed] [Google Scholar]
- Kruisbeek AM, Haks MC, Carleton M, Michie AM, Zúñiga-Pflücker JC, Wiest DL. Branching out to gain control: how the pre-TCR is linked to multiple functions. Immunology Today. 2000;21:637–644. doi: 10.1016/s0167-5699(00)01744-8. [DOI] [PubMed] [Google Scholar]
- Kurd N, Robey EA. T-cell selection in the thymus: a spatial and temporal perspective. Immunological Reviews. 2016;271:114–126. doi: 10.1111/imr.12398. [DOI] [PMC free article] [PubMed] [Google Scholar]
- Li L., Leid M, Rothenberg EV. An early T cell lineage commitment checkpoint dependent on the transcription factor Bcl11b. Science (New York, N.Y.) 2010;329:89–93. doi: 10.1126/science.1188989. [DOI] [PMC free article] [PubMed] [Google Scholar]
- Li Long, Zhang JA, Dose M, Kueh HY, Mosadeghi R, Gounari F, Rothenberg EV. A far downstream enhancer for murine Bcl11b controls its T-cell specific expression. Blood. 2013;122:902–911. doi: 10.1182/blood-2012-08-447839. [DOI] [PMC free article] [PubMed] [Google Scholar]
- Liu C, Lan Y, Liu B, Zhang H, Hu H. T Cell Development: Old Tales Retold By Single-Cell RNA Sequencing. Trends in Immunology. 2021;42:165–175. doi: 10.1016/j.it.2020.12.004. [DOI] [PubMed] [Google Scholar]
- López-Rodríguez C, Aramburu J, Berga-Bolaños R. Transcription factors and target genes of pre-TCR signaling. Cellular and Molecular Life Sciences. 2015;72:2305–2321. doi: 10.1007/s00018-015-1864-8. [DOI] [PMC free article] [PubMed] [Google Scholar]
- Mahajan MA, Murray A, Samuels HH. NRC-interacting factor 1 is a novel cotransducer that interacts with and regulates the activity of the nuclear hormone receptor coactivator NRC. Molecular and Cellular Biology. 2002;22:6883–6894. doi: 10.1128/MCB.22.19.6883-6894.2002. [DOI] [PMC free article] [PubMed] [Google Scholar]
- Malissen M, Gillet A, Ardouin L, Bouvier G, Trucy J, Ferrier P, Vivier E, Malissen B. Altered T cell development in mice with a targeted mutation of the CD3-epsilon gene. The EMBO Journal. 1995;14:4641–4653. doi: 10.1002/j.1460-2075.1995.tb00146.x. [DOI] [PMC free article] [PubMed] [Google Scholar]
- Malissen B, Ardouin L, Lin SY, Gillet A, Malissen M. Function of the CD3 subunits of the pre-TCR and TCR complexes during T cell development. Advances in Immunology. 1999;72:103–148. doi: 10.1016/s0065-2776(08)60018-8. [DOI] [PubMed] [Google Scholar]
- Mombaerts P, Clarke AR, Rudnicki MA, Iacomini J, Itohara S, Lafaille JJ, Wang L, Ichikawa Y, Jaenisch R, Hooper ML. Mutations in T-cell antigen receptor genes alpha and beta block thymocyte development at different stages. Nature. 1992a;360:225–231. doi: 10.1038/360225a0. [DOI] [PubMed] [Google Scholar]
- Mombaerts P, Iacomini J, Johnson RS, Herrup K, Tonegawa S, Papaioannou VE. RAG-1-deficient mice have no mature B and T lymphocytes. Cell. 1992b;68:869–877. doi: 10.1016/0092-8674(92)90030-g. [DOI] [PubMed] [Google Scholar]
- Mombaerts P, Terhorst C, Jacks T, Tonegawa S, Sancho J. Characterization of immature thymocyte lines derived from T-cell receptor or recombination activating gene 1 and p53 double mutant mice. PNAS. 1995;92:7420–7424. doi: 10.1073/pnas.92.16.7420. [DOI] [PMC free article] [PubMed] [Google Scholar]
- Pai S-Y, Truitt ML, Ting C-N, Leiden JM, Glimcher LH, Ho I-C. Critical roles for transcription factor GATA-3 in thymocyte development. Immunity. 2003;19:863–875. doi: 10.1016/s1074-7613(03)00328-5. [DOI] [PubMed] [Google Scholar]
- Pajerowski AG, Nguyen C, Aghajanian H, Shapiro MJ, Shapiro VS. NKAP is a transcriptional repressor of notch signaling and is required for T cell development. Immunity. 2009;30:696–707. doi: 10.1016/j.immuni.2009.02.011. [DOI] [PMC free article] [PubMed] [Google Scholar]
- Radtke F, Fasnacht N, Macdonald HR. Notch signaling in the immune system. Immunity. 2010;32:14–27. doi: 10.1016/j.immuni.2010.01.004. [DOI] [PubMed] [Google Scholar]
- Rothenberg EV, Moore JE, Yui MA. Launching the T-cell-lineage developmental programme. Nature Reviews. Immunology. 2008;8:9–21. doi: 10.1038/nri2232. [DOI] [PMC free article] [PubMed] [Google Scholar]
- Rothenberg EV. The chromatin landscape and transcription factors in T cell programming. Trends in Immunology. 2014;35:195–204. doi: 10.1016/j.it.2014.03.001. [DOI] [PMC free article] [PubMed] [Google Scholar]
- Shah DK, Zúñiga-Pflücker JC. An overview of the intrathymic intricacies of T cell development. Journal of Immunology (Baltimore, Md. 2014;192:4017–4023. doi: 10.4049/jimmunol.1302259. [DOI] [PubMed] [Google Scholar]
- Solanki A, Yánez DC, Lau C-I, Rowell J, Barbarulo A, Ross S, Sahni H, Crompton T. The transcriptional repressor Bcl6 promotes pre-TCR-induced thymocyte differentiation and attenuates Notch1 activation. Development (Cambridge, England) 2020;147:dev192203. doi: 10.1242/dev.192203. [DOI] [PubMed] [Google Scholar]
- Stubbs L, Sun Y, Caetano-Anolles D. Function and Evolution of C2H2 Zinc Finger Arrays. Sub-Cellular Biochemistry. 2011;52:75–94. doi: 10.1007/978-90-481-9069-0_4. [DOI] [PubMed] [Google Scholar]
- Sun Z, Unutmaz D, Zou YR, Sunshine MJ, Pierani A, Brenner-Morton S, Mebius RE, Littman DR. Requirement for RORgamma in thymocyte survival and lymphoid organ development. Science (New York, N.Y.) 2000;288:2369–2373. doi: 10.1126/science.288.5475.2369. [DOI] [PubMed] [Google Scholar]
- Villey I, de Chasseval R, de Villartay JP. RORgammaT, a thymus-specific isoform of the orphan nuclear receptor RORgamma / TOR, is up-regulated by signaling through the pre-T cell receptor and binds to the TEA promoter. European Journal of Immunology. 1999;29:4072–4080. doi: 10.1002/(SICI)1521-4141(199912)29:12<4072::AID-IMMU4072>3.0.CO;2-E. [DOI] [PubMed] [Google Scholar]
- Voll RE, Jimi E, Phillips RJ, Barber DF, Rincon M, Hayday AC, Flavell RA, Ghosh S. NF-kappa B activation by the pre-T cell receptor serves as a selective survival signal in T lymphocyte development. Immunity. 2000;13:677–689. doi: 10.1016/s1074-7613(00)00067-4. [DOI] [PubMed] [Google Scholar]
- von Boehmer H, Fehling HJ. Structure and function of the pre-T cell receptor. Annual Review of Immunology. 1997;15:433–452. doi: 10.1146/annurev.immunol.15.1.433. [DOI] [PubMed] [Google Scholar]
- Wolfe SA, Nekludova L, Pabo CO. DNA recognition by Cys2His2 zinc finger proteins. Annual Review of Biophysics and Biomolecular Structure. 2000;29:183–212. doi: 10.1146/annurev.biophys.29.1.183. [DOI] [PubMed] [Google Scholar]
- Xi H, Schwartz R, Engel I, Murre C, Kersh GJ. Interplay between RORgammat, Egr3, and E proteins controls proliferation in response to pre-TCR signals. Immunity. 2006;24:813–826. doi: 10.1016/j.immuni.2006.03.023. [DOI] [PubMed] [Google Scholar]
- Yamasaki S, Saito T. Molecular basis for pre-TCR-mediated autonomous signaling. Trends in Immunology. 2007;28:39–43. doi: 10.1016/j.it.2006.11.006. [DOI] [PubMed] [Google Scholar]
- Yang Q, Jeremiah Bell J, Bhandoola A. T-cell lineage determination. Immunological Reviews. 2010;238:12–22. doi: 10.1111/j.1600-065X.2010.00956.x. [DOI] [PMC free article] [PubMed] [Google Scholar]
- Yang YJ, Baltus AE, Mathew RS, Murphy EA, Evrony GD, Gonzalez DM, Wang EP, Marshall-Walker CA, Barry BJ, Murn J, Tatarakis A, Mahajan MA, Samuels HH, Shi Y, Golden JA, Mahajnah M, Shenhav R, Walsh CA. Microcephaly gene links trithorax and REST/NRSF to control neural stem cell proliferation and differentiation. Cell. 2012;151:1097–1112. doi: 10.1016/j.cell.2012.10.043. [DOI] [PMC free article] [PubMed] [Google Scholar]
- Yu D, Rao S, Tsai LM, Lee SK, He Y, Sutcliffe EL, Srivastava M, Linterman M, Zheng L, Simpson N, Ellyard JI, Parish IA, Ma CS, Li Q-J, Parish CR, Mackay CR, Vinuesa CG. The transcriptional repressor Bcl-6 directs T follicular helper cell lineage commitment. Immunity. 2009;31:457–468. doi: 10.1016/j.immuni.2009.07.002. [DOI] [PubMed] [Google Scholar]
- Yui MA, Rothenberg EV. Developmental gene networks: a triathlon on the course to T cell identity. Nature Reviews. Immunology. 2014;14:529–545. doi: 10.1038/nri3702. [DOI] [PMC free article] [PubMed] [Google Scholar]
- Zhao X-S, Fu W-Y, Hung K-W, Chien WWY, Li Z, Fu AK, Ip NY. NRC-interacting factor directs neurite outgrowth in an activity-dependent manner. Neuroscience. 2015;289:207–213. doi: 10.1016/j.neuroscience.2014.12.041. [DOI] [PubMed] [Google Scholar]
- Zhao B, Yoganathan K, Li L, Lee JY, Zúñiga-Pflücker JC, Love PE. Notch and the pre-TCR coordinate thymocyte proliferation by induction of the SCF subunits Fbxl1 and Fbxl12. Nature Immunology. 2019;20:1381–1392. doi: 10.1038/s41590-019-0469-z. [DOI] [PMC free article] [PubMed] [Google Scholar]
- Zikmund T, Kokavec J, Turkova T, Savvulidi F, Paszekova H, Vodenkova S, Sedlacek R, Skoultchi AI, Stopka T. ISWI ATPase Smarca5 Regulates Differentiation of Thymocytes Undergoing β-Selection. Journal of Immunology (Baltimore, Md. 2019;202:3434–3446. doi: 10.4049/jimmunol.1801684. [DOI] [PMC free article] [PubMed] [Google Scholar]