Abstract
Background:
Glucose data from intermittently scanned continuous glucose monitoring (isCGM) is a combination of scanned and imported glucose values. The present knowledge of glycemic metrics originate mostly from glucose data from real-time CGM sampled every five minutes with a lack of information derived from isCGM.
Methods:
Glucose data obtained with isCGM and hemoglobin A1c (HbA1c) were obtained from 169 patients with type 1 diabetes. Sixty-one patients had two observations with an interval of more than three months.
Results:
The best regression line of HbA1c against mean glucose was observed from 60 days prior to HbA1c measurement as compared to 14, 30, and 90 days. The difference between HbA1c and estimated HbA1c (=glucose management indicator [GMI]) first observed correlated with the second observation (R2 0.61, P < .001). Time in range (TIR, glucose between 3.9 and 10 mmol/L) was significantly related to GMI (R2 0.87, P < .001). A TIR of 70% corresponded to a GMI of 6.8% (95% confidence interval, 6.3-7.4). The fraction of patients with the optimal combination of TIR >70% and time below range (TBR) <4% was 3.6%. The fraction of patients with TBR>4% was four times higher for those with high glycemic variability (coefficient of variation [CV] >36%) than for those with lower CV.
Conclusion:
The individual difference between HbA1c and GMI was reproducible. High glycemic variability was related to increased TBR. A combination of TIR and TBR is suggested as a new composite quality indicator.
Keywords: glycemic variability, hemoglobin A1c, intermittently scanned continuous glucose monitoring, time in range, type 1 diabetes
Introduction
The inadequacy of hemoglobin A1c (HbA1c) as an isolated marker of glycemic control has received much attention in recent years.1,2 Real-time continuous glucose monitoring (rtCGM) provides a wealth of data including time in range (TIR), glycemic variability (coefficient of variation [CV]), glucose management indicator (GMI), and many other data. 3 These data are increasingly used in daily clinical practice and often come in the form of a one-page ambulatory glucose profile (AGP).4-6
While rtGM transmits glucose data automatically every five minutes, intermittently scanned continuous glucose monitoring (isCGM) requires that the user swipes a receiver unit close to the sensor to obtain a snapshot of the interstitial glucose concentration. Simultaneously, one glucose value from every 15 min from the previous eight hours is transferred to the receiver. It follows that rtGM glucose values are presented with the equidistant time interval irrespectively of the actual glucose value. In contrast, data from isCGM consist of values that are actively scanned, presumably more frequently when high or low glucose values are recognized, as well as data that are automatically derived. Furthermore, if the inter-scanning interval exceeds eight hours, gaps of missing data of variable duration are created. For these reasons, it is not obvious to apply the same principle of data handling and interpretation from rtCGM and isCGM.
At present, the costs of isCGM are reimbursed for all motivated patients with type 1 diabetes in many European countries including Norway, Sweden, United Kingdom, 7 and Belgium. 8 In a type 1 population with unlimited access to isCGM, we found that approximately 80% of individuals without rtGM preferred using isCGM rather than self-measurement of glucose (SMBG). 9
The present recommendation of achieving TIR >70% is still primarily based on regressions that link TIR 70% to a HbA1c of 7.0% rather than an assessment of the risk of hypoglycemia or diabetic complications. 10 Although isCGM is widespread, the present definition of optimal glycemic parameters is based largely on data from rtCGM.
On the background of data from isCGM the aim of this study was to describe: (1) the diurnal variation of available glucose data (“active CGM time”), (2) the relation of HbA1c to mean glucose, and (3) to present data for TIR and glycemic variability and to relate these findings to accepted criteria for optimal treatment.
Methods
In Silkeborg Regional Hospital, Denmark, we have temporarily had the opportunity to offer isCGM (Freestyle Libre, Abbott, Witney, UK) without restrictions to adult patients with type 1 diabetes. 9 As part of routine clinical care, glucose data were downloaded from the software platform Diasend (Glooko + Diasend) at each patient visit to the clinic. The data included all scanned and automatically transmitted glucose values from three months before the date at which HbA1c was measured (typically one week before the visit). We present results from all patients with isCGM who had HbA1c measured with HPLC from February through December 2019 and had used isCGM for more than three months. For patients with more than one observation period, it was required that the inter-observational interval should exceed three months.
HbA1c was measured with Tosoh HLC-723G11 (Tosoh Europe, Tessenderlo, Belgium) with one recalibration performed in the observation period.
Active CGM time (%) for a given time period, for example 60 days, was calculated as the number of 15-min periods with at least one glucose value divided by the total number of 15-min periods (60 days = 5760 fifteen-min periods) × 100. Accordingly active CGM time (%) for a given 15-min period (eg, from 12:00 to 12:14) during 60 days of glucose sampling was calculated as the number of periods with at least one value divided by 60 × 100. Time below range (TBR [%], glucose <70 mg/dL [3.9 mmol/L]), time in range (%, 70-180 mg/dL [3.9-10.0 mmol/L]), and time above range (TAR [%], >180 mg/dL [10 mmol/L]) were calculated as the relevant number of 15-min periods divided by the total number with at least one glucose value × 100. Glycemic variability for a given time period was calculated as the CV (standard deviation [SD] of 15-min glucose averages/mean of 15-min glucose average × 100). The observation period with the highest active CGM time (%) was selected if the patient had more than one observation period.
Statistical Analysis
Per convention, 3 most glycemic metrics are presented as median and interquartile range (IQR). Mean glucose, calculated as area under the curve (AUC) divided by the length of the observation period and as mean of 15-min averages, was calculated with the R-package Flux. Linear regression was performed to achieve R2 and standard error of the estimate (SEE). Regression of HbA1c against mean glucose values was calculated for 14, 30, 60, and 90 days before the date HbA1c was measured and for three estimates of mean glucose (mean of all values, AUC divided by duration of observation period, and mean of 15-min averages). The estimate of HbA1c is designated GMI in the following. SEEs derived from different regression equations were compared using Morgan-Pitman’s test. The SEE of GMI for the regression and R2 was calculated for each of the combinations of the four sampling period and three estimates of mean glucose. The regression with the lowest SEE was chosen for calculating GMI and for further calculation of glycemic metrics.
Glycemic variability expressed as CV was normally distributed as assessed by inspection of Q-Q plots and CV for different time periods was compared with Student’s paired t test, and 95% confidence interval (CI) is presented. The statistical packages SPSS ver. 20.0 and R ver. 3.4.1 were used.
Results
Patients
The data files of 178 patients with isCGM in the study period were reviewed. We excluded patients with latent autoimmune diabetes of the adulthood (n = 4), secondary diabetes (n = 3), type 2 diabetes (n = 1), and one patient treated with erythropoietin.
A total of 169 individuals with type 1 diabetes were included; their age was 52 (mean ± SD) ± 14 years (range 18-77), diabetes duration 27 ± 14 years (range 2-68), and 57% were males. Insulin delivery consisted of multiple daily injections (MDI) in 84.6% and continuous subcutaneous insulin infusion (CSII) in 15.4% of patients.
HbA1c Measurement
The calibrator for measurement of HbA1c with Tosoh G11 was shifted on 29 March 2019. Twenty samples were measured with both the old and new calibrators. The difference new − old calibrator was mean 0.06% (95% CI, 0.05-0.08, P < .001). Consequently, 0.06% (0.71 mmol/mol) was added to HbA1c values (n = 37) obtained before 29 March 2019. HbA1c was median 7.4% (IQR: 6.9, 8.0). Sixty-one patients had two observation periods. The number of daily glucose scannings performed from 90 days preceding the first visit to the clinic (n = 163) was median 11 (IQR: 8, 13).
Active CGM Time
The active CGM time was reduced from approximately 95% starting around 19:00, reaching a nadir of 83% at 22:30, and returning to baseline at approximately 02:30 (Figure 2).
Figure 2.
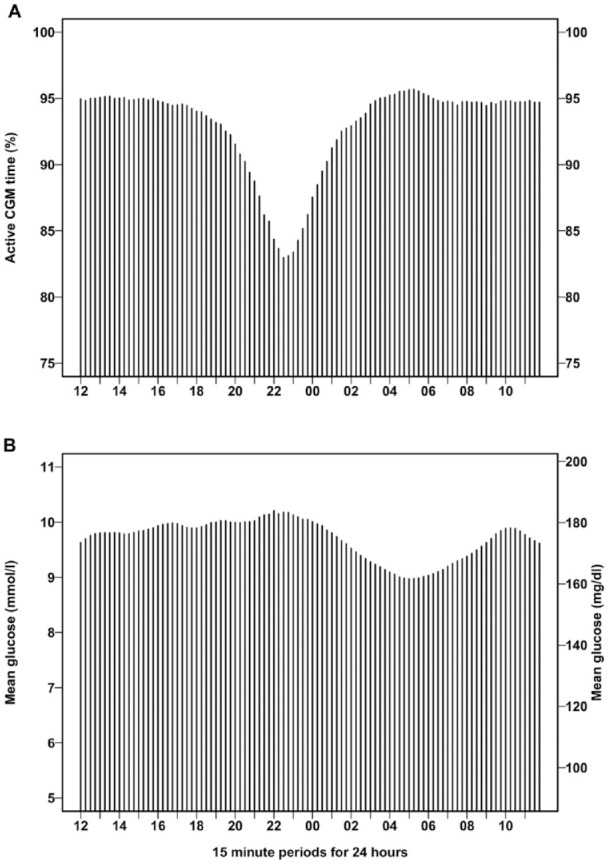
Diurnal variation of active CGM time (a) and mean glucose (b) obtained from 60 days of 15-min glucose average. Data are presented as mean values for each 15-min period starting at 12:00 to 12:14 and ending at 11:45 to 11:59. CGM, continuous glucose monitoring.
Calculation of Estimated HbA1c
Table 1 gives data for SEE and R2 for the different time periods (14, 30, 60, or 90 days before measurement of HbA1c). The three methods for calculating mean glucose (all values, AUC, or 15-min average) had only negligible influence on R2 and SEE for the regression and were nearly identical for each of the four time periods. Overall, R2 increased and SEE decreased when the period for calculating mean glucose rose from 14 to 30 and 60 days. The standard error of the estimated GMI based on the mean of 15-min average glucose from 60 days was numerically the lowest and significantly lower than SEE calculated from the regression based on 14- and 30-day glucose data (P < .01 for both). SEE was not significantly different when calculated from 60 days as compared with 90 days (P = .9). Consequently, GMI was calculated from the regression line from 60 days of glucose sampling. The regression line was: GMI (%) = 0.02376 × mean glucose (mg/dL) + 3.40, P < .001, SEE 0.57 (Figure 1). The reverse regression was: mean glucose (mg/dL) = 27.366 × HbA1c (%) − 32.0, SEE 19.34.
Table 1.
Calculation of Active CGM Time, Mean Glucose, Glycemic Variability, R2, and SEE for the Regression of HbA1c vs Glucose Data From 14, 30, 60, and 90 days Before Measurement of HbA1c.
| 14 days | 30 days | 60 days | 90 days | |
|---|---|---|---|---|
| Calculation of active CGM time | ||||
| Total number of glucose values a | 1414 (1372, 1513) | 3063 (2905, 3211) | 6115 (5750, 6424) | 9104 (8542, 9459) |
| Number of 15 min with value a | 1305 (1264, 1323) | 2785 (2679, 2825) | 5550 (5378, 5648) | 8291 (7906, 8456) |
| Maximal possible15 min periods | 1344 | 2880 | 5760 | 8640 |
| Active CGM time (%) a | 92 (89, 93) | 92 (88, 93) | 93 (90, 94) | 94 (90, 96) |
| Calculation of mean glucose | ||||
| Mean all glucose values b | 173 ± 34 (9.6 ± 1.9) | 174 ± 33 (9.7 ± 1.8) | 174 ± 32 (9.7 ± 1.8) | 174 ± 32 (9.7 ± 1.8) |
| Mean glucose (AUC) b | 174 ± 34 (9.7 ± 1.9) | 175 ± 32 (9.7 ± 1.8) | 175 ± 33 (9.7 ± 1.8) | 175 ± 32 (9.7 ± 1.8) |
| Mean glucose (15 min) b | 174 ± 35 (9.6 ± 1.9) | 174 ± 33 (9.7 ± 1.8) | 175 ± 33 (9.7 ± 1.8) | 174 ± 32 (9.7 ± 1.8) |
| Glycemic variability | ||||
| CV% (mean glucose [15 min]) a | 38 (34, 42) | 38 (34, 43) | 39 (35, 43) | 39 (35, 44) |
| Regression HbA1c vs glucose | ||||
| R2 (mean all glucose values) | 0.56 | 0.61 | 0.65 | 0.65 |
| R2 (mean glucose [AUC]) | 0.56 | 0.61 | 0.64 | 0.64 |
| R2 (mean glucose [15 min]) | 0.57 | 0.61 | 0.65 | 0.65 |
| SEE (mean all glucose values) c | 0.64 | 0.60 | 0.57 | 0.57 |
| SEE (mean glucose [AUC]) c | 0.64 | 0.60 | 0.58 | 0.58 |
| SEE (mean glucose [15 min]) c | 0.63 | 0.60 | 0.57 | 0.57 |
Mean glucose is calculated from all values (both scanned and imported every 15 min), from AUC divided by the time period, and from mean of 15 min average. aMedian (interquartile range), bmean ± SD mg/dL (mean ± SD mmol/L), c% (mmol/mol).
AUC, area under the curve; CGM, continuous glucose monitoring; HbA1c, hemoglobin A1c; SD, standard deviation; SEE, standard error of the estimate.
Figure 1.
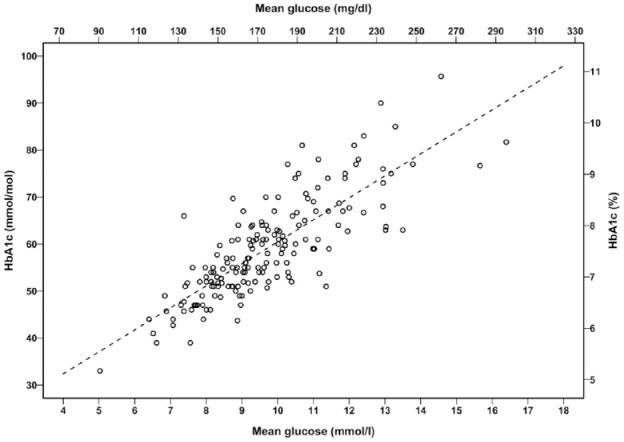
The relation of HbA1c and mean glucose (mean of 15-min glucose average for 60 days) for 169 patients with type 1 diabetes.
The dotted line is the regression: GMI (%) = 0.02376 × mean glucose (mg/dL) + 3.40. GMI, glucose monitoring indicator; HbA1c, hemoglobin A1c.
For patients (n = 61) with two observation periods, the interval between HbA1c measurements was median 140 days (IQR: 109, 203). The difference HbA1c − GMI for the second observation was plotted against the difference for the first observation. The regression line was: second (HbA1c [%] − GMI [%]) = first (HbA1c [%] − GMI [%]) × 0.705 − 0.04 (R2 0.61, SEE 0.28, P < .001) (Figure 3). A Bland-Altman plot demonstrated that the difference second (HbA1c − GMI) − first (HbA1c − GMI) was independent of the mean of the differences (Figure 4).
Figure 3.
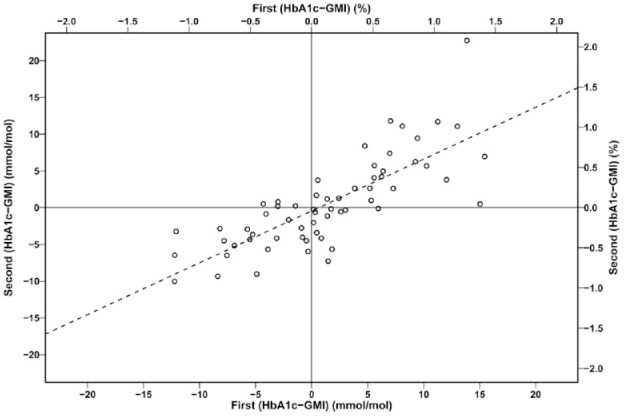
The difference HbA1c − GMI for the second observation plotted against the difference HbA1c − GMI for the first observation (n = 61 paired observations).
The dotted line is the regression line: second (HbA1c [%] − GMI [%]) = first (HbA1c [%] − GMI [%]) × 0.705 − 0.041. GMI, glucose monitoring indicator; HbA1c, hemoglobin A1c.
Figure 4.
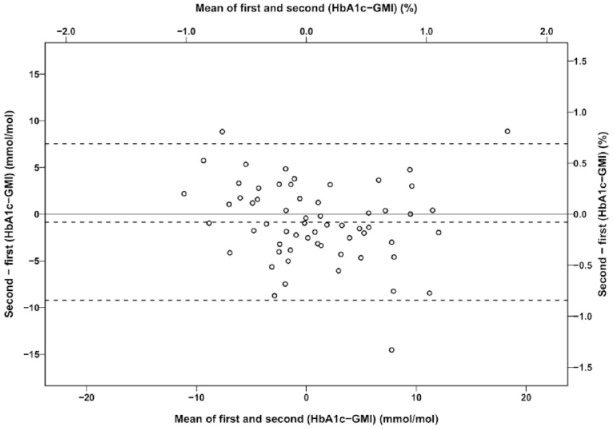
A Bland-Altman plot of the difference between the first and second difference HbA1c - GMI against the mean of the differences. Sixty-one patients with type 1 diabetes had HbA1c and GMI measured on two occasions. The dotted lines are the mean difference -0.08% and 95% limits of agreement -0.8 to 0.7 %. GMI, glucose monitoring indicator; HbA1c, hemoglobin A1c.
Time in Range
TBR (calculated from 60 days) was 4.2% (IQR: 2.1, 7.3), TIR 54.1% (42.6, 63.9), and TAR 39.5% (29.4, 51.6). GMI was significantly curvilinearly related to TIR (Figure 5a): GMI (%) = −0.0891 × TIR + 0.00041 × TIR2 + 11.0 (P < .001, R2 0.87, SEE 0.28). It follows that TIR 65% corresponds to GMI 7.0% (6.5, 7.4) and TIR 70% to GMI 6.8% (6.3, 7.4). The proportion of patients with GMI <7.0% who also had TIR <70% was 55% (23 of 42 patients).
Figure 5.
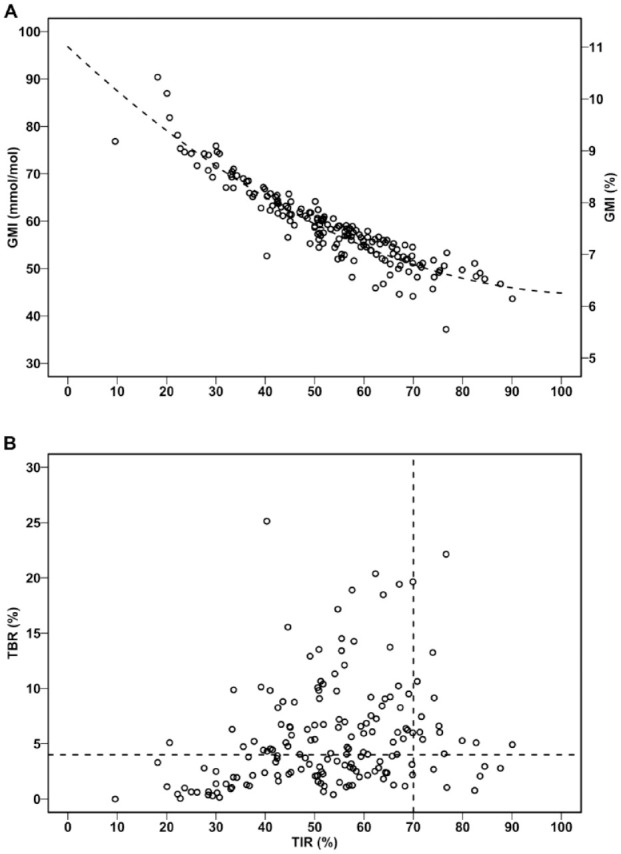
The relation between TIR and GMI (a) and TBR (b) obtained from 60 days of 15-min glucose average.
The vertical and horizontal dotted lines represent TIR 70% and TBR 4%, respectively. GMI, glucose monitoring indicator; TBR, time below range; TIR, time in range.
Given the optimal TIR >70% and TBR <4%, we can divide the population into four categories: (A) TIR ≤ 70% and TBR ≥ 4% (n = 78, 46.2%), (B) TIR ≤ 70% and TBR < 4% (n = 72, 42.6%), (C) TIR > 70% and TBR ≥ 4% (n = 13, 7.7%), and (D) TIR > 70% and TBR < 4% (n = 6, 3.6%) (Figure 5b).
Glycemic Variability
CV calculated from 90 days was slightly but significantly higher than CV calculated from 14 days (CV 90 days – CV 14 days = 0.72% [95% CI: 0.24-1.21, P < .01]). The relation between CV and TBR is depicted in Figure 6. The proportion of patients with CV ≤ 36% who had TBR >4% was 17.2% (10 of 58 patients) and the proportion of patients with CV >36% and TBR >4% was 71.2%.
Figure 6.
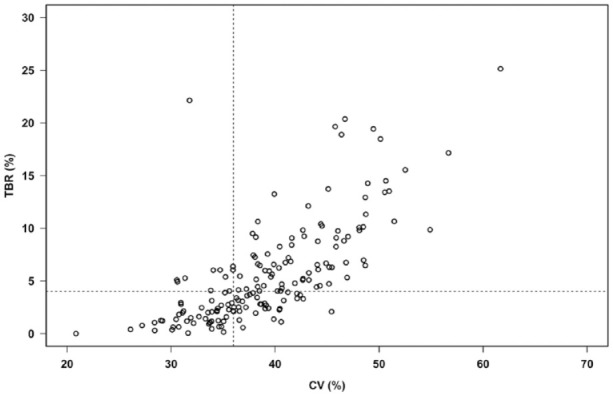
The relation between glycemic variability (calculated as CV from 60 days values of 15-min glucose average) and TBR.
The vertical and horizontal dotted lines represent CV 36% and TBR 4%, respectively. CV, coefficient of variation; TBR, time below range.
Discussion
We document that active isCGM time exhibits a characteristic dip in the late evening of approximately six hours duration. This can be explained by an interval that for some patients exceeds eight hours between the last scanned value before going to bed and the first scanned value after rising in the morning.
The temporary reduction in active CGM time is unlikely to affect the calculation of mean glucose because the nocturnal reduction of glucose largely occurs after normalization of active CGM time. To support this notion, we notice that the equation used to calculate GMI from rtCGM obtained with the Dexcom (Dexcom, Inc. San Diego, CA) equipment 4 and other manufactures. 11 GMI (%) = 0.02392 × mean glucose (mg/dL) + 3.31 is very close to the equation found in the present study: GMI (%) = 0.02376 × glucose (mg/dL) + 3.40. It is reassuring that the formula now used in several AGP reports to calculate GMI confidently can be used with data obtained from isCGM by the Abbott Freestyle Libre. Clearly, the rearrangement: HbA1c (%) = 0.0348 × glucose (mg/dL) + 1.63 of the original A1c-Derived Average Glucose equation 12 is misleading and should be abandoned in AGP reports. 13 One previous study has reported a minor racial difference in the relation between mean glucose obtained from blinded isCGM and HbA1c, but the glucose values employed were not simple means but calculated from a time-weighted formula. 14
Scanned glucose values are not randomly distributed over 24 h as there are markedly fewer scannings during the night; 15 therefore, high and low scanned glucose values are presumably overrepresented. Nevertheless, on a group basis, only subtle differences were noted between mean glucose and SD calculated as a simple mean of all (scanned and imported) values, calculations based on AUC, or average values for each 15-min period. This is in accordance with a rtCGM study that simulated isCGM data by including only every third of five-minute glucose data. 10
The estimate of HbA1c based on 60 days of glucose sampling was superior to that which was based on 14 days. However, the latter, as usually presented in AGP reports, is not intended to be a simple estimate of the actual HbA1c; rather, it is used as an approach to estimate HbA1c if glycemic control for the previous 14 days could be extrapolated to the previous 60 days. We found that R2 increased from 0.55 (14 days) to 0.62 (60 days). This finding is roughly comparable to that of a previous study using a combination of data from blinded isCGM and non-blinded rtCGM, which reported an increase from 0.54 (14 days) to 0.58 (90 days). 16
The difference between HbA1c and GMI in the first observation period and the difference between HbA1c and GMI in the second observation period were highly correlated. This strongly confirms the assumption that the hemoglobin glycation index is an individual characteristic determined by the erythrocyte half-life, among others. 17 As often reported, there is a large range of possible HbA1c values for a given mean glucose value.4,5,12 In our study, the 95% CI for HbA1c could be GMI ± 1.96 × SEE, which equals ±1.1%. This finding and the reproducibility of the difference HbA1c − GMI underscore the statement that HbA1c is no longer a preferred glycemic parameter. 18
For patients using SMBG, it may make pedagogical sense to discuss the meaning of HbA1c as an estimate of mean glucose. For this purpose, the reverse equation (mean glucose as dependent variable) can be helpful, and lab reports often present this opportunity. It is noteworthy that due to the principle of minimizing SEE, the reverse regression is not a simple mathematic rearrangement. 10 We suggest that the data from Bergenstal et al 4 also be presented as an equation with mean glucose as the dependent variable.
The optimal goal for TIR > 70% is a consensus statement 5 supported by reports that TIR 70% corresponds to HbA1c 6.8-7.0% 10 or 6.7%. 19 It is important to realize that the CI for GMI for a given TIR value is wide. More than half of our patients with a GMI < 7.0% obtained this despite TIR < 70%. This indicates that the wisdom of attempting TIR > 70% should always be evaluated on the background of achieved GMI or mean glucose and TBR. 20 We found a curvilinear relation between TIR and GMI and recognize a similar result from a pediatric population. 21
In our population, the fractions of patients with both TIR ≤ 70% and TBR ≥ 4% (46.2%) and the fraction with both TIR > 70% and TBR < 4% (3.6%) were disappointingly high and low, respectively. It is striking that an ideal combination of a high TIR and a low TBR was very difficult to achieve. Even with a less ambitious TIR of 60%, a recent study noticed a corresponding mean TBR of 4.2% for patients with rtCGM and 7.7% for those with SMBG. 20 This underscores the importance of individualized and realistic treatment goals. We are not aware of similar presentations of data for comparison. The various CGM-based composite metrics for evaluation of glycemic control have been reviewed. 22 Many of these combines hypoglycemia, hyperglycemia, and glycemic variability into a single score with each of the elements contributing with different weight. We suggest that the fraction of patients with both TIR > 70% and TBR < 4% could be a new population composite parameter. The aspect of glycemic variability is included due to the close relation between CV and TBR. The drawback of this is that standards need to be established. Individuals with values close to the cut off contributes as much as patients with large excursions from the optimal level do. The advantage is that in contrast to many other parameters, this glycemic metric is easily obtainable from the AGP report and it represents a population quality indicator useful for benchmarking and comparison between diabetes clinics and different technology modalities.
The clinical significance of glycemic variability has been disputed.18,23,24 On the basis of the upper value of CV from patients with type 2 diabetes without insulin treatment, it has been suggested that CV for patients with type 1 diabetes should be <36%. 25 This cut off clearly discriminated patients with low and high risk of TBR > 4% since the fraction of patients with TBR > 4% was four times higher for those with CV > 36% than for those with CV ≤ 36% in accordance with. 26 CV as defined in the present study is a reflection of short-term variation (hours), which is probably the most important, diurnal and long-term (weeks) variation. The slightly higher CV calculated from 90 or 60 days compared with 14 days is trivial and most likely explained by the contribution of long-term variability.
The limitations of this study are mainly the context. We have only examined patients with isCGM without hypoalert. The vast majority used MDI, and none of our CSII patients have sensor augmentation since this is not an option with isCGM. TIR and CV described in this study cannot be extrapolated to populations with frequent use of CSII with rtCGM and low glucose suspended insulin infusion or hybrid-closed loop. Hopefully this and more advanced diabetes technologies may increase the fraction of patients with TIR > 70% without triggering a worrying increase in TBR. It is an inherent limitation of all CGM studies that the relation between interstitial glucose values and blood glucose is specific for the applied CGM methodology. 27 Although blood glucose in the low range has been shown to be underestimated and blood glucose in the high range to be overestimated by the isCGM method used in this study, it should be noted that isCGM data have been reported without systematic difference as compared with the results from rtCGM.28-30
We have examined a sizeable number of patients as part of routine diabetes care in a single center. Our data might be more representative for real-world glycemic metrics than data obtained from participants in clinical studies. 10
Conclusion
We report new data of diurnal variation of active isCGM time and information supporting the calculation of GMI hitherto obtained from rtGM. More than half of the patients obtained a GMI < 7.0% despite they did not fulfill the goal of TIR > 70%, which may be too ambitious for some patients with isCGM. The negative consequence of high glycemic variability was demonstrated by the finding that the risk of TBR > 4% was four times as high for patients with CV > 36% than for patients with lower glycemic variability. Finally, we suggest an easily calculated population quality indicator based on combined time in and below range.
Acknowledgments
We thank statistician Aparna Udupi, Biostatistical Advisory Service, Faculty of Health, Aarhus University, Denmark for preparing data for statistical analysis and biochemist Mette Østergaard, Department of Clinical Biochemistry, Regional Hospital Central Jutland, Denmark, for information about shift of calibrator for the HbA1c analysis.
Footnotes
Abbreviations: AGP, ambulatory glucose profile; AUC, area under the curve; CSII, continuous subcutaneous insulin infusion; CV, coefficient of variation; GMI, glucose management indicator; HbA1c, hemoglobin A1c; isCGM, intermittently scanned continuous glucose monitoring; MDI, multiple daily injections; rtCGM, real time continuous glucose monitoring; SEE, standard error of the estimate; SMBG, self-measurement of glucose; TIR, time in range; TBR, time below range; TAR, time above range.
Declaration of Conflicting Interests: The author(s) declared no potential conflicts of interest with respect to the research, authorship, and/or publication of this article.
Funding: The author(s) disclosed receipt of the following financial support for the research, authorship, and/or publication of this article: The study was financially supported by Rosa and Asta Jensen foundation, which did not have any influence on the study.
ORCID iD: Klavs Würgler Hansen  https://orcid.org/0000-0002-7452-2747
References
- 1. Wright LA, Hirsch IB. Metrics beyond hemoglobin A1C in diabetes management: time in range, hypoglycemia, and other parameters. Diabetes Technol Ther. 2017;19(S2):S16-S26. [DOI] [PMC free article] [PubMed] [Google Scholar]
- 2. Beck RW, Connor CG, Mullen DM, Wesley DM, Bergenstal RM. The fallacy of average: how using HbA1c alone to assess glycemic control can be misleading. Diabetes Care. 2017;40(8):994-999. [DOI] [PMC free article] [PubMed] [Google Scholar]
- 3. Danne T, Nimri R, Battelino T, et al. International consensus on use of continuous glucose monitoring. Diabetes Care. 2017;40(12):1631-1640. [DOI] [PMC free article] [PubMed] [Google Scholar]
- 4. Bergenstal RM, Beck RW, Close KL, et al. Glucose management indicator (GMI): a new term for estimating A1C from continuous glucose monitoring. Diabetes Care. 2018;41(11):2275-2280. [DOI] [PMC free article] [PubMed] [Google Scholar]
- 5. Battelino T, Danne T, Bergenstal RM, et al. Clinical targets for continuous glucose monitoring data interpretation: recommendations from the international consensus on time in range. Diabetes Care. 2019;42(8):1593-1603. [DOI] [PMC free article] [PubMed] [Google Scholar]
- 6. American Diabetes Association. Glycemic targets: standards of medical care in diabetes-2020. Diabetes Care. 2020;43(Suppl 1):S66-S76. [DOI] [PubMed] [Google Scholar]
- 7. Tyndall V, Stimson RH, Zammitt NN, et al. Marked improvement in HbA1c following commencement of flash glucose monitoring in people with type 1 diabetes. Diabetologia. 2019;62(8):1349-1356. [DOI] [PMC free article] [PubMed] [Google Scholar]
- 8. Charleer S, De Block C, Van Huffel L, et al. Quality of life and glucose control after 1 year of nationwide reimbursement of intermittently scanned continuous glucose monitoring in adults living with type 1 diabetes (FUTURE): a prospective observational real-world cohort study. Diabetes Care. 2020;43(2):389-397. [DOI] [PubMed] [Google Scholar]
- 9. Hansen KW. Effects of unrestricted access to flash glucose monitoring in type 1 diabetes. Endocrinol Diabetes Metab. 2020;3(3):e00125. [DOI] [PMC free article] [PubMed] [Google Scholar]
- 10. Beck RW, Bergenstal RM, Cheng P, et al. The relationships between time in range, hyperglycemia metrics, and HbA1c. J Diabetes Sci Technol. 2019;13(4):614-626. [DOI] [PMC free article] [PubMed] [Google Scholar]
- 11. Leelarathna L, Beck RW, Bergenstal RM, et al. Glucose management indicator (GMI): insights and validation using guardian 3 and navigator 2 sensor data. Diabetes Care. 2019;42(4):e60-e61. [DOI] [PubMed] [Google Scholar]
- 12. Nathan DM, Kuenen J, Borg R, et al. Translating the A1C assay into estimated average glucose values. Diabetes Care. 2008;31(8):1473-1478. [DOI] [PMC free article] [PubMed] [Google Scholar]
- 13. Hansen KW. Converting haemoglobin A1c and average glucose. Time to change? Diabetes Res Clin Pract. 2019;153:194-195. [DOI] [PubMed] [Google Scholar]
- 14. Bergenstal RM, Gal RL, Connor CG, et al. Racial differences in the relationship of glucose concentrations and hemoglobin A1c levels. Ann Intern Med. 2017;167(2):95-102. [DOI] [PubMed] [Google Scholar]
- 15. Dunn TC, Xu Y, Hayter G, Ajjan RA. Real-world flash glucose monitoring patterns and associations between self-monitoring frequency and glycaemic measures: a European analysis of over 60 million glucose tests. Diabetes Res Clin Pract. 2018;137:37-46. [DOI] [PubMed] [Google Scholar]
- 16. Riddlesworth TD, Beck RW, Gal RL, et al. Optimal sampling duration for continuous glucose monitoring to determine long-term glycemic control. Diabetes Technol Ther. 2018;20(4):314-316. [DOI] [PubMed] [Google Scholar]
- 17. Nayak AU, Singh BM, Dunmore SJ. Potential clinical error arising from use of HbA1c in diabetes: effects of the glycation gap. Endocr Rev. 2019;40(4):988-999. [DOI] [PubMed] [Google Scholar]
- 18. Battelino T, Bergenstal RM. Continuous glucose monitoring-derived data report-simply a better management tool. Diabetes Care. 2020;43(10):2327-2329. [DOI] [PubMed] [Google Scholar]
- 19. Vigersky RA, McMahon C. The relationship of hemoglobin A1C to time-in-range in patients with diabetes. Diabetes Technol Ther. 2019;21(2):81-85. [DOI] [PubMed] [Google Scholar]
- 20. Seyed Ahmadi S, Westman K, Pivodic A, et al. The association between HbA1c and time in hypoglycemia during CGM and self-monitoring of blood glucose in people with type 1 diabetes and multiple daily insulin injections: a randomized clinical trial (GOLD-4). Diabetes Care. 2020;43(9):2017-2024. [DOI] [PMC free article] [PubMed] [Google Scholar]
- 21. Petersson J, Akesson K, Sundberg F, Sarnblad S. Translating glycated hemoglobin A1c into time spent in glucose target range: a multicenter study. Pediatr Diabetes. 2019;20(3):339-344. [DOI] [PubMed] [Google Scholar]
- 22. Nguyen M, Han J, Spanakis EK, Kovatchev BP, Klonoff DC. A review of continuous glucose monitoring-based composite metrics for glycemic control. Diabetes Technol Ther. 2020;22(8):613-622. [DOI] [PMC free article] [PubMed] [Google Scholar]
- 23. Hirsch IB. Glycemic variability and diabetes complications: does it matter? Of course it does! Diabetes Care. 2015;38(8):1610-1614. [DOI] [PubMed] [Google Scholar]
- 24. Bergenstal RM. Glycemic variability and diabetes complications: does it matter? Simply put, there are better glycemic markers! Diabetes Care. 2015;38(8):1615-1621. [DOI] [PubMed] [Google Scholar]
- 25. Monnier L, Colette C, Wojtusciszyn A, et al. Toward defining the threshold between low and high glucose variability in diabetes. Diabetes Care. 2017;40(7):832-838. [DOI] [PubMed] [Google Scholar]
- 26. Toschi E, Slyne C, Sifre K, et al. The relationship between CGM-derived metrics, A1C, and risk of hypoglycemia in older adults with type 1 diabetes. Diabetes Care. 2020;43(10):2349-2354. [DOI] [PMC free article] [PubMed] [Google Scholar]
- 27. Pleus S, Heinemann L, Freckmann G. Blood glucose monitoring data should be reported in detail when studies about efficacy of continuous glucose monitoring systems are published. J Diabetes Sci Technol. 2018;12(5):1061-1063. [DOI] [PMC free article] [PubMed] [Google Scholar]
- 28. Bonora B, Maran A, Ciciliot S, Avogaro A, Fadini GP. Head-to-head comparison between flash and continuous glucose monitoring systems in outpatients with type 1 diabetes. J Endocrinol Invest. 2016;39(12):1391-1399. [DOI] [PubMed] [Google Scholar]
- 29. Aberer F, Hajnsek M, Rumpler M, et al. Evaluation of subcutaneous glucose monitoring systems under routine environmental conditions in patients with type 1 diabetes. Diabetes Obes Metab. 2017;19(7):1051-1055. [DOI] [PubMed] [Google Scholar]
- 30. Freckmann G, Link M, Pleus S, Westhoff A, Kamecke U, Haug C. Measurement performance of two continuous tissue glucose monitoring systems intended for replacement of blood glucose monitoring. Diabetes Technol Ther. 2018;20(8):541-549. [DOI] [PMC free article] [PubMed] [Google Scholar]


