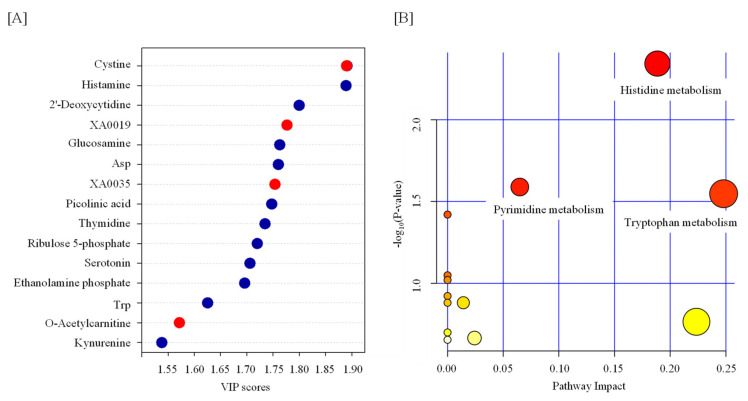
Figure 2.
Feature of metabolite in the serum from TBI mice. (A) Variable importance in projection (VIP) scores of the partial-least-squares discriminant analysis (PLS-DA) in TBI and control mice. The red and blue dots indicate the corresponding metabolite level was increased and decreased by TBI, respectively. (B) A pathway analysis combining pathway enrichment and pathway topology analyses of metabolites whose levels were significantly changed by TBI. The x-axis marks the pathway impact, and the y-axis represents the pathway enrichment. Each node marks a pathway, with larger sizes and darker colors representing higher pathway impact values and greater pathway enrichment. Asp—aspartate; Trp—tryptophan.

