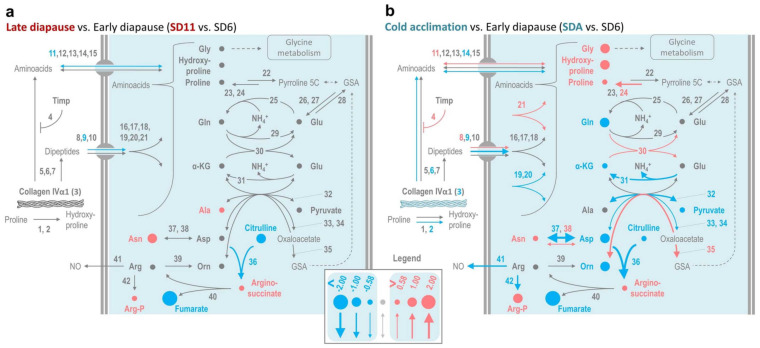
Figure 1.
Changes in metabolism of proline during diapause maintenance vs. cold acclimation in C. costata larvae. The maps show log2-fold changes in relative concentrations of metabolites (circles) and gene expression (arrows) according to numerical results (Table S4) during diapause maintenance (a) and gradual cold acclimation (b). Three different thresholds for change were reflected in the size of symbols used (circles and arrows): absolute log2-fold change >0.58 (1.5-fold change); >1.00 (2-fold change); and >2.00 (4-fold change). Red indicates upregulation, blue indicates downregulation, grey indicates log2-fold changes between −0.58 to 0.58. Genes are coded by numbers (see Table S3). Thick grey double lines symbolize the plasma membrane with embedded transport systems. α-KG, ketoglutarate; GSA (glutamate-5-semialdehyde) and pyrroline 5C are tautomers and their interconversions are spontaneous.

