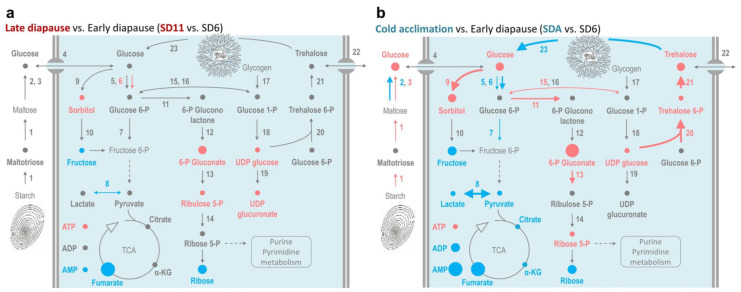
Figure 4.
Changes in metabolism of trehalose during diapause maintenance vs. cold acclimation in C. costata larvae. The maps show log2-fold changes in relative concentrations of metabolites (circles) and gene expressions (arrows) during diapause maintenance (a) and gradual cold acclimation (b) (see Table S5). Other descriptions are as in Figure 2. TCA, tricarboxylic acid cycle; α-KG, ketoglutarate.

