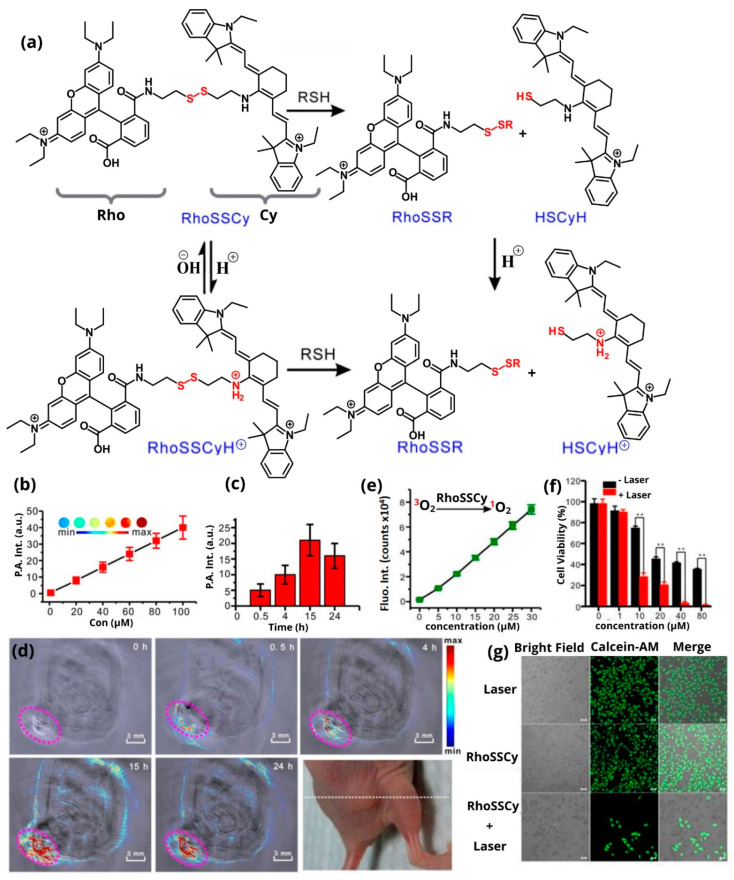
Figure 14.
(a) Schematic representation of how RhoSSCy interacts with thiols and pH; (b) the correlation between PA intensity and RhoSSCy concentration; (c) graphic of PA signal as a function of time; (d) PA imaging of a tumor-bearing nude mouse, as well as real-time photos of the agent’s accumulation point; (e) graph showing the linear relationship from the release of ROS and RhoSSCy concentration; (f) images of MCF-7 cells visualized by fluorescence. Viable cells were stained green via calcein-AM dye. Bars, 25 μm (** p < 0.01); and (g) MCF-7 cell’s survivals using RhoSSCy in different concentrations after PDT. Adapted with permission from [140], Theranostics, 2017.

