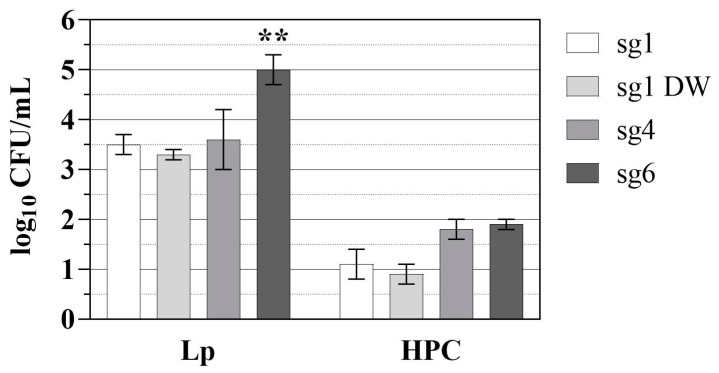
Figure 3.
Lp and HPC log reductions using the UV-C LED POE device. Data represent the mean ± SDLR log10 CFU mL−1 reductions in Lp sg 1 (white bars), sg 1 DW isolate (light grey bars), sg 4 (dark grey bars), and sg 6 (black bars) and the reduction in HPC levels in the drinking water source during each of the Lp strain experimental runs. SDLR was calculated as described in Section 2.6. Data are representative of five replicates for each strain. Statistical significance when compared to all other strains is denoted as ** for p < 0.001. See Supplemental Materials Table S2.

