Abstract
Purpose:
The current study aimed to develop a three-dimensional (3D) dynamic oxygen-17 (17O) MR imaging method with high temporal and spatial resolution to delineate the kinetics of 17O water uptake and washout in the brains of mice with glioblastoma (GBM).
Methods:
A 3D imaging method with a stack-of-stars golden-ratio–based radial sampling scheme was employed to acquire 17O signal in vivo. A k-space–weighted image reconstruction method was used to improve the temporal resolution while preserving spatial resolution. Simulation studies were performed to validate the method. Using this method, the kinetics of 17O water uptake and washout in the brains of mice with GBM were delineated after an intravenous bolus injection of 17O water.
Results:
The proposed 17O imaging method achieved an effective temporal resolution of 7.56 s with a nominal voxel size of 5.625 μL in the mouse brain at 9.4 T. Reduced uptake and prolonged washout of 17O water were observed in tumor tissue, suggesting compromised cerebral perfusion.
Conclusion:
This study demonstrated a promising dynamic 17O imaging approach that can delineate 17O water kinetics in vivo with high temporal and spatial resolution. It can also be used to image cerebral oxygen consumption rate in oxygen-17 inhalation studies.
Keywords: oxygen-17 MRI, golden-ratio–based radial sampling, k-space–weighted image contrast reconstruction
INTRODUCTION
Regulation of cerebral fluids plays a vital role in brain function (1). Investigation of cerebral fluid dynamics, such as blood flow, diffusion, and water movement across the blood-brain barrier (BBB), is of great value in assessing brain physiology and function under normal and diseased conditions. While MRI with arterial spin labeling uses magnetically labeled endogenous water as a tracer to measure cerebral blood flow (CBF) (2), other imaging methods have used isotope-labeled exogenous water tracers to quantify both CBF and water transport across the BBB (3,4). Using water labeled with oxygen isotopes, oxygen-15 (15O) positron emission tomography (PET) and oxygen-17 (17O) MRI are the only available methods capable of tracing water movement in vivo. However, 15O-PET requires an on-site cyclotron to generate the short-lived 15O isotope (~2 minute half-life), limiting its clinical use. Alternatively, 17O is a stable MR-detectable isotope with a natural abundance of 0.037% only. 17O-labeled water () can thus serve as a tracer for in vivo evaluation of water movement by MRI. However, use of 17O-labeled water in vivo is challenging due to the limited signal-to-noise ratio (SNR) caused by the low natural abundance and MR sensitivity of 17O. Even on high-field scanners, images are typically acquired with a large voxel size to achieve adequate SNR. In addition, using a short echo time to minimize signal loss in 17O-MRI is critical due to the short transverse relaxation time of 17O (5).
17O-MRI has been used extensively to evaluate cerebral metabolic activity in rats (6), healthy cats (7), and mice (8,9). Quantification of the cerebral metabolic rate of oxygen consumption (CMRO2) was accomplished by calculating the rate of generation from inhaled 17O-labeled oxygen gas (17O2). Water dynamics and CBF can also be assessed with 17O-MRI by observing the kinetics of signal either from a bolus injection of 17O-labeled water or from metabolically produced from inhaled 17O2 (8,10,11). Most of these studies used spectroscopic imaging methods with Cartesian encoding (10), but alternative 17O-MRI methods have used ultrashort echo time sequences with non-Cartesian encoding (12–14), including the density-adapted three-dimensional (3D) radial pulse sequence (12,13) and the flexible twisted projection imaging acquisition (14). These methods have achieved a spatial resolution of 8 to 8.5 mm and a temporal resolution of 40 to 50 s in humans at high field. However, such spatial and temporal resolution is not sufficient for imaging small rodents.
The aim of this study was to develop a 3D dynamic 17O-MRI method to delineate the kinetics of 17O water uptake and washout in the mouse brain. A stack-of-stars radial sampling method was implemented based on the golden-angle acquisition scheme (15). A k-space–weighted image contrast (KWIC) reconstruction was applied to the acquired data to improve the temporal rate with preserved spatial resolution (16). Simulation studies were performed to validate the method. Using this method, the kinetics of uptake and washout in the brains of mice with glioblastoma (GBM) were delineated after an intravenous bolus injection of . A temporal resolution of 7.56 s with a nominal voxel size of 5.625 μL was achieved in this study.
METHODS
Golden-Ratio–Based Radial Sampling and k-Space–Weighted Image Reconstruction
Because changes in image intensity are determined primarily by the low-frequency data in dynamic imaging, undersampled radial images still retain abundant dynamic information due to the intrinsic oversampling of the center k-space by the radial trajectory. The golden-ratio–based radial profile order was proposed and adopted by various dynamic MRI studies that demanded high temporal and spatial resolutions (15,17,18). Instead of sampling the k-space with evenly spaced radial lines in the order of increasing azimuthal angles from 0 to π (or 2π), a golden-ratio–based profile uses an azimuthal angle spacing of π (or 2π) divided by the golden ratio. This sampling scheme achieves a nearly uniform coverage of k-space with an arbitrary number of spokes, and k-space coverage becomes most uniform when the number of spokes reaches a Fibonacci number (15). Therefore, the golden-ratio–based profile order is extremely flexible, enabling various under-sampling schemes and retrospective selection of an image update rate/temporal resolution for dynamic imaging.
In the current study, a dynamic golden-angle acquisition was combined with KWIC reconstruction to achieve high temporal resolution with preserved spatial resolution (16). To reconstruct a specific time frame, the k-space was segmented into a set of rings (Fig. 1). The central ring consisted of radial spokes acquired at the time frame of interest, with the number of spokes being a Fibonacci number. Moving out in k-space to the next ring, the number of spokes increased to the next Fibonacci number. The radius of each ring was chosen such that the number of spokes in each ring fulfilled the Nyquist sampling criterion (16). Specifically, the k-space filter used in the current study consisted of five rings with 21, 34, 55, 89, and 144 spokes in each ring, respectively, and the outer radius of each ring was 3, 5, 8, 12, and 16, respectively (Fig. 1b). Hence, the filtered data were comprised of a total of 1228 data points in k-space. After the k-space filtering, all images were reconstructed using the nonuniform fast Fourier transform (NUFFT) toolbox (19). The density compensation function was calculated and applied to the data using the method developed by Pipe et al (20) prior to regridding.
FIG. 1.
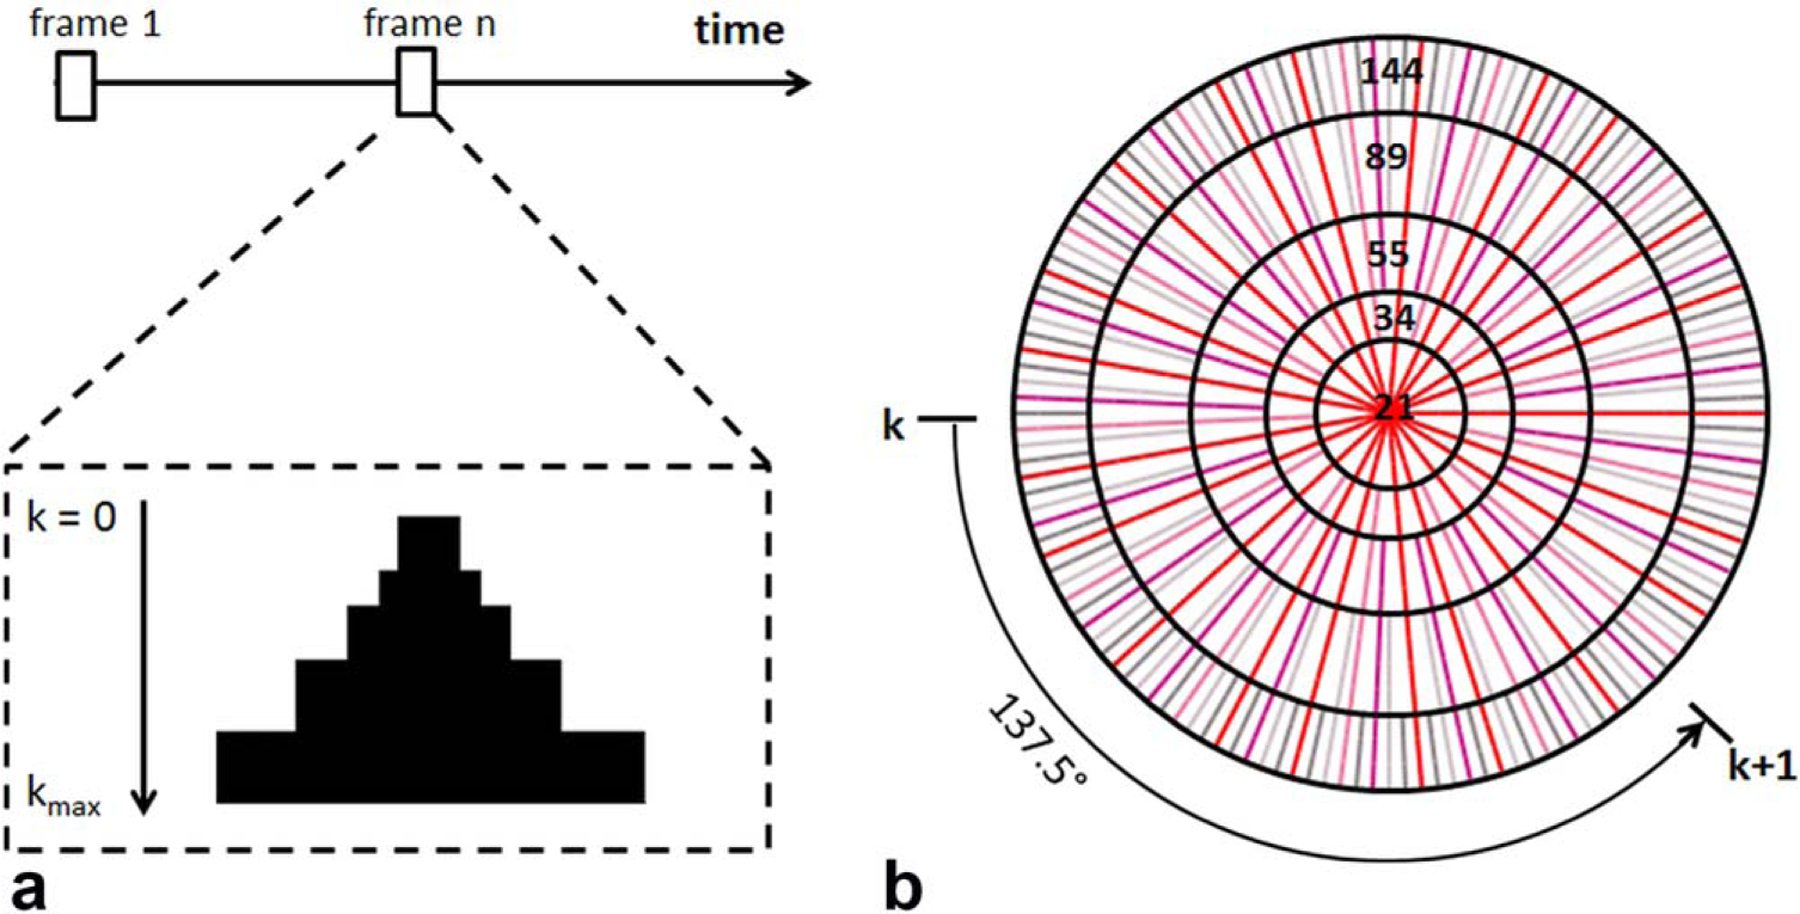
Image reconstruction by k-space filtering. a: Data selection for a specific time frame. Half of the k-space from center to kmax is shown. The k-space filter was shifted by 21 spokes from one time frame to the next. b: k-space filtering with golden-ratio–based profile order. The k-space was segmented into 5 rings with 21 spokes in the central ring. The following rings consisted of 34, 55, 89, and 144 spokes, respectively.
Simulations
To evaluate the impact of k-space filtering on the dynamics of the 17O signal, simulation studies were performed on a modified Shepp-Logan phantom with three compartments. The time course of 17O signal changes in each compartment comprised of three segments representing the three phases of an injection experiment: the baseline with a constant 17O signal, the injection phase with a rapid linear increase, and the washout phase with a monoexponential decay. The duration of baseline, injection, and washout phases was 3, 0.5, and 18 min, respectively. The baseline-normalized peak and steady-state 17O signal and the washout rate used in simulation are listed in Table 1. These values were representative of those observed in normal and tumor tissues in vivo. Using these values, a set of dynamic images was generated with a matrix size of 256 × 256 and a temporal resolution of 0.36 s. Temporal resolution here is defined as the time lapse between the acquisitions of two consecutive spokes in a slice. A total of 3583 images were generated to simulate the entire course of signal changes at baseline, during injection, and during the washout phase.
Table 1.
Simulation Results: Summary of Peak and Steady-State 17O Water Uptake and Washout Rate in Designed Phantom.
| Compartment | Peak 17O Signal | Steady-State 17O Signal | Washout Rate (min−1) |
|---|---|---|---|
| Chosen values | |||
| #1 | 6 | 4 | 1.5 |
| #2 | 5 | 3.5 | 0.8 |
| #3 | 3.5 | 3 | 0.4 |
| Noiseless | |||
| #1 | 6 ± 0.02 | 4 ± 0.01 | 1.5 ± 0.01 |
| #2 | 4.99 ± 0.03 | 3.5 ± 0.01 | 0.79 ± 0.02 |
| #3 | 3.45 ± 0.04 | 2.98 ± 0.01 | 0.38 ± 0.02 |
| SNR = 20 | |||
| #1 | 5.86 ± 0.2 | 3.97 ± 0.16 | 1.51 ± 0.13 |
| #2 | 4.98 ± 0.19 | 3.47 ± 0.13 | 0.81 ± 0.06 |
| #3 | 3.57 ± 0.11 | 3 ± 0.04 | 0.42 ± 0.07 |
| SNR = 10 | |||
| #1 | 5.86 ± 0.35 | 3.98 ± 0.3 | 1.48 ± 0.33 |
| #2 | 4.94 ± 0.45 | 3.46 ± 0.36 | 0.83 ± 0.3 |
| #3 | 3.59 ± 0.16 | 2.96 ± 0.18 | 0.38 ± 0.24 |
SNR = signal-to-noise ratio.
The center one-eighth of k-space for the simulated dynamic images was used to reconstruct dynamic images with a matrix size of 32 × 32. Two experimentally relevant noise levels, corresponding to an SNR of 10 and 20 at baseline, were evaluated by adding random noise to each spoke of the entire dataset. Dynamic images were reconstructed using the k-space filter shown in Figure 1. Peak and steady-state 17O signal maps, as well as the map of washout rate, were generated by pixel-wise fitting of the signal during the washout phase to a monoexponential function. Normalized root mean square error (NRMSE) of the reconstructed maps was calculated against the corresponding noiseless and fully sampled maps.
Phantom Experiments
The point-spread function (PSF) of the proposed acquisition and reconstruction scheme was measured using a point source phantom. A microhematocrit capillary tube with an inner diameter of 1 mm was filled with (21% enrichment) and placed under an 17O surface coil parallel to the z-direction of the magnet. 3D 17O images perpendicular to the z-direction were acquired. The PSF from three approaches was compared: 1) conventional 3D stack-of-stars radial sampling with 100 evenly distributed spokes to fully sample the k-space; 2) 3D stack-of-stars radial sampling using the golden-ratio–based profile order with 100 spokes; 3) 3D stack-of-stars radial sampling using the golden-ratio–based profile order combined with the KWIC reconstruction. Other acquisition parameters were the same for all three sampling schemes: repetition time (TR)/echo time (TE), 9/0.304 ms; field of view (FOV), 4.8 × 4.8 × 1.25 cm3; matrix size, 32 × 32 × 5; number of averages, 16. The full width of half maximum (FWHM) of the PSF was measured to compare the spatial profile of the three approaches.
Animals
All animal procedures were conducted in accordance with the protocol approved by the Institutional Animal Care and Use Committee of Case Western Reserve University. Six to 8-week-old athymic NCR nu/nu male mice (Case Western Reserve University Athymic Animal and Xenograft Research Core) were anesthetized via injection of a freshly prepared mixture of ketamine and xylazine and then placed in a stereotaxic frame equipped with a QSI Ultra pump (Stoelting Co., Wood Dale, IL). A 33-guage microinjection syringe (Hamilton Co., Reno, NV) was preloaded with ~20,000 primary human GBM L2 cancer stem cells in 1 μL, and the cells were injected through a 0.7-mm hole drilled on the scalp of the mouse at a rate of 0.25 μL/min at the following stereotaxic coordinates: anterior to bregma, 0.5 mm; lateral to midline, 1.8 mm; ventral to dura, 2.5 mm, with the bregma set at zero. For the control mice, 1 μL of saline was injected into the same location. The microsyringe remained in place for additional 3 min before being slowly removed. The incision was closed with sutures and the sutures were removed 5 days after the injection.
In Vivo MRI Experiments
MRI studies were performed on a horizontal Biospec 9.4T scanner (Bruker Inc., Billerica, MA). The mouse was initially anesthetized with 3% isoflurane mixed with 100% oxygen, whereas anesthesia was maintained with 0.5 to 1% isoflurane mixed with 100% oxygen. A 29-gauge catheter was inserted into the tail vein for the injection of 200 μL of 17O water (13% enrichment) in 20 to 25 s. The mouse was then placed in the cradle in a prone position, and the respiration rate and body temperature were monitored during the experiments. The body temperature was maintained at 35 °C by blowing warm air into the scanner through a feedback control system (SA Instruments, Stony Brook, NY).
1H images were acquired using a 3-cm birdcage coil (Bruker Inc.) with a 2.5-cm diameter 17O surface coil built in-house and placed on top of the mouse head for 17O image acquisition. Multislice, T2-weighted, axial 1H images were acquired using a rapid acquisition with relaxation enhancement sequence with the following parameters: TR, 2 s; effective TE, 48 ms; echo spacing, 16 ms; echo train length, 8; FOV, 2.4 × 2.4 cm2; slice thickness, 1 mm; matrix size, 256 × 256; number of averages, 16; number of slices, 5; inter-slice gap, 1.5 mm.
17O images were acquired using a 3D stack-of-stars short echo-time sequence. A total of five radially encoded stacks of data were collected to cover the cylindrical 3D k-space. A 90 ° radiofrequency pulse of 120-μs duration was used for excitation, followed by a 110-μs phase-encoding gradient to achieve short echo time. Radial sampling of the k-space used a constant azimuthal angle spacing of 137.5 °, the equivalent of 360 ° divided by the golden ratio (15,21). Each spoke sampled 16 data points starting from the center of the k-space and reached a maximum k value (kmax) of 0.33 mm−1, with a receiver bandwidth of 8000 Hz. No spoiler gradient was used because of the short T2 of the 17O signal. Seven fully sampled datasets (100 spokes/slice) were acquired before injection, and data acquisition continued for another ~22 min after the injection. A total of 21,600 spokes in the 3D k-space were acquired continuously. Other imaging parameters were: TR/TE, 9/0.367 ms; FOV, 4.8 × 4.8 × 1.25 cm3; matrix size, 32 × 32 × 5; number of averages, 8. These parameters gave rise to a nominal voxel size of 5.625 μL.
Image Reconstruction and Analysis
Image reconstruction and analysis used software developed in-house written in MATLAB (Mathworks, Natick, MA). The k-space filter was shifted by 21 spokes from one time frame to the next, leading to an effective temporal resolution of 7.56 s. After density compensation and regridding, each slice was zero padded to a matrix size of 64 × 64 and Fourier transformed to yield 3D images.
Once image reconstruction was completed, 17O images were coregistered with the T2-weighted 1H images. Tumor areas showed higher signal intensity in T2-weighted 1H images due to having a longer T2 than normal brain tissue. Appropriate regions of interest (ROIs) that encompassed the tumor and normal brain tissue were drawn manually from T2-weighted 1H images. Total tumor and brain volumes were calculated by adding the tumor and brain areas in all five slices. The percentage of tumor volume was calculated as the tumor volume divided by total brain volume. Mice with > 30% tumor volume were classified as the GBM-large (GBM-L) group, and mice with <30% tumor volume were designated as the GBM-moderate (GBM-M) group. Control mice had a single ROI that covered the entire brain. The 17O signal was normalized by the corresponding natural abundance 17O signal acquired before injection. Peak uptake was identified as the maximal signal intensity following injection. The normalized time course of the 17O signal from peak uptake to the end of the measurement was fit to a monoexponential function in a pixel-wise fashion to generate the maps of peak and steady-state uptake, as well as its washout rate. Mean values for each ROI were calculated for each map. In tissue with no obvious washout phase or even continued accumulation of after the injection, washout rate was set to zero, while peak and steady-state uptake was calculated as the normalized 17O signals immediately after injection and at the end of measurement, respectively.
Histology
After the MRI experiments, all mice with tumor were anesthetized with a mixture of ketamine and xylazine and fixed by transcardial perfusion with 4% paraformaldehyde. The brain was then excised and fixed for another 72 hours. The olfactory bulbs, a small portion of the rostral cortex leading up to the tumor injection site, and the cerebellum were trimmed after the fixation. The brains were cryoprotected in 30% sucrose for 48 to 72 hours, followed by 1:1, 30% sucrose: O.C.T. compound (Fisher Scientific, Pittsburg, PA) for another 48 to 72 hours. The tissue was then embedded in O.C.T. compound, frozen with liquid nitrogen, and sectioned into 8-μm-thick coronal sections that were then stained with hematoxylin and eosin staining.
Statistics
All results are reported as mean ± standard deviation, and two-way analysis of variance was used for data comparison. If statistical differences were detected, multiple pairwise comparisons were performed using a two-tailed Student t-test. An unpaired two-tailed Student t-test was used to compare the peak and steady-state uptake and the washout rate among the three groups of mice. A paired two-tailed Student t-test was used to compare the parameters between tumor and nontumor tissue in the same group for GBM-L and GBM-M mice. Significant difference was accepted at P < 0.05.
RESULTS
Simulations
Figure 2 shows the effects of the k-space filter on the estimation of the peak and steady-state 17O signal and the washout rate at two different noise levels. The mean values in the three compartments are summarized in Table 1. With an SNR of 20 at baseline, the NRMSE of the peak uptake and steady-state 17O signal and the washout rate was 1.36%, 1.52%, and 4.01%, respectively. A decrease in SNR led to a corresponding increase in the NRMSE to 1.8%, 2.19%, and 5.34% for the same measurements. Consistent with the increase in NRMSE, the estimated parameters also showed larger variations at lower SNR. However, mean values of the estimated parameters showed unbiased estimation at different noise levels. These results suggest that the KWIC reconstruction method combined with the golden-ratio–based radial sampling is capable of delineating the dynamics of 17O signal even with relatively low SNR.
FIG. 2.
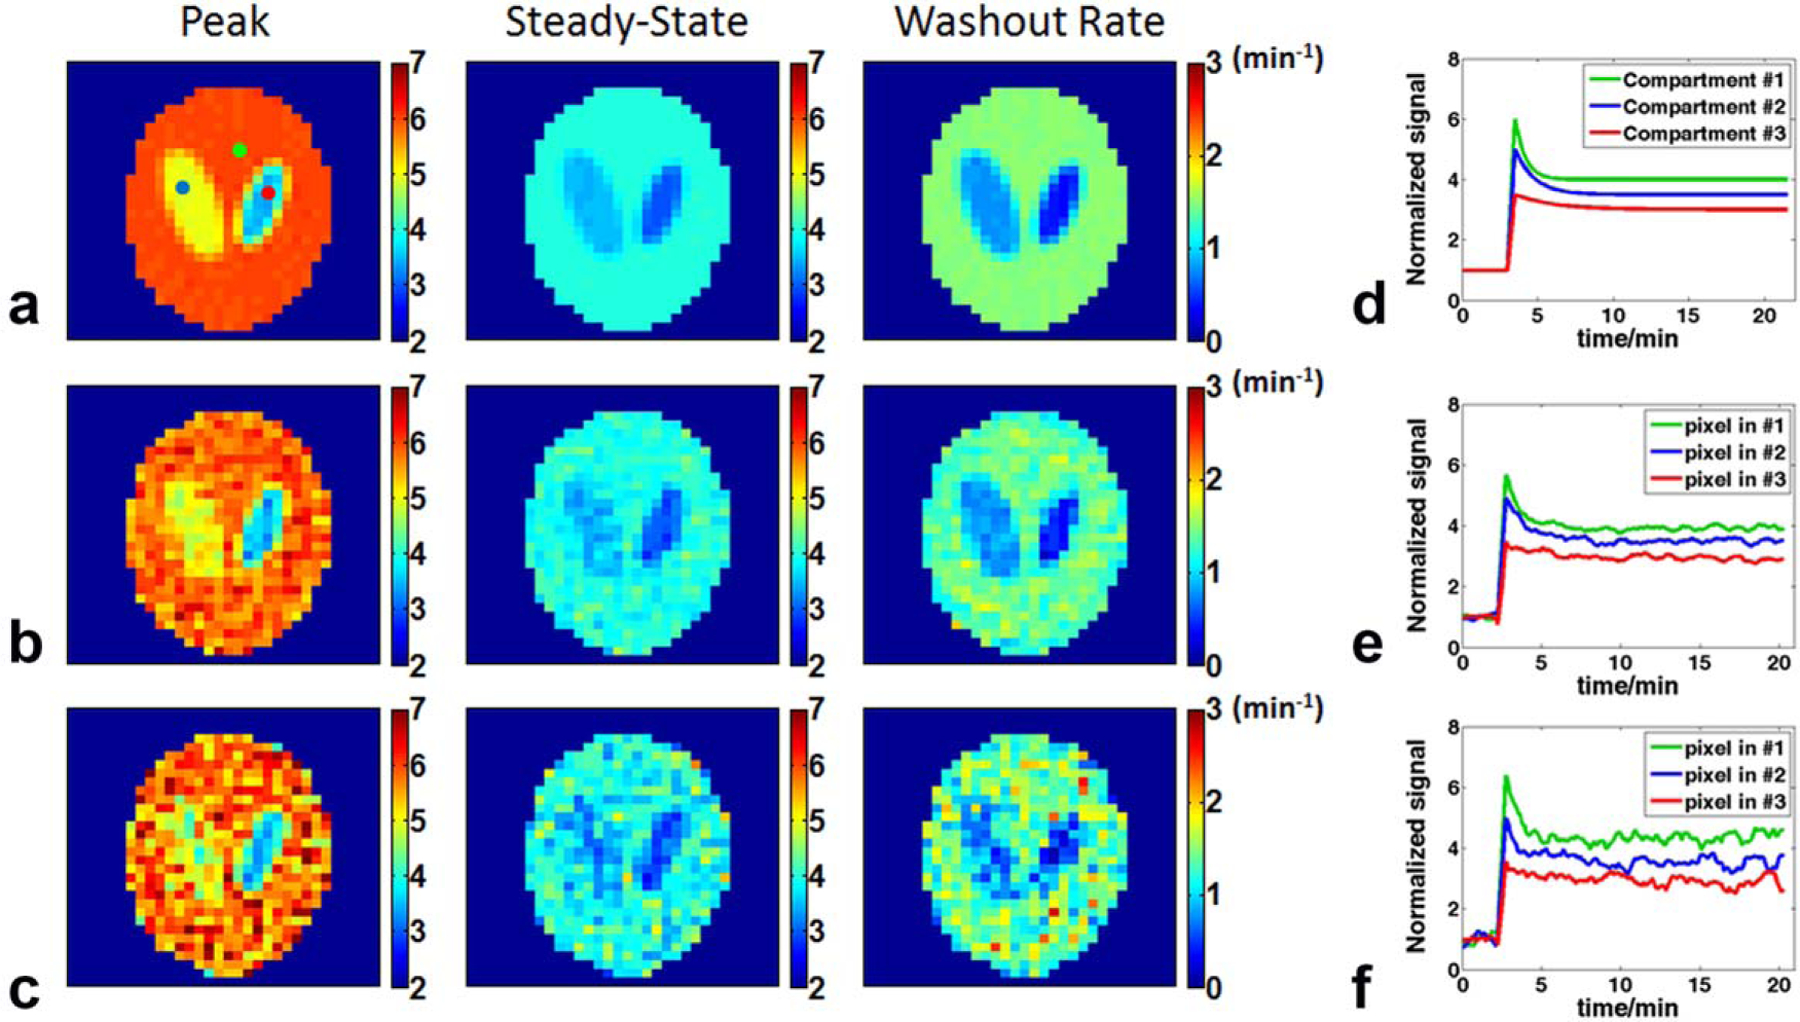
Simulation results at two different noise levels. a: Maps of peak and steady-state uptake and washout rate generated from noiseless data. b: Data with a baseline SNR of 20. c: Data with a baseline SNR of 10. d: Simulated, noise-free time courses of the signal changes in the three compartments. e, f: Time courses of the representative pixels in each of the three compartments with a baseline SNR of 20 (e) and 10 (f). The selected pixels are indicated by colored dots in (a). SNR = signal-to-noise ratio.
Phantom Experiments
The measured PSF using a point source phantom is shown in Figure 3. Compared to the conventional radial sampling scheme with full k-space coverage, the area of the PSF at FWHM was 10% larger using the golden-ratio–based sampling with and without KWIC reconstruction (4.5 mm2 vs. 4.1 mm2), suggesting that the difference in PSF was caused by the golden-ratio–based sampling rather than KWIC reconstruction. Based on the measured PSF, the true voxel size using the golden-ratio–based sampling with KWIC reconstruction was approximately 11.25 μL (4.5 mm2 in-plane and 2.5 mm in the phase encoding direction).
FIG. 3.
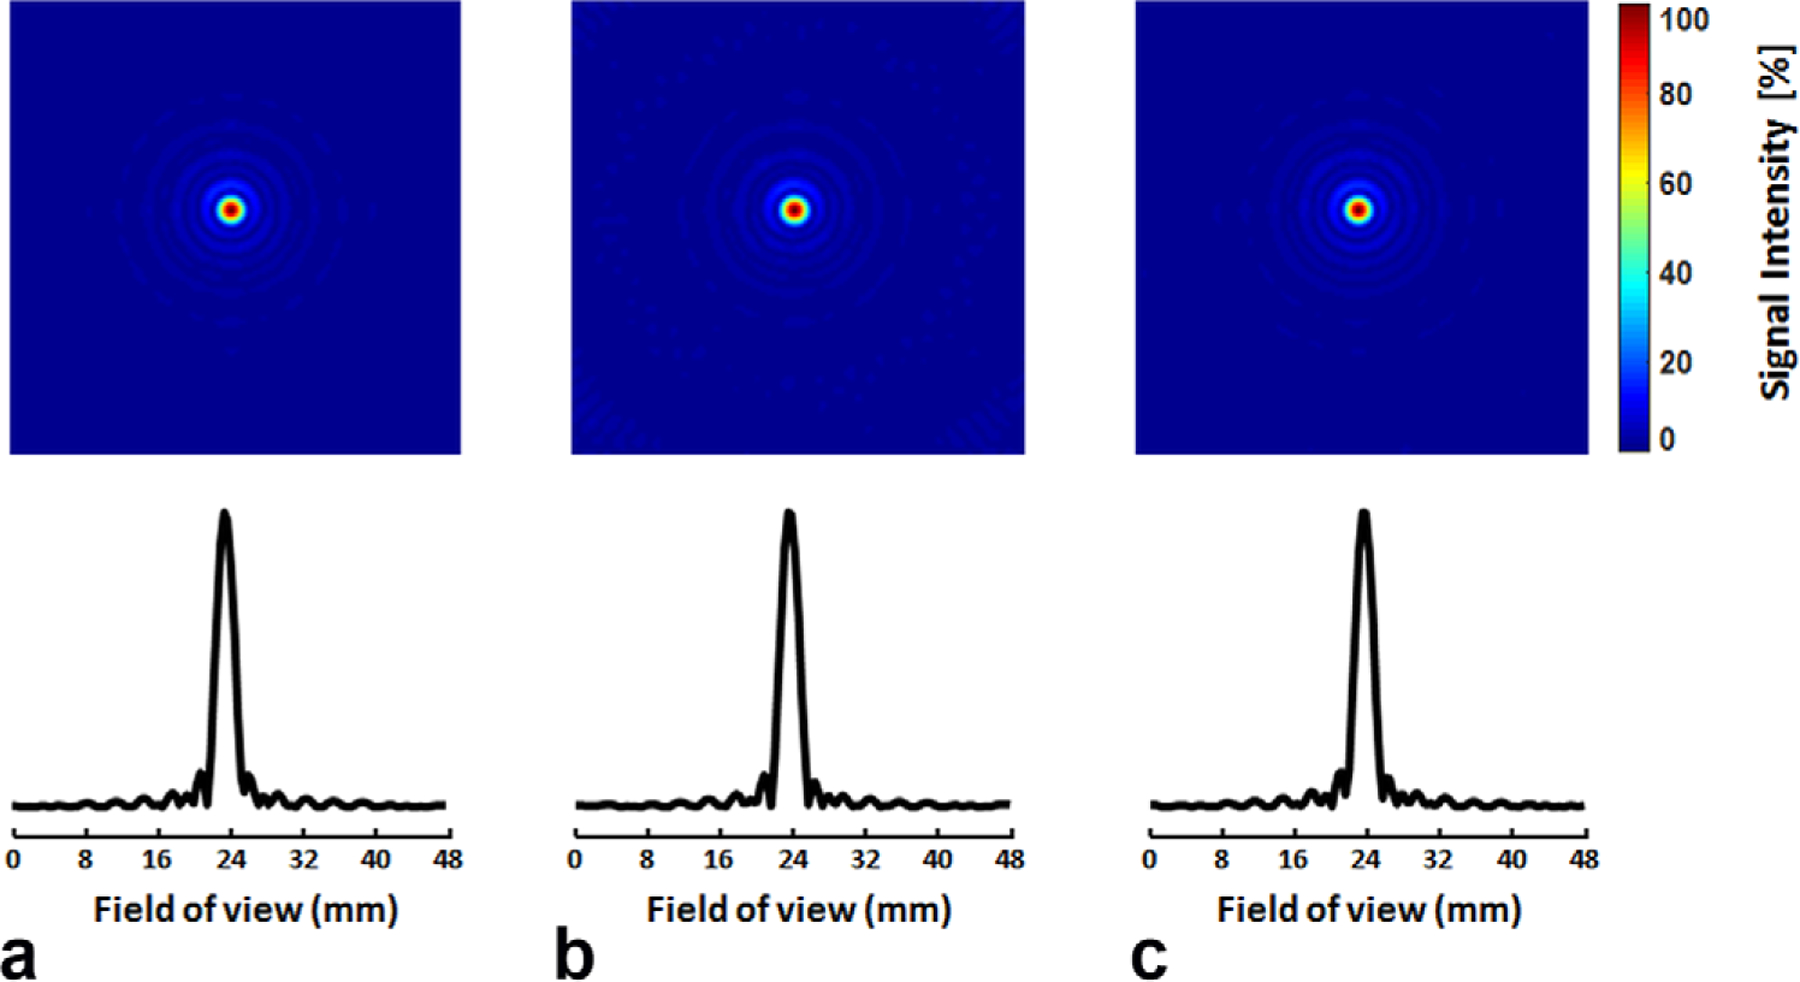
Point-spread function-measured from a point source phantom. a: Conventional radial sampling with 100 spokes. b: Golden-ratio–based radial sampling with 100 spokes. c: Golden-ratio–based radial sampling combined with the k-space filtering. Top: 2D maps. Bottom: 1D profiles.
In Vivo Results
A total of 15 mice were scanned in the current study, with six in the GBM-L group, four in the GBM-M group, and five in the control group. Representative T2-weighted images and their corresponding histological staining in GBM-L and GBM-M groups are shown in Figure 4. The age of the mice at the time of the MRI scans was 37.3 ± 2.5 weeks, 34.6 ± 2.1 weeks, and 11.5 ± 0.6 weeks for GBM-L, GBM-M, and the control group, respectively. Average body weight of the mice at the time of MRI experiments was 32.1 ± 5.9 g, 35.6 ± 3.3 g, and 31.4 ± 2.4 g for GBM-L, GBM-M, and the control group, respectively.
FIG. 4.
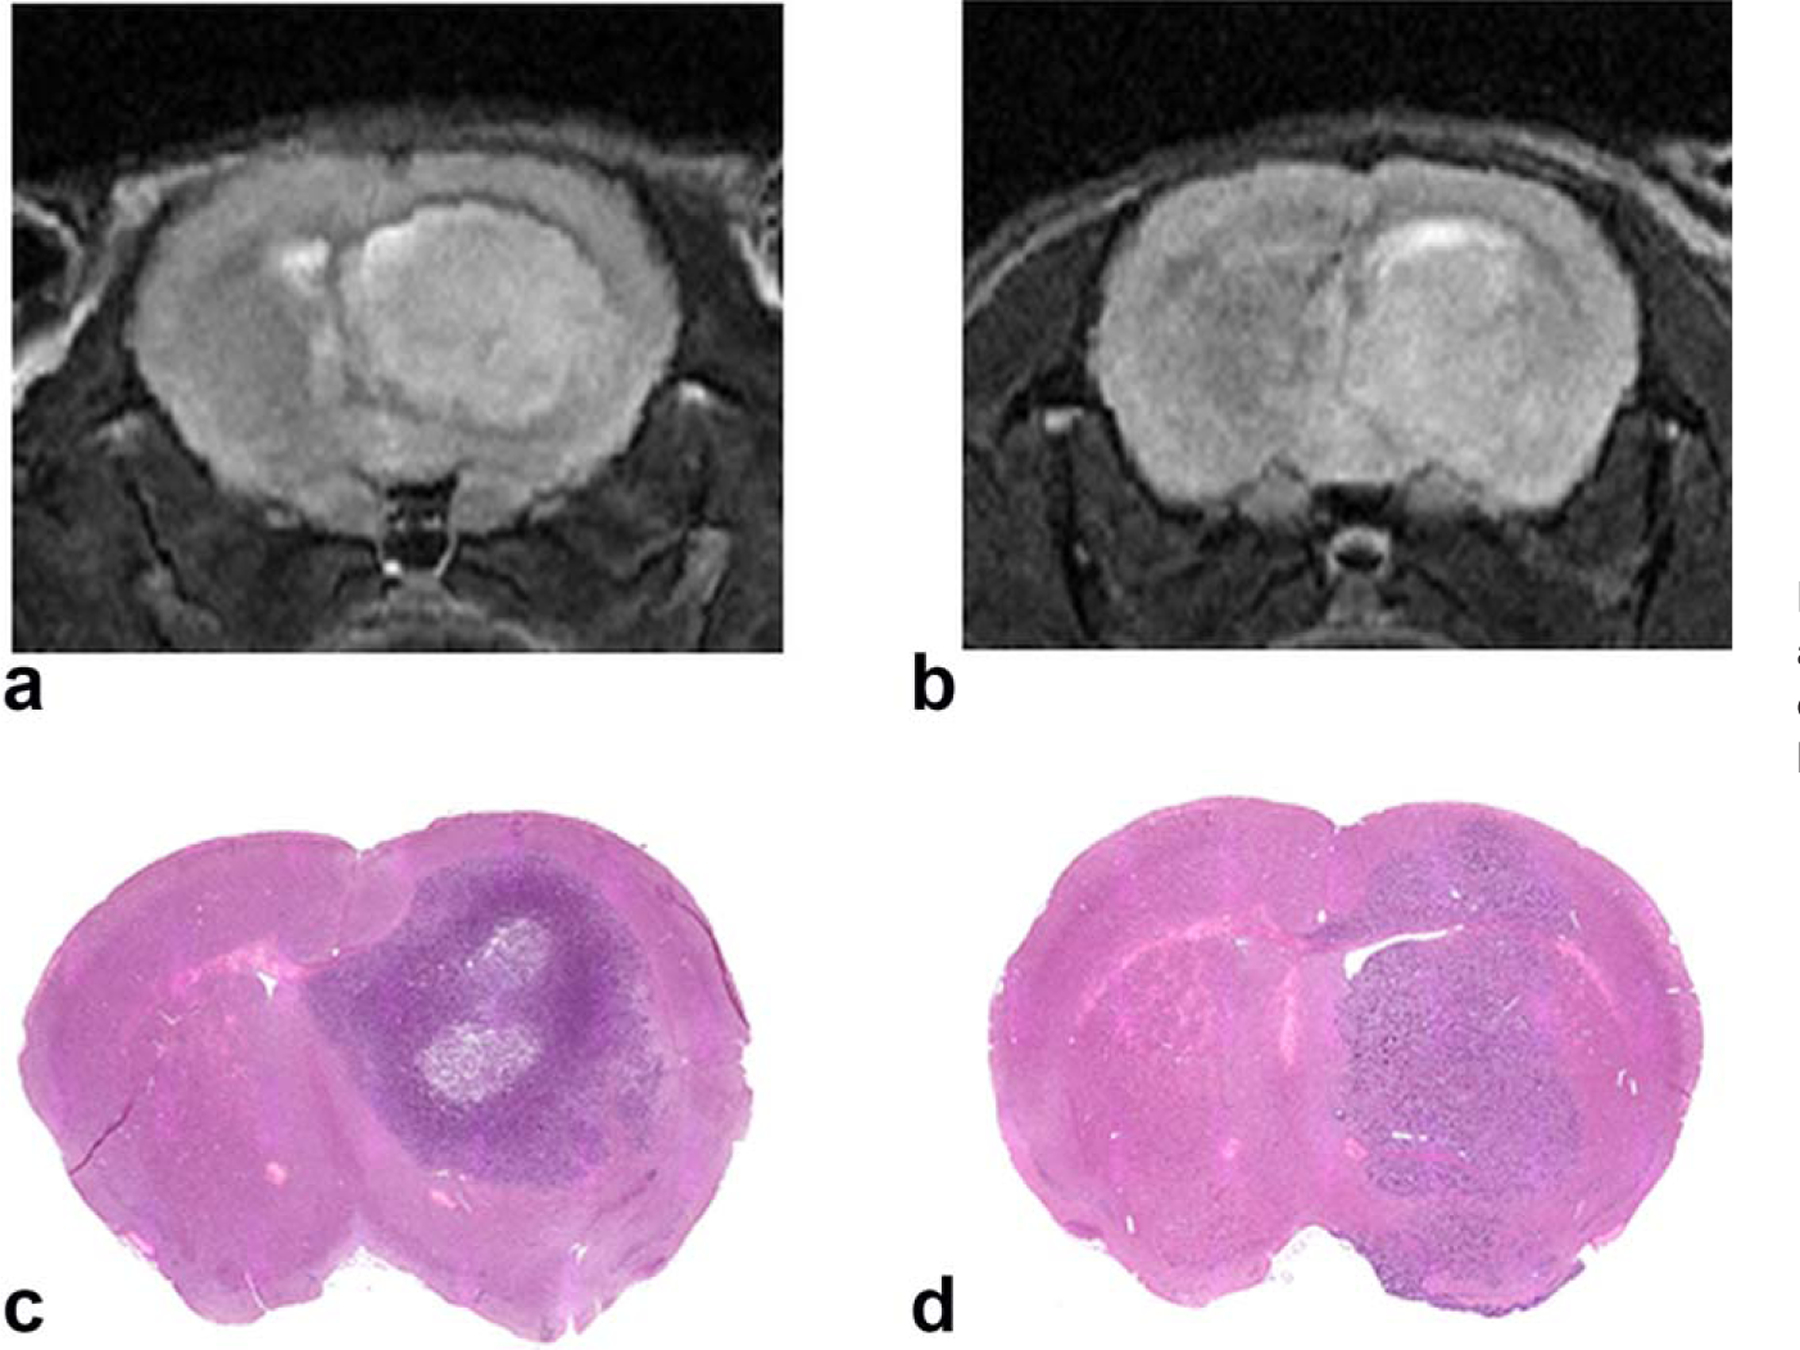
Representative T2-weighted images and their corresponding hematoxylin and eosin staining in mice with glioblastoma-large (a, c) and glioblastoma-moderate (b, d).
17O images from a control mouse, KWIC versus standard reconstruction, are shown in Figure 5. At baseline and steady-state, the SNR of KWIC-reconstructed images was similar to that using standard reconstruction (10 for both methods at baseline, 30 vs. 32 at steady state). At peak uptake, image reconstructed without k-space filtering failed to capture the rapid increase in 17O signal. As a result, the signal intensity in images with the standard reconstruction was only ~75% of that using KWIC reconstruction.
FIG. 5.
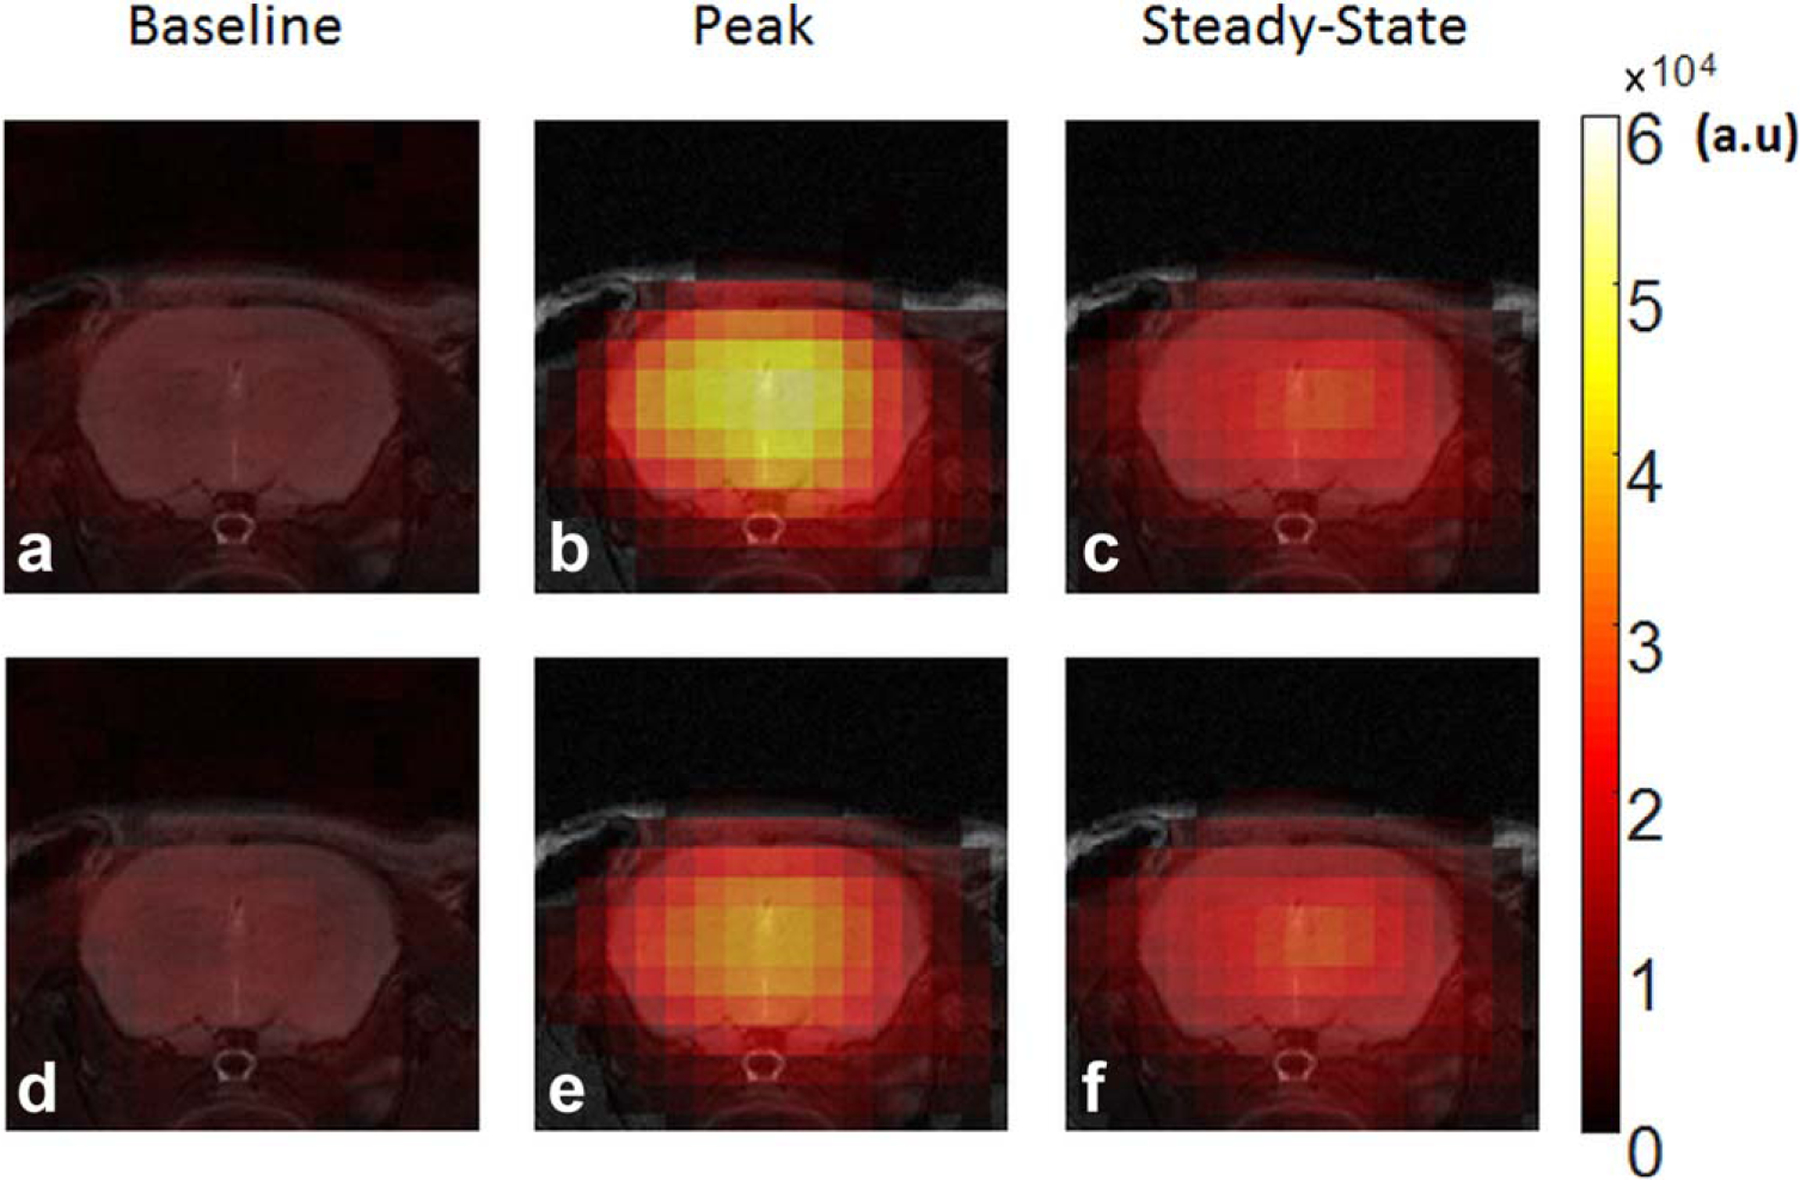
Representative 17O images from a control mouse at baseline, peak and steady-state uptake. a–c: k-space–weighted image contrast reconstruction. d–f: Standard reconstruction using 100 spokes.
Figure 6 shows representative maps of peak and steady-state uptake and washout rate from each group with typical time courses of 17O signal observed in tumor and normal brain tissue. Group-averaged peak and steady-state uptake and washout rate are shown in Figure 7. Baseline-normalized peak and steady-state uptake in the brain of the control mice were 6.52 ± 0.86 and 3.36 ± 0.2, respectively, and the washout rate was 1.36 ± 0.28 min−1. GBM mice showed more heterogeneous 17O signal kinetics when compared to the control animals. In the GBM-M group, tumor tissue exhibited significantly reduced peak uptake (5.45 ± 0.87, P < 0.05) and decreased washout rate (0.88 ± 0.28 min−1, P < 0.05), suggesting decreased perfusion to the tumor. However, 17O signal kinetics in the brain tissue were the same as the controls. On the contrary, GBM-L mice showed reduced uptake and washout rate in both the tumor and the brain tissues. In the tumor tissue, no obvious washout phase, or even continued accumulation of , was observed after the injection.
FIG. 6.
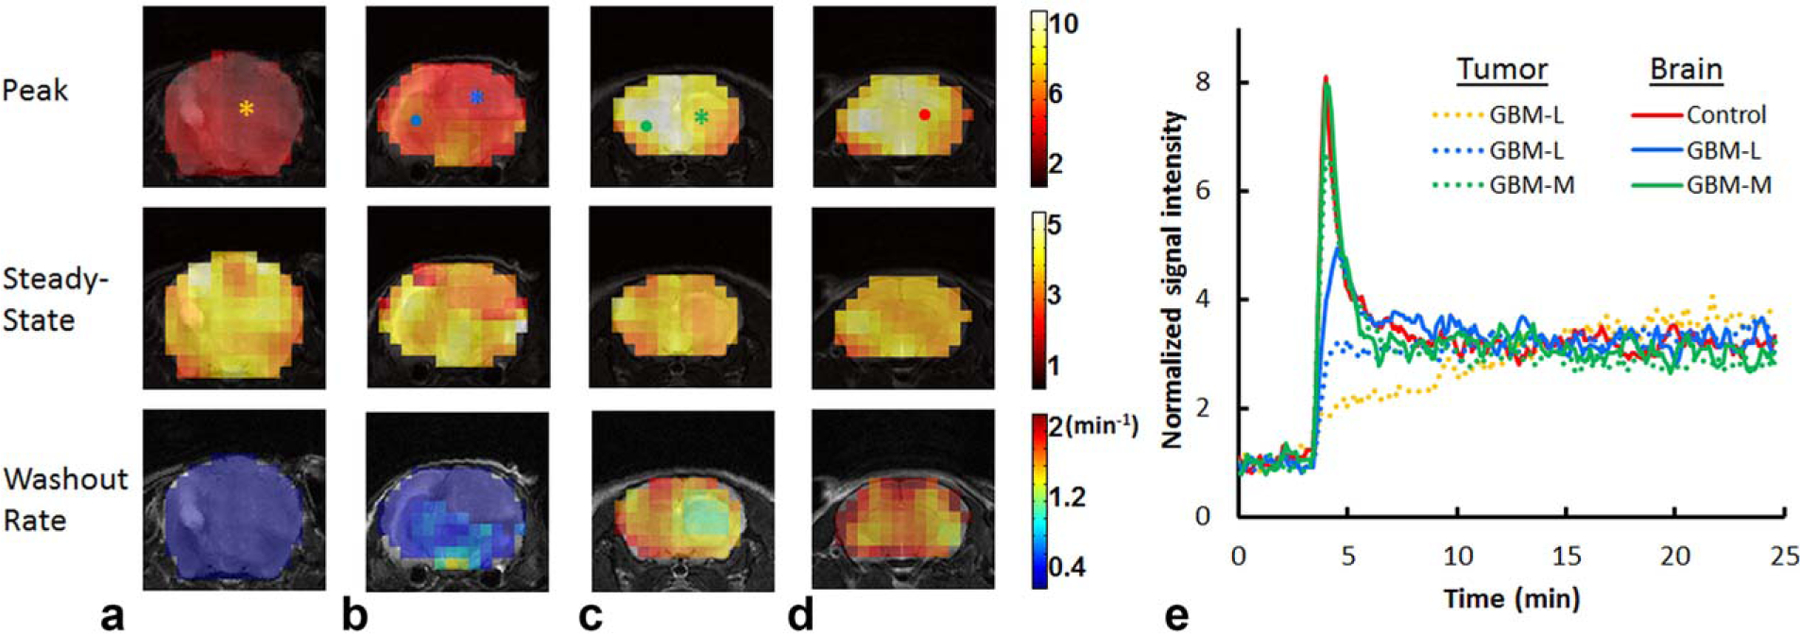
Reconstructed parameter maps and representative time courses. a, b: glioblastoma-large mice. c: glioblastoma-moderate mouse. d: Control mouse. e: Time courses of normalized 17O signal changes in representative pixels indicated in (a–d). Tumor pixels are indicated by asterisks in (a–c) and their time courses are shown as dotted lines. Brain pixels are indicated by dots in (b–d) and their time courses are shown as solid lines. GBM-L = glioblastoma-large; GBM-M = glioblastoma-moderate.
FIG. 7.

Group-averaged peak (a) and steady-state (b) uptake and washout rate (c). *P < 0.05. GBM-L = glioblastoma-large; GBM-M = glioblastoma-moderate.
DISCUSSION AND CONCLUSIONS
In the current study, a dynamic 17O imaging method with a golden-ratio–based radial sampling profile and KWIC reconstruction was developed and validated in simulation studies. The utility of this method in delineating altered water movement in the brain was demonstrated in a mouse model of GBM. The kinetics of uptake and washout after an intravenous bolus injection of were characterized by monitoring the 17O signal directly with MRI. A temporal resolution of 7.56 s with a nominal voxel size of 5.625 μL was achieved at 9.4 T. Tumor tissue displayed a reduced peak uptake and a diminished washout rate.
Similar to (22,23), the kinetics of after a bolus injection are dominated by cerebral blood flow (10,11). As such, the reduced peak uptake and slower washout rate observed in the tumor tissue is likely due to compromised perfusion resulting from peritumoral edema (24–26). Continued accumulation of during the washout phase was also observed in GBM-L mice, indicating impaired routes of water efflux in tumor tissues. Interestingly, GBM-L mice also exhibited significantly reduced peak uptake and prolonged washout in the nontumor region, suggesting that cerebral perfusion to normal brain tissue was also reduced in GBM-L mice. This reduction is likely caused by compression from the large tumor. Future studies with further evaluation of cerebral perfusion and grading of GBM will allow more precise delineation of the underlying mechanisms.
KWIC reconstruction was first proposed by Song and Dougherty to manipulate T2-weighted image contrast from a single image dataset (16). The application of the KWIC reconstruction method in dynamic imaging is facilitated by combining it with a golden-ratio–based radial sampling profile (15,27). An advantage of the golden-angle sampling and KWIC reconstruction is the flexibility to retrospectively choose the temporal rate for the reconstructed images. Golden-ratio–based radial sampling enables quick updates of the center k-space so that no a priori knowledge of the expected kinetics is needed at the stage of data acquisition. A specific k-space filter can be chosen in postprocessing for optimal data reconstruction. In principle, any k-space filter that satisfies the Nyquist criterion can be used. With a golden-ratio–based sampling profile, both SNR and k-space coverage are optimal when the number of spokes is a Fibonacci number (15). Hence, a k-space filter designed using Fibonacci numbers allows for satisfaction of the Nyquist criterion with the minimal number of spokes and is optimal for dynamic studies that require high temporal resolution. There is sufficient flexibility in choosing the number of spokes for a specific temporal resolution, because the difference between two adjacent Fibonacci numbers increases gradually. In the current study, a k-space filter with 21 spokes in the central ring was used, leading to an effective temporal resolution of 7.56 s. An alternative filter with fewer spokes in the central ring can also be used if a higher temporal resolution is more desirable.
Dynamic hetero-nuclei imaging has been hindered by low SNR because of low nuclei abundance and signal sensitivity. Frequently, a large number of signal averages is used to achieve adequate SNR. However, it is at the cost of reduced temporal resolution. Alternatively, SNR can be gained by reducing spatial resolution, which increases the partial volume effect and may not be a feasible approach for small animal imaging. Using magnetic resonance spectroscopic imaging with Cartesian encoding, Zhu et al reported a temporal resolution of 11 s with a voxel size of 40 μL (15 μL nominal) at 11.7 T in an inhalation study on stroked mice (8). In another study, Cui and colleagues quantified CMRO2 in mouse brain at 16.4 T with a temporal resolution of 15.4 s and a voxel size of 26 μL (9 μL nominal) (9). In the current study, we were able to achieve an effective temporal resolution of 7.56 s with a voxel size of 11.25 μL (5.625 μL nominal) at 9.4 T.
The flexibility of choosing a k-space filter to achieve adequate temporal resolution allows application of this method to quantify CMRO2 in 17O2 inhalation studies. For a typical 17O2 inhalation study, only a small amount of gas is delivered in ~2 min to reduce the cost for 17O2 (8,9). Having a reduced amount of 17O2 available in vivo causes reduced signal increases, leading to lower SNR at peak and steady-state. On the other hand, the rate of 17O signal increase during an inhalation study is significantly slower than that in an injection study. Therefore, the decreased SNR can be compensated with increased signal averages, as the kinetics of 17O signal in an inhalation study can be fully captured with a lower temporal resolution. A previous study on mice suggests that a 15-s temporal resolution is adequate for an inhalation study (9). Achieving this temporal resolution would allow the current study to collect twice as many signal averages to compensate for the reduced SNR due to using inhaled 17O2. Furthermore, a different k-space filter with fewer spokes in the central ring (e.g., 13) can also be used to optimize the tradeoff among SNR, spatial, and/or temporal resolution.
In conclusion, this study demonstrated a promising dynamic 17O-MRI approach for mouse imaging with high spatial and temporal resolution. It provides a robust and flexible imaging approach to study water movement and oxygen metabolism in the brain under normal and diseased conditions.
ACKNOWLEDGMENTS
The authors thank Dr. Daniel Silver and Dr. Justin Lathia of the Cleveland Clinic Foundation for providing the primary GBM L2 cell line. The authors also want to thank Mr. Christian Anderson for proofreading this manuscript.
REFERENCES
- 1.Hladky SB, Barrand MA. Mechanisms of fluid movement into, through and out of the brain: evaluation of the evidence. Fluids Barriers CNS 2014;11:26. [DOI] [PMC free article] [PubMed] [Google Scholar]
- 2.Williams DS, Detre JA, Leigh JS, Koretsky AP. Magnetic resonance imaging of perfusion using spin inversion of arterial water. Proc Natl Acad Sci U S A 1992;89:212–216. [DOI] [PMC free article] [PubMed] [Google Scholar]
- 3.Zhang K, Herzog H, Mauler J, et al. Comparison of cerebral blood flow acquired by simultaneous [(15)O]water positron emission tomography and arterial spin labeling magnetic resonance imaging. J Cereb Blood Flow Metab 2014;34:1373–1380 [DOI] [PMC free article] [PubMed] [Google Scholar]
- 4.Igarashi H, Suzuki Y, Kwee IL, Nakada T. Water influx into cerebrospinal fluid is significantly reduced in senile plaque bearing transgenic mice, supporting beta-amyloid clearance hypothesis of Alzheimer’s disease. Neurol Res 2014;36:1094–1098. [DOI] [PMC free article] [PubMed] [Google Scholar]
- 5.Wiesner HM, Balla DZ, Shajan G, Scheffler K, Uğurbil K, Chen W, Uludağ K, Pohmann R. 17O relaxation times in the rat brain at 16.4 tesla. Magn Reson Med 2016;75:1886–1893. [DOI] [PMC free article] [PubMed] [Google Scholar]
- 6.Zhu X-H, Zhang Y, Zhang N, Ugurbil K, Chen W. Noninvasive and three-dimensional imaging of CMRO2 in rats at 9.4 T: reproducibility test and normothermia/hypothermia comparison study. J Cereb Blood Flow Metab 2006;27:1225–1234. [DOI] [PubMed] [Google Scholar]
- 7.Zhu X-H, Zhang N, Zhang Y, Uğurbil K, Chen W. New insights into central roles of cerebral oxygen metabolism in the resting and stimulus-evoked brain. J Cereb Blood Flow Metab 2009;29: 10–18. [DOI] [PMC free article] [PubMed] [Google Scholar]
- 8.Zhu X-H, Chen JM, Tu T-W, Chen W, Song S-K. Simultaneous and noninvasive imaging of cerebral oxygen metabolic rate, blood flow and oxygen extraction fraction in stroke mice. Neuroimage 2013;64: 437–447. [DOI] [PMC free article] [PubMed] [Google Scholar]
- 9.Cui W, Zhu X-H, Vollmers ML, Colonna ET, Adriany G, Tramm B, Dubinsky JM, Oz G. Non-invasive measurement of cerebral oxygen metabolism in the mouse brain by ultra-high field (17)O MR spectroscopy. J Cereb Blood Flow Metab 2013;33:1846–1849. [DOI] [PMC free article] [PubMed] [Google Scholar]
- 10.Zhu X-H, Zhang Y, Tian R-X, Lei H, Zhang N, Zhang X, Merkle H, Ugurbil K, Chen W. Development of (17)O NMR approach for fast imaging of cerebral metabolic rate of oxygen in rat brain at high field. Proc Natl Acad Sci U S A 2002;99:13194–13199. [DOI] [PMC free article] [PubMed] [Google Scholar]
- 11.Zhu XH, Zhang Y, Wiesner HM, Ugurbil K, Chen W. In vivo measurement of CBF using 17O NMR signal of metabolically produced H217O as a perfusion tracer. Magn Reson Med 2013;70:309–314. [DOI] [PMC free article] [PubMed] [Google Scholar]
- 12.Kurzhunov D, Borowiak R, Hass H, Wagner P, Krafft AJ, Timmer J, Bock M. Quantification of oxygen metabolic rates in Human brain with dynamic (17) O MRI: Profile likelihood analysis. Magn Reson Med doi: 10.1002/mrm.26476. [DOI] [PubMed] [Google Scholar]
- 13.Hoffmann SH, Radbruch A, Bock M, Semmler W, Nagel AM. Direct 17O MRI with partial volume correction: first experiences in a glioblastoma patient. Magn Reson Mater Physics Biol Med 2014;27: 579–587. [DOI] [PubMed] [Google Scholar]
- 14.Atkinson IC, Thulborn KR. Feasibility of mapping the tissue mass corrected bioscale of cerebral metabolic rate of oxygen consumption using 17-oxygen and 23-sodium MR imaging in a human brain at 9.4 T. Neuroimage 2010;51:723–733. [DOI] [PubMed] [Google Scholar]
- 15.Winkelmann S, Schaeffter T, Koehler T, Eggers H, Doessel O. An optimal radial profile order based on the Golden Ratio for time-resolved MRI. IEEE Trans Med Imaging 2007;26:68–76. [DOI] [PubMed] [Google Scholar]
- 16.Song HK, Dougherty L. k-Space weighted image contrast (KWIC) for contrast manipulation in projection reconstruction MRI. Magn Reson Med 2000;44:825–832. [DOI] [PubMed] [Google Scholar]
- 17.Feng L, Grimm R, Block KT obias, Chandarana H, Kim S, Xu J, Axel L, Sodickson DK, Otazo R. Golden-angle radial sparse parallel MRI: combination of compressed sensing, parallel imaging, and golden-angle radial sampling for fast and flexible dynamic volumetric MRI. Magn Reson Med 2014;72:707–717. [DOI] [PMC free article] [PubMed] [Google Scholar]
- 18.Song HK, Yan L, Smith RX, Xue Y, Rapacchi S, Srinivasan S, Ennis DB, Hu P, Pouratian N, Wang DJJ. Noncontrast enhanced four-dimensional dynamic MRA with golden angle radial acquisition and K-space weighted image contrast (KWIC) reconstruction. Magn Reson Med 2014;72:1541–1551. [DOI] [PMC free article] [PubMed] [Google Scholar]
- 19.Fessler JA, Sutton BP. Nonuniform fast fourier transforms using min-max interpolation. IEEE Trans Signal Process 2003;51:560–574. [Google Scholar]
- 20.Pipe JG, Menon P. Sampling density compensation in MRI: Rationale and an iterative numerical solution. Magn Reson Med 1999;41: 179–186. [DOI] [PubMed] [Google Scholar]
- 21.Yu J, Xue Y, Song HK. Comparison of lung T2* during free-breathing at 1.5 T and 3.0 T with ultrashort echo time imaging. Magn Reson Med 2011;66:248–254. [DOI] [PMC free article] [PubMed] [Google Scholar]
- 22.Herscovitch P, Markham J, Raichle ME. Brain blood flow measured with intravenous H2(15)O. I. Theory and error analysis. J Nucl Med 1983;24:782–789. [PubMed] [Google Scholar]
- 23.Raichle ME, Martin WR, Herscovitch P, Mintun MA, Markham J. Brain blood flow measured with intravenous H2(15)O. II. Implementation and validation. J Nucl Med 1983;24:790–798. [PubMed] [Google Scholar]
- 24.Kalpathy-Cramer J, Gerstner ER, Emblem KE, Andronesi OC, Rosen B. Advanced magnetic resonance imaging of the physical processes in human Glioblastoma. Cancer Res 2014;74:4622–4637. [DOI] [PMC free article] [PubMed] [Google Scholar]
- 25.Hossmann KA, Bloink M. Blood flow and regulation of blood flow in experimental peritumoral edema. Stroke 1981;12:211–217. [DOI] [PubMed] [Google Scholar]
- 26.Steen RG. Edema and tumor perfusion: characterization by quantitative 1H MR imaging. AJR Am J Roentgenol 1992;158:259–264. [DOI] [PubMed] [Google Scholar]
- 27.Lin W, Guo J, Rosen MA, Hee KS. Respiratory motion-compensated radial dynamic contrast-enhanced (DCE)-MRI of chest and abdominal lesions. Magn Reson Med 2008;60:1135–1146. [DOI] [PMC free article] [PubMed] [Google Scholar]


