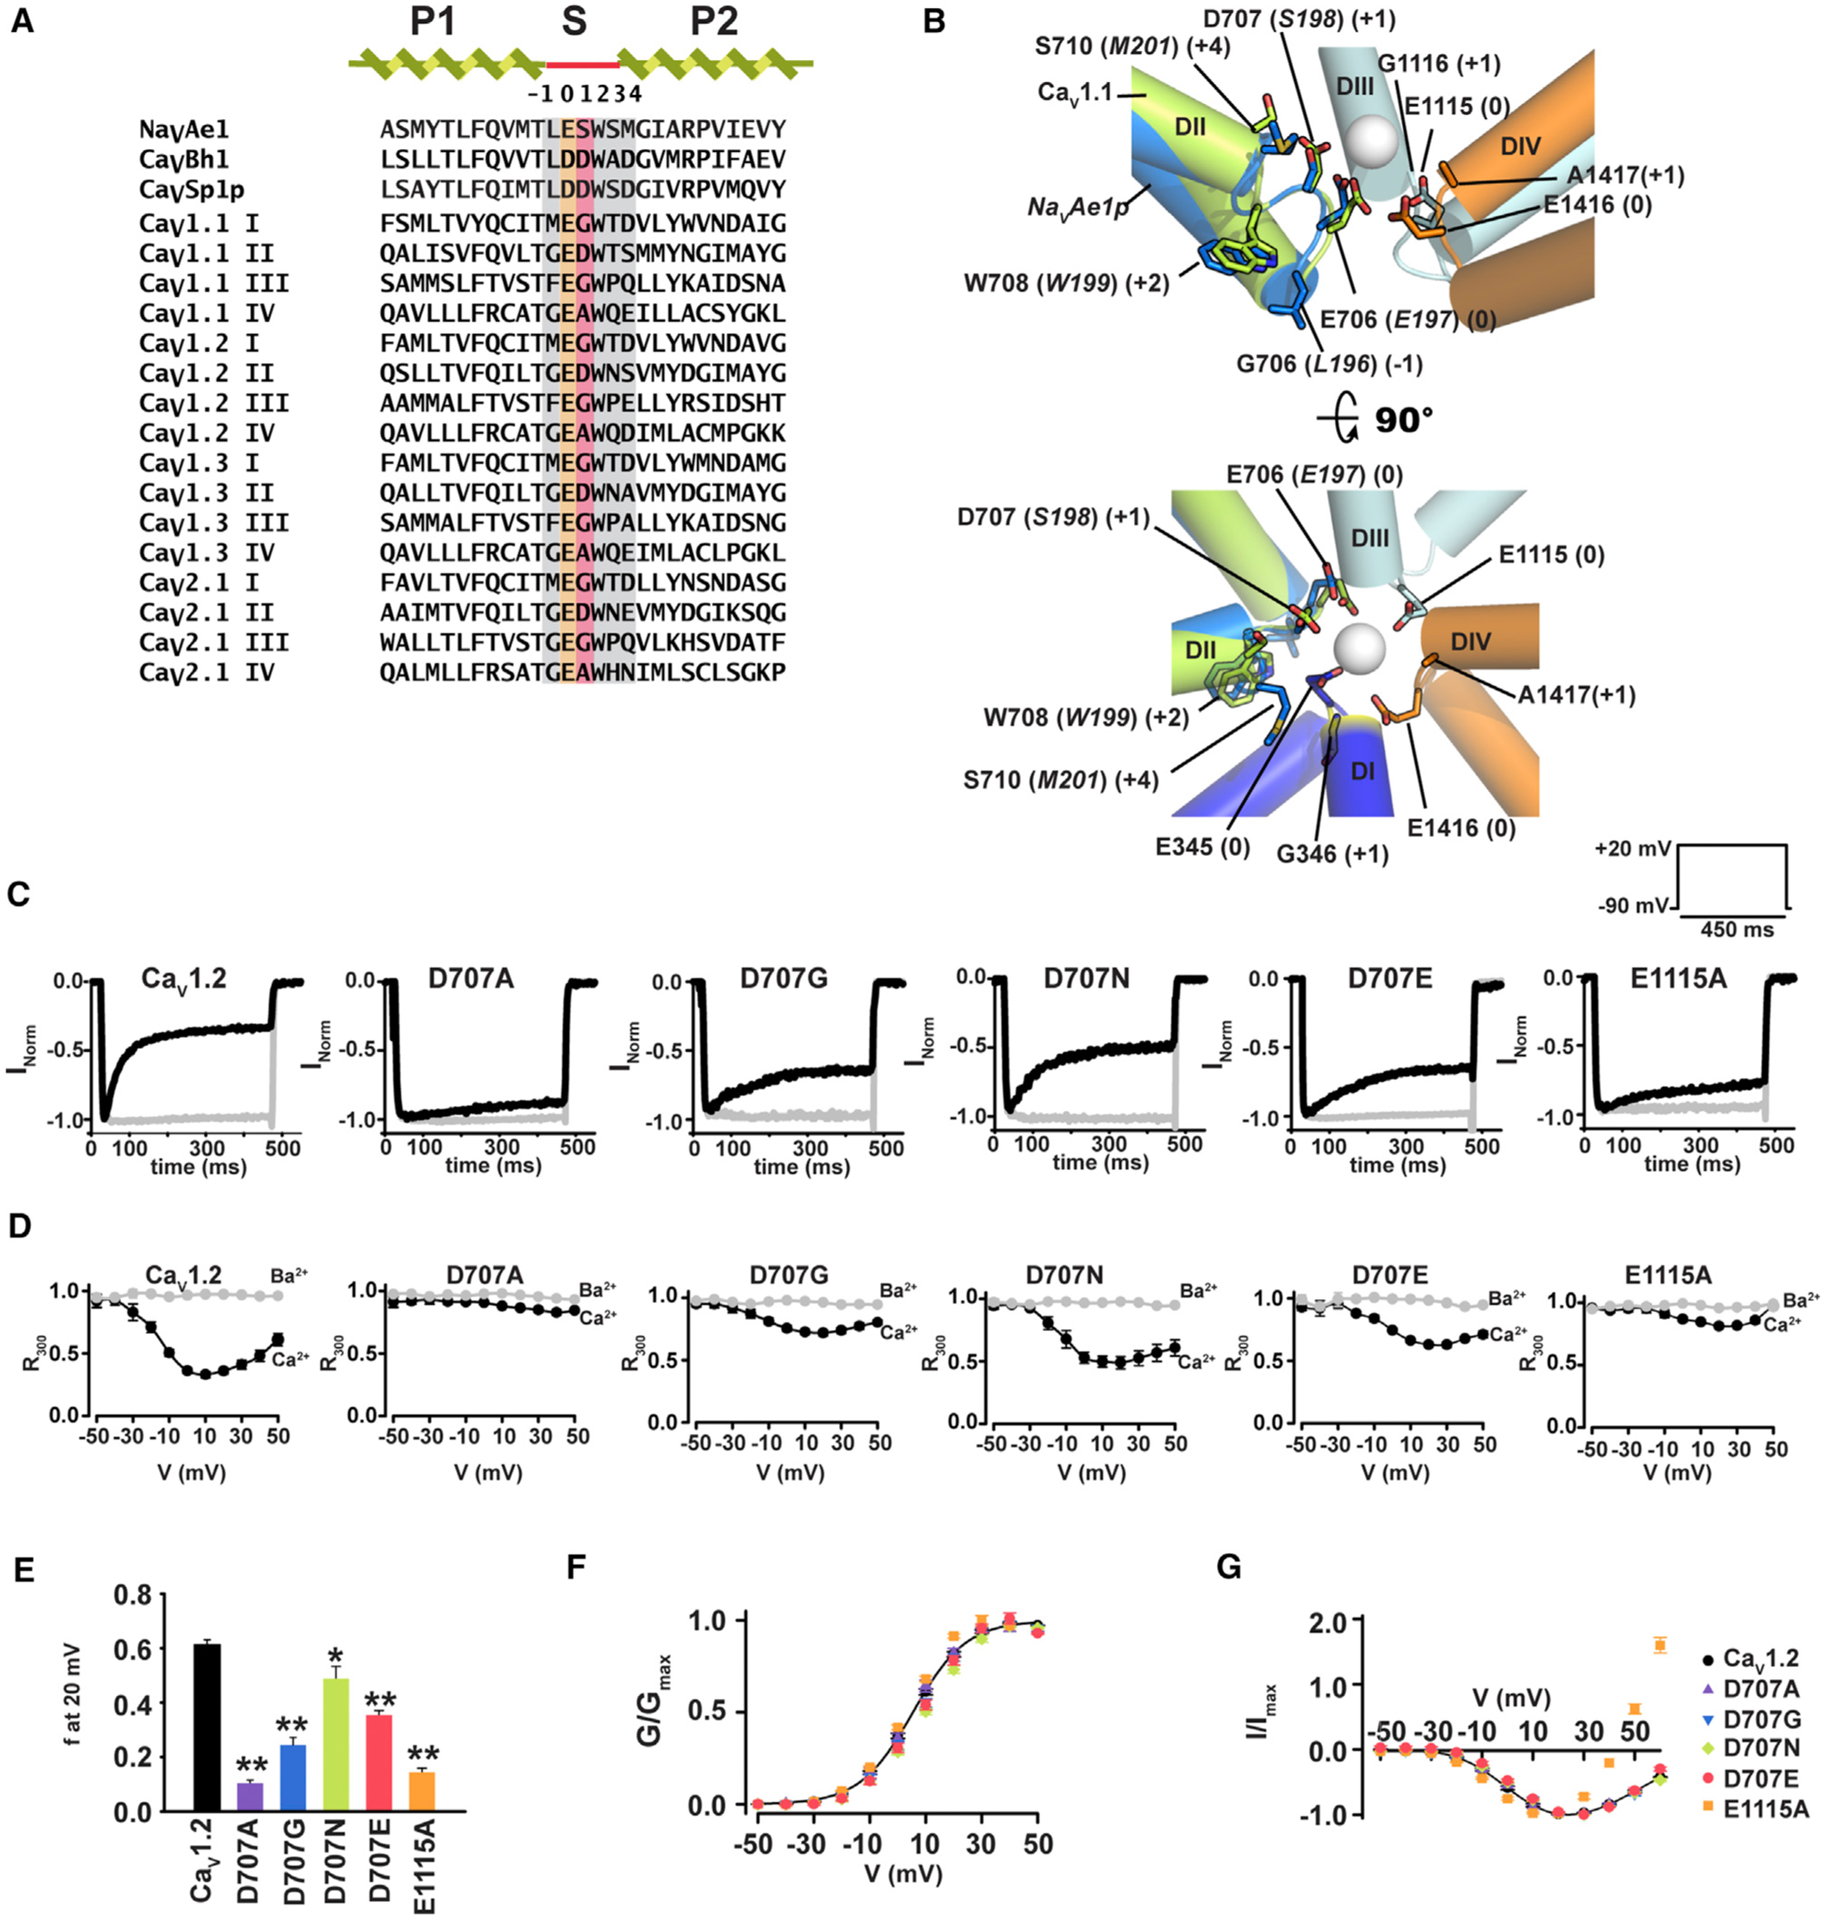
Figure 1. CaV1.2 Selectivity Filter Mutations in DII Affect CDI.

(A) Sequence alignment of pore helices and selectivity filters of NaVAe1 (Shaya et al., 2014), calcium-selective BacNaVs CaVBh1 (Yue et al., 2002), CaVSp1p (Shaya et al., 2011), and human CaV1 and CaV2 exemplars: CaV1.1 (UniProtKB: Q13698), CaV1.2 (UniProtKB: Q13936), CaV1.3 (UniProtKB: Q01668), and CaV2.1 (UniProtKB: O00555). SF sites (0) and (+1) are highlighted in orange and red, respectively. Other SF sites are highlighted in gray. Sequences are NaVAe1 185–211, CaVBh1 179–205, CaVSp1p 164–190, CaV1.1 DI 280–306, CaV1.1 DII 602–628, CaV1.1 DIII 1002–1028, CaV1.1 DIV 1311–1337, CaV1.2 DI 351–377, CaV1.2-DII 694–720; CaV1.2-DIII 1103–1129, CaV1.2-DIV 1404–1430, CaV1.3-DI: 343–369, CaV1.3-DII 704–730, CaV1.3 DIII 1100–1126, CaV1.3 DIV 1390–1416, CaV2.1-DI 306–332, CaV2.1 DII 656–682, CaV2.1 DIII 1448–1474, CaV2.1 DIV 1744–1770.
(B) Structural comparison of the NaVAe1 (PDB: 5HK7) (Arrigoni et al., 2016) SF (marine) with the CaV1.1 (PDB: 5GJV) (Wu et al., 2016) DII SF (green). Ca2+ from NaVAe1 (PDB: 4LTO) (Shaya et al., 2014) is shown as a sphere. DI (blue), DII (green), DIII (cyan), and DIV (orange) domains of CaV1.1 are shown. CaV1.1 and NaVAe1p residues are labeled in plain and italics, respectively. CaV numbering follows the CaV1.2 equivalent residues. SF positions are shown in parentheses. Side view (top) omits DI for clarity. DI (+1) position is highlighted in yellow.
(C) Exemplar normalized recordings at +20 mV in Ca2+ (black) or Ba2+ (gray) from Xenopus oocytes expressing CaV1.2 or indicated mutants.
(D) Fractional current remaining 300 ms post-depolarization (R300) as a function of the membrane potential for channels in (C).
(E) Average fraction CDI (f) at +20 mV, where f is the difference between Ca2+ and Ba2+ R300. *p < 0.015 and **p < 0.001 compared to CaV1.2. n values are in Table 1.
(F) Voltage-dependent activation curves for CaV1.2 (black circles), D707A (purple triangles), D707G (inverted blue triangles), D707N (green diamonds), D707E (red circles), and E1115A (orange squares).
(G) I–V relationships for the indicated channels. Symbols are the same as (F).
