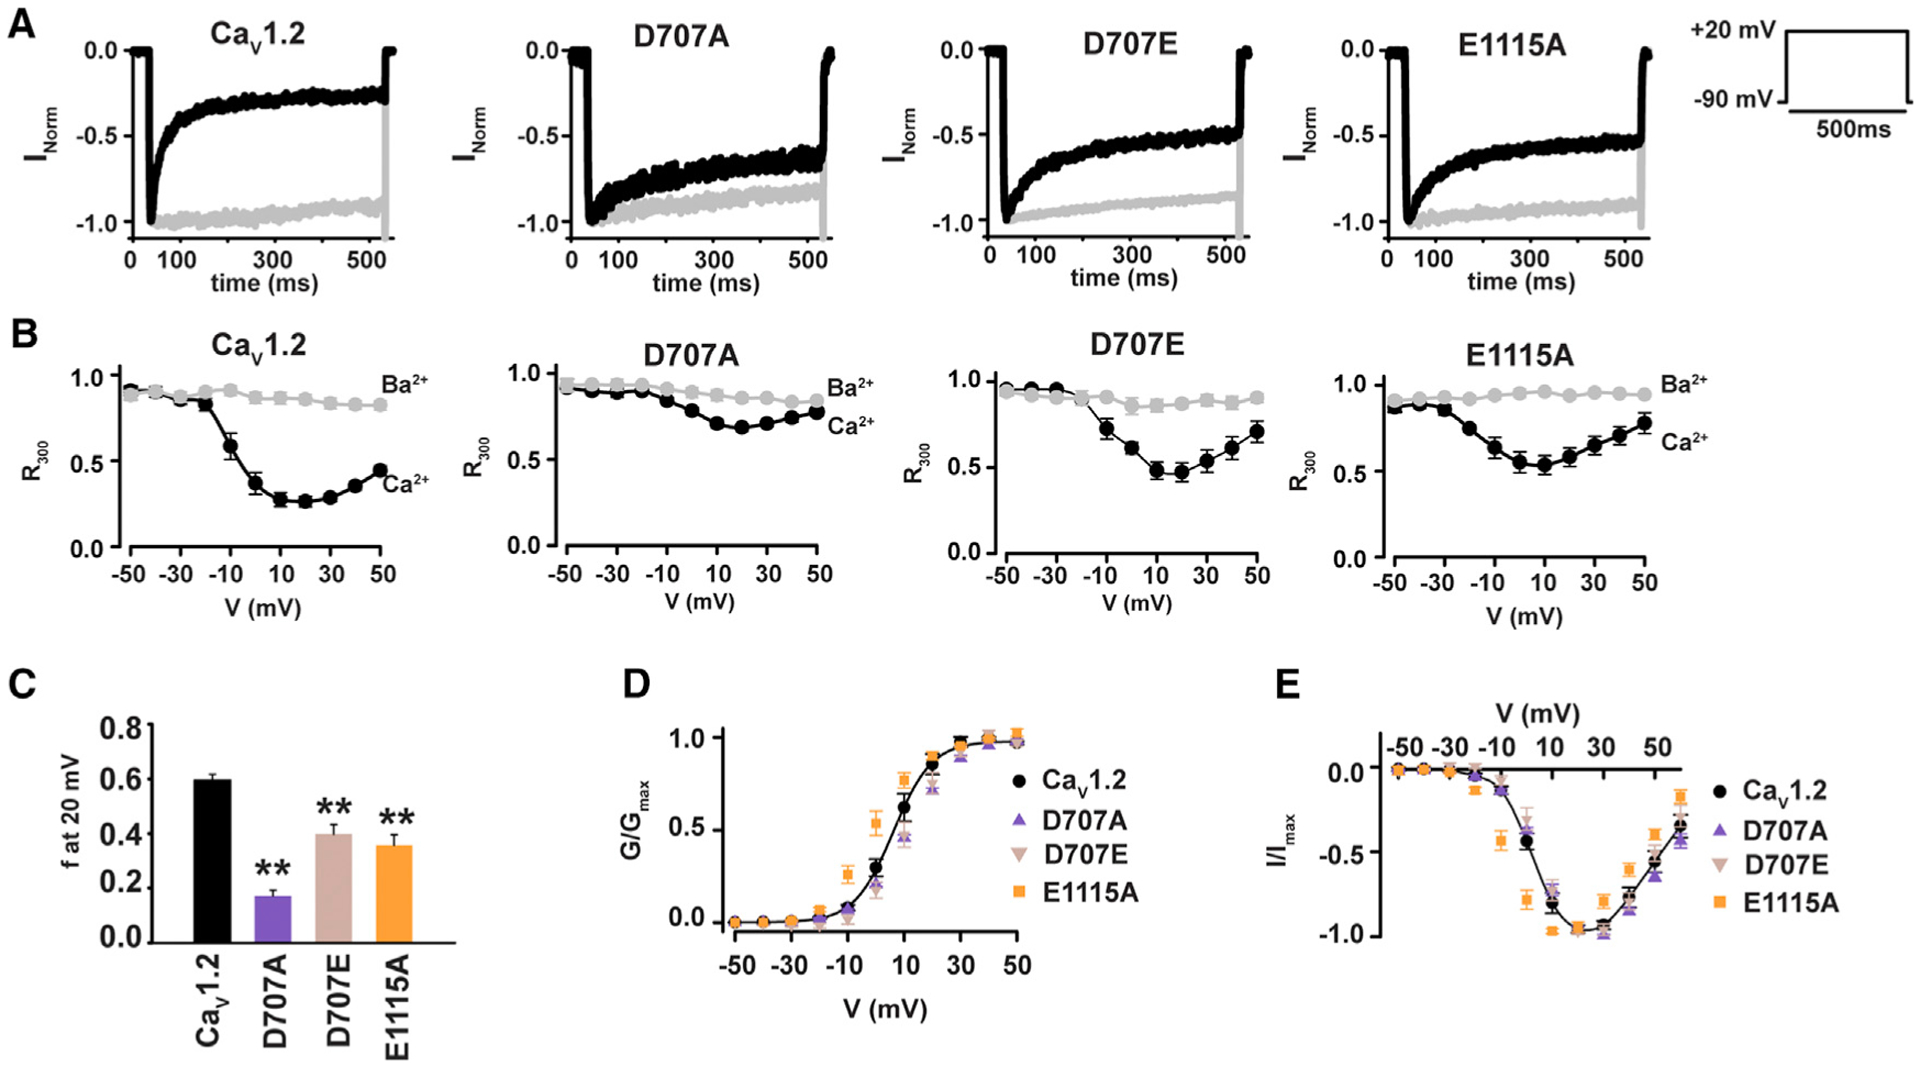
Figure 2. Domain II SF Mutations Reduce CDI in CaV1.2 Expressed in Mammalian Cells.

(A) Exemplar normalized recordings at +20 mV in Ca2+ (black) or Ba2+ (gray) from HEK293 cells expressing CaV1.2 or the indicated mutants.
(B) Fractional current remaining 300 ms post-depolarization (R300) as a function of the membrane potential for channels in (A).
(C) Average f values at 20 mV. **p < 0.001 compared to CaV1.2.
(D) Voltage-dependent activation curves for CaV1.2 (black circles), CaV1.2 D707A (purple triangles), CaV1.2 D707E (tan inverted triangles), and CaV1.2 E1115A (orange squares). Currents are normalized to the maximum peak current.
(E) I–V relationships for the indicated channels. Symbols are as in (D).
