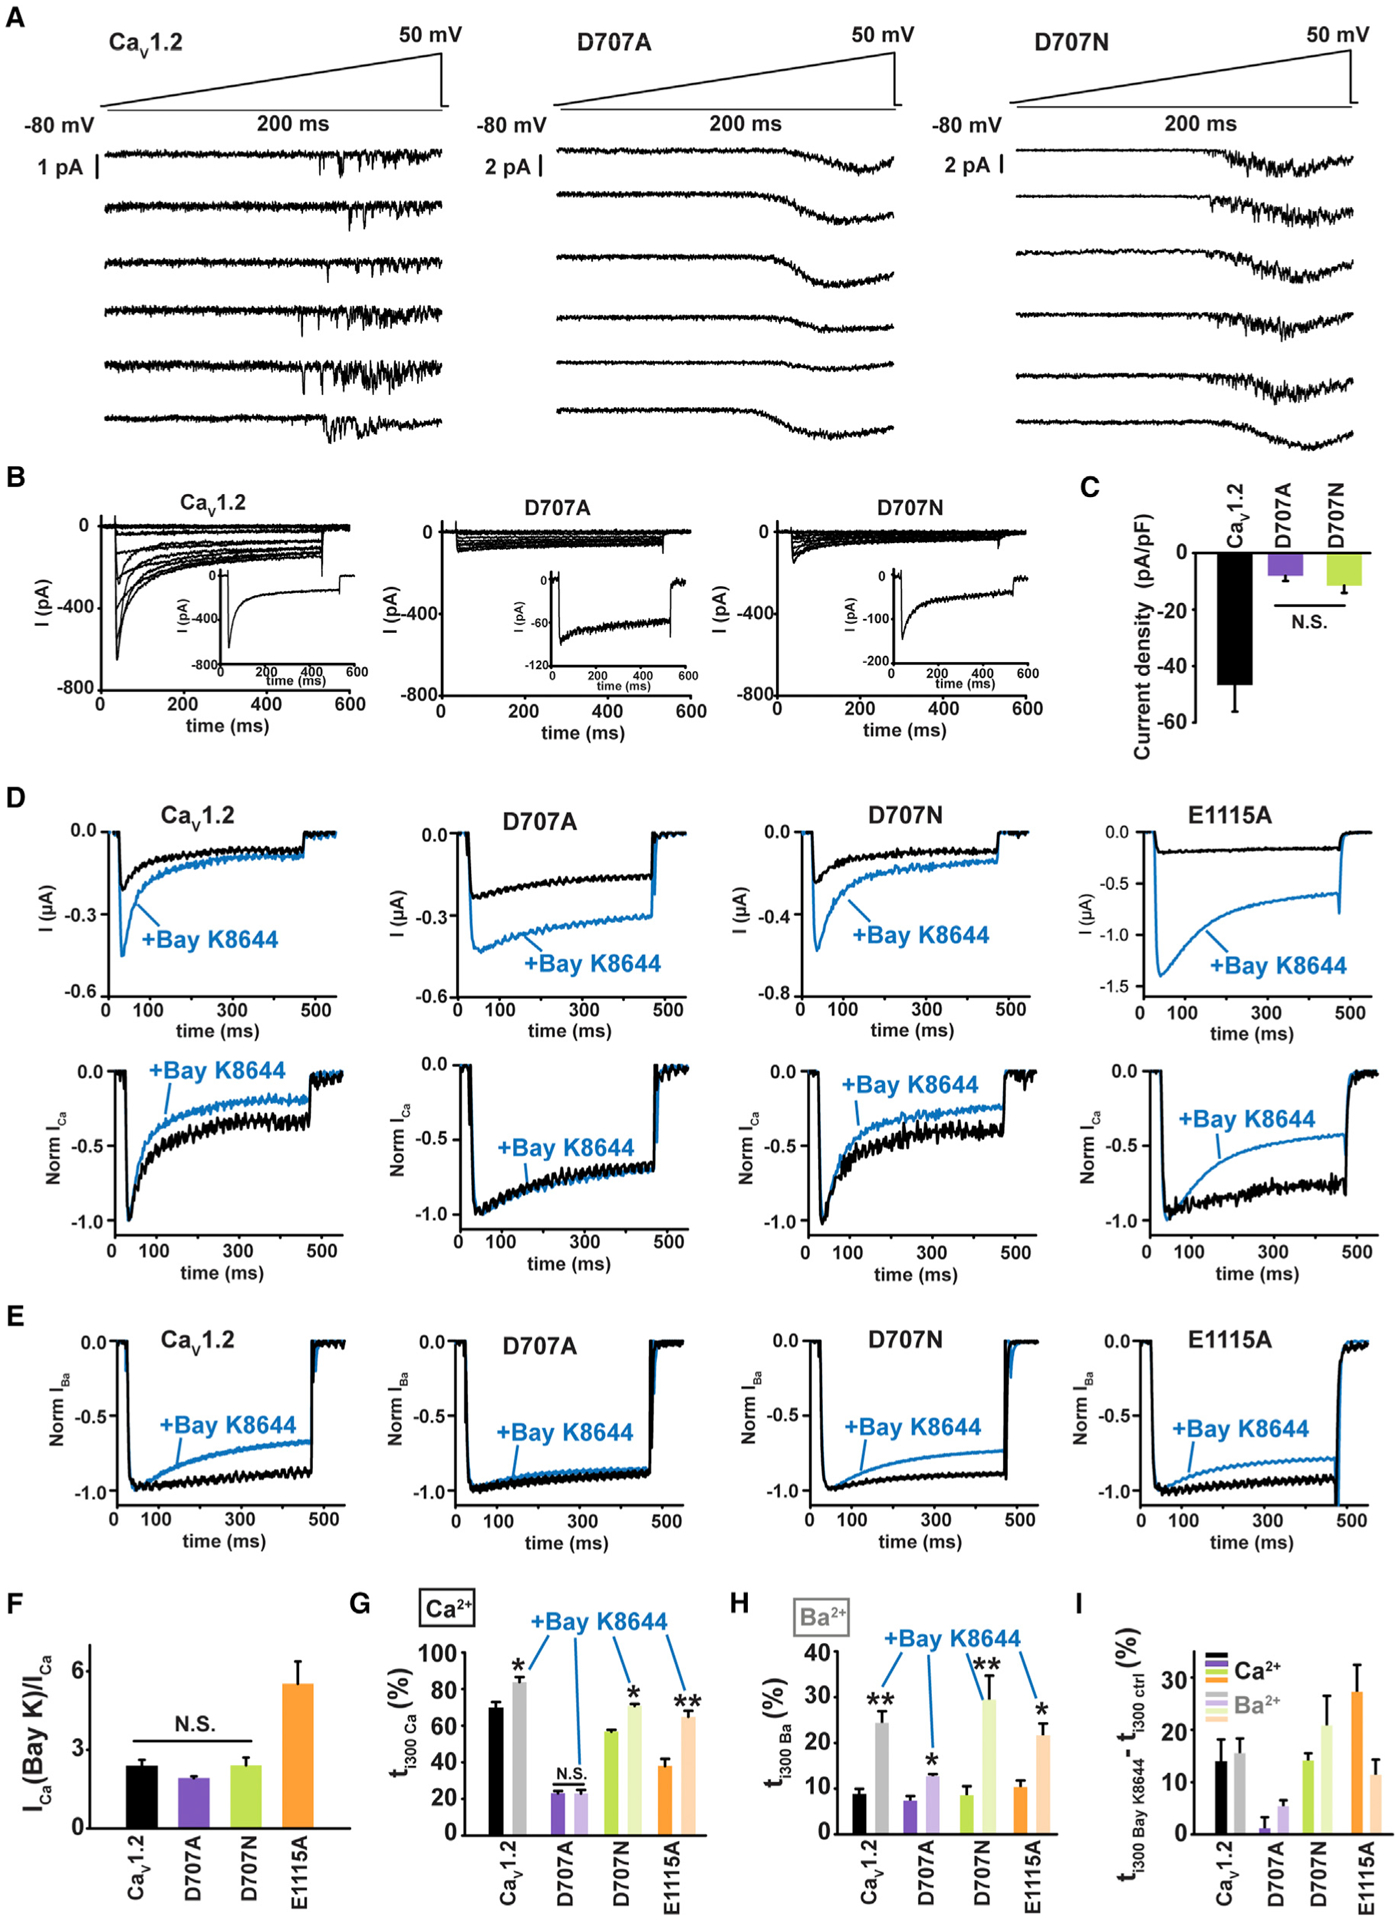
Figure 3. CDI Loss in the SF (+1) Mutant D707A Is Unrelated to Insufficient Ca2+ Influx.

(A) Exemplar cell-attached low noise current recordings in response to a voltage ramp (top) for HEK293 cells expressing CaV1.2 or the indicated mutants. Each trace is from a different patch.
(B) Exemplar whole-cell current recordings from HEK293 cells expressing CaV1.2 or the indicated mutants. Currents were evoked with a multistep depolarization protocol from −50 to +50 mV using 10 mV increments and a −90 mV holding potential. Exemplar current traces at +20 mV are shown (inset).
(C) Current densities for CaV1.2 and the indicated mutants. N.S., not statistically different; n = 6–7.
(D) Exemplar Ca2+ currents from Xenopus oocytes expressing CaV1.2 or the indicated mutants, in response to a +20 mV depolarization in absence (black) or in presence of 5 μM Bay K8644 (blue). Raw traces (upper panel) and normalized traces (lower panel) illustrate Bay K8644 effects on the peak current and inactivation, respectively.
(E) Exemplar normalized Ba2+ currents from Xenopus oocytes expressing CaV1.2 or the indicated mutants, in response to a +20 mV depolarization in absence (black) or in presence of 5 μM Bay K8644 (blue).
(F) Ratio of Ca2+ current amplitudes in presence, ICa(Bay K), and in absence, ICa, of Bay K8644; n = 6–7.
(G and H) Percentage of inactivation 300 ms post-depolarization (ti300) in absence (dark bars) and presence of Bay K8644 (light bars) using (G) Ca2+ or (H) Ba2+ as charge carrier. *p < 0.01 and **p < 0.001 compared to the same construct without Bay K8644; n = 6–11.
(I) Difference in ti300 induced by Bay K8644 in Ca2+(dark bars) and Ba2+ (light bars).
