Figure 6.
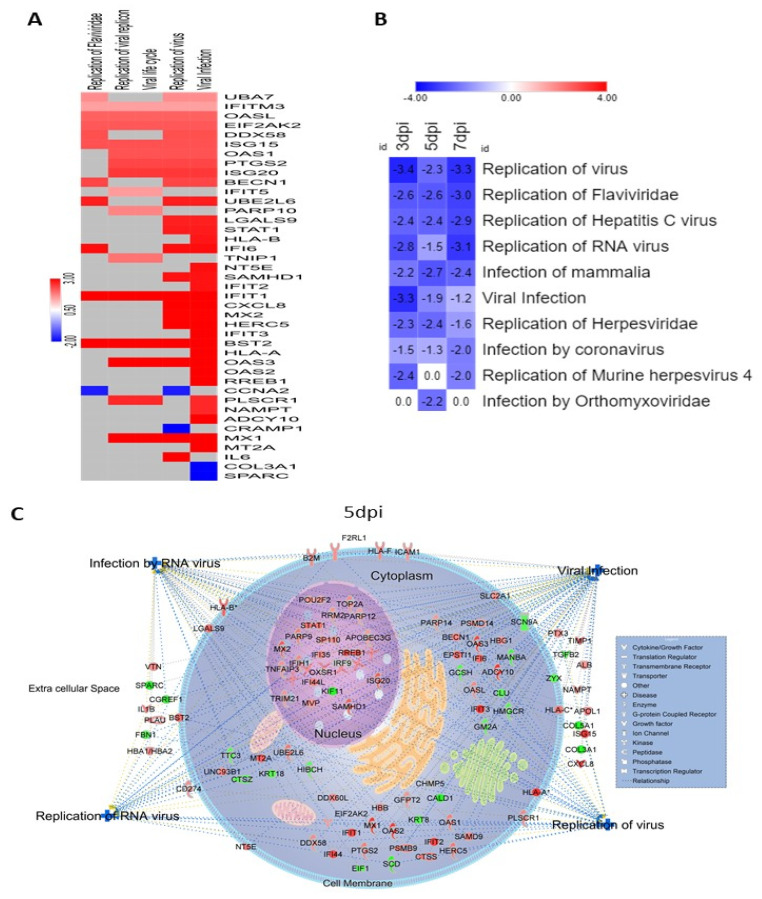
Viral replication was suppressed by the cellular response in HSerC after ZIKV infection. (A). Heat map of the proteins involved in virus infection, lifecycle and replication at 5 dpi. Red and blue represent up-regulation and down-regulation of protein expression, respectively. (B) Replication of different family of viruses were predicted to be inhibited by the significantly affected proteins at 3, 5 and 7 dpi. The number in the box indicates the Z-score of the representative function or disease. (C) Cellular localization of the altered proteins predicted to be involved in the regulation of viral infection and in infection by, and replication of, RNA viruses. Red and green represent up-regulation and down-regulation of protein expression, respectively. Abbreviations. dpi = Days post infection.

