Abstract
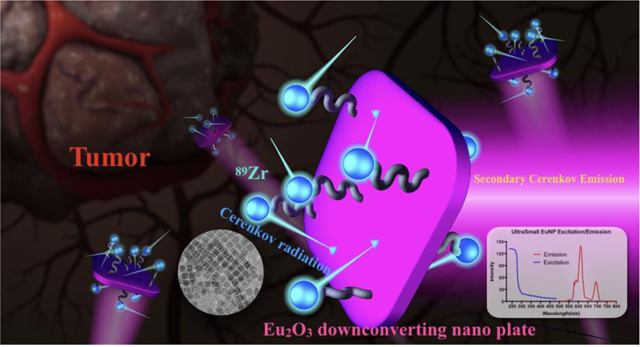
Cerenkov imaging provides an opportunity to expand the application of approved radiotracers and therapeutic agents by utilizing them for optical approaches, which opens new avenues for nuclear imaging. The dominating Cerenkov radiation is in the UV/blue region, where it is readily absorbed by human tissue, reducing its utility in vivo. To solve this problem, we propose a strategy to shift Cerenkov light to the more penetrative red-light region through the use of a fluorescent down-conversion technique, based upon europium oxide nanoparticles. We synthesized square shape ultra-small Eu2O3 nanoparticles, functionalized with polyethylene glycol and chelate-free radiolabeled for intravenous injection into mice to visualize the lymph node and tumor. By adding Trimethylamine N-oxide during the synthesis, we significantly increased the brightness of the particle and synthesized the (to-date) smallest radiolabeled europium-based nanoparticle. These features allow for the exploration of Eu2O3 nanoparticles as a preclinical cancer diagnosis platform with multi-modal imaging capability.
Keywords: lanthanide nanomaterial, europium, oxidation state, ultra-small, ion exchange, Cerenkov imaging
Graphical Abstract
INTRODUCTION
A recent and significant development in nuclear imaging has been the ability to optically visualize a decay signal of isotopes normally used for Positron Emission Tomography (PET) and Single Photon Emission Computed Tomography (SPECT) with a cooled and highly sensitive Charge-Coupled Device (CCD) camera[1]. This optical decay signal, known as Cerenkov Radiation, occurs when charged subatomic supra-relativistic particles travel through a dielectric medium[2]. It provides much faster imaging speed with potentially lower service costs[2–5]. Cerenkov imaging provides an opportunity to perform optical imaging with approved radiotracers, bridging the gap between the many clinically approved radiotracers and the few optical ones. A current drawback, however, is that Cerenkov luminescence (CL) from radioactive decay is an extremely weak event requiring cameras capable of detecting individual photons. A contrast agent to increase the Cerenkov light intensity without increasing the dose of radioactivity would be ideal for clinical actualization, enabling facile imaging of radiotracer distribution for various biomedical and preclinical applications using optical imaging equipment. One highly attractive feature of this approach is the utilization of commonly approved PET and therapeutic radiopharmaceuticals, whilst providing an additional mode of imaging in the visible region of the spectrum, with potential to accelerate preclinical nuclear research. The emission spectrum of Cerenkov radiation is continuous with the primary emission weighted in the U.V./blue (300–450nm) spectrum, ideal for downconversion nanoparticles[3]. We hypothesize that Cerenkov Luminescence (CL) could be used to excite an appropriately devised downconversion nanoparticle, absorbing at around 300–450 nm where Cerenkov light has higher intensity and emitting photons in the red to far red region which allows for better tissue transmittance. In general, exciting a fluorochrome with CL has been termed SCIFI - Secondary Cerenkov-induced Fluorescence Imaging[6]. Compared to small-molecule scintillators or fluorochromes, downconversion nanoparticles pose certain advantages such as high optical cross-sections and narrow emission bands. Semiconducting nanoparticles or metal oxides are preferable, because the energy can be transferred and reemitted as a visible photon by the nanoparticle, unlike metallic nanoparticles, which transfer the energy to heat. Europium oxide displays a narrow emission at 620nm, massive Stokes’ shifts, strong UV absorption and long lifetimes, making this material a strong candidate for a downconverting nanoparticle to translate CL light into the more penetrating red part of the spectrum [7–10]. Among various candidate probes, europium oxide is known to exhibit particularly strong luminescence when excited with Cerenkov light, making this compound more advantageous when compared to other lanthanide oxide nanoparticles[11, 12]. Importantly, those nanoparticles can also use other emissions from radiuaoctivity and translate radioactive decay into light via additional scintillation effects[10].
Synthesis and characterization of uEuNP@PEG
Traditionally, lanthanide oxide nanomaterial synthesis requires very high solid state processing temperatures (> 900oC) and a harsh environment to create a uniform and defect-free surface, maintaining its optical property[13, 14]. It has been postulated that defects on the surface trap the electrons and prevent energy transfer between different energy states,[15] a phenomenon greatly amplified at the nanoscale. For the synthesis of nanoscale Eu2O3, high temperature synthesis followed by mechanical processing (e.g., ball-milling) enables the production of commercially available Nano powders. Alternatively, encapsulated growth of Eu2O3 inside nanoporous hosts can also restrict size to the nanoscale[16]. Such nanomaterials can, under the right conditions, exhibit good fluorescence; however, their size and morphology are not suitable for biomedical applications[17]. Furthermore, the lack of an organic ligand capping group on the nanoparticle surface reduces the potential for biocompatibility, and frequently results in aggregation in aqueous solution, diminishing further their potential for in vivo applications. In our work, we attempted the use of ultra-small Europium nanoparticles (uEuNP) as a biomedically viable probe. The uEuNPs were synthesized through thermal hydrolysis, based on the decomposition of Europium(III) acetate in the presence of oleylamine and oleic acid under Argon[18]. TEM images confirmed the size of uEuNP nanoparticles to be uniformly ~7±2 nm (Figure 1b, d) with a slightly larger observed hydrodynamic diameter of ~11 nm (Figure 1d). And the lattice constant (d222=3Å) has been confirmed by HR-TEM (Fig 1c) and XRD spectrum (Fig S6). Initially, the fluorescence of the uEuNP proved be inadequate, due to an abundance of Eu in the +2-oxidation state, attributed to the high surface area at this scale, presence of undercoordinated Eu at the surface, and the reducing conditions of the nanoparticle synthesis reaction. The narrow fluorescence emission at 620nm of Eu is from the electron transition 5D0 - 7FJ (J = 0, 1, 2, 3, 4).[12, 19] These transitions are Eu(III) based and highly sensitive to position and local environment in the crystal lattice.[19–24], XPS (X-ray photoelectron spectroscopy) has been used to detect the oxidation composition of the uEuNP through binding energy. The XPS spectrum, shown in Fig.1e, in red, shows that our uEuNP has mixed oxidation states of +3 and +2[25]. In order to convert Eu(II) to Eu(III) and maximize the fluorescent intensity of the uEuNP, a mild oxidation reagent, Trimethylamine N-oxide (TMNO), was added after initial nanoparticle nucleation and growth, for an additional one hour reaction[26]. XPS of the nanoparticles following the TMNO modified synthesis confirms that virtually all Eu(II) has been successfully oxidized to Eu(III). The fluorescent intensity of the TMNO modified uEuNP was 6-fold enhanced and enabled the uEuNP to be considered a viable biomedical probe (Fig S1).
Figure 1.
Characterization of uEuNP@PEG. (a) Scheme showing the preparation uEuNP@PEG and the in vivo study on tumor mice model. (b) TEM overview of uEuNP@PEG after synthesis. (c) Lattice structure of uEuNP@PEG by high resolution TEM. (e) Binding energy by XPS showing after adding TMNO,the dominate oxide state transfer from +2 to +3. (f) ATR-FTIR spectrum showing that the PEG is successfully coated on the surface of the uEuNP@PEG. (d) The hydrodynamic diameter of the uEuNP before and after functionalization in different solvent.
To improve the biocompatibility and solubility in aqueous solution, the oleylamine coated uEuNPs were transferred to hydrophilic media using a well-established phospholipid ligand exchange strategy[27]. Nanoparticles were injected into DS-PE-PEG5k-Mal saturated chloroform to finish the ligand exchange through proton transfer between exchanging ligands (Fig 1a). PEGylated uEuNP maintained their morphology and could be stably suspended in aqueous solutions (Fig S9), presenting an increased hydrodynamic radius of ~28 nm (red curve, Figure 1d). In addition, the FTIR spectrum in figure 1f indicated the success of the PEGylation and ligand exchange[28, 29]. Next, we evaluate the stability of PEG-Eu2O3 in four different pH and FBS (serum) for up to 48 hours through dynamic light scattering. From Fig.S10 the particle size doubled after 12h in high and low pH conditions (4.3 and 11). There is no major aggregation observed up to 48 hours.
89Zr and Cerenkov phantom imaging
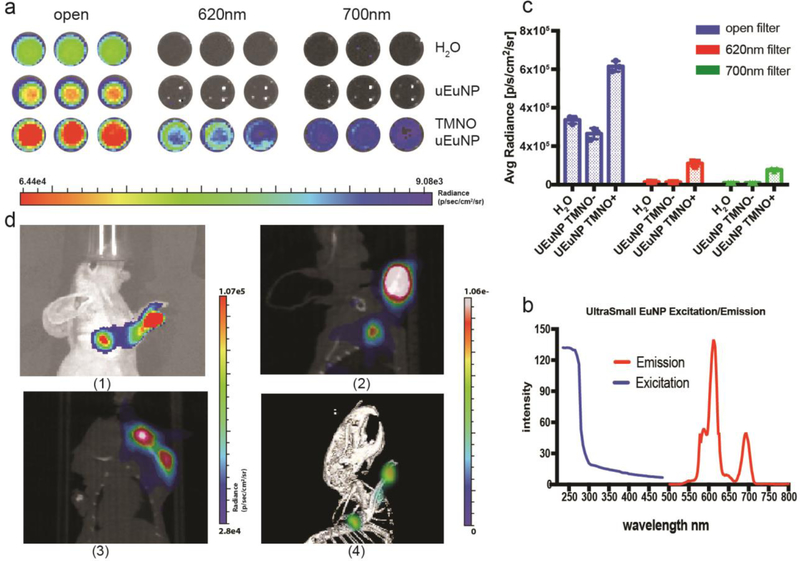
The broad span between the excitation and emission of Eu2O3 makes them an attractive candidate for secondary Cerenkov-induced fluorescence imaging (SCIFI). The absorption of uEuNP is UV and blue weighted, which perfectly matches the Cerenkov radiation spectrum (Fig.2b)[3, 30]. The emission of the Eu2O3 is at 620nm and 700nm, which is within an ideal biomedical imaging window[31]. Then the clinical PET tracer, zirconium-89 (89Zr, half-life 78.4 hours) was applied to evaluate Cerenkov light’s enhancement. To this end, two different uEuNPs were used for practical comparison: TMNO-treated nanoparticles TMNO-uEuNPs and uEuNPs without treatment. Both samples (1mg/mL) were placed onto a 96 well-plate and using deionized water as a control. Next, 100uL Deionized water, containing a 10 μCi 89Zr solution, was added to each well, and the plate was imaged on a small animal optical imaging system (IVIS Spectrum, PerkinElmer, USA). After the open position (i.e., no filtering) imaging, CLI at 620nm and 700nm were performed to determine the Cerenkov and scintillation efficiency on the uEuNPs. The Cerenkov emission spectrum decreases with intensity with wavelength, meaning any emission at 620 and 700 above that of the CL nuclide alone in water is attributable to the EuNP scintillation[3]. From the DI water control (Fig.2a), there is barely light coming out of the well for 620nm and 700nm filters. Also, there is the same result for the uEuNP without TMNO added during the synthesis. In contrast, an unmistakable light signal from the TMNO modified uEuNp under the two-wavelength filter matched the excitation spectrum of the Eu2O3 (Fig.2c). From the open filter imaging, the TMNO modified uEuNP is significantly brighter than the other two groups, which can be attributed to the characteristic Eu3+ luminescence emitted at 620 nm. ROIs qualification analysis (Fig.2b) further verified the result in Fig.2a. The signal from the TMNO treated uEuNP is 6.43×10⁶ p/s/cm2/sr, which is over 2 times brighter than the 89Zr alone which is 3.14×10⁶ p/s/cm2/sr. Under 620nm and 700nm filters, the signal of 89Zr-TNMO-uEuNO can still achieve 1.3× 10⁶ p/s/cm2/sr and 8.2×10⁵ p/s/cm2/sr which is one magnitude brighter than the Cerenkov from the 89Zr alone which is 1.39×10⁵ p/s/cm2/sr and 1.03×10⁵ p/s/cm2/sr.
Figure 2.
Enhanced Cerenkov Phantom and lymph node imaging of uEuNP@PEG labeled with 89Zr. (a) well plate imaging of uEuNP@PEG compares with control (pure H2O, synthesis without TMNO). (b) ROI qualification of well plate imaging showing there are two fold of enhancement for TMNO synthesized uEuNP. (c) Fluorescent spectrum of uEuNP@PEG. (d) lymph node imaging of uEuNP@PEG on mice front paw, IVIS vs PET. (1) Cerenkov imaging on IVIS, 1 hour post-injection (2) PET/CT imaging (side), 1 hour post-injection (3) PET/CT imaging (top), 1 hour post-injection (4) 3D-PET/CT imaging,1 hour post-injection
Lymph node imaging
The phantom imaging ultimately proved the enhancement of Cerenkov light by mixing TMNO modified uEuNP@PEG with 89Zr. Next, we radiolabeled uEuNP@PEG with 89Zr (Supporting information) chelator free and injected the particles into animal models for in vivo application verification[32]. Accurate identify of sentinel lymph nodes is critical to the success of many tumor therapies. Therefore, we performed sentinel lymph node identification with PET and Cerenkov imaging using our radiolabeled nanoparticles. Radiolabeled uEuNP@PEG was injected into the front paw of a healthy nude mouse. After 30 minutes, the mouse was imaged with both PET/CT and IVIS. As shown in Fig 2d, the particle lit up the sentinel lymph node clearly on the IVIS under the bioluminescence mode, i.e., without external excitation light After 1 hour post injection, with a only 2 minute exposure (standard acquisition time for CLI would be 5 minutes). Following a 30 minute PET/CT acquisition, the PET/CT images confirmed that the nanoparticle had reached the sentinel lymph node in agreement with the Cerenkov imaging (Fig.2d 2–4). Since the particle size is ultrasmall, the traveling speed in the lymphatic system is much faster than the larger commercial Eu2O3[10]. Compared to the PET scanner, the Cerenkov imaging significantly lowers the signal acquisition time.
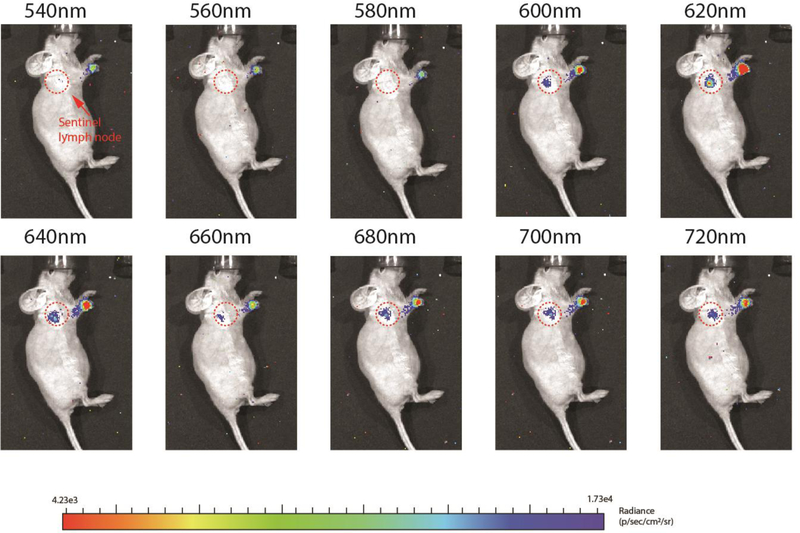
To evaluate the 620nm and 700nm imaging window through Cerenkov imaging, ten different filters were applied (Fig.3). Each image was acquired over 2 minutes as well. As shown in figure 3, the Cerenkov signal intensity on the injection site and the sentinel lymph node site both increased with increasing wavelength of the filter, in contrast to a typical Cerenkov light spectrum (Fig.5d blue), which decreases. The enhanced signal, especially at the sentinel lymph node site, peaked at 620nm, indicated the uEuNP@PEG was excited by the Cerenkov light. Besides, there is barely any signal that could be visualized through 540nm to 580 nm. Initially, the Cerenkov radiation should be more potent at 540 nm to 580 nm than at 620nm and, especially the even longer wavelength 700nm based on the spectrum (Fig.5d). However, with the assistance of the uEuNP@PEG, a much higher signal was achieved at both 620nm and 700nm (Fig.S4). This is mainly caused by the emission of the uEuNP@PEG at these two wavelengths and creates two new imaging windows for the Cerenkov imaging. In this deep or near infrared red region (600–900nm wavelength), the influence of the body tissue and hemoglobin absorption have been minimized[31].
Figure 3.
lymph node imaging under different wavelength. The maxima enhancement is at 620nm filter and 700nm filter which is consisted with the excitation spectrum of uEuNP. The qualification of ROIs and Cerenkov spectrum of the lymph node imagine is available in figure s4.
Figure 5.
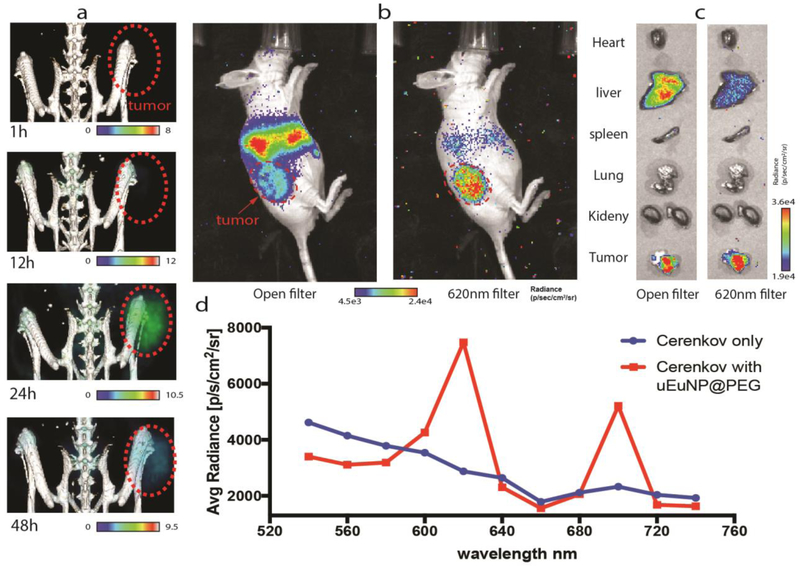
in vivo tumor imaging of 89Zr-uEuNP@PET on CT26 tumor bearing mice. a), 48 h PET imaging b) 48h Cerenkov imaging post injection under open and 620nm filter. c) 48h ex-vivo organ imaging under open and 620 nm filter. d) 48h Tumor site ROI measurement spectrum vs regular Cerenkov spectrum, normalized.
Biodistribution
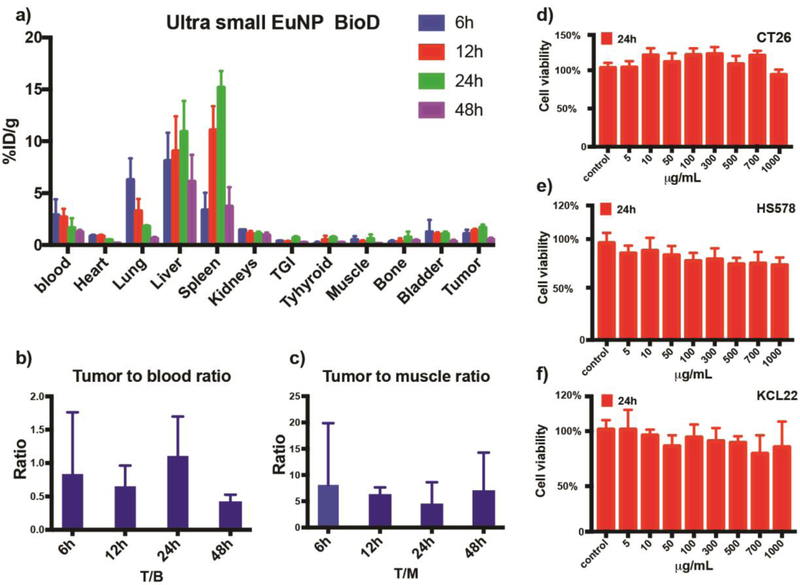
The biodistribution of the 89Zr labeled uEuNP@PEG has been quantified on a Gamma counter. Tumor uptake of 89Zr-uEuNP@PEG generally increases with increased blood circulation time at the first 24 hours from 1.072±0.32%ID/g to 1.67±0.24%ID/g and then decreasing through 48 hours. For the reticuloendothelial system (RES) uptake, the 89Zr labeled uEuNP@PEG were rapidly phagocytosed by the liver and spleen. From 6 hours to 24 hours, the liver and spleen uptake reached the maximum from 8±2.35%ID/g to 10.9±2.6%ID/g and 3.36±1.45%ID/g to 15.2±1.39%ID/g. After 48h, significantly reduced uptake was observed both in the liver and spleen, which could be attributed to the nanoparticles’ hepatic clearance. Based on the tumor to blood ratio, a ratio below 1 indicates the nanoparticles are still circulating in the blood (Fig 4b). At 24 hours, the ratio reaches the maximum, which demonstrates a growing number of nanoparticles accumulating in the tumor site. However, this ratio decreased to 0.5 at 48 hours. Figure 4a shows that the bone resorption of mice injected with 89Zr was less than 0.45%ID/g on average within 48 hours, indicating that there was very little release of the bone seeker 89Zr from the particles (Fig 4c). In general, the dynamic biodistribution of 89Zr labeled uEuNP@PEG proved the in vivo stability and further clearance potential due to its relatively small size over 48 hours. Moreover, the chelator free radiolabeling metal oxide nanoparticle with oxophilic radioisotope has been verified to be an efficient and reliable way for the in vivo pharmacokinetic study of nanoparticle delivery.
Figure 4.
Biodistribution study of uEuNP and cell viability study. a), 48 hours biodistribution of 89Zr-uEuNp@PEG in CT-26 tumor mice model in %ID/g. b), 48 hours tumor to blood ratio. c) 48 hours tumor to muscle ratio. d-f, 24 h in vitro cytotoxicity study, two cancer cell line Ct26 and KCL 22, one health cell line HS578.
In vitro cytotoxicity
We have successfully applied our new ultrasmall Europium nanoparticle to lymph node imaging in vivo and demonstrated the capability to convert the blue-weighted CL into a more tissue penetrating (red) part of the spectrum with stable radio-labeling and biocompatibility. While we did not encounter toxicities from the in vivo application, cytotoxicity is nevertheless a crucial concern for all nanomedicine, especially for more complex applications, like tumor theranostic, etc. To further verify the cytotoxicity of the uEuNP@PEG, three different cell line CT26, KCL22, and HS578 were exposed to different concentrations of uEuNP@PEG. The cell viability is examined through a standard CellTiter-Glo® luminescent cell viability assay. After 24h of culturing, 8 different concentrations of uEuNP@PEG (from 5μg/mL to 1000μg/mL) have been added to each well and incubate with the cells for 24h. As shown in Figure 4d and 4e, there is no major cytotoxicity observed through 5ug/mL to 1000μg/mL of uEuNP@PEG compared to the control. The study shows the negligible cytotoxicity and high biocompatibility of the uEuNP@PEG, making it a good candidate for further in vivo imaging.
PET/Cerenkov imaging of uEuNP@PEG on CT26 tumor-bearing mice
To investigate the effectiveness of uEuNP@PEG as a Cerenkov light enhancing agent for tumor imaging in vivo, we tested it on a CT26 subcutaneous tumor mice model. The nude mice (n=3) were prepared by subcutaneous implantation of 1 million CT-26 cells mixed with 50% matrigel in the left thigh area. The uEuNP@PEG were labeled with 150μCi 89Zr and then suspended into PBS solution. 89Zr-uEuNp@PEG (1mg/mL) was intravenously injected through the tail vein two weeks after tumor implantation. The mice were imaged in a Siemens Inveon PET/CT and scanned for 30mins at four different time points (1h,12h,24h, and 48h) after injection. IVIS optical imaging was performed immediately after each PET/CT scan. PET/CT image demonstrated the 89Zr-uEuNp@PEG appears at the tumor site for 12h, peaking at 24h followed by a decrease at 48h, which is consistent with the biodistribution study (Fig. 5a). Since we did not engineer any targeting moiety onto the 89Zr-uEuNp@PEG, the tumor uptake is mainly caused by passive tumor targeting through enhanced permeability retention (EPR). The IVIS images were both acquired with an open filter position (to see predominantly CL emission form the 89Zr) and with a 620nm filter (to home in on the shifted 89Zr-uEuNp@PEG emission). Using the 620nm filter, a strong tumor signal is acquired, consistent with the emission peak of the Europium oxide. To further confirm the accumulation of the 89Zr-uEuNp@PEG on the tumor, organs were dissected at 48h and imaged under open and 620nm filter on IVIS in Fig.5c. The Cerenkov light signal was detected in liver and tumor under both open and 620nm filters. However, it’s interesting that with the 620nm filter more light is observed coming from the tumor than the liver both in whole body CLI and ex vivo imaging (Fig.5 b,c). Since the main wavelength emitted by uEuNP@PEG is 620 nm, we hypothesized that the loss of fluorescence in the liver uEuNP@PEG was due to reduction by liver enzymes. We incubated the uEuNP@PEG with mice liver lysate and Cytochrome P450 in mouse plasma at 370C. After 24 and 48 hours, fluorescent intensity at 620nm decreased by 30% when incubating with Cytochrome P450 (Fig. S5). Since the Cytochrome P450 is a reductase, we believe the surface of the uEuNP@PEG has been reduced and lost part of the scintillation function which leading to the fluorescent dropping in the liver site under 620nm filter.
Next, a series of filters (540nm to 740nm) was used to determine the spectrum of the uEuNP@PEG enhanced Cerenkov light in vivo (Fig.5b), measuring emission originating from the tumor site of the mice. From the spectrum of Fig.5d, we can see the two characteristic emission peaks of the uEuNP@PEG at 620nm and 700nm. This spectrum is unique compared to the conventionally Cerenkov spectrum (Fig.5d blue curve), which demonstrates the expected continuous decay towards longer wavelengths. The combination of the uEuNP@PEG with PET tracer 89Zr significantly boosts the Cerenkov light signal 2-fold at open filter and one order of magnitude under 620nm and 700nm filter with relative low concentration (10mg/mL), which is more valuable for the clinic application since this region is the ideal biomedical near-infrared imaging window.
Conclusion
Cerenkov radiation, a phenomenon known now for nearly a century[33] is finally beginning to present true possibilities for medical application, especially for cancer imaging, thanks to a decade of research[34]. Europium is usually considered a useful dopant in oxide nanoparticles for biomedical imaging, such as upconversion imaging, fluorescent imaging, etc[12, 35]. However, europium is rarely contemplated for direct use, such as Eu2O3, in optical (fluorescent) imaging for in vivo since an external UV source is not feasible. Pairing Cerenkov light with Eu2O3 nanoparticles offers the possibility to harness the most energetic CL emission region, while taking advantage of the narrow and efficient fluorescent characteristics (brightness, quantum yield) of Eu3+. Compared to doped analogues, Eu2O3 nanoparticles have a higher density of Eu(III) emitters per unit cell. In this study, we created the smallest and most biocompatible europium oxide nanoparticle to date, TMNO-uEuNP@PEG, which could be applied for more sensitive in vivo nuclear imaging (Cerenkov and PET) on mice models as shown here with lymph node identification and tumor imaging. Details of pharmacokinetics and biodistribution have been studied, which will give a clear indication, as well as potential trajectory, of this nanoparticle’s behavior in animals. The novel particle design successfully addressed the deficiencies of Cerenkov light at longer wavelengths and allowed us to build a new nuclear-fluorescence multi-modal imaging platform that could be further engineered for next generation therapeutic and diagnostic nanotechnology. This small, yet bright nanoparticle paves the way for potentially even smaller nanoparticles that could be excreted rapidly via the kidneys, opening doors for potential human applications by avoiding potential Eu toxicity, and warranting further investigation based on our first results.
Supplementary Material
ACKNOWLEDGMENT
This research is dedicated to the memory of Professor Charles Michael Drain, an advisor to this project and to Q. Z. until 2019. We thank the MSKCC Radiochemistry and Molecular Imaging Probes Core for the 89Zr supply. We would like to acknowledge the Imaging Facility of CUNY Advanced Science Research Center for instrument use, scientific and technical assistance. This work was supported by the following grants: National Institutes of Health (NIH) R01EB014944 and R01CA183953 (to J.G.) and the MSKCC core grant P30 CA008748 to C. Thompson. We acknowledge P. Zanzonico and V. Ann Longo of the Small Animal Imaging Core Facility of MSKCC for their support (the Core is funded by the NIH Cancer Center Support grant no. P30 CA008748). S.O. gratefully acknowledges support from the National Science Foundation, from NSF DMR #1461499 and NSF CREST-IDEALS, #1547830.
ABBREVIATIONS
- CL
Cerenkov light
- uEuNP
ultra-small europium oxide nano particle
- XPS
X-ray photoelectron spectroscopy
- BioD
Biodistribution
- PEG
Polyethylene glycol
- TMNO
Trimethylamine N-oxide
- PET
Positron emission tomography
- FBS
Fetal Bovine Serum
- iTLC
Instant thin layer chromatography
- DI
Deionized
- IVIS
In Vivo Imaging Systems
Footnotes
ASSOCIATED CONTENT
Support information
The diagram of iTLC for Chelator-free 89Zr labeling of uEuNP @PEG and 48 hours serum stability of 89Zr-uEuNP@PEG in Fetal Bovine Serum, and Florescent spectrum of uEuNP without TMNO added.
REFERENCES
- 1.Shaffer TM, et al. , Utilizing the power of Cerenkov light with nanotechnology. Nature Nanotechnology, 2017. 12(2): p. 106–117. [DOI] [PMC free article] [PubMed] [Google Scholar]
- 2.Thorek DL, et al. , Clinical Cerenkov luminescence imaging of (18)F-FDG. J Nucl Med, 2014. 55(1): p. 95–8. [DOI] [PMC free article] [PubMed] [Google Scholar]
- 3.Thorek D, et al. , Cerenkov imaging - a new modality for molecular imaging. Am J Nucl Med Mol Imaging, 2012. 2(2): p. 163–73. [PMC free article] [PubMed] [Google Scholar]
- 4.Ruggiero A, et al. , Cerenkov luminescence imaging of medical isotopes. J Nucl Med, 2010. 51(7): p. 1123–30. [DOI] [PMC free article] [PubMed] [Google Scholar]
- 5.Massoud TF et al. , Integrating noninvasive molecular imaging into molecular medicine: an evolving paradigm. Trends Mol Med, 2007. 13(5): p. 183–91. [DOI] [PubMed] [Google Scholar]
- 6.Thorek DL, et al. , Quantitative imaging of disease signatures through radioactive decay signal conversion. Nat Med, 2013. 19(10): p. 1345–50. [DOI] [PMC free article] [PubMed] [Google Scholar]
- 7.van Krevel JWH, et al. , Luminescence Properties of Terbium-, Cerium-, or Europium-Doped α-Sialon Materials. Journal of Solid State Chemistry, 2002. 165(1): p. 19–24. [Google Scholar]
- 8.Feng J, et al. , Functionalized Europium Oxide Nanoparticles Used as a Fluorescent Label in an Immunoassay for Atrazine. Analytical Chemistry, 2003. 75(19): p. 5282–5286. [Google Scholar]
- 9.Bünzli, et al. , Lanthanide Luminescence for Biomedical Analyses and Imaging. Chemical Reviews, 2010. 110(5): p. 2729–2755. [DOI] [PubMed] [Google Scholar]
- 10.Pratt EC, et al. , Nanoparticles as multimodal photon transducers of ionizing radiation. Nature Nanotechnology, 2018. 13(5): p. 418–426. [DOI] [PMC free article] [PubMed] [Google Scholar]
- 11.D’Aléo A, et al. , Charge transfer excited states sensitization of lanthanide emitting from the visible to the near-infra-red. Coordination Chemistry Reviews, 2012. 256(15): p. 1604–1620. [Google Scholar]
- 12.Dong H, et al. , Lanthanide Nanoparticles: From Design toward Bioimaging and Therapy. Chemical Reviews, 2015. 115(19): p. 10725–10815. [DOI] [PubMed] [Google Scholar]
- 13.Kumar S, Prakash R, et al. , Synthesis, Characterization, and Applications of Europium Oxide: A Review. Reviews in Advanced Sciences and Engineering, 2015. 4: p. 247. [Google Scholar]
- 14.Chae K-W, et al. , The enhancement of luminescence in Co-doped cubic Eu2O3 using Li+ and Al3+ ions. Journal of Luminescence, 2011. 131(12): p. 2597–2605. [Google Scholar]
- 15.Kar A, Kundu S, et al. , Surface Defect-Related Luminescence Properties of SnO2 Nanorods and Nanoparticles. The Journal of Physical Chemistry C, 2011. 115(1): p. 118–124. [Google Scholar]
- 16.Ramesh S, et al. , A. Gedanken Synthesis and optical properties of europium oxide nanoparticles immobilized on amorphous silica microspheres. Optical Materials, 1999. 13 (1999) 67–70. [Google Scholar]
- 17.Chen W, et al. , Structure, Luminescence, and Dynamics of Eu2O3 Nanoparticles in MCM-41. The Journal of Physical Chemistry B, 2002. 106(28): p. 7034–7041. [Google Scholar]
- 18.Hudry D, et al. , Ultrathin Europium Oxide Nanoplatelets: “Hidden” Parameters and Controlled Synthesis, Unusual Crystal Structure, and Photoluminescence Properties. Chemistry of Materials, 2015. 27(3): p. 965–974. [Google Scholar]
- 19.Albin M et al. , Europium(III) luminescence excitation spectroscopy. Quantitive correlation between the total charge on the ligands and the 7F0 .fwdarw. 5D0 transition frequency in europium(III) complexes. Inorganic Chemistry, 1985. 24(6): p. 895–900. [Google Scholar]
- 20.Gallagher PK, Absorption and Fluorescence of Europium(III) in Aqueous Solutions. The Journal of Chemical Physics, 1964. 41(10): p. 3061–3069. [Google Scholar]
- 21.Kayne MS et al. , Enhancement of Tb(III) and Eu(III) fluorescence in complexes with Escherichia coli tRNA. Biochemistry, 1974. 13(20): p. 4159–65. [DOI] [PubMed] [Google Scholar]
- 22.Song X, et al. , Europium-based infinite coordination polymer nanospheres as an effective fluorescence probe for phosphate sensing. RSC Advances, 2017. 7(14): p. 8661–8669. [Google Scholar]
- 23.Richardson FS, Terbium(III) and europium(III) ions as luminescent probes and stains for biomolecular systems. Chemical Reviews, 1982. 82(5): p. 541–552. [Google Scholar]
- 24.Hu Z-J, et al. , Efficient two-photon-sensitized luminescence of a novel europium(iii) β-diketonate complex and application in biological imaging. Chemical Communications, 2011. 47(46): p. 12467–12469. [DOI] [PubMed] [Google Scholar]
- 25.Vercaemst R, et al. , A detailed XPS study of the rare earth compounds EuS and EuF3. Journal of Electron Spectroscopy and Related Phenomena, 1995. 74(1): p. 45–56. [Google Scholar]
- 26.Cavelius C, Moh K, et al. , Chemically Designed Growth of Monodisperse Iron Oxide Nanocrystals. Crystal Growth & Design, 2012. 12(12): p. 5948–5955. [Google Scholar]
- 27.Davis K, et al. , Quantitative Measurement of Ligand Exchange on Iron Oxides via Radiolabeled Oleic Acid. Langmuir, 2014. 30(36): p. 10918–10925. [DOI] [PubMed] [Google Scholar]
- 28.Xie S, et al. , Superparamagnetic iron oxide nanoparticles coated with different polymers and their MRI contrast effects in the mouse brains. Applied Surface Science, 2015. 326: p. 32–38. [Google Scholar]
- 29.Kohler N, et al A Bifunctional Poly(ethylene glycol) Silane Immobilized on Metallic Oxide-Based Nanoparticles for Conjugation with Cell Targeting Agents. Journal of the American Chemical Society, 2004. 126(23): p. 7206–7211. [DOI] [PubMed] [Google Scholar]
- 30.Fernandez P, Neutrino Physics in Present and Future Kamioka Water-Cherenkov Detectors with Neutron Tagging. 2017: Springer, Cham. p. 45–48. [Google Scholar]
- 31.Kobayashi H, et al. , New Strategies for Fluorescent Probe Design in Medical Diagnostic Imaging. Chemical Reviews, 2010. 110(5): p. 2620–2640. [DOI] [PMC free article] [PubMed] [Google Scholar]
- 32.Shaffer TM, et al. , Silica nanoparticles as substrates for chelator-free labeling of oxophilic radioisotopes. Nano letters, 2015. 15(2): p. 864–868. [DOI] [PMC free article] [PubMed] [Google Scholar]
- 33.L’Annunziata MF, Preface, in Radioactivity, L’Annunziata MF, Editor. 2007, Elsevier Science B.V.: Amsterdam. p. xiii–xv. [Google Scholar]
- 34.Robertson R, et al. , Optical imaging of Cerenkov light generation from positron-emitting radiotracers. Phys Med Biol, 2009. 54(16): p. N355–65. [DOI] [PMC free article] [PubMed] [Google Scholar]
- 35.Zhou B, et al. , Controlling upconversion nanocrystals for emerging applications. Nature Nanotechnology, 2015. 10(11): p. 924–936. [DOI] [PubMed] [Google Scholar]
Associated Data
This section collects any data citations, data availability statements, or supplementary materials included in this article.


