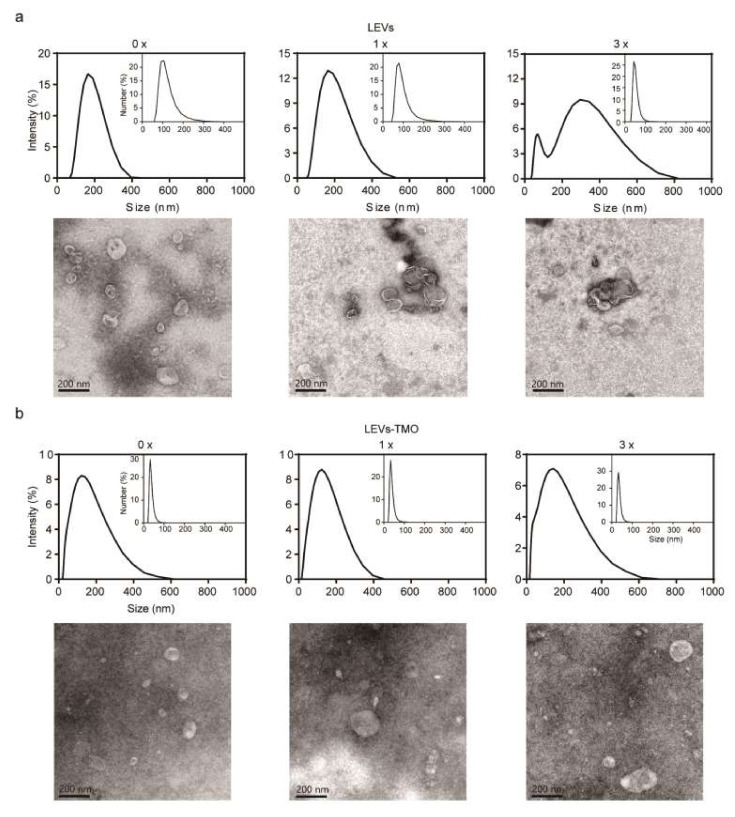
Figure 4.
Size distributions of LEVs and LEVs-TMO over freeze-thaw cycles. (a) Top: Dynamic light scattering (DLS) measurements of the size distribution intensity for LEVs exposed to 0, 1, and 3 freeze-thaw cycles. Insets: number-size distribution curves. Bottom: TEM images of LEVs exposed to different numbers of freeze-thaw cycles. (b) Top: DLS measurements of the size distribution intensity for LEVs-TMO exposed to 0, 1, and 3 freeze-thaw cycles. Insets: number size distribution curves. Bottom: TEM images of LEVs-TMO of different freezing and thawing cycles. Data are presented as mean ± standard error of mean (SEM).

