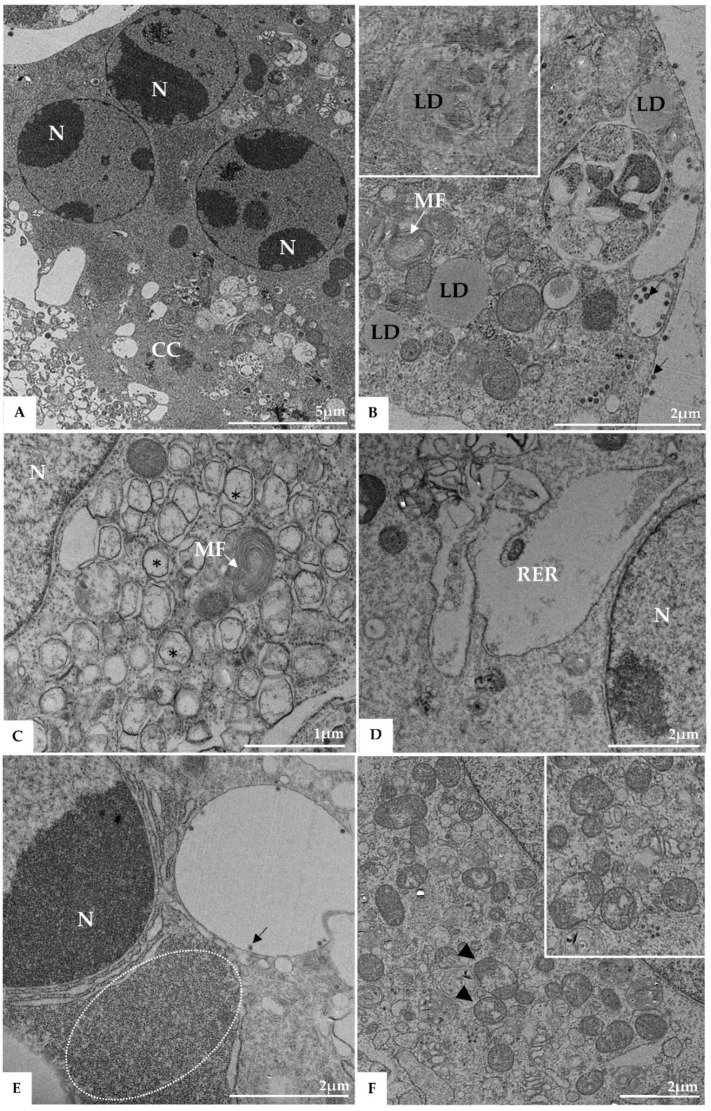
Figure 4.
Syncytia formation (A), proliferation of lipid droplets (LD) (B), and double membrane vesicle (*) (C), myelin figures (MF) (B,C), thickening of the rough endoplasmic reticulum (RER) (D), electron-dense ribosomes (marked area) (E), and degeneration of mitochondria (arrowhead) (F) in Vero-E6 cells 48 h post-infection with SARS-CoV-2 (TEM images). Virus particles (arrow), cell cytoplasm (CC), nucleus (N).

