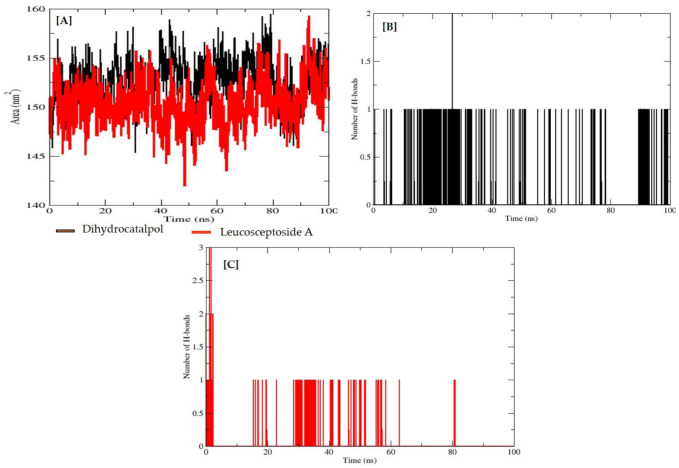
Figure 9.
Solvent-accessible surface area (SASA) of α-glucosidase protein (A). Y-axis plots the thermodynamic calculations of changes in alpha-glucosidase complex surface area in nanometers squared (nm2) (Å) while X-axis plots residue stability time from 0 ns to 100 ns. The number of hydrogen bonds of alpha-glucosidase–dihydrocatalpol complex from 0 ns to 100 ns (B) and leucosceptoside A (C). Y-axis plots the calculated number of hydrogen bonds while X-axis plots variation in time during molecular dynamic simulations.

