Abstract
Nuclear spin relaxation dispersion parameters are proposed as indicators of the binding mode of a ligand to a protein. Hyperpolarization by dissolution dynamic nuclear polarization (D-DNP) provided a 13C signal enhancement between 3000–6000 for the ligand 4-(trifluoromethyl) benzene-1-carboximidamide binding to trypsin. The measurement of 13C R2 relaxation dispersion was enabled without isotope enrichment, using a series of single-scan Carr-Purcell-Meiboom-Gill experiments with variable refocusing delays. The magnitude in dispersion for the spins of the ligand is correlated to the position with respect to the salt bridge between protein and the amidine group of the ligand, indicating the ligand binding orientation. Hyperpolarized relaxation dispersion is an alternative to chemical shift or NOE measurements for determining ligand binding modes.
Keywords: Protein-Ligand Interaction, Nuclear Magnetic Resonance, Dynamic Nuclear Polarization, Nuclear Spin Relaxation
Graphical Abstract
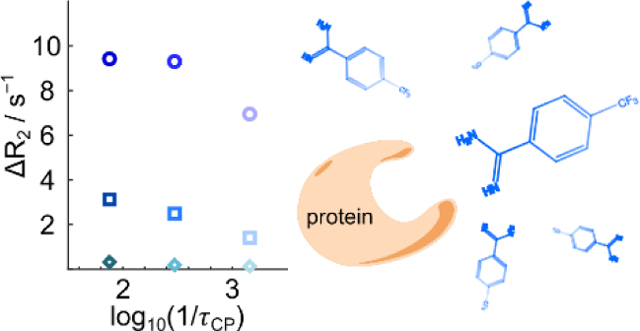
The change in the 13C transverse nuclear spin relaxation rate, also known as relaxation dispersion, is a sensitive parameter for determining the ligand binding mode in a protein binding site by NMR. The measurement of the 13C relaxation dispersion is enabled by the sensitivity gain of several thousand-fold provided by dissolution dynamic nuclear polarization.
Structural information on ligand binding is essential for understanding enzyme function and the molecular basis for signaling, and is imperative to the rising field of rational drug design. Specific information on the ligand binding mode is available from Nuclear Magnetic Resonance (NMR) through interligand or intraligand NOE,[1–4] chemical shift perturbation,[5,6] residual dipolar coupling,[7] and related methods. Chemical exchange between free and bound forms of the ligand enables the detection of binding through observation of changes in ligand signal alone. Ligand-observed NMR eliminates the limitation on the target molecular size.[8]
Here, we propose the use of relaxation dispersion (RD) of 13C spins as an alternative and potentially highly sensitive parameter to determine ligand binding orientation based on ligand-observed NMR. R2 relaxation dispersion is measured by a Carr-Purcell-Meiboom-Gill (CPMG) experiment with a variable echo refocusing delay. The exceptional ability of RD in characterizing chemical exchange kinetics is well known.[9–11] However, its dependence on chemical shift differences also points to an applicability as a structurally sensitive parameter. The 13C signals of small-molecule ligands typically show dispersed chemical shifts, and carbon atoms are distributed throughout the molecule. The measurement of 13C RD is enabled by hyperpolarization of nuclear spins, which provides sufficient sensitivity for the observation of signals from ligands under physiological or near-physiological conditions, without isotope enrichment.[12–14]
Briefly, hyperpolarization by dissolution dynamic nuclear polarization (D-DNP) generates a non-equilibrium spin alignment in a frozen solid at a temperature near 1 K, which is subsequently dissolved for liquid-state NMR spectroscopy.[15] Previously, authors of this publication have applied D-DNP for the measurement of 19F relaxation[16] and relaxation dispersion[17] after rapidly mixing hyperpolarized ligand samples with a protein solution.[18]
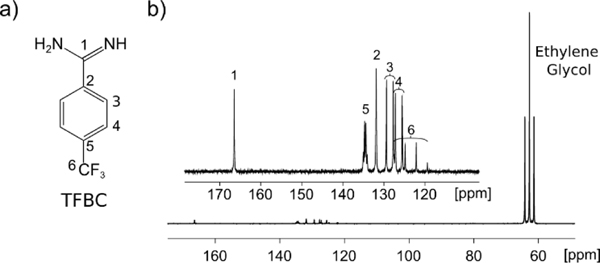
In a DNP hyperpolarized spectrum of 4-(trifluoromethyl)benzene-1-carboximidamide hydrochloride (TFBC), a series of enhanced carbon signals are observed (Figure 1). The signal enhancement in this spectrum ranges from 3000 to 6000-fold for C1-C5 of the ligand (Figure S1).
Figure 1.
a) Structure of the ligand 4-(trifluoromethyl)benzene-1-carboximidamide (TFBC) with positions of the C atoms indicated. b) Hyperpolarized 13C spectrum of TFBC with target peaks labeled. The spectrum was measured without decoupling. The ethylene glycol signal from the solvent in the DNP sample appears near 60 ppm.
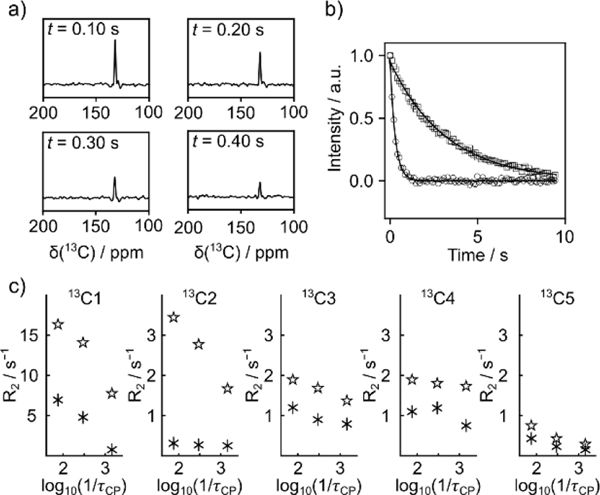
The R2 relaxation rates for carbon nuclei C1-C5 in TFBC were measured using a CPMG pulse sequence with selective excitation of each signal. In Figure 2a, spectra obtained by a Fourier transform of four separate spin echoes taken from the CPMG echo train are shown. The reduction in the 13C signal intensity as a function of the echo time is readily seen. The R2 relaxation rates were obtained by fitting the integrated peak intensities from all spin echoes. Figure 2b shows these fitted curves for the C2 spin in the free ligand, as well as with protein present (other curves are shown in Figures S5–9). The increased R2 and faster signal decay in the data set with protein indicates the binding.
Figure 2.
a) Spectra from selected echoes in a single-scan CPMG experiment of 2.6 mM hyperpolarized TFBC with 45 μM trypsin. The experiment included chemical shift selection of the C2 signal. b) Data points and fitted curves for R2 relaxation measurements of C2 obtained in the absence (open squares, R2,f = 0.31 s−1) and presence (open circles, R2,obs = 3.43 s−1) of trypsin. Data points were measured with pulsing intervals of 13.24 ms. In the figure, only every 8th data point is plotted for clarity. Each point corresponds to a peak integral from an echo as shown in (a). c) R2 relaxation rates of hyperpolarized TFBC measured for different ligand spins without (asterisks) and with protein (stars), at different CPMG pulsing delay τcp. Data points include a concentration variation of less than 13% (Table S1–S5).
For the measurement of relaxation dispersion, R2 relaxation traces were acquired with different pulsing delays τcp = 0.7, 3.3, and 13.2 ms between refocusing pulses. The resulting relaxation rates for each 13C spin in the ligand are plotted in Figure 2c. With the addition of trypsin, the R2 rate of C1 shows the largest dispersion as the pulsing delay is changed. In contrast, the R2 measured for C3, C4 and C5 shows smaller changes. The free ligand (asterisks in the figure) also demonstrates dispersion on several 13C spins. This dispersion may be caused by the internal motion of the amidine group, as well as scalar coupling of 13C and other nuclei.[19,20]
The contributions to the observed relaxation rates, including the exchange process in ligand binding, are described by [17]
| (1) |
Here, the fractions of free and bound ligand are represented as Xf and Xb, Δν is the chemical shift difference between the free and bound form of the ligand, and τb the lifetime of the bound form. This equation is valid in the regime of intermediate exchange rates, where the concentration of the bound ligand is much smaller than that of the free ligand.[11] In Figure 2c, the experiments for every spin position were carried out within the same range of pulsing delays. The exchange terms [1 – 2 τb/τcp tanh(τcp/2τb)] correspondingly show the same magnitudes. According to the Equation 1, R2,obs is directly proportional to the square of the chemical shift difference Δν between the free and bound form of the ligand, and thus can be used for the characterization of the ligand binding mode. The trend of decreasing R2 dispersion observed from C1 and C2 to other positions is supported by the expectation that the amidine moiety of the ligand forms a salt bridge with the carboxyl group of Asp189 on trypsin.[21,22] Although the structure of trypsin with bound TFBC is unknown, the related ligand benzamidine, which is lacking the CF3 group, forms this salt bridge.
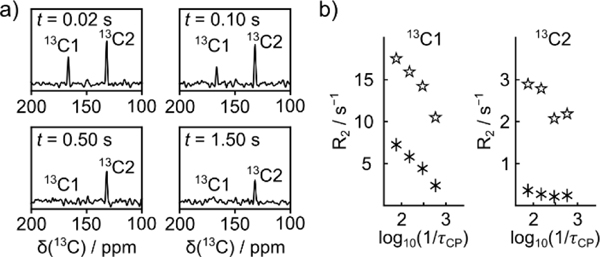
In order to further optimize the experiment, it would be desirable to measure the relaxation of more than one site in the molecule simultaneously. A simultaneous measurement further eliminates any variation of final concentrations. Because signals are analyzed from Fourier transforms of echoes, multiple peaks can be observed if permitted by spectral resolution. A CPMG experiment with selective excitation of two signals is shown in Figure 3. In the data from this figure, the final concentration of TFBC ligand and trypsin was reduced to 0.715 ± 0.027 mM and 15.4 ± 2.0 μM, respectively, while the shortest CPMG refocusing delay was increased ~3-fold to provide sufficient chemical shift resolution. In both experiments with single- and double-peak excitation, the lowest signal to noise ratio (SNR) for the peaks shown was approximately 10. The detection limit for acquiring these signals using the 400 MHz NMR spectrometer with a room-temperature probe is on the order of 300 μM, although errors in R2 determination would likely increase. The experiment would further be compatible with other sensitivity enhancement techniques including the use of a cryoprobe, which would enhance the sensitivity by another factor of ~3. In this case, the detection limit for the peaks shown would be near 100 μM for ligand at natural isotope abundance, or approximately 1 μM 13C.
Figure 3.
a) Selected spectra from echoes obtained after selective excitation of C1 and C2 on hyperpolarized TFBC, measured by a signal-scan CPMG pulse sequence with pulsing delay of 13.24 ms. The concentration of the unlabeled TFBC is 0.7 mM (7.9 μM 13C). b) Data points for R2 relaxation rates of C1 and C2 measured in the absence (asterisks) and presence of 17 μM protein (stars), at different CPMG pulsing delays τcp. Data points include a concentration variation of less than 17% (Table S7).
The signals shown in Figure 3 are from C1 and C2, which exhibit the largest dispersion. In these experiments, the peaks from both spins are observed in the spectra of each echo (Figure 3a). The relaxation rates of C1 and C2 can be measured simultaneously at each pulsing delay (Figure 3b). As in the experiments with single-peak selection (Figure 2c), a larger R2 dispersion was observed for C1 compared to C2. At the lower concentration and correspondingly lower signal, the variation in the measured values in Figure 3b is larger than in Figure 2c, within ~20% of each value. Experiments with double-peak excitation were further carried out under similar sample conditions as in Figure 2c, showing a close agreement with the single-peak data (Figure S14).
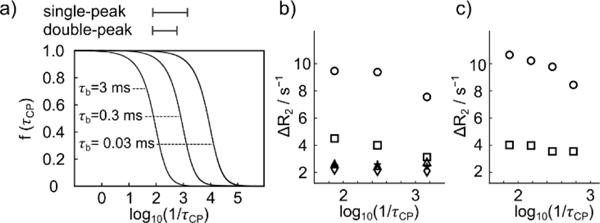
The observed relaxation rate, according to Equation 1, contains a contribution due to relaxation in the free ligand. In the following, we consider the contribution to R2 added by the binding process, ΔR2 = R2,obs – XfR2,f. The dependence of this contribution on log(1/τcp) follows a sigmoidal shape, reaching plateaus at both ends (Figure 4a). The location of the mid-point of the dispersion curve depends on the lifetime τb of the protein-ligand complex. Therefore, additional information on the dynamics of the ligand binding is available from the dispersion curves. The ranges in log(1/τcp) accessed by the experiment are indicated by horizontal bars in Figure 4a. Since the curves in Figure 4b and c do not plateau at the shortest pulsing time, the lifetime of TFBC binding to trypsin τb is not unambiguously determined. The curves are, however, consistent with the previous 19F relaxation dispersion measurement of TFBC in the presence of trypsin, where a τb value of 0.3 ms was found.[17] The lower limit of the pulsing delay (right side of the graphs in Figure 4) is primarily governed by the signal acquisition time for each echo, which is required for chemical shift resolution. The pulsing rate could be increased at a higher magnetic field, where the frequency difference between signals is larger, to cover a larger portion of the dispersion curve.
Figure 4.
a) Relaxation dispersion curves plotted from f(τcp) = 1-(2τb/τcp) tanh(τcp/2τb) with τb = 3, 0.3, 0.03 ms. On the horizontal axis, the ranges used in the experiments with single- and double-peak excitation was indicated. b) Changes in relaxation of hyperpolarized TFBC upon addition of protein, for C1-C5 (circle, square, dagger, triangle, and diamond), at different CPMG pulsing delays τcp. Each data point was calculated from observed relaxation rates using ΔR2 = R2,obs - XfR2,f, whereby Xf is approximated as 1. c) Changes in relaxation from experiments with double-peak excitation, calculated as in (b).
Based on this value, in the experiments with single-peak excitation (Figure 2b), the variation of the pulsing delay τcp from 13.2 ms to 0.7 ms reflects values for the exchange term between 95% to 30% of the maximum. The shortest pulsing delay achieved in the experiments with double-peak excitation was 1.7 ms (Figure 4c), which was required to separate the two peaks.
An estimate of experimental errors suggests that the errors of ΔR2 are mainly derived from the fitting of R2,obs curves. The errors for R2,obs and R2,f were estimated from the data fits. For spins with large relaxation rates, for example spin C1, a smaller number of data points acquired in the CPMG experiments are above the baseline, resulting in larger errors. Although larger errors were observed for spins with faster relaxation, the relative errors in ΔR2 are estimated at below 10% in the experiments with single-peak excitation and below 20% in the experiments with double-peak excitation (Figures 4b and c).
The magnitude of effect the fitting errors have on the resulting ΔR2 also depends on the fraction of bound ligand Xb = 1 - Xf, and hence on the KD parameter for the protein-ligand interaction. In the concentration regime of the experiments described here, the calculation of ΔR2 assumed the simplification that Xf = 1. The measurement of relaxation dispersion generally requires a weakly binding ligand in the intermediate exchange regime. Using the parameters in these experiments, for a weakly binding ligand with KD > 10 μM, the fraction of bound ligand Xb is at the level of a percent. In this case, the ΔR2 values in Figure 4c change by less than 1 % when assuming the above simplification. This difference is not further considered.
The difference of the relaxation rates between the plateaus at a short and long pulsing rate is proportional to the square of the theoretical chemical shift difference between the free and bound ligand. The contribution of the binding to R2 relaxation dispersion at each target position on TFBC is shown in Figure 4 as ΔR2 = R2,obs - XfR2,f. Here, the contribution of free ligand to the relaxation is subtracted. In both the experiments with single-peak excitation and double-peak excitation, a clear change in ΔR2 is observed for C1, with the transition region starting near log10(1/τcp) ≈ 2.5. Comparably smaller dispersion is seen for C2 and the other spins. Although only three or four points were included for fitting, C1 demonstrated a larger relaxation dispersion, in correspondence to the chemical shift difference measurement (Table S11). The location dependence in the relaxation dispersion experiments of TFBC directly reflects the orientation of the bound ligand.
As seen in Figure 4, not the entire R2 dispersion curve was measured due to an upper limit in the CPMG echo time. This limit is a result of obtaining the necessary spectral resolution. Nevertheless, the point of inflection is at the same value for 1/τcp for every carbon position in the molecule. Therefore, the magnitude of the change in R2 between the first point on the plateau of the curve and the last point in the transition region is indicative of the relaxation dispersion due to binding.
The relaxation dispersion is related to chemical shift differences that arise from ligand binding through the third term of Equation 1. Chemical shift changes upon binding are in some screening experiments directly measured,[5] albeit typically for high-sensitivity nuclei such as 1H. However, the 1H NMR chemical shifts measurement is hindered by the overlap of peaks and only small chemical shift changes of less than 3 Hz in the observed concentration range. For comparison with the relaxation dispersion data observed here, we measured 13C chemical shift differences using non-hyperpolarized NMR (Figure S15, Table S11). As is the case for relaxation dispersion parameters, the magnitude of chemical shift differences observed for TFBC correlates to the distance of the respective spin to the salt bridge at the putative binding site. The chemical shift measurements are complicated by the appearance of peaks, which are broadened presumably in part due to exchange and due to low signal intensity.
The 13C relaxation dispersion in principle is more sensitive to the change upon binding than a direct chemical shift measurement, as a result of the dependence of the exchange term on Δν2. The relaxation measurement affords information on the dynamic binding process. The frequency dependence of the exchange term depends on the lifetime τb of the bound complex. Relaxation dispersion is the primary means of measuring this lifetime by NMR directly, without requiring use of the equilibrium dissociation constant and an estimate of the on-rate.[17]
Since τb is a global parameter for the entire ligand, it is expected to have an equal effect on each of the signals. The remaining parameter contributing to relaxation dispersion, Δν2, is sensitive to ligand binding structure. In addition to proving binding and binding dynamics, relaxation dispersion measurements may in the future be used for the determination of the binding mode structure.[23] Thereby, hyperpolarization enables the relaxation measurement of unlabeled 13C spins using a short acquisition time in a single-scan experiment. This is of importance for the measurement of binding to unstable proteins or protein complexes.
In conclusion, hyperpolarization-assisted NMR enabled the measurement of 13C relaxation dispersion site-specifically for individual signals of a ligand binding to a protein. The observed dispersion is sensitive to chemical shift changes, significantly extending the available information for describing ligand binding available from R2 relaxation measurements. Here, the dispersion parameter was demonstrated to reveal information on the binding mode of the ligand. This measurement can leverage the substantial sensitivity gains of hyperpolarization for applications of NMR in the determination of biomolecular structure and interactions.
Supplementary Material
Acknowledgements
Financial support from the National Institutes of Health (Grant R01GM132655) is gratefully acknowledged.
References
- [1].Chen W-N, Nitsche C, Pilla KB, Graham B, Huber T, Klein CD, Otting G, J. Am. Chem. Soc. 2016, 138, 4539–4546. [DOI] [PubMed] [Google Scholar]
- [2].Sánchez-Pedregal VM, Reese M, Meiler J, Blommers MJJ, Griesinger C, Carlomagno T, Angew. Chem. 2005, 117, 4244–4247. [DOI] [PubMed] [Google Scholar]
- [3].Constantine KL, Davis ME, Metzler WJ, Mueller L, Claus BL, J. Am. Chem. Soc. 2006, 128, 7252–7263. [DOI] [PubMed] [Google Scholar]
- [4].Vaid TM, Chalmers DK, Scott DJ, Gooley PR, Chem. Eur. J. 2020, 26, 11796–11805. [DOI] [PubMed] [Google Scholar]
- [5].Williamson MP, Prog. Nucl. Magn. Reson. Spectrosc. 2013, 73, 1–16. [DOI] [PubMed] [Google Scholar]
- [6].Arai M, Ferreon JC, Wright PE, J. Am. Chem. Soc. 2012, 134, 3792–3803. [DOI] [PMC free article] [PubMed] [Google Scholar]
- [7].Seidel RD, Zhuang T, Prestegard JH, J. Am. Chem. Soc. 2007, 129, 4834–4839. [DOI] [PMC free article] [PubMed] [Google Scholar]
- [8].Gossert AD, Jahnke W, Prog. Nucl. Magn. Reson. Spectrosc. 2016, 97, 82–125. [DOI] [PubMed] [Google Scholar]
- [9].Sugase K, Lansing JC, Dyson HJ, Wright PE, J. Am. Chem. Soc. 2007, 129, 13406–13407. [DOI] [PMC free article] [PubMed] [Google Scholar]
- [10].Moschen T, Grutsch S, Juen MA, Wunderlich CH, Kreutz C, Tollinger M, J. Med. Chem. 2016, 59, 10788–10793. [DOI] [PMC free article] [PubMed] [Google Scholar]
- [11].Loria JP, Rance M, Palmer AG, J. Am. Chem. Soc. 1999, 121, 2331–2332. [Google Scholar]
- [12].Lerche MH, Meier S, Jensen PR, Baumann H, Petersen BO, Karlsson M, Duus JØ, Ardenkjær-Larsen JH, J. Magn. Reson. 2010, 203, 52–56. [DOI] [PubMed] [Google Scholar]
- [13].Liu M, Zhang G, Mahanta N, Lee Y, Hilty C, J. Phys. Chem. Lett 2018, 9, 2218–2221. [DOI] [PMC free article] [PubMed] [Google Scholar]
- [14].Zhang G, Ahola S, Lerche MH, Telkki V-V, Hilty C, Anal. Chem. 2018, 90, 11131–11137. [DOI] [PMC free article] [PubMed] [Google Scholar]
- [15].Ardenkjær-Larsen JH, Fridlund B, Gram A, Hansson G, Hansson L, Lerche MH, Servin R, Thaning M, Golman K, Proc. Natl. Acad. Sci. USA 2003, 100, 10158–10163. [DOI] [PMC free article] [PubMed] [Google Scholar]
- [16].Kim Y, Hilty C, Angew. Chem. Int. Ed. 2015, 54, 4941–4944. [DOI] [PMC free article] [PubMed] [Google Scholar]
- [17].Liu M, Kim Y, Hilty C, Anal. Chem. 2017, 89, 9154–9158. [DOI] [PMC free article] [PubMed] [Google Scholar]
- [18].Bowen S, Hilty C, Phys. Chem. Chem. Phys. 2010, 12, 5766–5770. [DOI] [PubMed] [Google Scholar]
- [19].Becker ED, Shoup RR, Pure Appl. Chem. 1972, 32, 51–66. [Google Scholar]
- [20].Shoup RR, VanderHart DL, J. Am. Chem. Soc. 1971, 93, 2053–2054. [Google Scholar]
- [21].Krieger M, Kay LM, Stroud RM, J. Mol. Biol. 1974, 83, 209–230. [DOI] [PubMed] [Google Scholar]
- [22].Katz BA, Mackman R, Luong C, Radika K, Martelli A, Sprengeler PA, Wang J, Chan H, Wong L, J. Chem. Biol. 2000, 7, 299–312. [DOI] [PubMed] [Google Scholar]
- [23].Wang Y, Kim J, Hilty C, Chem. Sci. 2020, 11, 5935–5943. [DOI] [PMC free article] [PubMed] [Google Scholar]
Associated Data
This section collects any data citations, data availability statements, or supplementary materials included in this article.


