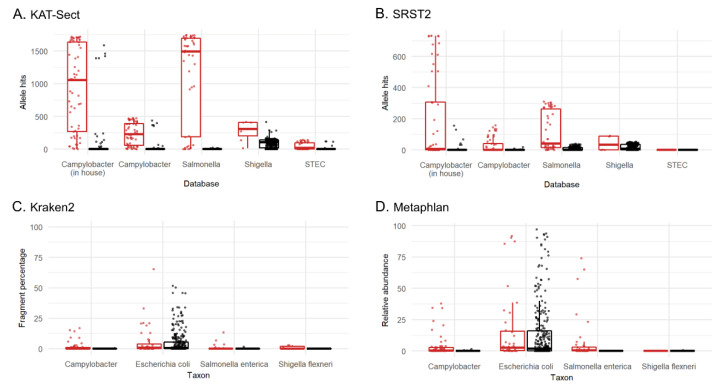
Figure 4.
Pathogen detection tools compared: (A) KAT-SECT; (B) SRST2; (C) Kraken2; (D) Metaphlan. Culture-positive (red), culture-negative (black). x-axis displays the curated database chosen for each pathogen for KAT-SECT and SRST2 and the taxon for Metaphlan and Kraken2. Y-values plotted for KAT-SECT and SRST2 are the sum of the identified alleles from reference databases. An “allele hit” was defined by default settings in SRST2 and when k-mer coverage was greater than 10% in KAT-SECT. Values plotted for Kraken2 and MetaPhlAn are the percentage of fragments covered by the clade rooted at this taxon and the relative abundances of reads classified to species, respectively.

