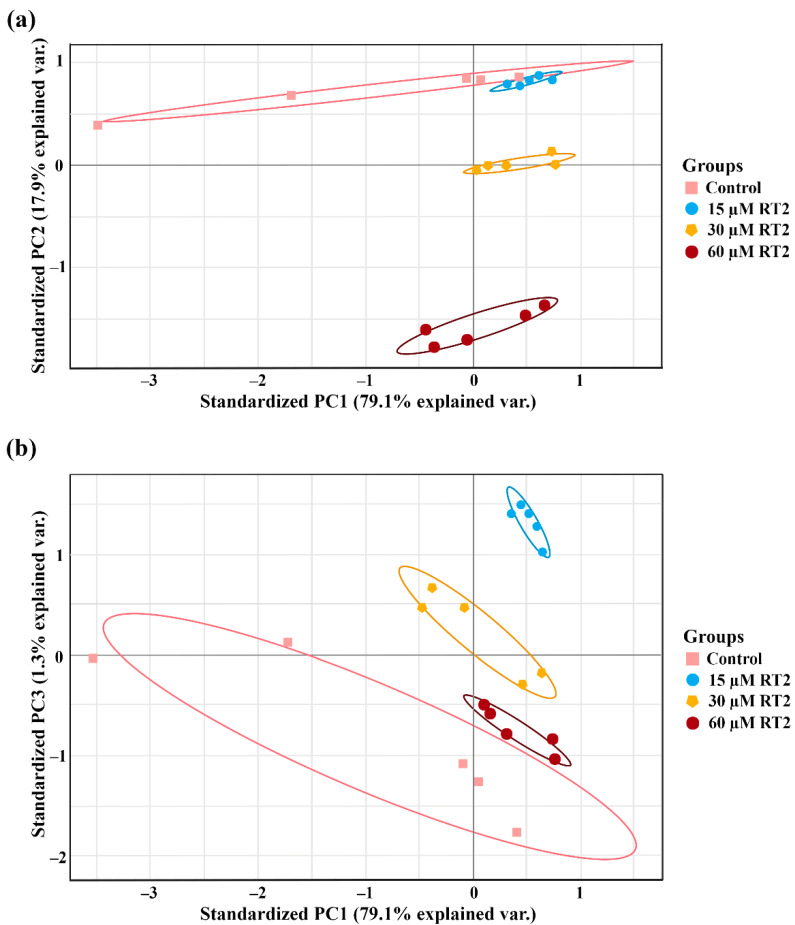
Figure 2.
The biplot-principal component analysis (PCA) showing (a) PC1 vs. PC2 and (b) PC1 vs. PC3 of the Caco-2 proteome. The groups of datasets that are close together are highly correlated in terms of the protein expression profile for each condition. On the other hand, the groups of datasets that are far apart are less correlated. Different groups are indicated by circles, including the untreated control group, and 15, 30, and 60 µM of RT2 peptide-treated groups. Each point corresponds to a different experimental repeat.

