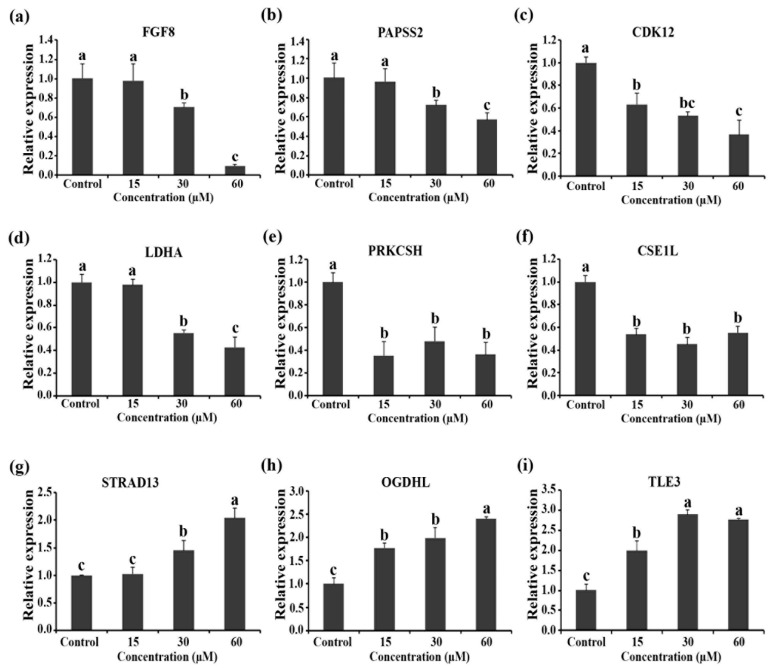
Figure 8.
RT-qPCR results for untreated control and RT2-treated Caco-2 cells (15, 30, and 60 µM) after 24 h. (a–f) show downregulated expression of FGF8, PASS2, CDK12, LDHA, PRKCSH, and CSE1L genes, respectively. (g–i) show upregulated expression of STRAD13, OGDHL, and TLE3 genes, respectively. These data are represented as mean ± SD. Different letter(s) on the top of each bar show the statistical differences from each other (p < 0.05, n = 3).

