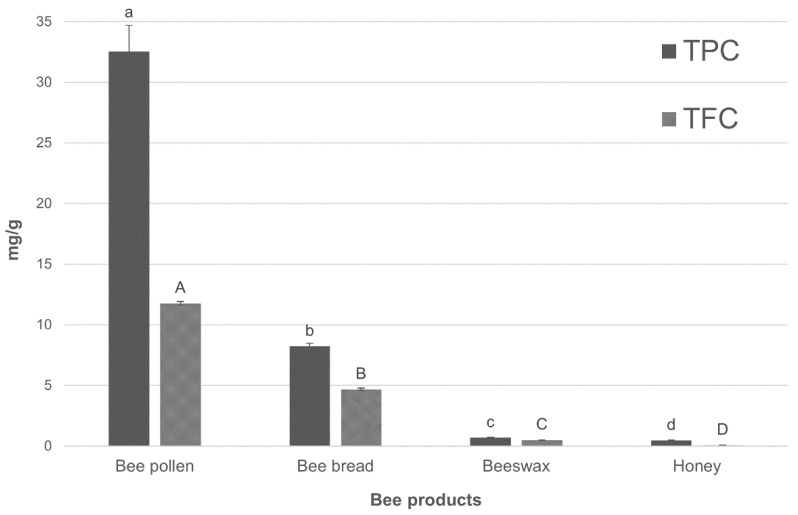
Figure 1.
Total phenolic content (TPC) and total flavonoid content (TFC) in bee products. TPC is expressed as mg of gallic acid equivalent (GAE) per gram of sample, while, TF is expressed as mg of quercetin equivalent (QE) per gram. The results for each sample are reported as the mean value of three repetitions. a–d: different letters indicate significant differences of TPC values (p < 0.05); A–D: different letters indicate significant differences of TFC values (p < 0.05).

