Abstract
Objective:
To validate the use of three-dimensional (3-D) surface rendering (SR) images to quantify the height of alveolar dehiscences.
Materials and Methods:
Twenty-four dehiscences were created on 9 incisors, 9 canines, and 6 premolars on 4 cadaver skulls. i-CAT cone beam computed tomography scans (CBCTs) were taken of each skull at .2 mm voxel size. Each dehiscence was quantified by 21 orthodontic residents using 3-D SR. The principal investigator (PI) also quantified each dehiscence using the 2-D multiplanar (MP) image and the 3-D SR image.
Results:
Results of this study showed an average method error of the residents as a group to be 0.57 mm with an intraclass correlation (ICC) of 0.77%. Residents' method error ranged from 0.45 mm to 1.32 mm, and the ICC ranged from 0.201% to 0.857%. Systematic error was low at −0.01 mm for the direct measurement compared with the residents' average 3-D SR at 1365 density value (DV) measurement. The 3-D SR at 1365 DV images were compared with the MP and 3-D SR images at 1200 DV, and no significant differences in measurements and low systematic error were noted. The method error of the PI was 0.45 mm, 0.45 mm, and 0.41 mm for 3-D SR at 1365 DV, 3-D SR at 1200 DV, and 2-D MP, respectively.
Conclusions:
3-D SR and 2D MRP can be used to measure dehiscences of the periodontium with similar levels of accuracy.
Keywords: Dehiscence, CBCT, Periodontal bony defect
INTRODUCTION
A newer technology, cone beam computed tomography (CBCT), is now being used to image the head and neck. The radiation dose is significantly less than that of a conventional CT and is approximately equivalent to a conventional full mouth series.1,2 The lower cost of the machine, the lower radiation dosage of the scan when compared with traditional CT machines, and the high image quality make the CBCT more practical for use in dentistry.3,4
CBCTs have been used to evaluate root angulations, positions of canines and supernumerary impactions, the temporomandibular joint, and placement of mini-implants, and to assess maxillary-mandibular facial asymmetries and the alveolar morphology of the periodontium.3,5,6 These capabilities enhance an orthodontist's base of information to allow more accurate diagnostic and treatment decisions.3,7
The periodontium provides support and nutrition to the teeth and allows for orthodontic tooth movement. Therefore, it is crucial that the periodontium be considered in the diagnosis and treatment plan of each patient.8 Dehiscences are one of the major bony defects that should be considered, because it is difficult to determine their presence.9 One study showed that 40% of American skulls had at least one dehiscence, with 67% of dehiscences in the mandible.10 Mostofa et al.11 performed anterior mandibular flaps and CBCTs on 32 patients. Seventy-eight percent of patients had at least one dehiscence, and the highest rates were seen on the canines. Orthodontists must factor in these rates of dehiscence when creating a treatment plan.
A systematic review of the literature has shown that orthodontic treatment has a very small detrimental effect on the periodontium.12 The orthodontic mechanics, proclination and expansion, have been used to alleviate crowding without producing significant negative effects on the level of the gingiva.13,14 However, study models and lateral cephalograms do not adequately show the effects of treatment on alveolar bone.15 Löst16 related the level of the gingiva to the level of the alveolar bone for dehiscences. The bone on average was 2.76 mm more apical than the overlying gingiva; however, wide variation was seen, with some distances as great as 7.5 mm. Steiner showed in vivo on monkeys that excessive movement of the incisors outside of the alveolus leads to dehiscences.17 Rungcharassaeng et al.18 took CBCTs before and after expansion and found a reduction in the alveolar crest around the first premolars (−4.42 mm) and molars (−2.92 mm). Other studies have shown alveolar crest bone changes from extraction treatment as well.19
Traditionally, two-dimensional (2-D) multiplanar (MP) images have been used to interpret CBCTs by using sagittal, axial, and coronal planes. These images have been shown to be useful in evaluation of the periodontium4,20; however, 3-D surface rendering (SR) images are becoming more popular in interpretation of CBCTs. The aim of this study was to evaluate the usage of 3-D SR images from CBCTs to quantify bony dehiscences.
MATERIALS AND METHODS
Dehiscence Construction
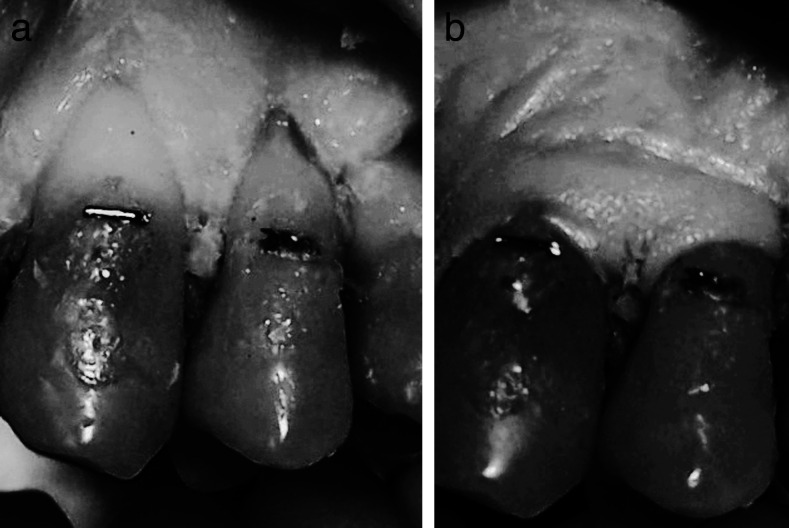
Four human cadaver heads with soft tissues present and dentate maxillary and mandibular arches were obtained from the Anatomy Department at St Louis University. Twenty-four dehiscences were created on the buccal aspect of 9 canines, 9 mandibular incisors, and 6 premolars. Before defect construction was performed, a surgical flap was made to allow access to the bone (Figure 1). A one-quarter round carbide bur and a handpiece were used to remove the bone overlying the roots. The margins of the bone were thinned to simulate natural dehiscences (Figure 1). Dehiscences were made at all different heights from the cementoenamel junction, so that no standardization was present. To reduce method error, a metallic marker was placed at the cementoenamel junction for a consistent fiducial marker. Dehiscences were measured directly from the metallic marker to the base of the dehiscence with a digital caliper to the nearest .01 mm. Each dehiscence was measured twice, and measurements were taken 2 weeks apart to allow assessment of reliability. All metallic restorations were removed from the dentition to reduce scatter radiation. Then the soft tissues were replaced and sutured tightly to simulate natural soft tissues.
Figure 1.
(a) Completed dehiscences with thinned margins. (b) Soft tissues sutured back into place.
Imaging
CBCTs of the four skulls were acquired with the i-CAT scanner (Imaging Sciences International, Hatfield, Pa). A single 25-second scan comprising 306 basic projections with a field of view measuring 16 cm (W) by 6 cm (H) and a .2 mm voxel size was captured. CBCT data were imported into Dolphin 3-D (Dolphin Imaging, version 10.5, Premium, Chatsworth, Calif).
The principal investigator (PI) used the 3-D SR image generated in Dolphin 3-D Imaging to make measurements from each metallic marker to the most apical extent of the dehiscence, starting at density values (DV) of 1200 and 1365 (Figure 2). The PI also used 2-D MP images to measure each dehiscence (Figure 3). Measurements were made twice for the 2-D MP and SR at a DV of 1200 images, and three times for the SR DV at 1365 images, with 1 week between measurements to assess reliability.
Figure 2.
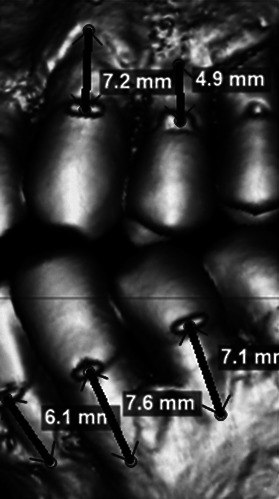
(a) 3-D surface rendering (SR) image at 1365 density value. (b) Measurement on 3-D SR image.
Figure 3.
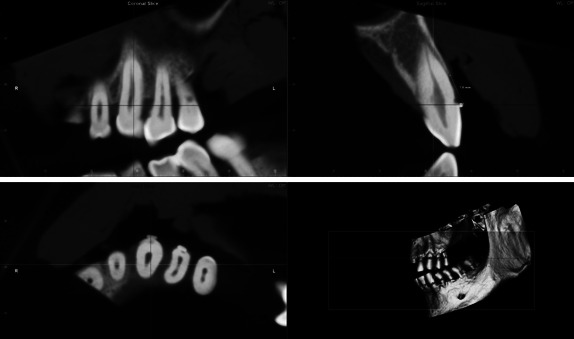
2-D multiplanar images using the coronal, sagittal, and axial planes.
Twenty-one orthodontic residents (including the PI) with at least 1 year of experience in manipulating CBCT images using Dolphin Imaging at St Louis University measured the dehiscences using the 3-D SR image, starting at the DV of 1365. Each resident was given the same tutorial on use of the software to manipulate the images.
Statistical Analyses
A standard statistics software program (Statistical Package for the Social Sciences [SPSS], version 17, SPSS Inc., Chicago, Ill) was used to analyze the data. To determine reliability, single-measure intraclass correlation coefficients (ICCs) were determined for all multiple sets of direct and CBCT measurements. The average of the multiple measurements was then used as the true value. To determine intraobserver error, direct measurements were compared with the average of the PI's MP and 3-D SR (at 1200 and 1365 DV) measurements, and the 3-D SR at 1365 DV was compared with the MP and the 3-D SR at 1200 DV measurements in three ways: (1) a two-tailed paired Student's t-test at <.05 significance level, (2) method error, and (3) single-measure ICCs. To determine interobserver error, the three tests were also used to compare direct measurements vs 3-D SR at 1365 DV for each resident, and vs the average of all residents. The teeth were then separated into three groups: incisors, canines, and premolars. ICC, method error (ME), and Wilcoxon signed rank tests were used to compare the direct measurements vs each tooth group.
RESULTS
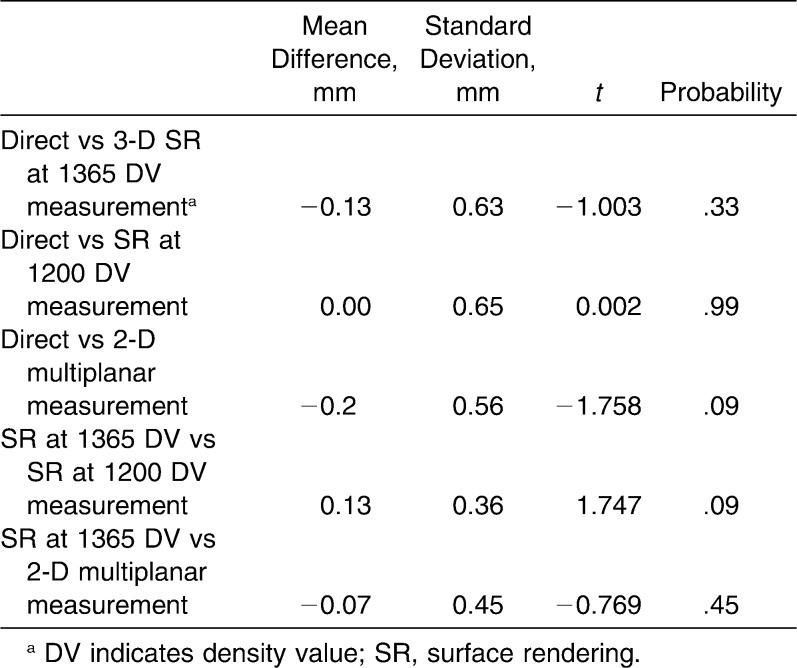
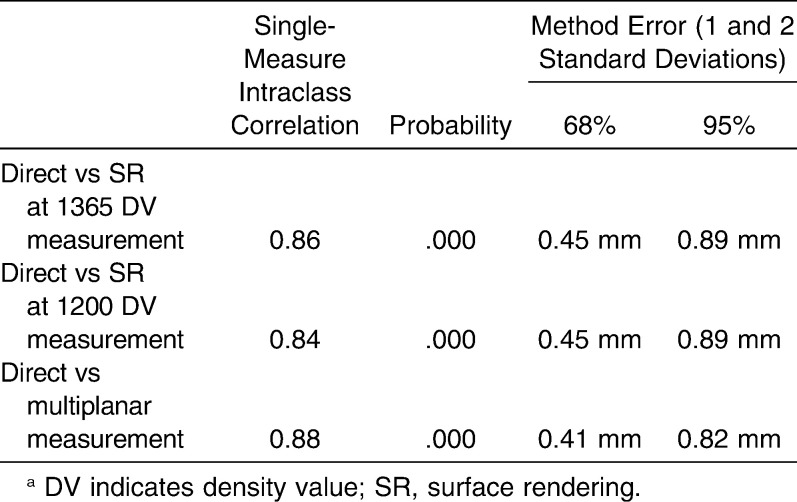
All ICCs of the multiple sets of measurements showed reasonable correlations (Figure 4). The 3-D SR image at 1365 DV showed the lowest correlation, reflecting the level of experience of the PI in manipulating the images and quantifying the dehiscences. Systematic intraobserver error showed low mean differences between the direct measurements compared with the MP and the 3-D SR at 1200 and 1365 DV; comparisons of the CBCT images with each other revealed no significant differences (Table 1). Random intraobserver error when direct measurements were compared with the different CBCT images showed high intraclass correlations and similar method errors of 0.45 mm, 0.45 mm, and 0.41 mm for 1365 DV 3-D SR, 1200 DV 3-D SR, and 2-D MP, respectively (Table 2).
Figure 4.
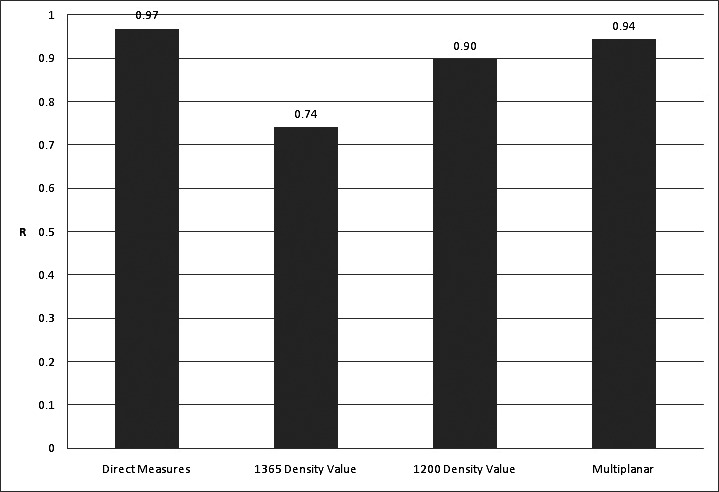
Intraobserver intraclass correlation showing reliability of multiple direct, 3-D surface rendering (1365 density value and 1200 density value), and 2-D multiplanar measurements.
Table 1.
Systematic Intraobserver Error Using a Paired t-Test
Table 2.
Random Intraobserver Errora
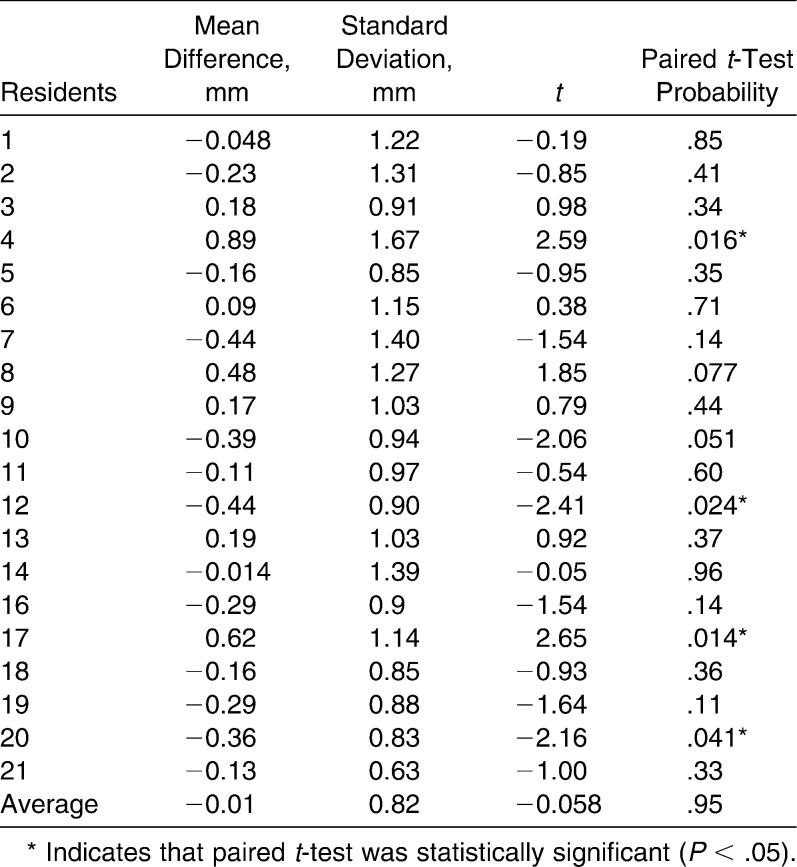
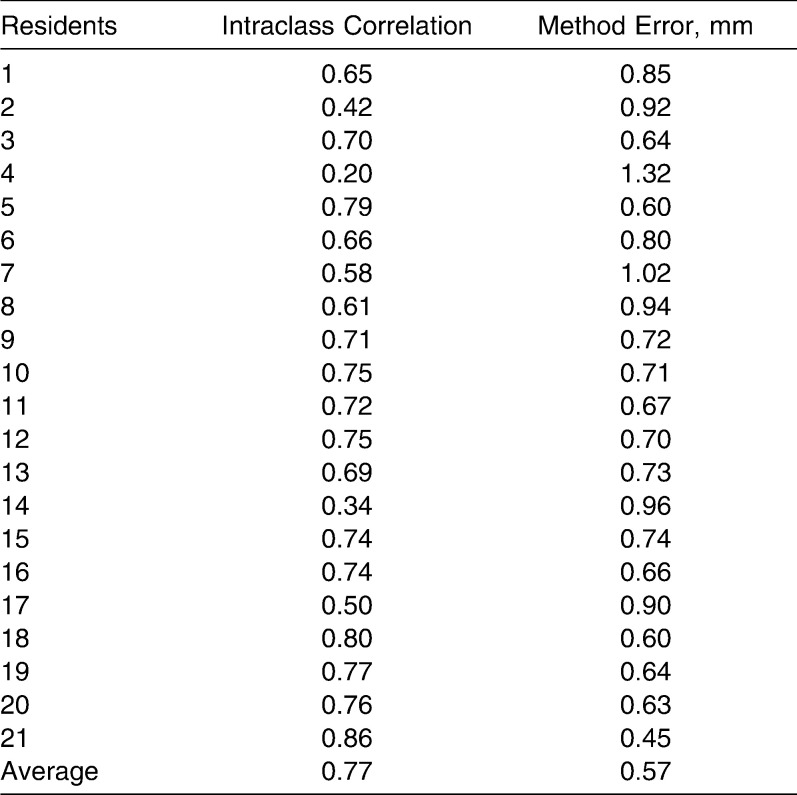
The systematic difference between direct and 3-D SR measurements was −0.01 mm for the average of the residents (Table 3). Four of 21 residents showed a significant difference between direct and 3-D SR measurements, with systematic differences ranging from −.44 mm to 0.89 mm (Table 3 and Figure 5). The ICC and ME for the average of the residents was 0.77% and 0.57 mm (Table 4 and Figure 6). The ICC range was from .20% to .86%, and the method error ranged from .45 mm to −1.32 mm (Table 4 and Figure 7). Residents' average measurements were not consistently above or below direct measurements (Figure 8).
Table 3.
Systematic Interobserver Error
Figure 5.
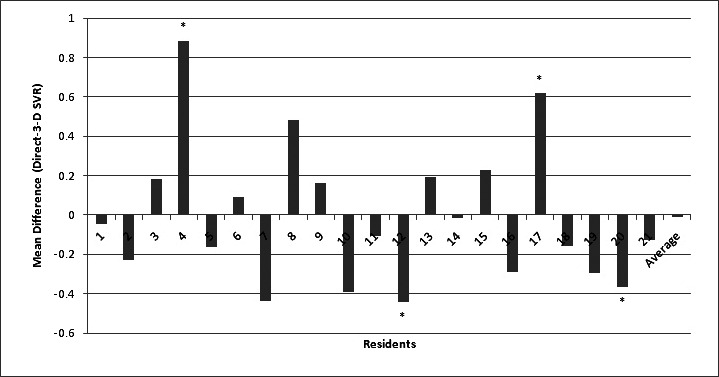
Systematic error mean difference for each resident and residents' average on 3-D surface rendering at 1365 density value measurement compared with direct measurement (* denotes paired t-test < .05).
Table 4.
Random Interobserver Error
Figure 6.
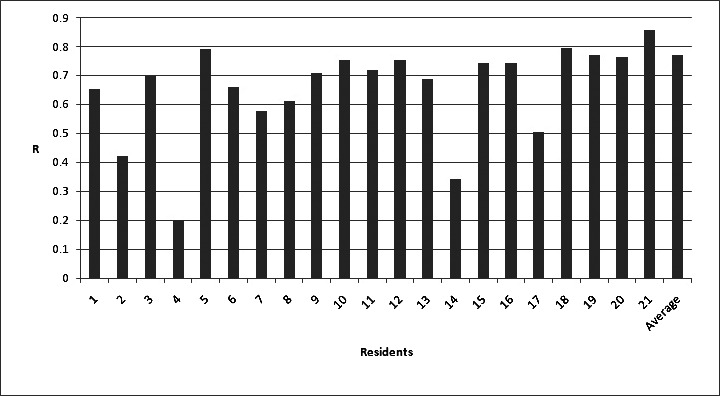
Single-measure intraclass correlation comparing direct measurements vs each resident's and that resident's average measurements on 3-D surface rendering.
Figure 7.
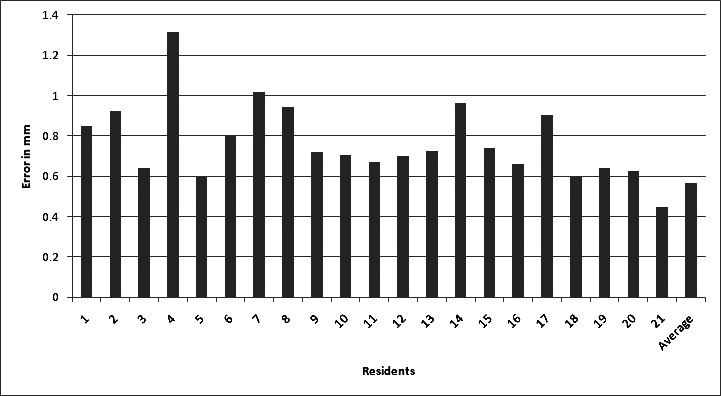
Method error comparing direct measurements against the 3-D surface rendering at 1365 density value measurement for each resident and the resident's average.
Figure 8.
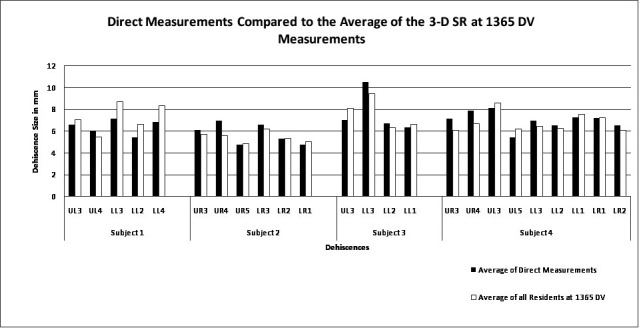
Direct measurements compared with the resident's average on the 3-D surface rendering (SR) starting at 1365 density value (DV).
Tooth groups were compared; incisors showed the best method error at 0.336 mm and ICC of 0.906% (Table 5). All tooth groups were not significantly different from the direct measurements attained using the Wilcoxon signed rank test (Table 5).
Table 5.
Comparing Different Tooth Groups With Intraclass Correlation, Method Error, and Wilcoxon Signed Rank Test
DISCUSSION
When CBCT images were compared with traditional intraoral radiography, it was found that CBCT had better potential to represent the alveolus, especially in detecting the 3-D volume of intrabony defects.21–23 Detection of dehiscences through traditional radiography or direct evaluation is nearly impossible. However, CBCT images offer a real advantage in the detection of these defects.
Results of this study show that dehiscences can be accurately measured using 3-D SR from CBCTs. Residents as a group showed only a 0.57 mm method error and a 0.77% intraclass correlation.
Mengel et al.4 showed that dehiscence height could be measured with only a .28 mm systematic difference. Mengel et al.24 conducted another study to measure dehiscences on implants and found the systematic difference to be 0.22 mm. These two studies compared traditional CT vs CBCT at 0.125 mm voxel size, and they showed similar results. The authors state that the CBCT showed better image quality. Misch et al.20 conducted a study measuring intrabony and dehiscence defects using CBCT at 0.4 mm voxel size. The systematic difference in height of both defects combined was found to be 0.41 mm. Fuhrmann25 used traditional CT with 1 mm slices and determined a 0.2 mm systematic difference in dehiscence height.
Previous studies used 2-D MP images on dry skulls with a known dehiscence size; findings were interpreted by only a few individuals, and only systematic differences were found. The current study has no standardized size of the dehiscences, the soft tissues were present, systematic and random differences were found, and the dehiscences were measured by 21 individuals. These methods better represent the normal anatomy of a random patient and interpretation of bony morphology on a CBCT by a random observer. The ability to quantify the dehiscence varies with the skill of the practitioner, as can be seen in the wide variation in method error noted among the residents. A learning curve for detecting dehiscences on the image was apparent. The PI had the most experience in manipulating the images and quantifying the dehiscences and showed the lowest error of 0.445 mm.
Interpretation of 2-D MP images has been shown to be highly accurate, with a systematic difference as low as 0.1 mm and a 1∶1 image-to-reality ratio.26–28 The 3-D SR image has not shown the same accuracy as some of the current studies, but these studies did not use definitive fiducial markers.29,30 Baumgaertel et al.26 measured 3-D SR images and showed very high correlations for single measurements compared with direct measurement. When multiple measurements were added together, the measurement sum became significantly smaller than the true value. The sum of the smaller measurements is due to the “partial volume effect.” In the current study, measurements varied from larger than the direct measure to smaller (Figure 8) and were only single measures. So this effect was negligible.
The small amount of error within the study is attributable mainly to human error. This error is due to the ability to distinguish between very thin bone and the root of the tooth (Figure 9). Voxel size and cadaver bone quality play smaller roles as well. According to Ballrick et al.,27 50% of the error is attributable to voxel size alone. The smaller the voxel, the clearer the image; however, this is done with an increased radiation dose to the patient.
Figure 9.
Human error. Dehiscences with thinned margins on the direct evaluation (a and c). Difficulty determining the junction between bone and tooth on the 3-D surface volume rendering at 1365 density value (b and d).
The 2-D MP images have been the standard for interpreting CBCT images. However, 3-D surface rendering is becoming more popular because of the user-friendly software. This study also examined the differences in measurements between 2-D MP images and 3-D SR images at different density values. The method error was nearly equivalent for each, with good correlations to the direct measurements. The 2-D MP was the most reliable and had the lowest random error. However, no significant difference was noted between the three image reconstructions. The 3-D SR starting at 1365 DV was used to measure the dehiscences because it offered the clearest view of the alveolar bone without interference from adjacent tissues. With conventional CT, definite known density values of different tissues are seen. The density value range is then set accordingly to allow visualization only of the tissues of interest (ie, bone).31 With CBCT, the density values are inconsistent based on the field of view.32 The CT DV starts at 1200 for the lowest-density bone,33 but CBCT values may be slightly higher.34 Therefore, selection of 1365 DV as the lowest DV would be within the normal range of low-density bone, and the interpreter could visualize the fine, low-density bony architecture.
For evaluating surface defects including dehiscences of the periodontium, 2-D MP or 3-D SR images may be used for interpretation. The 3-D SR image from a CBCT with 0.2 mm voxel size has the ability to accurately quantify dehiscences with submillimeter accuracy.
CONCLUSION
3-D SR and 2D MRP can be used to measure dehiscences of the periodontium with similar levels of accuracy.
REFERENCES
- 1.Ludlow J. B, Davies-Ludlow L. E, Brooks S. L, Howerton W. B. Dosimetry of 3 CBCT devices for oral and maxillofacial radiology: CB Mercuray, NewTom 3G and i-CAT. Dentomaxillofac Radiol. 2006;35:219–226. doi: 10.1259/dmfr/14340323. [DOI] [PubMed] [Google Scholar]
- 2.Mah J. K, Danforth R. A, Bumann A, Hatcher D. Radiation absorbed in maxillofacial imaging with a new dental computed tomography device. Oral Surg Oral Med Oral Pathol Oral Radiol Endod. 2003;96:508–513. doi: 10.1016/s1079-2104(03)00350-0. [DOI] [PubMed] [Google Scholar]
- 3.Moss J. P. The use of three-dimensional imaging in orthodontics. Eur J Orthod. 2006;28:416–425. doi: 10.1093/ejo/cjl025. [DOI] [PubMed] [Google Scholar]
- 4.Mengel R, Candir M, Shiratori K, Flores-de-Jacoby L. Digital volume tomography in the diagnosis of periodontal defects: an in vitro study on native pig and human mandibles. J Periodontol. 2005;76:665–673. doi: 10.1902/jop.2005.76.5.665. [DOI] [PubMed] [Google Scholar]
- 5.White S. C. Cone-beam imaging in dentistry. Health Phys. 2008;95:628–637. doi: 10.1097/01.HP.0000326340.81581.1a. [DOI] [PubMed] [Google Scholar]
- 6.Kau C. H, Richmond S, Palomo J. M, Hans M. G. Three-dimensional cone beam computerized tomography in orthodontics. J Orthod. 2005;32:282–293. doi: 10.1179/146531205225021285. [DOI] [PubMed] [Google Scholar]
- 7.Bjerklin K, Ericson S. How a computerized tomography examination changed the treatment plans of 80 children with retained and ectopically positioned maxillary canines. Angle Orthod. 2006;76:43–51. doi: 10.1043/0003-3219(2006)076[0043:HACTEC]2.0.CO;2. [DOI] [PubMed] [Google Scholar]
- 8.Mathews D. P, Kokich V. G. Managing treatment for the orthodontic patient with periodontal problems. Semin Orthod. 1997;3:21–38. doi: 10.1016/s1073-8746(97)80037-0. [DOI] [PubMed] [Google Scholar]
- 9.Janson G, Bombonatti R, Brandão A. G, Henriques J. F. C, de Freitas M. R. Comparative radiographic evaluation of the alveolar bone crest after orthodontic treatment. Am J Orthod Dentofacial Orthop. 2003;124:157–164. doi: 10.1016/s0889-5406(03)00392-5. [DOI] [PubMed] [Google Scholar]
- 10.Rupprecht R. D, Horning G. M, Nicoll B. K, Cohen M. E. Prevalence of dehiscences and fenestrations in modern American skulls. J Periodontol. 2001;72:722–729. doi: 10.1902/jop.2001.72.6.722. [DOI] [PubMed] [Google Scholar]
- 11.Mostafa Y. A, El Sharaby F. A, El Beialy A. R. Do alveolar bone defects merit orthodontists' respect? World J Orthod. 2009;10:16–20. [PubMed] [Google Scholar]
- 12.Bollen A, Cunha-Cruz J, Bakko D. W, Huang G. J, Hujoel P. P. The effects of orthodontic therapy on periodontal health: a systematic review of controlled evidence. J Am Dent Assoc. 2008;139:413–422. doi: 10.14219/jada.archive.2008.0184. [DOI] [PubMed] [Google Scholar]
- 13.Allais D, Melsen B. Does labial movement of lower incisors influence the level of the gingival margin? A case-control study of adult orthodontic patients. Eur J Orthod. 2003;25:343–352. doi: 10.1093/ejo/25.4.343. [DOI] [PubMed] [Google Scholar]
- 14.Greenbaum K. R, Zachrisson B. U. The effect of palatal expansion therapy on the periodontal supporting tissues. Am J Orthod. 1982;81:12–21. doi: 10.1016/0002-9416(82)90283-4. [DOI] [PubMed] [Google Scholar]
- 15.Fuhrmann R. Three-dimensional interpretation of periodontal lesions and remodeling during orthodontic treatment. Part III. J Orofac Orthop. 1996;57:224–237. doi: 10.1007/BF02190235. [DOI] [PubMed] [Google Scholar]
- 16.Löst C. Depth of alveolar bone dehiscences in relation to gingival recessions. J Clin Periodontol. 1984;11:583–589. doi: 10.1111/j.1600-051x.1984.tb00911.x. [DOI] [PubMed] [Google Scholar]
- 17.Steiner G. G, Pearson J. K, Ainamo J. Changes of the marginal periodontium as a result of labial tooth movement in monkeys. J Periodontol. 1981;52:314–320. doi: 10.1902/jop.1981.52.6.314. [DOI] [PubMed] [Google Scholar]
- 18.Rungcharassaeng K, Caruso J. M, Kan J. Y, Kim J, Taylor G. Factors affecting buccal bone changes of maxillary posterior teeth after rapid maxillary expansion. Am J Orthod Dentofacial Orthop. 2007;132:428.e1–428.e8. doi: 10.1016/j.ajodo.2007.02.052. [DOI] [PubMed] [Google Scholar]
- 19.Sarikaya S, Haydar B, Ciğer S, Ariyürek M. Changes in alveolar bone thickness due to retraction of anterior teeth. Am J Orthod Dentofacial Orthop. 2002;122:15–26. doi: 10.1067/mod.2002.119804. [DOI] [PubMed] [Google Scholar]
- 20.Misch K. A, Yi E. S, Sarment D. P. Accuracy of cone beam computed tomography for periodontal defect measurements. J Periodontol. 2006;77:1261–1266. doi: 10.1902/jop.2006.050367. [DOI] [PubMed] [Google Scholar]
- 21.Vandenberghe B, Jacobs R, Yang J. Diagnostic validity (or acuity) of 2D CCD versus 3D CBCT-images for assessing periodontal breakdown. Oral Surg Oral Med Oral Pathol Oral Radiol Endod. 2007;104:395–401. doi: 10.1016/j.tripleo.2007.03.012. [DOI] [PubMed] [Google Scholar]
- 22.Vandenberghe B, Jacobs R, Yang J. Detection of periodontal bone loss using digital intraoral and cone beam computed tomography images: an in vitro assessment of bony and/or infrabony defects. Dentomaxillofac Radiol. 2008;37:252–260. doi: 10.1259/dmfr/57711133. [DOI] [PubMed] [Google Scholar]
- 23.Agbaje J. O, Jacobs R, Maes F, Michiels K, van Steenberghe D. Volumetric analysis of extraction sockets using cone beam computed tomography: a pilot study on ex vivo jaw bone. J Clin Periodontol. 2007;34:985–990. doi: 10.1111/j.1600-051X.2007.01134.x. [DOI] [PubMed] [Google Scholar]
- 24.Mengel R, Kruse B, Flores-de-Jacoby L. Digital volume tomography in the diagnosis of peri-implant defects: an in vitro study on native pig mandibles. J Periodontol. 2006;77:1234–1241. doi: 10.1902/jop.2006.050424. [DOI] [PubMed] [Google Scholar]
- 25.Fuhrmann R. Three-dimensional interpretation of alveolar bone dehiscences: an anatomical-radiological study. Part I. J Orofac Orthop. 1996;57:62–74. doi: 10.1007/BF02190479. [DOI] [PubMed] [Google Scholar]
- 26.Baumgaertel S, Palomo J. M, Palomo L, Hans M. G. Reliability and accuracy of cone-beam computed tomography dental measurements. Am J Orthod Dentofacial Orthop. 2009;136:19–25; discussion 25–28. doi: 10.1016/j.ajodo.2007.09.016. [DOI] [PubMed] [Google Scholar]
- 27.Ballrick J. W, Palomo J. M, Ruch E, Amberman B. D, Hans M. G. Image distortion and spatial resolution of a commercially available cone-beam computed tomography machine. Am J Orthod Dentofacial Orthop. 2008;134:573–582. doi: 10.1016/j.ajodo.2007.11.025. [DOI] [PubMed] [Google Scholar]
- 28.Lagravère M. O, Carey J, Ben-Zvi M, Packota G. V, Major P. W. Effect of object location on the density measurement and Hounsfield conversion in a NewTom 3G cone beam computed tomography unit. Dentomaxillofac Radiol. 2008;37:305–308. doi: 10.1259/dmfr/65993482. [DOI] [PubMed] [Google Scholar]
- 29.Brown A. A, Scarfe W. C, Scheetz J. P, Silveira A. M, Farman A. G. Linear accuracy of cone beam CT derived 3D images. Angle Orthod. 2009;79:150–157. doi: 10.2319/122407-599.1. [DOI] [PubMed] [Google Scholar]
- 30.Periago D. R, Scarfe W. C, Moshiri M, Scheetz J. P, Silveira A. M, Farman A. G. Linear accuracy and reliability of cone beam CT derived 3-dimensional images constructed using an orthodontic volumetric rendering program. Angle Orthod. 2008;78:387–395. doi: 10.2319/122106-52.1. [DOI] [PubMed] [Google Scholar]
- 31.Shapurian T, Damoulis P. D, Reiser G. M, Griffin T. J, Rand W. M. Quantitative evaluation of bone density using the Hounsfield index. Int J Oral Maxillofac Implants. 2006;21:290–297. [PubMed] [Google Scholar]
- 32.Katsumata A, Hirukawa A, Okumura S, Naitoh M, Fujishita M, Ariji E, Langlais R. P. Effects of image artifacts on gray-value density in limited-volume cone-beam computerized tomography. Oral Surg Oral Med Oral Pathol Oral Radiol Endod. 2007;104:829–836. doi: 10.1016/j.tripleo.2006.12.005. [DOI] [PubMed] [Google Scholar]
- 33.Schlueter B, Kim K. B, Oliver D, Sortiropoulos G. Cone beam computed tomography 3D reconstruction of the mandibular condyle. Angle Orthod. 2008;78:880–888. doi: 10.2319/072007-339.1. [DOI] [PubMed] [Google Scholar]
- 34.Aranyarachkul P, Caruso J, Gantes B, Schulz E, Riggs M, Dus I, Yamada J. M, Crigger M. Bone density assessments of dental implant sites: 2. Quantitative cone-beam computerized tomography. Int J Oral Maxillofac Implants. 2005;20:416–424. [PubMed] [Google Scholar]


