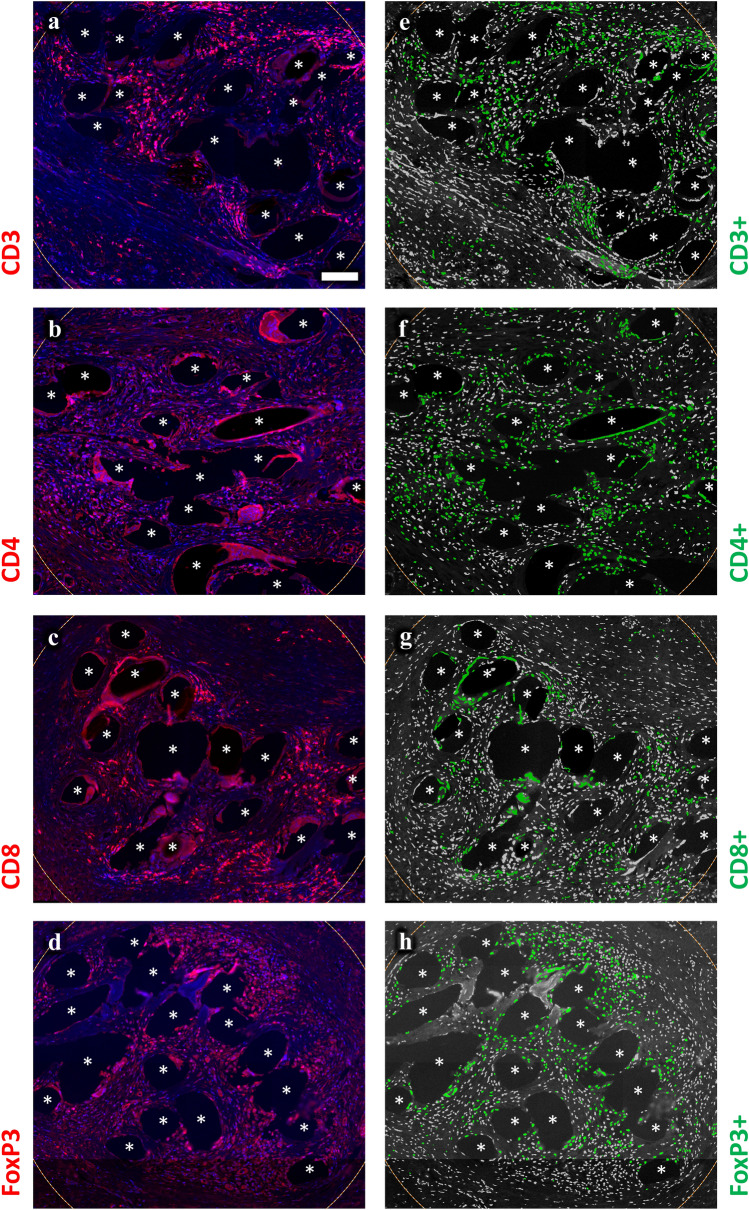
Fig. 3.
Region of interest selection and immunofluorescence labeling of immune cells part1. Labeling of T cells (CD3), Th (CD4), Tc (CD8), and Tregs (CD8). Nuclei are labeled with DAPI (blue). a–d Labeling of cells with Cy5 (red) and e–h backward gating of “positive” cells (green), respectively. Cells with a mean staining intensity > 100 are considered to be “positive”. Locations of mesh fibers are marked with asterisks, scale bar = 100 µm. Images of explants #7 (color figure online)

