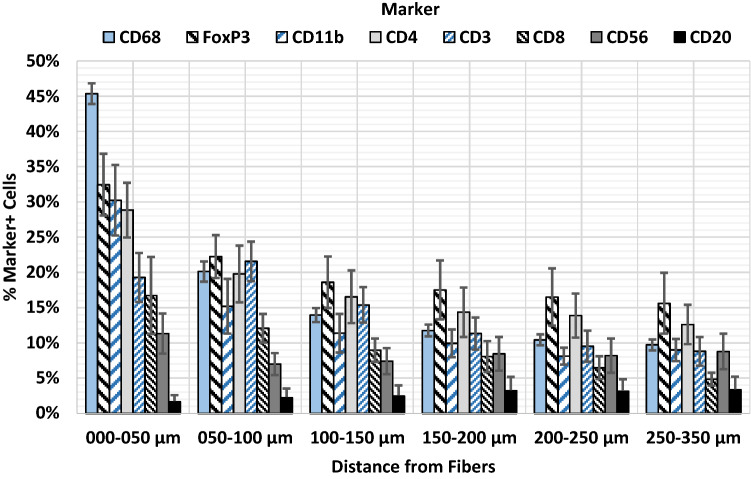
Fig. 6.
Spatial distribution of innate (CD68, CD11b, CD56) and adaptive (CD3, CD4, CD8, CD20, FoxP3) immune cells at the mesh–tissue interface. The bars represent the mean percentages of positive cells in each regional zone. Whiskers mark the SEs (n = 7 meshes). Cells with a mean staining intensity > 100 are considered to be “positive”. Innate immune cells are colored light blue and adaptive immune cells gray/black (color figure online)

