

Abstract
Objectives.
Peroxisome Biogenesis Disorders in the Zellweger Spectrum (PBD-ZSD) are autosomal recessive disorders characterized by defects in peroxisome function, biosynthesis, and/or assembly. Despite its frequent documentation, hearing loss associated with PBD-ZSD has not been extensively characterized. The purpose of this retrospective natural history study was to better characterize the hearing loss associated with PBD-ZSD and to provide additional insight into the evaluation and management of PBD-ZSD patients with hearing loss.
Design.
Audiological data from medical records of 42 patients with PBD-ZSD or D-bifunctional protein deficiency were collected from an ongoing longitudinal retrospective natural history study. An initial dataset of 300 audiograms and/or audiometric test results from the 42 patients were used to characterize the degree of hearing loss, type of hearing loss, relationships between air and bone conduction thresholds, age-related changes in hearing loss, and benefit with amplification.
Results.
The majority of PBD-ZSD patients in this study presented with moderately-severe to severe hearing loss and relatively slow rates of longitudinal changes in hearing sensitivity. Improvements in hearing thresholds were observed with use of hearing aid amplification. Though bone conduction data was limited, air-bone gaps and air conduction threshold fluctuations observed in several patients suggest there may be an increased occurrence of mixed hearing losses in PBD-ZSD populations.
Conclusion.
The results of this retrospective study provide insight into the hearing loss associated with PBD-ZSD, but also emphasize the need for more complete assessments of hearing loss type and middle ear function in these patients. The addition of more comprehensive datasets to the ongoing natural history study will enhance our understanding of the pathophysiology underlying PBD-ZSD and guide the development of targeted evaluation and management recommendations for patients with PBD-ZSD.
Introduction:
Peroxisome Biogenesis Disorders in the Zellweger Spectrum (PBD-ZSD) are autosomal recessive disorders characterized by defects in peroxisome function, biosynthesis, and/or assembly (Raas-Rothschild et al. 2002; Poll-The et al. 2004; Braverman et al. 2016; Berendse et al. 2016). While mutations in the Peroxisomal Biogenesis Factor 1 (PEX1) gene are the most common and found in nearly 70% of all PBD-ZSD cases (Reuber et al. 1997; Steinberg et al. 2006; Braverman et al. 2013), PBD-ZSD can also be caused by mutations in any of 13 different PEX genes (Raas-Rothschild et al. 2002; Poll-The et al. 2004; Braverman et al. 2016; Berendse et al. 2016). One in every 50,000 births in North America are estimated to be affected by PBD-ZSD (Lee and Raymond 2013; Braverman et al. 2016), with incidences varying between different countries (Klouwer et al. 2015).
Peroxisomes are required for several crucial biochemical processes in all eukaryotic cells including lipid biosynthesis and fatty acid oxidation. As such, PBD-ZSD patients with peroxisomal defects in one or more PEX genes can present with a broad range of clinical features varying in phenotypic severity (Weller et al. 2003; Braverman et al. 2016). Neurological abnormalities, multiple organ dysfunction (Klouwer et al. 2015), failure to thrive, lifespans limited to the first few months after birth (Theil et al. 1992), craniofacial abnormalities (Lee and Raymond 2013; Gunduz and Unal 2016), and hypotonia (Weller et al. 2003; Berendse et al. 2016) are features commonly associated with severe forms of PBD-ZSD. While the natural history of intermediate and mild phenotypes is more variable than severe forms of PBD-ZSD (Steinberg et al. 2006), features such as developmental delays, pigmentary retinal degeneration (Berendse et al. 2016), and low bone mineral density (Rush et al. 2016) are often reported. Patients presenting with intermediate and mild forms also survive into adulthood and tend to have longer lifespans (Weller et al. 2003).
Hearing loss is an important characteristic of PBD-ZSD (Moser et al. 1995; Braverman et al. 2013; Braverman et al. 2016) and is commonly observed in more intermediate and milder cases (Steinberg et al. 2006; Klouwer et al. 2015). Despite its frequent documentation, the hearing loss associated with PBD-ZSD has not been extensively characterized. While some studies objectively describe the hearing loss using auditory brainstem responses (ABR) and/or soundfield audiometry (Raas-Rothschild et al. 2002; Berendse et al. 2016), most only state the presence of a hearing loss without any specific audiological information (Wilson et al. 1986; Theil et al. 1992; Poll-The et al. 2004; Lee and Raymond 2013; Gunduz and Unal 2016). Similarly, most reports of amplification use in PBD-ZSD patients are limited to qualitative descriptions of success without objective measures of benefit (Poll-The et al. 2004; Lee and Raymond 2013; Berendse et al. 2016; Gunduz and Unal 2016). Information regarding pure tone air (AC) and bone conduction (BC) thresholds, tympanometry, speech thresholds, word recognition abilities, patient age at testing, progression of hearing loss, audiometric benefits of amplification, and/or defined criteria differentiating types of hearing loss is limited in existing literature. Such data is necessary to better understand the hearing loss in PBD-ZSD populations in regard to natural history and pathophysiology.
In the present study, audiological records from 39 PBD-ZSD patients were collected from an ongoing retrospective natural history study and divided into specific groups based on overall disease severity and PEX gene mutations. Generally, patients with two PEX null alleles (i.e. nonsense, frameshift, splice site, indel predicted to generate nonfunctional or absent protein) present with more severe phenotypes, while those with one or two PEX1-p.Gly843Asp (G843D) alleles present with more intermediate and mild phenotypes respectively (Poll-The et al. 2004; Braverman et al. 2016). The common PEX1-G843D and PEX1-Ile700fs alleles in North America underly the high frequency of PEX1-G843D/G843D and PEX1-G843D/Null genotypes in our patient cohort. D-bifunctional protein (DBP) is required for breakdown of long-chain fatty acids and for peroxisomal β-oxidation of fatty acids (Ferdinandusse et al. 2006). Three patients with DBP deficiency (DBPD) were included in this study because of similarities in clinical presentation and features to PBD-ZSD. The purpose of this retrospective natural history study was to better characterize the hearing loss associated with PBD-ZSD and to provide additional insight into the evaluation and management of PBD-ZSD patients with hearing loss.
Materials and Methods:
Study Population and Data Collection:
Audiological data from medical records of 42 patients with PBD-ZSD or DBPD were collected from an ongoing longitudinal retrospective natural history study. This study is Research Ethics Board approved (McGill University Health Center #11–090-PED, ClinicalTrials.gov Identifier: NCT01668186) and a data sharing agreement was established for this project. Prior to enrolling in this study, patients received a diagnosis of PBD-ZSD or DPBD from their local clinical care teams based on disease presentation, peroxisomal biochemistry testing, and molecular testing. Medical records from various audiology clinics/hospitals (23 patients from the U.S., 15 from Canada, 4 from Australia) were collected with the permission of each patient or his/her legal representative. Relevant audiological information and test results from medical records were extracted and inputted into a custom-made Microsoft Access Database to allow for large data set extraction and analysis.
Patients were divided into 4 groups based on genotype and overall disease severity: (1) homozygotes for the mutation encoding the mutant protein PEX1-p.Gly843Asp (PEX1 - G843D/G843D), (2) compound heterozygotes for the PEX1-G843D allele in trans with a PEX1 null allele (PEX1 – G843D/Null), (3) PBD-ZSD patients with other PEX1 mutations or bi-allelic mutations in other PEX genes and intermediate-mild disease severities (Other PEX – Intermediate and Mild), and (4) patients with intermediate-mild DBPD (DBPD).
Audiometric Analysis:
The initial dataset of 300 audiograms and/or audiometric test results were used to characterize hearing loss severity, relationships between pure tone AC and BC thresholds, age-related changes in hearing loss, and benefit with amplification. Four-frequency pure tone averages (4F-PTAs), encompassing thresholds at octave frequencies from 0.5 – 4 kHz, were calculated for these analyses to estimate the degree of hearing loss and changes in hearing thresholds over the speech frequency range. In cases where all four frequencies of the 4F-PTA were not tested, a three-frequency average comprising of any of the four frequencies was used as an alternative measure. Audiograms with thresholds for only one or two frequencies were excluded from these 4F-PTA analyses.
For determining the average hearing loss in each group, all tests with absent pure tone thresholds were removed. Soundfield responses and thresholds from inter-octave frequencies were also excluded. Ninety-six audiograms and 8 patients were removed after applying these criteria. For each patient within a given PBD-ZSD/DBPD group, mean individual audiograms were generated by averaging AC thresholds from all test dates. Mean individual audiograms were then averaged to determine the hearing loss severity in each group. Degrees of hearing loss were described using ASHA’s classification for hearing loss severity: normal: ≤ 25 dB HL; mild: 26 to 40 dB HL; moderate: 41 to 55 dB HL; moderately severe: 56 to 70 dB HL; severe: 71 to 90 dB HL; and profound: 91 dB HL or greater (Clark 1981).
To characterize the type of hearing loss and measure the frequency/size of air-bone gaps, tests with AC and BC thresholds from 0.5, 1, 2, and/or 4 kHz and from the same test date were analyzed. All tests with only AC or BC thresholds were removed. Because BC data was more limited in our dataset, only 81 audiograms from 19 patients met the criteria to be included in these analyses. For each of these 81 audiograms, the hearing loss was defined as conductive if BC thresholds were normal and at least one AC threshold exceeded 25 dB HL, sensorineural if all AC and BC thresholds were greater than 25 dB HL and within 10dB or less of one another, and mixed if both AC and BC thresholds were abnormal with a 15dB or greater air-bone gap at two or more frequencies or an air-bone gap of 20dB or greater at one or more frequencies.
To determine whether progressive hearing loss was a common feature of PBD-ZSD, AC and BC threshold shifts between all consecutive and first-last test dates were calculated for individual frequencies and 4F-PTAs. Shifts ≤ 10dB between consecutive tests were considered to be non-significant and within test-retest reliability. Patients with only one audiogram and absent AC/BC thresholds were excluded, leaving 200 audiograms from 27 patients for analysis. A linear mixed effects regression model was used to examine longitudinal changes in hearing thresholds over time. Three-level mixed-effects models were built to account for the correlation between ears and correlation from repeated measurements within an individual. The models included the main effects of age as fixed effects. The random effects for ear levels included the intercept and the random effects for repeated measurement levels included the intercept and slope. Subgroup analyses by mutation groups were also conducted and examined to determine whether temporal changes in hearing thresholds differed by mutation groups. All analyses were conducted using SAS version 9.4 (SAS Institute, Cary NC).
Benefits from hearing aid amplification were quantified by comparing unaided to aided 4F-PTAs and speech recognition (SRT) or speech awareness thresholds (SAT) obtained on the first test date after fitting with both unaided and aided responses. Changes in word recognition scores (WRS) could not be analyzed due to insufficient data. Only 13 patients met criteria for analysis of benefits from amplification. Differences in unaided and aided 4F-PTAs and SAT/SRTs were calculated for each patient and averaged to determine mean group benefits from hearing aid amplification.
Results:
Patient Characteristics:
Fourty-two patients with PBD-ZSD or DBPD were identified (Table 1). There were 25 male (59.5%) and 17 female (40.5%) patients with ages ranging from 0.1 to 43.6 years of age. The PEX1 - G843D/G843D and Other PEX – Intermediate & Mild groups had the greatest number of patients with 13 (30.2%) and 17 (39.5%) in each group, respectively. The PEX1 - G843D/Null and DBPD groups were composed of audiometric records from 9 and 3 patients, respectively (Table 1).
Table 1.
Demographics and Genetic Variants of 42 PBD-ZSD or DBPD patients with Reported Audiology Findings Enrolled in Natural History Study
| Genotype Group | Patient ID | Gender | Mutation 1 | Mutation 2 | Age range of available exams* (y) | Country / Ethnicity |
|---|---|---|---|---|---|---|
|
| ||||||
| PEX1 - G843D/G843D | 2 | F | PEX1 c.2528G>A (p.G843D) | PEX1 c.2528G>A (p.G843D) | 2.0 | Canada / White |
| 4 | F | PEX1 c.2528G>A (p.G843D) | PEX1 c.2528G>A (p.G843D) | 0.2 – 2.2 | Canada / White | |
| 5 | M | PEX1 c.2528G>A (p.G843D) | PEX1 c.2528G>A (p.G843D) | 0.8 – 32.1 | USA / White | |
| 6 | M | PEX1 c.2528G>A (p.G843D) | PEX1 c.2528G>A (p.G843D) | 1.2 – 26.2 | Canada / White | |
| 7 | M | PEX1 c.2528G>A (p.G843D) | PEX1 c.2528G>A (p.G843D) | 1.4 – 12.2 | Australia / White | |
| 8 | M | PEX1 c.2528G>A (p.G843D) | PEX1 c.2528G>A (p.G843D) | 0.5 – 10.0 | Australia / White | |
| 9 | F | PEX1 c.2528G>A (p.G843D) | PEX1 c.2528G>A (p.G843D) | 3.4 – 25.1 | Canada / White | |
| 10 | M | PEX1 c.2528G>A (p.G843D) | PEX1 c.2528G>A (p.G843D) | 4.8 – 43.6 | USA / White | |
| 11 | F | PEX1 c.2528G>A (p.G843D) | PEX1 c.2528G>A (p.G843D) | 2.2 – 17.3 | USA / Latino | |
| 12 | M | PEX1 c.2528G>A (p.G843D) | PEX1 c.2528G>A (p.G843D) | 1.7 – 9.9 | USA / White | |
| 13 | F | PEX1 c.2528G>A (p.G843D) | PEX1 c.2528G>A (p.G843D) | 2.0 – 9.8 | Canada / White | |
| 14 | M | PEX1 c.2528G>A (p.G843D) | PEX1 c.2528G>A (p.G843D) | 1.0 – 3.8 | Canada / White | |
| 16 | F | PEX1 c.2528G>A (p.G843D) | PEX1 c.2528G>A (p.G843D) | 7.3 – 11.1 | Canada / White | |
|
| ||||||
| PEX1 - G843D/Null | 17 | M | PEX1 c.2528G>A (p.G843D) | PEX1 c.2383C>T (p.Arg795fs*) | 1.1 – 2.4 | USA / White |
| 18 | F | PEX1 c.2528G>A (p.G843D) | PEX1 c.2097insT (p.I700Yfs42X) | 0.9 – 16.6 | Canada / Persian | |
| 19 | F | PEX1 c.2528G>A (p.G843D) | PEX1 c.2097insT (p.I700Yfs42X) | 2.0 – 22.3 | USA / White | |
| 22 | F | PEX1 c.2528G>A (p.G843D) | PEX1 c.2097insT (p.I700Yfs42X) | 0.2 | USA / African American | |
| 25 | M | PEX1 c.2528G>A (p.G843D) | PEX1 c.1108delA | 2.3 | USA / White | |
| 27 | M | PEX1 c.2528G>A (p.G843D) | PEX1 c.2916delAfs19* | 0.9 – 1.0 | USA / White | |
| 28 | F | PEX1 c.2528G>A (p.G843D) | PEX1 c.2097insT (p.I700Yfs42X) | 0.1 – 8.7 | USA / White | |
| 29 | F | PEX1 c.2528G>A (p.G843D) | PEX1 c.2926+1 G>A | 3.2 | USA / White | |
| 31 | M | PEX1 c.2528G>A (p.G843D) | PEX1 c.382C>T (p.Q128X) | 2.9 – 4.7 | USA / White | |
|
| ||||||
| Other PEX - Mild & Intermediate | 32 | M | PEX1 c.2528G>A (p.G843D) | PEX1 c.439G>T (p.V147F) | 0.1 – 7.9 | Australia / White |
| 33 | M | PEX16 c.683C>T (p.P228L) | PEX16 c.372delG (p.R124fs*) | 10.4 | Canada / White | |
| 34 | F | PEX1 c.2097dupT (p.I700fs*) | PEX1 del exon24 and 3’UTR | 0.4 – 6.2 | USA / White | |
| 38 | M | PEX1 c.2528G>A (p.G843D) PEX6 c.1802G>A (p.R601Q) |
PEX1 c.2528G>A (p.G843D) PEX6 c.1637G>A (p.R546H) |
0.6 – 0.8 | Canada / White | |
| 41 | F | PEX6 c.2094G>T (p.K698N) | PEX6 c.2398_2417del20insT | 1.7 | Canada / Haitian | |
| 44 | M | PEX26 c.292C>T (p.R98W) | PEX26 c.292C>T (p.R98W) | 2.4 – 13.2 | USA / White | |
| 45 | F | PEX6 c.2125G>A (p.Gly709Arg) | PEX6 c.2125G>A (p.Gly709Arg) | 1.0 – 3.9 | USA / White | |
| 47 | M | PEX1 c.2097dupT (p.I700fs*) | PEX1 del exon24 and 3’UTR | 0.5 – 4.1 | USA / White | |
| 48 | M | PEX5 c.1803 1805delGGAinsTC (p.E601Dfs14*) | PEX5 c. 1799C>T (p.S600L) | 3.1 – 6.3 | USA / Latino | |
| 49 | F | PEX 1 c.1642C>T (p.L548F) | PEX 1 c.1642C>T (p.L548F) | 0.8 | Canada / North African | |
| 50 | M | PEX6 c.2578C>T (p.R860W) | No second mutation found | 3.1 | Australia / White | |
| 51 | M | PEX1 c.1777G>A (p.G593R) | PEX1 c.2916delA (p.G973fs) | 1.6– 5.3 | USA / White | |
| 53 | M | PEX6 c.659G>T (p.G220V) | PEX6 c.2095-22_2095-11delCCACGCACTTTC PEX1 | 3.1 – 8.3 | USA / White | |
| 54 | F | PEX1 c.2528G>A (p.G843D) | c.1961insCAGTGTGGA (p.W653_M654insTVTW) | 1.3 – 3.5 | USA / White | |
| 55 | M | PEX 1 c.1642C>T (p.L548F) | PEX 1 c.1642C>T (p.L548F) | 4.0 – 4.5 | Canada / North African | |
| 56 | M | PEX10 c.200A>G (p.Q67R) | PEX10 c.4delG (p.A2Pfs10*) | 1.1 – 2.7 | USA / White | |
| 57 | M | PEX6 c.2663G>C (p.R888P) | PEX6 c.442_445del | 1.8 – 33.3 | USA / White | |
|
| ||||||
| DBPD (Mild & Intermediate) | 58 | M | HSD17B4 c.101C>T (p.A34V) | HSD17B4 c.1547T>C (p.I516T) | 2.0 – 17.3 | Canada / White |
| 59 | M | HSD17B4 c.101C>T (p.A34V) | HSD17B4 c.1547T>C (p.I516T) | 4.0 – 19.6 | Canada / White | |
| 60 | F | HSD17B4 c.1438-1 G>A | HSD17B4 c.743 G>A (p.R248H) | 3.8 – 15.8 | USA / White | |
Available exams included audiograms with any of the following: hearing aid fitting/use information, cochlear implant fitting information, unaided and aided AC/BC thresholds, tympanometry, otoscopic findings, SAT/SRTs. Eight patients (#2, 4, 17, 22, 25, 29, 49, 50) were excluded from degree of hearing loss calculations due to insufficient/missing data.
Degree and Type of Hearing Loss:
Two hundred and four audiograms from 34 patients met inclusion criteria for determining average hearing losses in each group (Figure 1, Table 2). The average hearing loss of five patients in the PEX1 - G843D/Null group was flat and in the moderately-severe to severe range bilaterally. The average hearing loss of 11 patients in the PEX1 - G843D/G843D group sloped from moderately-severe to profound bilaterally. A moderate sloping to severe bilateral hearing loss was observed in 15 patients in the Other PEX - Intermediate and Mild group, with larger standard deviations likely due to the broader range of phenotypic severities encompassed. Lastly, the 3 patients from the DBPD group exhibited the mildest hearing loss, with average thresholds ranging from moderate to severe.
Figure 1.
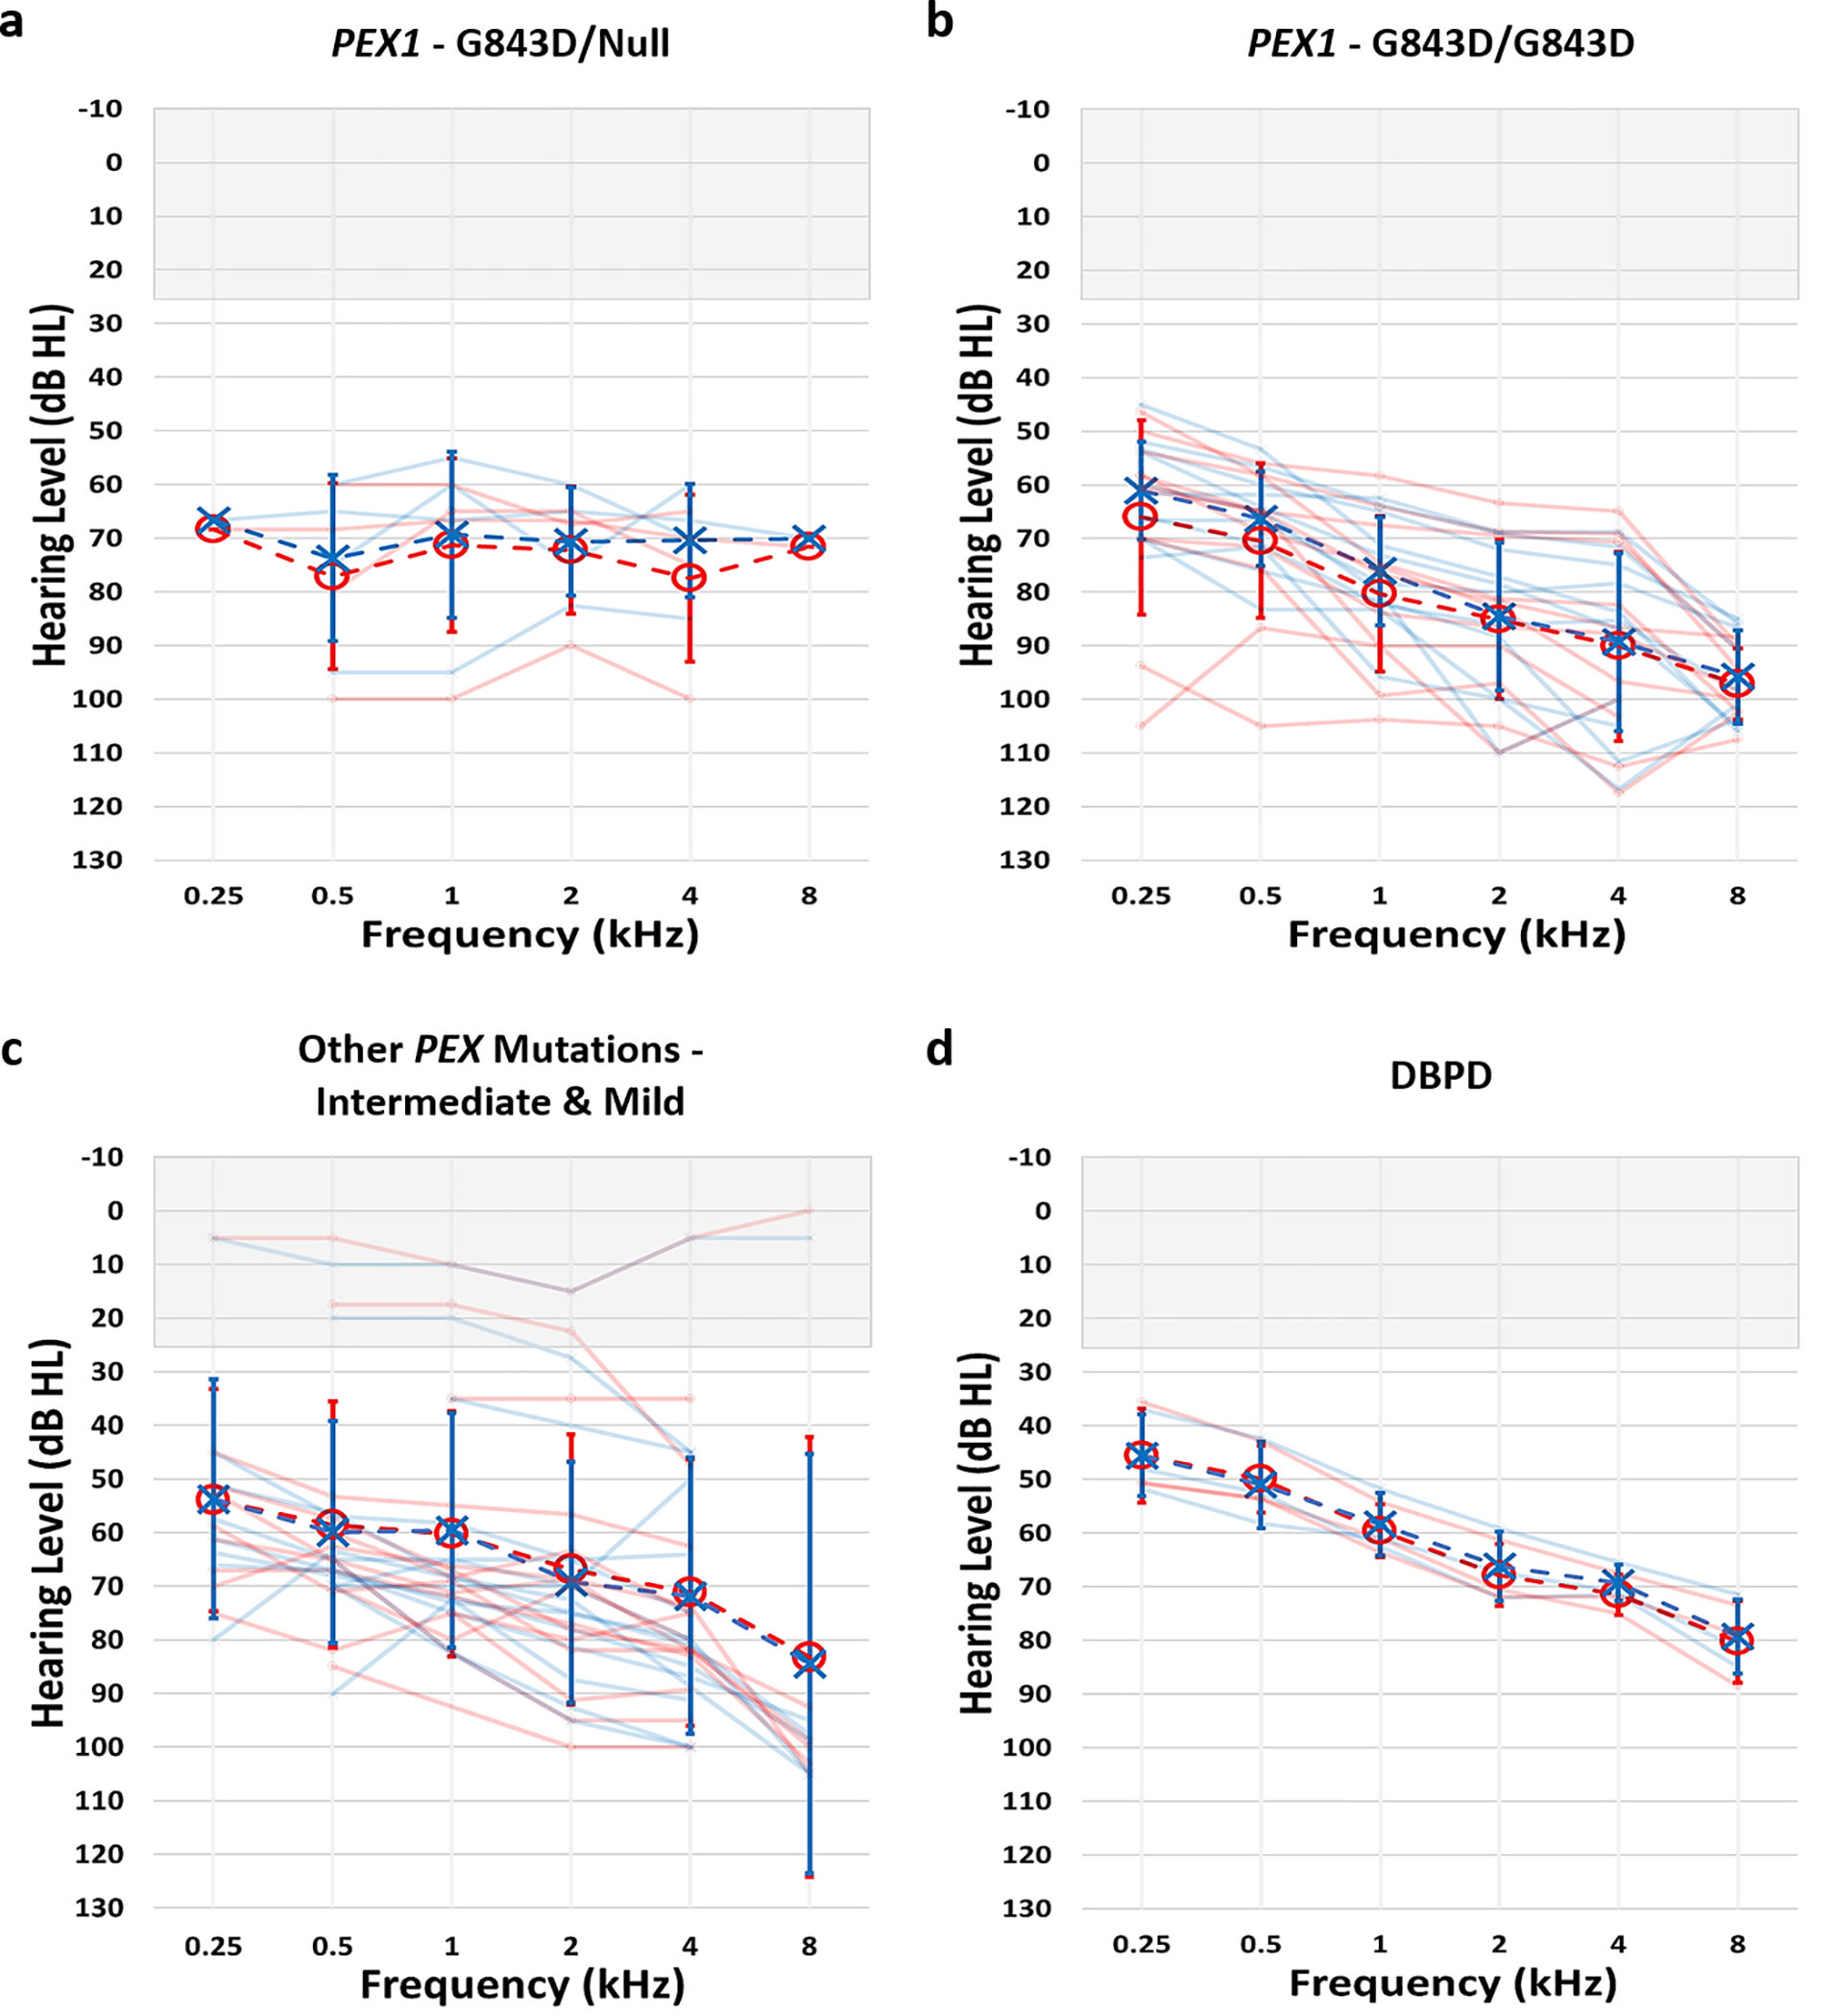
Mean audiograms for a) PEX1 - G843D/Null, b) PEX1 – G843D/G843D, c) Other PEX Mutations – Intermediate & Mild, and d) DBPD groups. Right ear thresholds depicted as red circles and left ear thresholds in blue x’s. Lighter audiograms in each group represent mean audiograms from individual patients, while darker audiograms reflect mean group audiograms. Audiograms from 5 patients in the PEX1 - G843D/Null, 11 patients in the PEX1 – G843D/G843D, 15 patients in the Other PEX Mutations – Intermediate & Mild, and 3 patients in the DBPD groups were used to calculate mean audiograms. Errors bars represent standard deviation.
Table 2.
Severity of Hearing Losses at Baseline by Genotype Group
| PEX1 - G843D/Null (4 patients; 8 ears) | PEX1 - G843D/G843D (11 patients; 22 ears) | Other PEX -Intermediate & Mild (13 patients; 26 ears) | DBPD (3 patients; 6 ears) | |
|---|---|---|---|---|
|
| ||||
| Ear-specific a | ||||
| Right | 76.0 (16.1) | 76.1 (13.0) | 68.1 (24.2) | 67.9 (14.6) |
| Left | 79.5 (16.1) | 73.3 (10.8) | 67.9 (23.4) | 63.8 (10.7) |
| Severity of Hearing Loss b | ||||
| Normal (<20 dB) | - | - | 2 (7.7%) | - |
| Mild (21–40 dB) | - | - | 2 (7.7%) | - |
| Moderate (41–55 dB) | - | - | 0 (0%) | 2 (33.3%) |
| Mod. Severe (56–70 dB) | 4 (50.0%) | 7 (31.8%) | 4 (15.4%) | 2 (33.3%) |
| Severe (71–90 dB) | 1 (12.5%) | 12 (54.6%) | 15 (57.7%) | 2 (33.3%) |
| Profound (>90 dB) | 3 (37.5%) | 3 (13.6%) | 3 (11.5%) | - |
Mean (SD) of 4F-PTA of baseline audiograms. 4F-PTAs were first calculated for each individual using baseline audiograms. Individual baseline 4F-PTAs were then averaged to determine group baseline 4F-PTAs.
Degree of hearing loss at baseline shown as number (percentage) of ears.
Comprehensive and ear-specific BC data was available from a limited number of audiograms (81/300) from 19 patients in our dataset. Based on these limited data, we observed sensorineural hearing loss in 54/81 (66.7%) of these audiograms, mixed hearing loss in 27/81 (33.3%) and conductive hearing loss in none of the audiograms (Table 3). However, the type of hearing loss remains undetermined for the majority of tests and patients.
Table 3.
Type of Hearing Loss by Group
| Mutation Group | Sensorineurala | Mixeda |
|---|---|---|
|
| ||
| PEX1 – G843D/Null | 1/1 (100%) | 0/1 (0%) |
| PEX1 – G843D/G843D | 31/49 (63.3%) | 18/49 (36.7%) |
| Other PEX – Intermediate & Mild | 11/16 (68.8%) | 5/16 (31.2%) |
| DBPD | 11/15 (73.3%) | 4/15 (26.7%) |
Data indicates number (percentage) of audiograms. All audiograms included were required to have ear-specific AC and BC thresholds from 0.5 – 4kHz, and/or tympanogram data. Hearing loss was defined as conductive if BC thresholds were normal and at least one AC threshold exceeded 25 dB HL, sensorineural if all AC and BC thresholds were greater than 25 dB HL and within 10dB or less of one another, and mixed if both AC and BC thresholds were abnormal with a 15dB or greater air-bone gap at two or more frequencies or an air-bone gap of 20dB or greater at one or more frequencies.
Air-Bone Gaps:
The specific size of air-bone gaps and ages of their occurrences were also calculated to further detail the mixed hearing losses observed in our cohort. As illustrated in Figure 2 and Table 4, 43.1% of all air-bone gaps were > 10 dB, 21.6% were ≥ 20 dB, and 2.9% were ≥ 30dB. Air-bone gaps > 10 dB were evident at 0.5, 1, 2 and 4 kHz in all groups with no definitive relationship between the frequency and prevalence of air-bone gaps (Table 4). Air-bone gaps > 10 dB were also more evident at younger ages. In patients < 5 years of age and those 5–11 years of age, 61.1% and 45.3% of air-bone gaps were > 10 dB respectively (Table 4). Very few (23.1%) of air-bone gaps were greater than 10 dB in adult (> 18 years of age) patients, consistent with the more frequent occurrences of otitis media and middle ear effusion in younger populations. The prevalence of air-bone gaps exceeding 10 and even 20 dB indicate there may be an increased occurrence of mixed hearing losses in PBD-ZSD patients that must be accurately documented and tracked.
Figure 2:

Air-bone gaps as a function of age for the combined datasets of both ears at a) 0.5 kHz, b) 1.0 kHz, c) 2.0 kHz, and d) 4.0 kHz, shown for each patient group. The horizontal shaded area denotes ±10 dB air-bone gap limit and the vertical dotted line denotes pediatric age limit of 18 years.
Table 4.
Air-Bone Gaps by Group and Age Category
| Characteristic | > 10dBb | ≥ 20dBb | ≥ 30dBb |
|---|---|---|---|
|
| |||
| Overall | 44/102 (43.1%) | 22/102 (21.6%) | 3/102 (2.9%) |
| Genotype a | |||
| PEX1 – G843D/Null (1/9) | |||
| 0.5 kHz | 0/1 (0%) | ||
| 1.0 kHz | 0/1 (0%) | ||
| 2.0 kHz | 0/1 (0%) | ||
| 4.0 kHz | 0/1 (0%) | ||
| PEX1 – G843D/G843D (9/13) | |||
| 0.5 kHz | 23/52 (44.2%) | 10/52 (19.2%) | 2/52 (3.8%) |
| 1.0 kHz | 15/53 (28.3%) | 7/53 (13.2%) | 1/53 (1.9%) |
| 2.0 kHz | 3/36 (8.3%) | 1/36 (2.8%) | 1/36 (2.8%) |
| 4.0 kHz | 10/25 (40%) | 8/25 (32%) | 0/25 (0%) |
| Other PEX – Intermediate & Mild (6/17) | |||
| 0.5 kHz | 1/10 (10%) | 0/10 (0%) | |
| 1.0 kHz | 2/17 (11.8%) | 1/17 (5.9%) | 0/17 (0%) |
| 2.0 kHz | 3/13 (23.1%) | 2/13 (15.4%) | 0/13 (0%) |
| 4.0 kHz | 3/11 (27.3%) | 2/11 (18.2%) | 0/11 (0%) |
| DBPD (3/3) | |||
| 0.5 kHz | 4/19 (21.1%) | 0/19 (0%) | |
| 1.0 kHz | 1/20 (5%) | 0/20 (0%) | |
| 2.0 kHz | 0/20 (0%) | ||
| 4.0 kHz | 6/19 (31.6%) | 1/19 (5.3%) | 0/19 (0%) |
| Age Category | |||
| < 5 yrs. | 11/18 (61.1%) | 6/18 (33.3%) | 2/18 (11.1%) |
| 5 – 11 yrs. | 24/53 (45.3%) | 12/53 (22.6%) | 0/53 (0%) |
| 12 – 18 yrs. | 6/18 (33.3%) | 3/18 (16.7%) | 1/18 (5.6%) |
| > 18 yrs. | 3/13 (23.1%) | 1/13 (7.7%) | 0/13 (0%) |
Data indicates (number of patients) within each group with both AC and BC thresholds for air-bone gap calculations.
Data indicates number (percentage) of tests with air-bone gaps.
Longitudinal Changes in Hearing:
Shifts in AC and BC 4F-PTAs between consecutive test dates were calculated in 27 patients. Most shifts fell within ± 10dB (Figure 3), with only 29/305 (9.5%) AC 4F-PTA and 2/54 (3.7%) BC 4F-PTA shifts exceeding ± 10dB. The minimal occurrence of shifts exceeding ± 10dB reflect the stable hearing exhibited by the majority of patients in our cohort. Nineteen of the AC 4F-PTA shifts were greater than 10 dB (i.e. decrease in hearing sensitivity) and 10 were less than −10 dB (i.e. improvements in hearing sensitivity). Contrastingly, only 2 shifts in BC 4F-PTA were greater than 10 dB and none were less than −10 dB. The increased prevalence of AC 4F-PTA shifts exceeding ± 10dB (compared to BC 4F-PTA shifts), particularly those showing improvements in hearing sensitivity of more than 10dB, suggest the presence of transient fluctuations in AC thresholds caused by conductive overlays that may be accounting for at least some of the mixed hearing losses observed in our cohort (Figure 3).
Figure 3:
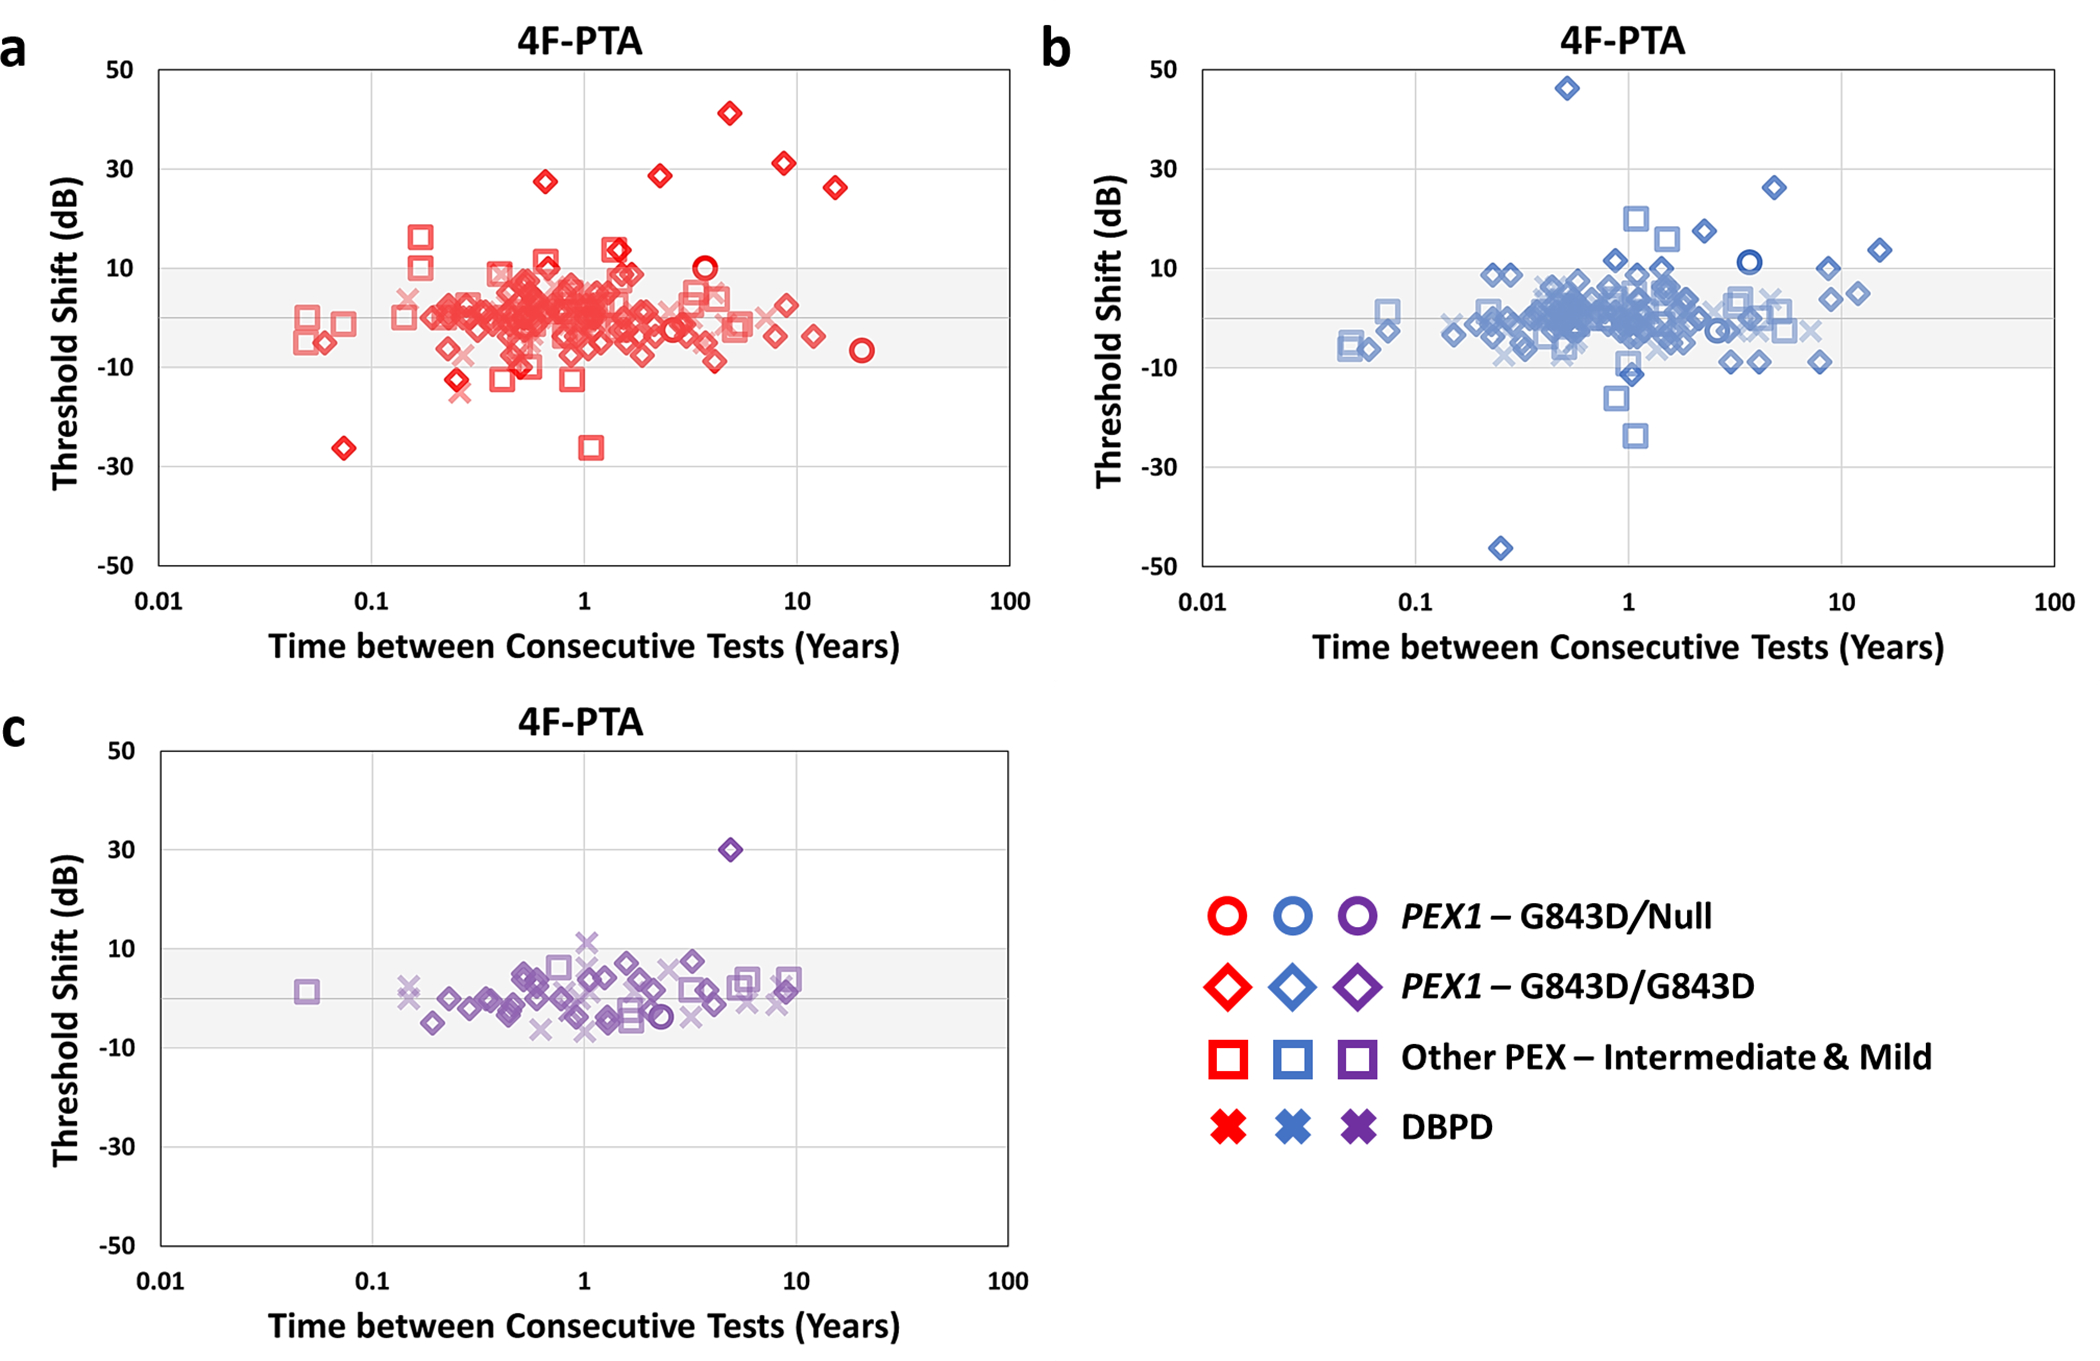
Shifts in 4F-PTA (four-frequency PTA based on 0.5 – 4 kHz) between consecutive test dates as a function of time between tests. Shifts were calculated by subtracting older test-date thresholds from more recent test-date thresholds (i.e. positive shift indicates decline in hearing). a) Right ear and b) left ear air conduction and c) bone conduction shifts combined from both ears in 4F-PTA are shown. Different groups are denoted by different shapes, with right ear threshold shifts depicted in red and left ear shifts in blue. The shaded area represents accepted test-retest variability of +/− 10dB.
Longitudinal changes in both AC and BC 4F-PTAs were also examined using a linear mixed effects model. The mean AC 4F-PTA of our cohort was 67.0 dB HL (SD 16.0) at baseline and 74.0 dB HL (SD 18.5) at the last visit, declining at an average rate of 1.0 dB per year (95% CI: 0.4, 1.5; p=0.001; a total of 185 audiograms in 27 patients) or 10 dB over 10 years (Figure 4, Table 5). The baseline severity of hearing loss and the annual decline in hearing sensitivity did not differ significantly by mutation group. Though fewer BC thresholds were available compared to AC thresholds, longitudinal changes were also evident with BC 4F-PTA declining at a rate of 0.6 dB per year (95% CI: 0.3, 0.8; p<0.001; a total of 66 audiograms for BC thresholds). Comparison of consecutive test shifts and annual rates of change in AC vs. BC 4F-PTAs suggests progressive hearing loss may not be a defining feature of patients with PBD-ZSD and highlight the importance of BC testing in accurately tracking changes in hearing sensitivity.
Figure 4:
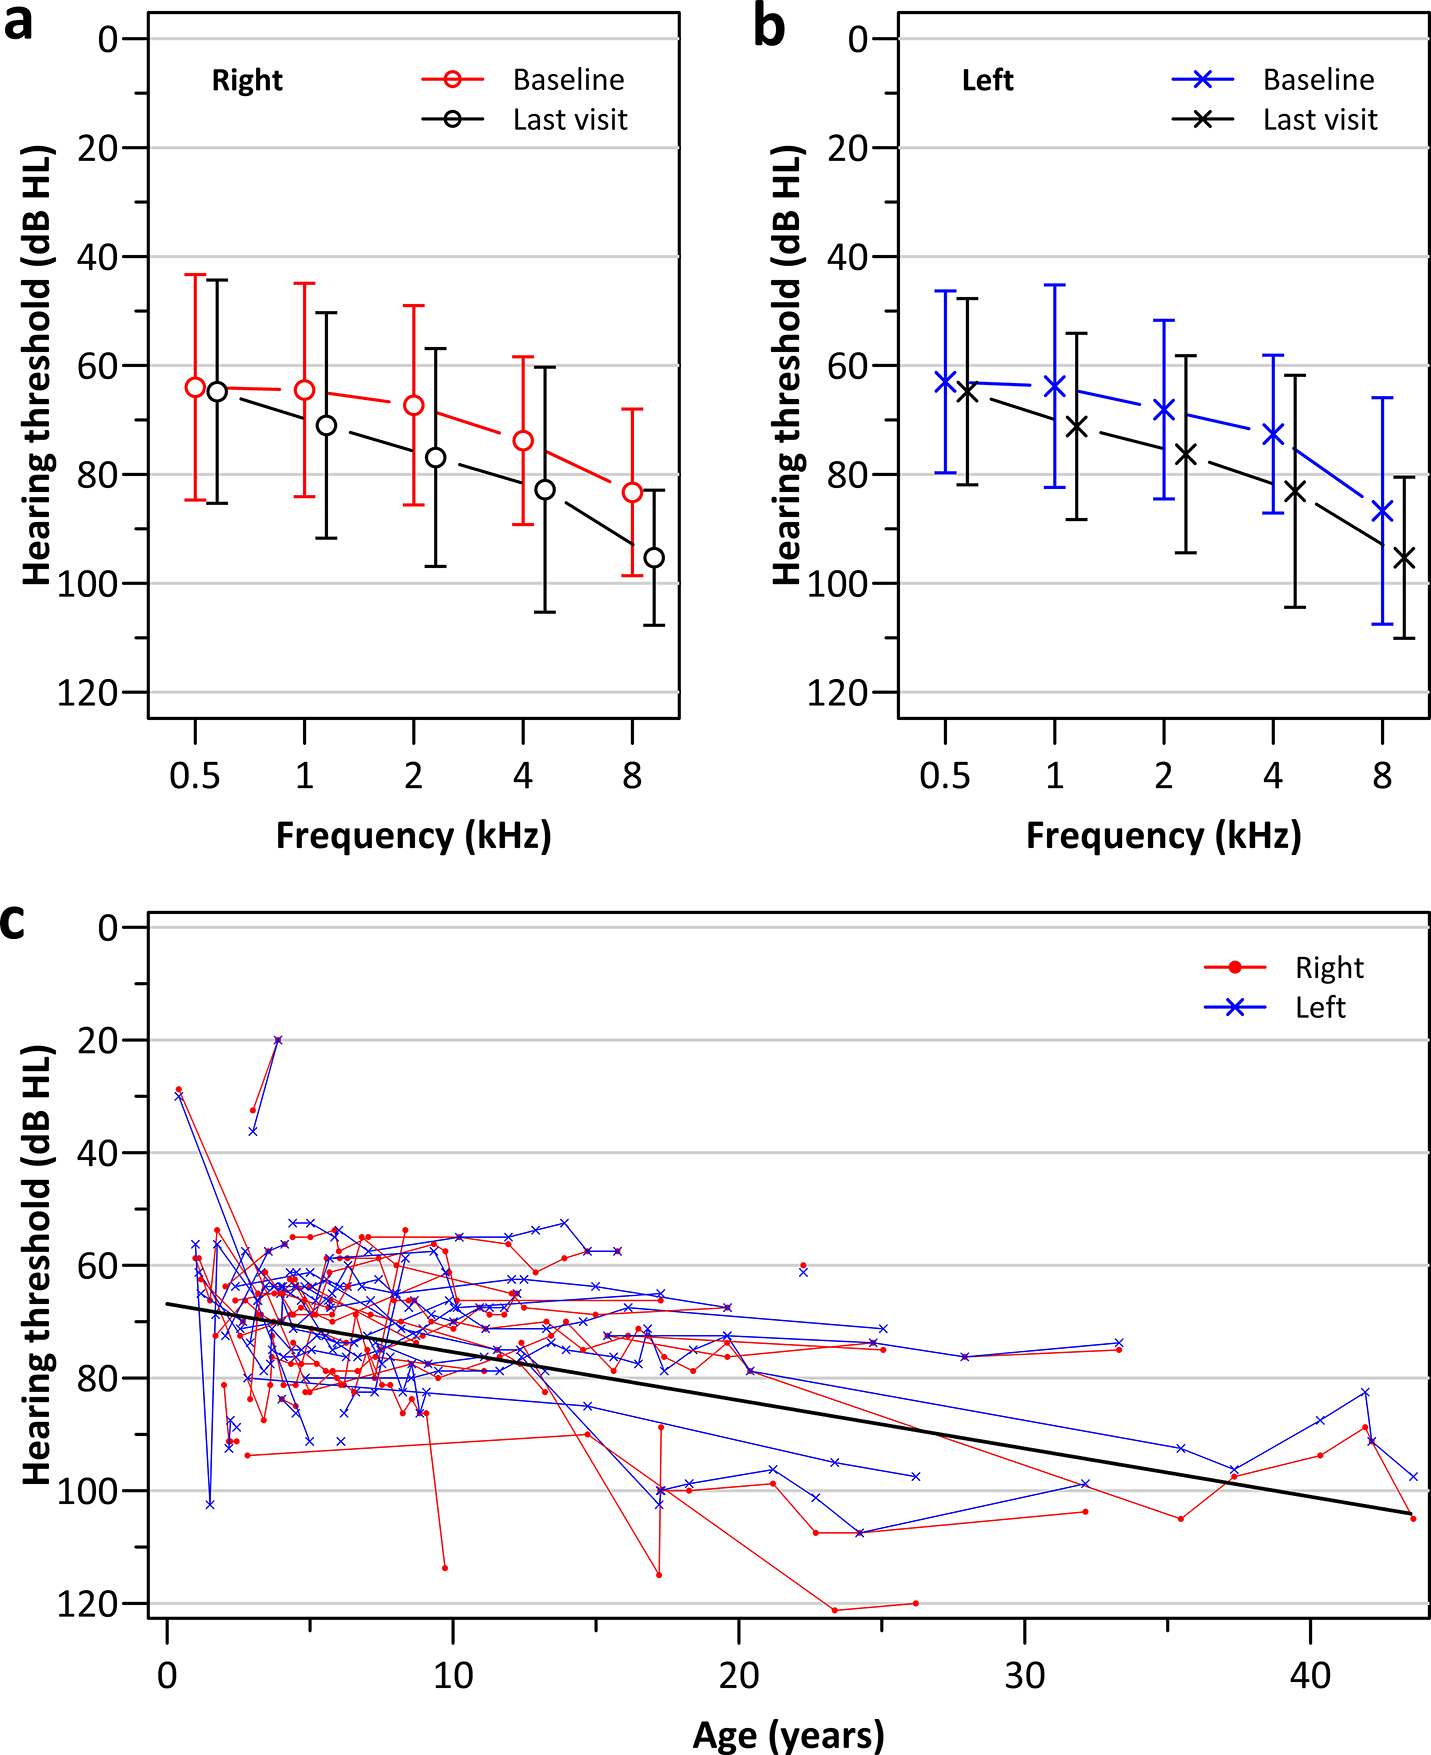
Longitudinal changes in hearing for 27 patients with multiple audiograms (a total of 186 audiograms) shown as the mean (+/− 1 standard deviation) air-conduction pure tone threshold at baseline and at the final audiogram for the a) right and c) left ears; c) individual patient’s ear specific progression of the 4F-PTA as a function of age for the right (red) and left (blue) ears; a linear mixed effects regression model based on 4F-PTA are shown by the solid black line.
Table 5.
Longitudinal Changes in Hearing Thresholds over Time
| Total number of audiograms | First Visit Mean (SD) | Last Visit Mean (SD) | Mean Change in Hearing Threshold (dB) per Year (95% CI) | P-value | |
|---|---|---|---|---|---|
|
| |||||
| Age | - | 3.7 (3.4) | 14.1 (10.5) | - | |
| 4F-PTA | 186 | 67.0 (16.0) | 74.0 (18.5) | 1.0 (0.4, 1.5) | 0.001 |
| Frequency | |||||
| 0.5 kHz | 191 | 63.5 (18.6) | 64.8 (18.5) | 0.3 (0.0, 0.6) | 0.09 |
| 1.0 kHz | 186 | 64.1 (18.9) | 71.0 (18.7) | 0.6 (0.4, 0.7) | <0.001 |
| 2.0 kHz | 190 | 67.7 (17.1) | 76.6 (18.8) | 1.0 (0.5, 1.4) | <0.001 |
| 4.0 kHz | 190 | 73.2 (14.8) | 82.9 (21.7) | 1.4 (0.7, 2.0) | <0.001 |
| 8.0 kHz | 188 | 85.0 (16.4) | 95.3 (13.5) | 0.4 (0.0, 0.7) | 0.03 |
A linear mixed effects regression model was used to examine longitudinal changes in frequency-specific thresholds and 4F-PTA (both in dB HL) over time in 54 ears from 27 patients.
Benefits of Amplification:
Almost all patients (37/42; 88.1%) in our cohort were fit with hearing aids, 6 of whom were initially fit with hearing aids and eventually received cochlear implants. These included two patients in the PEX1 - G843D/Null group and two in the PEX1 - G843D/G843D group fit with a hearing aid in one ear and a cochlear implant in the opposite ear, and two patients in the Other PEX - Intermediate and Mild group fit with bilateral CIs. Only 13 of the 37 patients had aided and unaided data based on hearing aid use and none had CI aided and unaided data collected on the same date. To illustrate CI benefit from the two patients (#32, 54 from Other PEX – Intermediate and Mild) with aided and unaided thresholds, we combined data from across test dates to determine average improvements in 4F-PTA and observed a bilateral benefit of 57.5 dB in patient #32 and a 48.3 dB improvement in the right ear of patient #54.
Assessment of unaided and aided 4F-PTAs showed benefit from hearing aids for all patient groups. In the PEX1 - G843D/Null and DBPD groups, unaided soundfield thresholds and aided responses with hearing aids (that were not specified as ear-specific or binaural) were present for measurement of amplification benefit. An average benefit of 31 – 35 dB in 4F-PTAs from hearing aids was evident in 4 patients of these two groups (Table 6). Unaided and aided ear-specific and binaural/ear-unspecified thresholds were also available in 6 PEX1 - G843D/G843D and 3 Other PEX - Intermediate and Mild patients. Benefits in 4F-PTAs were similar to one another in both of these groups (Table 6). Improvements in SAT/SRTs with amplification were comparable to 4F-PTA improvements across all groups (Table 6).
Table 6.
Average Hearing Aid Benefit in Patients with PBD-ZSD or DBPD Mutations
| Characteristic | Benefita |
|---|---|
|
| |
| PEX1 - G843D/Null | |
| # Patients w. Unaided + Aided Responses | 2 |
| Binaural/Ear unspecified | 35 dB |
| Binaural/Ear unspecified SAT/SRT | 35– 45 dB |
| PEX1 - G843D/G843D | |
| # Patients w. Unaided + Aided Responses | 6 |
| Binaural/Ear unspecified | 46 – 61 dB |
| Binaural/Ear unspecified SAT/SRT | 30 – 50 dB |
| Right Ear | 26 – 46 dB |
| Right Ear SAT/SRT | 35 – 50 dB |
| Left Ear | 29 – 50 dB |
| Left Ear SAT/SRT | 35 – 50 dB |
| Other PEX - Intermediate & Mild | |
| # Patients w. Unaided + Aided Responses | 3 |
| Right Ear | 36 – 44 dB |
| Right Ear SAT/SRT | 50 dB |
| Left Ear | 35 – 44 dB |
| Left Ear SAT/SRT | 50 dB |
| DBPD | |
| # Patients w. Unaided + Aided Responses | 2 |
| Binaural/Ear unspecified | 31 – 35 dB |
Data indicates range of group benefit with amplification in dB. Differences in unaided and aided 4F-PTAs and SAT/SRTs were calculated for the first test date with unaided and aided response to calculate individual benefits. These were then averaged to determine mean group benefits from amplification.
Discussion:
In this study, we characterized the hearing loss of 39 PBD-ZSD patients with mutations in different PEX genes and 3 patients with DBPD. The natural history of PBD-ZSD is highly variable with clinical characteristics varying as a function of phenotypic severity (Berendse et al. 2016). To capture and appreciate this variability, patients from the ongoing natural history study were divided into four groups: 1) PEX1 - G843D/Null, 2) PEX1 – G843D/G843D, 3) Other PEX - Intermediate and Mild, and 4) DBPD. The majority of patients in our cohort had an average hearing loss ranging from moderately-severe to severe bilaterally. Almost all patients (37/42) were fit with hearing aids and hearing aid amplification improved 4F-PTAs in all groups.
The majority of patients in our cohort exhibited stable thresholds over time. Rates of progression, while statistically significant, were small with AC thresholds changing at a rate of 1.0 dB per year and BC thresholds at a rate of 0.6 dB per year. Most AC (90.5%) and BC (96.3%) shifts across consecutive tests were less than 10 dB, but 34.5% of AC shifts exceeding ±10 dB showed improvements in thresholds of more than 10dB. Coupled with the 43.1% of air-bone gaps > 10dB, these findings reflect the reality of fluctuations in AC thresholds that are likely to be consequences of middle ear disease and resolution of this disease. The fact that majority of our data is from pediatric populations where middle ear issues are common stresses the importance of complementing AC thresholds with BC thresholds to better track and define the occurrence of mixed hearing losses that may be evident in PBD-ZSD patients.
Consistent with the AC fluctuations, we observed 43.1% of all air-bone gaps were greater than 10 dB and observed mixed hearing loss in 1/3 of the audiograms with both AC and BC thresholds, further suggesting the possibility of a conductive component to the hearing loss in PBD-ZSD. Because BC threshold were reported in only a subset of our patients and only for some audiologic visits, we were unfortunately unable to specify the type of hearing loss in the majority of our cohort. While tympanogram results were more readily available than BC thresholds, we concluded the type of hearing loss could not be assumed from only tympanogram and AC data. Type A tympanograms do not exclude the possibility of mixed/conductive hearing losses caused by third window lesions, superior canal dehiscence, etc. and the majority of audiograms with type B tympanograms lacked BC thresholds to confirm whether the hearing loss was mixed or conductive.
BC thresholds are often monitored less frequently than AC thresholds, especially in pediatric populations due to time constraints and/or patient discomfort. However, the prevalence of air-bone gaps > 10 dB and occurrences of AC threshold fluctuations in our cohort stresses the need to prioritize BC testing in patients with PBD-ZSD. BC testing and tympanometry should be performed first and consistently at every audiological exam to accurately track changes in hearing sensitivity over time and to ensure accurate diagnosis of hearing loss type. Accurately tracking changes in AC and BC thresholds is especially important for proper fitting of amplification. Hearing aid prescriptive targets are adjusted to account for known conductive components of a hearing loss. Without BC thresholds, these prescriptive targets may be inappropriate and result in inadequate amplification of speech and environmental cues.
Patients affected with PBD-ZSD should also receive annual hearing evaluations and audiologic management, including amplification. (Steinberg et al. 2006; Klouwer et al. 2015; Braverman et al. 2016). While our results suggest thresholds are significantly improved in patients fit with hearing aid amplification, the limited number of audiograms with both unaided and aided thresholds coupled with the lack of unaided and aided speech testing prevented us from more detailed analysis of benefit from hearing aids. In addition, assessments of cochlear implants benefit in PBD-ZSD patients will be necessary to compare the benefits received from hearing aid vs. cochlear implant use.
Given the need for more speech testing in PBD-ZSD populations, healthcare providers and audiologists should be aware of the developmental delays common in PBD-ZSD patients and proactively adjust speech tests to be developmentally appropriate instead of age appropriate. Word recognition scores, for example, were limited in our cohort and the type of word recognition testing used was often unspecified. Developmental delays and neurological abnormalities are typical in intermediate/mild PBD-ZSD cases (Klouwer et al. 2015; Braverman et al. 2016), making the type of speech testing administered an important consideration for PBD-ZSD populations. Word recognition tests should be selected to be developmentally appropriate for patients presenting with these delays and/or abnormalities and/or a broad range of tests should be utilized in these patients to better characterize the consequences of their hearing loss on their speech understanding abilities.
Hearing loss is an important characteristic of PBD-ZSD (Moser et al. 1995; Braverman et al. 2013; Braverman et al. 2016) and is commonly observed in intermediate and mild phenotypes (Steinberg et al. 2006; Klouwer et al. 2015). The audiological data acquired from this retrospective natural history study provide deeper insight into the hearing loss associated with PBD-ZSD. However, the variability in phenotypic presentation also emphasizes the need to better understand the pathophysiology of PBD-ZSD. Craniofacial abnormalities (Weller et al. 2003) and decreased bone mineral density (Rush et al. 2016) in PBD-ZSD patients may impair ossicle/Eustachian tube function and contribute to the observed fluctuations in AC thresholds and air-bone gaps. Atrophy of the tectorial membrane/stria vascularis and loss of hair cells/spiral ganglion neurons have all been suggested to contribute to the hearing loss associated with PBD-ZSD (Igarashi et al. 1976; Torvik et al. 1988; Weller et al. 2003). Temporal bone scans and radiographic findings obtained from 6 patients in our cohort also indicate anatomical abnormalities may also be a feature of PBD-ZSD/DBPD and a contributor to the observed discrepancies in AC and BC thresholds (Supplemental Table 1). As such, radiological examination of the petrous bones/inner ear with computerized tomography (CT) scan should be considered for PBD-ZSD patient evaluation. Future studies in mouse models of PBD-ZSD and further exploration of radiographic findings will also help to improve our understanding and guide development of more effective treatment and management options for patients with PBD-ZSD.
In summary, this study highlights disparities in the assessment and management of hearing loss PBD-ZSD patients. As such we are proposing new recommendations for otology evaluation of PBD-ZSD patients: 1- to perform radiological examination of the ear structures in new PBD-ZSD patients diagnosed with hearing loss; 2- to provide annual hearing evaluations and audiologic management, including amplification to all PBD-ZSD patients; 3- To carefully assess and document the benefit of hearing amplification with hearing aids versus cochlear implant; 4- to complement AC thresholds with BC thresholds; and 5- to provide developmentally appropriate speech assessments for PBD-ZSD patients.
Supplementary Material
Acknowledgments:
This work was supported by NIH training grant T32 DC000038 to John Lee and the Barber Foundation to Gwenaelle Geleoc. Gwenaelle Geleoc also receives support from the Global Foundation for Peroxisomal Disorders. The longitudinal retrospective natural history study was supported by CIHR #144213, #153272, FRSQ #34575 to Nancy Braverman.
“Conflicts of Interest and Source of Funding”
For all authors, no conflicts of interest were declared. This work was supported by NIH training grant T32 DC000038 to John Lee and the Barber Foundation to Gwenaelle Geleoc. The longitudinal retrospective natural history study was supported by CIHR #144213, #153272, FRSQ #34575 to Nancy Braverman.
References:
- Berendse K, Engelen M, Ferdinandusse S, Majoie CBLM, Waterham HR, Vaz FM, … Poll-The BT (2016). Zellweger spectrum disorders: clinical manifestations in patients surviving into adulthood. Journal of Inherited Metabolic Disease, 39(1), 93–106. doi: 10.1007/s10545-015-9880-2 [DOI] [PMC free article] [PubMed] [Google Scholar]
- Braverman NE, Dagostino MD, & Maclean GE (2013). Peroxisome biogenesis disorders: Biological, clinical, and pathophysiological perspectives. Developmental Disabilities Research Reviews, 17(3), 187–196. doi: 10.1002/ddrr.1113 [DOI] [PubMed] [Google Scholar]
- Braverman NE, Raymond GV, Rizzo WB, Moser AB, Wilkinson ME, Stone EM, … Bose M (2016). Peroxisome biogenesis disorders in the Zellweger spectrum: An overview of current diagnosis, clinical manifestations, and treatment guidelines. Molecular Genetics and Metabolism, 117(3), 313–321. doi: 10.1016/j.ymgme.2015.12.009 [DOI] [PMC free article] [PubMed] [Google Scholar]
- Clark JG (1981). Uses and abuses of hearing loss classification. ASHA, 23(7), 493–500 [PubMed] [Google Scholar]
- Ferdinandusse S, Denis S, Mooyer PAW, Dekker C, Duran M, Soorani-Lunsing RJ, … Poll-The BT (2006). Clinical and biochemical spectrum of D-bifunctional protein deficiency. Annals of Neurology, 59(1), 92–104. doi: 10.1002/ana.20702 [DOI] [PubMed] [Google Scholar]
- Gunduz M, & Unal O (2016). Dysmorphic Facial Features and Other Clinical Characteristics in Two Patients with PEX1 Gene Mutations. Case Reports in Pediatrics, 2016, 1–5. doi: 10.1155/2016/5175709 [DOI] [PMC free article] [PubMed] [Google Scholar]
- Igarashi M, Schaumburg HH, Powers J, Kishimoto Y, Koilodny E, & Suzuki K (1976). Fatty Acid Abnormality In Adrenoleukodystrophy. Journal of Neurochemistry, 26(4), 851–860. doi: 10.1111/j.1471-4159.1976.tb04461.x-i1 [DOI] [PubMed] [Google Scholar]
- Klouwer FCC, Berendse K, Ferdinandusse S, Wanders RJA, Engelen M, & Poll-The BT (2015). Zellweger spectrum disorders: clinical overview and management approach. Orphanet Journal of Rare Diseases, 10(1). doi: 10.1186/s13023-015-0368-9 [DOI] [PMC free article] [PubMed] [Google Scholar]
- Lee PR, & Raymond GV (2013). Child Neurology: Zellweger syndrome. Neurology, 80(20). doi: 10.1212/wnl.0b013e3182929f8e [DOI] [PMC free article] [PubMed] [Google Scholar]
- Moser AB, Rasmussen M, Naidu S, Watkins PA, Mcguinness M, Hajra AK, … Moser HW (1995). Phenotype of patients with peroxisomal disorders subdivided into sixteen complementation groups. The Journal of Pediatrics, 127(1), 13–22. doi: 10.1016/s0022-3476(95)70250-4 [DOI] [PubMed] [Google Scholar]
- Poll-The BT, Gootjes J, Duran M, Klerk JBD, Liesbeth J Maillette De Buy Wenniger-Prick, Admiraal RJ, … Barth PG (2004). Peroxisome biogenesis disorders with prolonged survival: Phenotypic expression in a cohort of 31 patients. American Journal of Medical Genetics, 126A(4), 333–338. doi: 10.1002/ajmg.a.20664 [DOI] [PubMed] [Google Scholar]
- Raas-Rothschild A, Wanders RJ, Mooijer PA, Gootjes J, Waterham HR, Gutman A, … Korman SH (2002). A PEX6-Defective Peroxisomal Biogenesis Disorder with Severe Phenotype in an Infant, versus Mild Phenotype Resembling Usher Syndrome in the Affected Parents. The American Journal of Human Genetics, 70(4), 1062–1068. doi: 10.1086/339766 [DOI] [PMC free article] [PubMed] [Google Scholar]
- Reuber BE, Germain-Lee E, Collins CS, Morrell JC, Ameritunga R, Moser HW, … Gould SJ (1997). Mutations in PEX1 are the most common cause of peroxisome biogenesis disorders. Nature Genetics, 17(4), 445–448. doi: 10.1038/ng1297-445 [DOI] [PubMed] [Google Scholar]
- Rush ET, Goodwin JL, Braverman NE, & Rizzo WB (2016). Low bone mineral density is a common feature of Zellweger spectrum disorders. Molecular Genetics and Metabolism, 117(1), 33–37. doi: 10.1016/j.ymgme.2015.11.009 [DOI] [PubMed] [Google Scholar]
- Steinberg SJ, Dodt G, Raymond GV, Braverman NE, Moser AB, & Moser HW (2006). Peroxisome biogenesis disorders. Biochimica Et Biophysica Acta (BBA) - Molecular Cell Research, 1763(12), 1733–1748. doi: 10.1016/j.bbamcr.2006.09.010 [DOI] [PubMed] [Google Scholar]
- Theil AC, Schutgens RBH, Wanders RJA, & Heymans HSA (1992). Clinical recognition of patients affected by a peroxisomal disorder: A retrospective study in 40 patients. European Journal of Pediatrics, 151(2), 117–120. doi: 10.1007/bf01958955 [DOI] [PubMed] [Google Scholar]
- Torvik A, Torp S, Kase B, Ek J, Skjeldal O, & Stokke O (1988). Infantile Refsums disease: A generalized peroxisomal disorder. Journal of the Neurological Sciences, 85(1), 39–53. doi: 10.1016/0022-510x(88)90034-2 [DOI] [PubMed] [Google Scholar]
- Weller S, Gould SJ, & Valle D (2003). Peroxisome Biogenesis Disorders. Annual Review of Genomics and Human Genetics, 4(1), 165–211. doi: 10.1146/annurev.genom.4.070802.110424 [DOI] [PubMed] [Google Scholar]
- Wilson GN, Holmes RG, Custer J, Lipkowitz JL, Stover J, Datta N, … Reynolds JF (1986). Zellweger syndrome: Diagnostic assays, syndrome delineation, and potential therapy. American Journal of Medical Genetics, 24(1), 69–82. doi: 10.1002/ajmg.1320240109 [DOI] [PubMed] [Google Scholar]
Associated Data
This section collects any data citations, data availability statements, or supplementary materials included in this article.