Abstract
The strategy of structure-inherent tumor targeting (SITT) with cyanine-based fluorophores is getting more attention because no chemical conjugation of targeting moieties is required. However, the targeting mechanism behind SITT has not yet been well explained. Here, we demonstrate that heptamethine cyanine-based fluorophores possess not only targetability of tumor microenvironments without the need for additional targeting ligands but also NIR-II imaging capabilities, i.e., minimum scattering and ultralow autofluorescence. The new SITT mechanism suggests that bone-marrow-derived and/or tissue-resident/tumor-associated immune cells can be a principal target for cancer detection due to their abundance in tumoral tissues. Among the tested, SH1 provides ubiquitous tumor targetability and a high tumor-to-background ratio (TBR) ranging from 9.5 to 47 in pancreatic, breast, and lung cancer mouse models upon a single bolus intravenous injection. Furthermore, SH1 can be used to detect small cancerous tissues smaller than 2 mm in diameter in orthotopic lung cancer models. Thus, SH1 could be a promising cancer-targeting agent and have a bright future for intraoperative optical imaging and image-guided cancer surgery.
Keywords: Optical imaging, NIR-II, Tumor targeting, Tumor microenvironment, Tumor-associated immune cells
Graphical Abstract
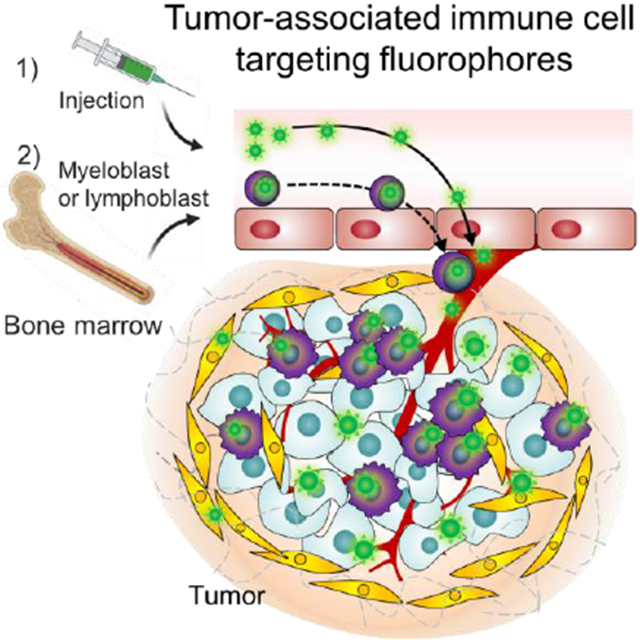
Cyanine-based SH1 is reported as a structure-inherent tumor targeting (SITT) fluorophore without targeting-ligands. Tumor-associated immune cell mediated targeting mechanism for SITT strategy is newly suggested, which is confirmed via in vitro flowcytometry and in vivo NIR-II imaging. SH1 provides ubiquitous tumor targetability in pancreatic, breast, and lung cancer models with a high tumor-to-background ratio.
1. Introduction
A tumor is not a single component but rather an ensemble production referred to as the tumor microenvironment (TME) composed of stromal fibroblasts, infiltrating immune cells, blood and lymphatic vascular networks, and the extracellular matrix.[1] The TME has emerged as an alternative target in tumor imaging and therapy because the nontumor cell components are presumably genetically stable which contrasts with tumor cells that are known to be genetically unstable.[1a] In addition, many human cancers such as colorectal, gastric, bladder, liver, lung, pancreatic, and cervical cancers are associated with chronic inflammation.[2] In the TME, infiltrating immune cells including inflammatory monocytes are recruited from the circulation and differentiate into macrophages as they migrate into the affected tissues when tissues are damaged following infection or injury.[3] Therefore, immune cells including bone marrow-derived and/or tissue-resident/tumor-associated immune cells (TRICs/TAICs) can be a principal target for cancer detection due to the abundance of immune cells in tumoral tissues (e.g. tumor-associated macrophages comprise approximately 50% of tumor mass[4]). Nonetheless, there is a lack of immune cell-targeted small molecular fluorophores reported in the literature.
Fluorescence imaging in the second NIR spectral window (NIR-II, 1,000-1,700 nm) has recently received tremendous attention in the field of basic molecular imaging for its high clinical applicability due to a significant reduction in tissue autofluorescence and scattering.[5] To date, several organic NIR-II dyes including donor-acceptor-donor (D-A-D) structure-based dyes[6] (e.g. CH1055[7]), FD-1080,[8] Flav7,[9] and conjugated polymers[10] have been reported. However, the lack of fluorophores having a high molecular extinction coefficient and quantum yield with a desirably strong signal brightness, due to the bulkiness of hydrophobic cores and severe fluorescence quenching in aqueous solution,[11] presents a major bottleneck. For this reason, indocyanine green (ICG, the only US FDA-approved heptamethine NIR fluorophore) as well as several other NIR-I dyes have been repurposed for NIR-II fluorescence imaging due to NIR-II emission tail, resulting in even higher signal intensity than commercially available NIR-II dyes (e.g. IR-E1050).[12] However, none of these dyes with NIR-II imaging capability have been reported to target tumors without further modification and/or conjugation of targeting moieties. With targeting moieties, these dyes can only target specific cancer cell types, and the chemical conjugation may also alter the specificity, affinity, and distribution of these agents in cells and tissues.[13] Therefore, it is worth developing a new targeting strategy using the cyanine-based fluorochrome to address several key challenges associated with NIR-II cancer imaging.[13b,14]
Here, we report targeted heptamethine cyanine-based fluorophores that possess not only a NIR-II imaging capability but also TAIC-mediated tumor targetability without the conjugation of targeting moieties. Among the tested, the NIR-II capability of SH1 allows for deep tissue imaging in vivo such as bone marrow, cerebral vasculature, and blood vessels in tumors with improved resolution. With TAIC-mediated tumor-targeting, SH1 provided diverse tumor targetability with a high tumor-to-background ratio (TBR) ranging from 9.5 to 47 in pancreatic, breast, and lung cancer mouse models upon a single bolus intravenous injection.
2. Results and Discussion
Indocyanine-based fluorophores lacking targeting moieties have occasionally shown tumor targetability, called structure-inherent tumor targeting (SITT),[13b,15] which have a native cancer-targeting property resulting in no need for further chemical conjugation of targeting moieties. Previous papers have suggested the targeting mechanisms are either membrane transporter mediated (i.e., organic anion transporters; OATP)[16] and/or via the albumin mediated enhanced permeability and retention (EPR) effect[17]. If the dye can directly target tumor cells, signals should show up during the very first circulation in the bloodstream followed by retention in the tumor cells while background tissue signal should gradually decrease, resulting in a high signal-to-background ratio (SBR). However, upon intravenous injection of the TAIC targeted fluorophore SH1 into tumor-bearing mice, we observed that signals in the cancerous region did not appear at early time points (even until 24 h post-injection), but rather abruptly showed up hours later (Figure 1). This unexpected observation prompted the fundamental question of whether there are other possible mechanisms for SITT. Interestingly, we observed that a portion of fluorophores accumulated in immune cells in bone marrow, followed by infiltration of those bone marrow-derived immune cells to the cancerous region, which resulted in a fluorescence signal intensity boost over time and a notably improved SBR (Figure 1a,c). In addition, the bone marrow in the spine, sternum, and hindlimb have been clearly seen with non-invasive NIR-II fluorescence imaging at 24 h post-injection (Figure 1c), owing to the NIR-II imaging capability of deeper penetration depth. Therefore, as depicted in Figure 1d, we hypothesize that SH1 has two different tumor-targeting mechanisms.[18] Once the fluorophore is injected, a portion of it can directly reach the cancerous region by systemic circulation and can be taken up by tumor cells as well as TRICs over time up to 24 h (the first mechanism in Figure 1d). In addition to this mode of action, the fluorophore can be internalized by immune cells in the bone marrow followed by infiltration of those bone marrow-derived immune cells to the cancerous region (the second mechanism in Figure 1a). This simultaneous tumor-targeting mechanism of the SH1 fluorophore causes the signal intensity in subcutaneous tumors to gradually increase over time.
Figure 1.
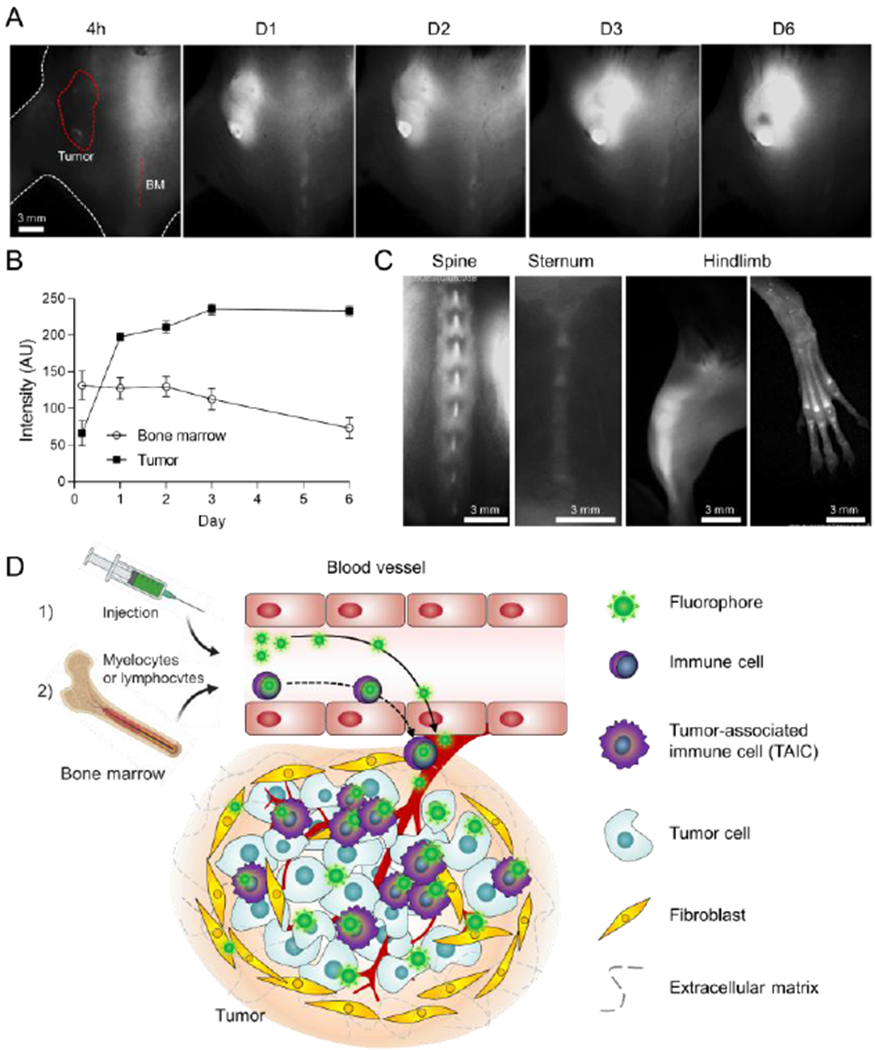
Intraoperative tumor imaging in the NIR-II window and targeting in the tumor microenvironment (TME). (excitation = 808 nm; power density = 30 mW cm−2; exposure time = 50 ms; optical filter = 1,070 nm LP) A) Time-course signal changes in the tumoral tissue and bone marrow in the spine. 50 nmol of SH1 was injected intravenously into the mouse model of pancreatic ductal adenocarcinoma (PDAC). The red circle and dotted line indicate the region of interest. BM; bone marrow. At day 6, black pigment developed in the tumor site which showed relatively low signal intensity. B) Longitudinal monitoring of signal changes in the tumor and bone marrow from the images shown in a. C) SH1 uptake in the bone marrow of spine, sternum, and hindlimb. D) Schematic illustration for two-step mechanism of tumor-targeted SH1 fluorophore: 1) SH1 fluorophore directly targets tumor-associated immune cells, tumor cells as well as myeloblasts/lymphoblasts, 2) targeted myeloblasts/lymphoblasts migrate through blood vessels followed by infiltration to the cancerous region.
Based on our in vivo screening results in the cyanine-based fluorophore library, we have designed SH1, which also has NIR-II imaging capabilities, as shown in Figure 2a. We synthesized SH1 by condensation reaction between heptamethine core 9 and heterocycle indolium salt 6, resulting in SH1 possessing two butyl chains and two chlorides on both sides of the indolium rings as well as a chloride at the meso position on the heptamethine core (Figure S1 in the Supporting Information). The characterization results from 1H and 13C NMR spectra and electrospray ionization time-of-flight (ESI-TOF) mass data were consistent with the proposed structure (Figure S2 in the Supporting Information).
Figure 2.
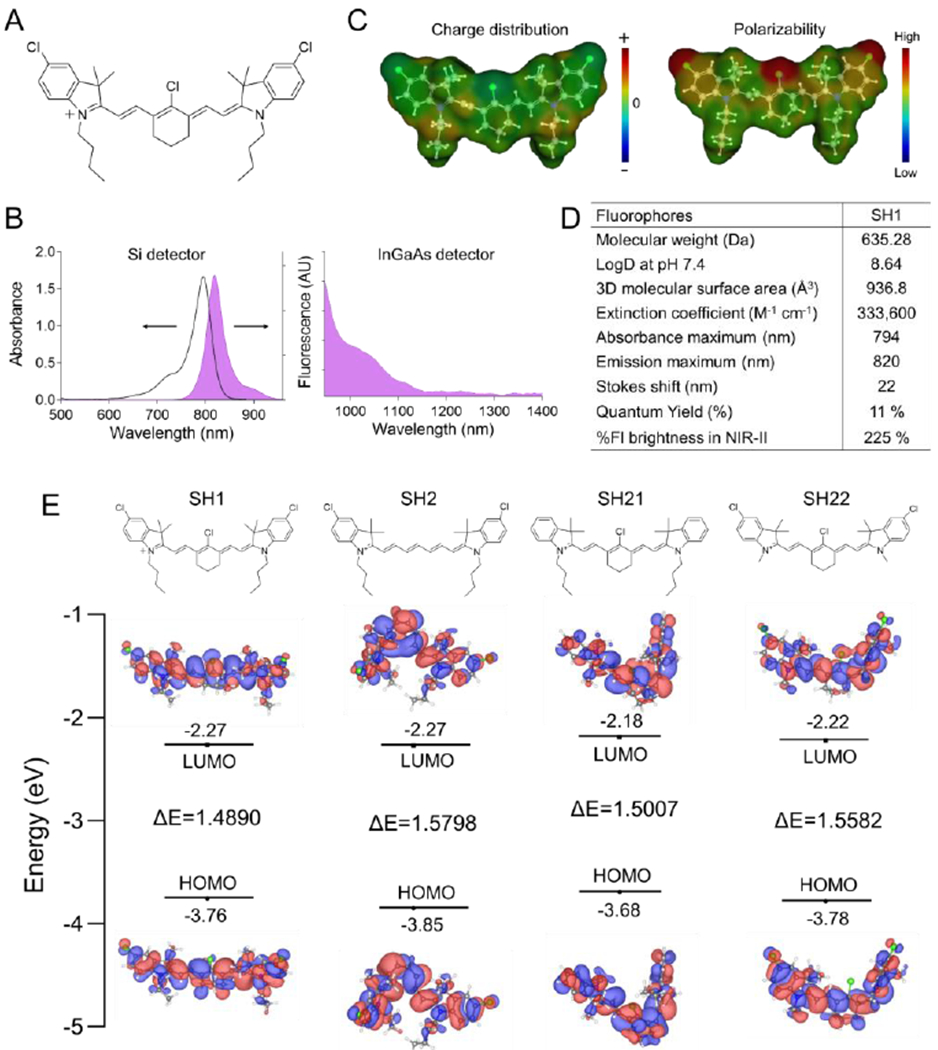
Design of TAIC-targeted NIR fluorophores. A) Chemical structure, B) absorption and NIR-I/II fluorescence emission spectra using silicon (left) and InGaAs (right) CCDs based spectrophotometers, and C) charge distribution and polarizability of SH1. D) Physical and optical properties of TME targeting fluorophores. Optical properties were measured at 5 μm SH1 in 5% BSA saline. The quantum yield and fluorescence brightness in the NIR-II region (950-1400 nm) of TME targeting SH1 were compared to those of indocyanine green (ICG). E) Schematic diagram of HOMO and LUMO energy levels of SH1, SH2, SH21, and SH22 calculated by density functional theory. The HOMO and LUMO energy levels were plotted based on the optimized S0 and S1 geometries using Gaussian 16 at Becke, 3-parameter, Lee–Yang–Parr (B3-LYP)/6-31G(d).
Next, we investigated the optical and physicochemical properties such as absorbance and fluorescence spectra, charge distributions, and polarizability of SH1 (Figure 2b–d). SH1 showed strong absorbance with an extinction coefficient of 333,600 M−1 cm−1, fluorescence emissions in the longer wavelengths of NIR-I (emission maximum is 820 nm) and NIR-II (tail emission up to ~1250 nm, this is one of the key factors in determining the NIR-II capacity). These observations support the notion that NIR-I heptamethine indocyanine dye can be repurposed for NIR-II imaging, which has been reported in very recent papers.[12a] SH1 exhibits higher quantum yield in 5w/v% BSA saline (11%) compared with commercially available NIR-II dyes IR-E1050 and IR26 (0.2-2% and 0.05-0.5%, respectively[7b,12e]). SH1 also has higher fluorescence brightness (225%) in the NIR-II region compared with ICG which is the only FDA-approved heptamethine NIR fluorophore for NIR-II imaging[12e].
Three more SH derivatives were further synthesized based on the heptamethine core (Figure S1 and Figure S3–S5, Supporting Information) and were compared in terms of the NIR-II imaging capability and tumor targetability. Although all four SH compounds show similar optical properties, SH1 shows the most dramatic red-shifted absorbance and fluorescence emission (Figure S6, Supporting Information). To understand these fluorophores, density functional theory (DFT) calculations were performed to examine their geometric and fluorescence properties (Figure 2e) using Gaussian 16 software (Wallingford, CT). We found that the cyclohexene ring in SH1 gives rigidity to the conjugated alkene framework[19] and prevents rotation along the middle bond making it more favorable in producing an asymmetric configuration compared to SH2, resulting in a lower molecular energy gap between the HOMOs and LUMOs. In addition, the butyl chains in SH1, which are more electron-donating than the methyl groups in SH22, cause SH1 to have a lower molecular energy gap than SH22.
To demonstrate the improved fluorescence imaging in the NIR-II region, we compared NIR-I (>780 nm, using KFLARE system) and NIR-II (>1100 nm, using Ninox InGaAs camera) images of skin phantoms at various depths (0-12 mm) as shown in Figure S7a,b, Supporting Information. Based on the data, we have confirmed that NIR-II imaging has deeper optical penetration with clear resolution and high contrast. SBR and full width at half maximum (FWHM) profiles of capillaries at increasing phantom tissue depths were shown in Figure S7c,d. The result showed that NIR-II images have 4.8 times higher SBR and 2.8 times narrower FWHM at 12 mm in depth compared to NIR-I, which can be attributed to the reduced scattering at the longer emission wavelength. Furthermore, in vivo brain imaging was performed (Figure S7e). SH1 (100 μL, 500 µm in 5% BSA saline) was injected into a shaved CD-1 mouse and cerebral vessels were imaged with different imaging settings such as NIR-I with a 780 nm long pass (LP) filter and NIR-II with either 900 nm LP or 1200 nm LP filters. With the 1200 nm LP filter, it was clearly shown that using a longer wavelength greatly attenuates the tissue scattering and autofluorescence. Similarly, blood vessel networks in the tumor were able to be visualized (Figure S7f).
Prior to performing intraoperative tumor targeting with SH1, an in vitro inhibition test was performed to confirm whether SH1 cellular internalization in cancer cells and macrophages occurred via transporters or endocytosis (mechanism of action). Membrane transporters including organic anion transporting polypeptides (OATPs), organic cation transporters (OCTs/OCTNs), and ATP-binding cassette (ABC) transporters regulate the transcellular movement of small organic molecules[20] and are implicated in playing a critical role in tumor targetability of organic fluorophores. Endocytosis also represents a major pathway for cellular uptake of diagnostic and therapeutic nanoparticles.[21] Neither bromosulphophthalein, cyclosporin A (both OATP inhibitors), D22 (OCT inhibitor), nor MK-571 (ABC transporter inhibitor) significantly inhibited SH1 uptake (Figure S8, Supporting Information), suggesting that these membrane transporters are not involved in this process. Dynamin-dependent endocytosis inhibitor dingo 4a significantly inhibited the internalization of TAIC targeted SH1 and decreased accumulation in all the cell types tested. In contrast, Pitstop 2, which is a clathrin-dependent endocytosis inhibitor, did not result in any appreciable change in cellular uptake. These results suggest that fast endophilin-mediated endocytosis (FEME), which is a clathrin-independent/dynamin-dependent subgroup pathway of endocytosis[22], plays a predominant role in cellular uptake of SH1, and that SH1 has great potential for broad-spectrum immune cell targeting as well as tumor targetability via FEME. In addition to the inhibition test, a cell viability assay was conducted which showed that up to 10 μm of SH1 did not affect cell proliferation (Figure S8c, Supporting Information). We also conducted a flow cytometry experiment to evaluate the target cells in TAICs in bone marrow and tumors. It was found that the majority of the population which was targeted by SH1 were immune-related cells of the bone marrow such as macrophages, monocytes, lymphocytes, neutrophils, and dendritic cells (Figure 3, gating strategy is shown in Figure S9, Supporting Information). Among them, macrophages, Ly6Clow monocytes, and dendritic cells were identified as SH1-targeted TAICs in the tumor region. In addition, significant inflammatory infiltrations of targeted immune cells, as well as TRICs, were observed by immunohistochemical staining (F4/80 antigen as a mouse macrophage marker) and histological fluorescence analyses, resulting in a significant increase in the fluorescent signals in tumor tissues (Figure 3c).
Figure 3.
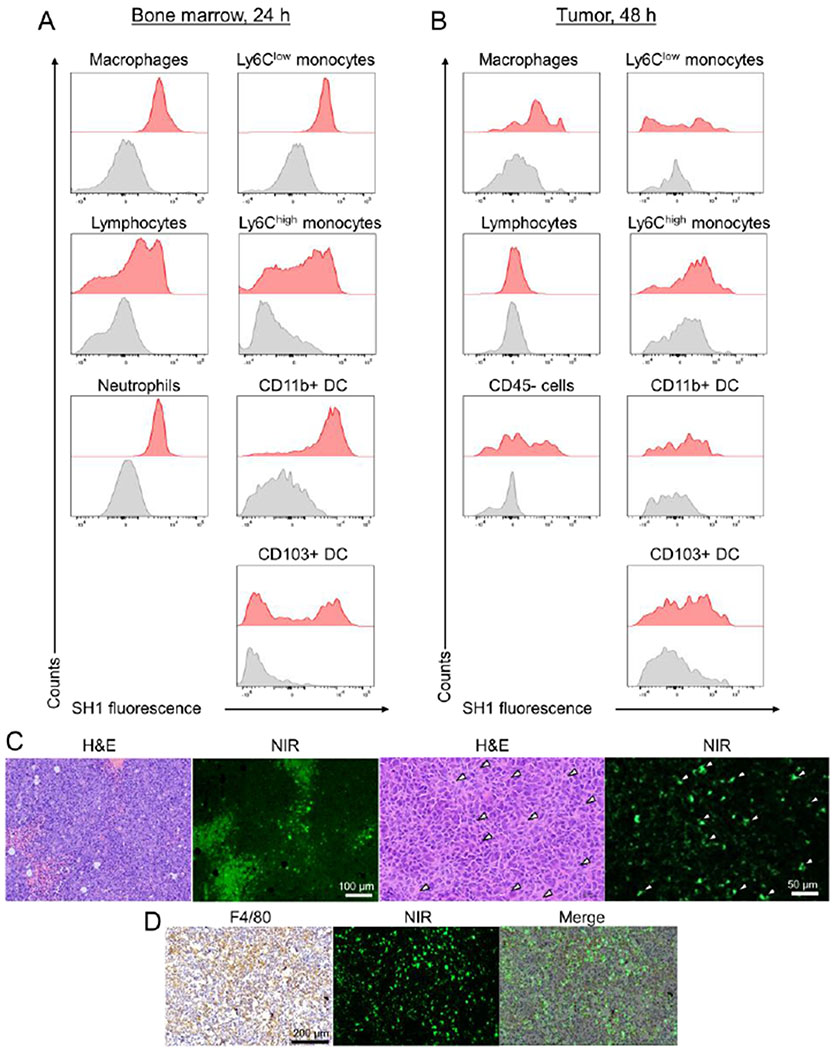
Identification of SH1 targeted immune cells from bone marrow and tumor tissues by flow cytometry analysis. A) Immune cells including macrophages, monocytes, neutrophils, monocytes, lymphocytes, and dendritic cells were assessed in the isolated bone marrow from mice intravenously injected with SH1 at 24 h post-injection and B) in the tumor from LLC tumor mice at 48 h post-injection. (n=2-3 for each tissue) The gating strategy is shown in Figure S9 of Supporting Information. DC stands for dendritic cells. C) H&E staining and D) F4/80 antigen (mouse macrophage marker) staining images compared with NIR fluorescence microscopic images of a resected tumor. White arrowheads indicate SH1 targeted tumor-associated macrophages.
Next, we investigated the structural effect on in vivo tumor targetability and verified whether the mode of transport to tumors relied on the immune cell-mediated tumor targeting of SH1 rather than the EPR effect by comparison with the SH1 analogs and previously reported tumor targeting fluorophores, ICG and IR-780, as controls. First, all SH series fluorophores were intravenously injected into LLC tumor-bearing mice to confirm the structural effects. Interestingly, the dyes which had only chlorine atoms or butyl side chains did not show strong fluorescence signals in tumor sites, as shown in Figure S10. This result indicates that both chlorine atoms at the meso/side positions and butyl chains together are important for tumor targetability based on the TAIC targeting strategy. Second, SH1, ICG, and IR-780 were compared in terms of the NIR-II fluorescence brightness, tumor targeting mechanism, and targeting capability by using NIR-II imaging, 3D FLECT/CT quantification imaging, flow cytometry, histological, and serum protein binding analyses. As the result of brightness in the NIR-II region, SH1 is 2.2- and 1.7-fold brighter than ICG and IR-780, respectively (Figure S11, Supporting Information). SH1, ICG, and IR-780 were injected into LLC tumor-bearing mice, and SH1 showed superb signal intensity in tumor area at 48 h post-injection while ICG did not show good tumor targeting owing to its fast hepatobiliary clearance (Figure 4a–c, Figure S12, Supporting Information). Interestingly, IR-780 showed a different tumor accumulation pattern from that of SH1; accumulating in tumors at early time points around 4 h post-injection. In addition, even though similar signal intensity in tumors was observed in IR-780 and SH1 injected mice, the signal intensity in IR-780 injected mice significantly decreased after skin removal (Figure 4c). This different tumor accumulation indicates that the tumor targeting mechanism of IR-780 (especially the mode of transport) is different from that of SH1. The strong signals in the blood plasma of IR-780 injected mice observed at 48 post-injection were likely due to fast/permanent serum protein binding of IR-780 (Figure 4d, Figure S12, Supporting Information) which was confirmed by serum protein binding test (Figure S13, Supporting Information). Unlike with IR-780 (100% serum protein binding, mostly albumin, within 30 min; the time to bind half of the maximum was reported to ~2 min[17b]), SH1 showed relatively slow serum protein binding kinetics (~35% within 30 min) which caused significant differences in the initial biodistribution, target organs, and tumor targetability. In Figure 4e, histological and flow cytometry analyses further confirmed the different tumor targeting patterns/abilities among SH1, ICG, and IR-780 (Figure 4e,f, Figure S14, Supporting Information). ICG signals were barely present in the tumor, and IR780 signals were only present in the peritumoral region, but SH1 gave strong fluorescence signals in the targeted tumor. In addition, ICG barely targeted immune cells as positively stained cells across distinct immune cell populations were < 8 % in the bone marrow and < 14% in the tumor. Similarly, IR-780 poorly targeted immune cells as those are < 22 % positive in bone marrow and < 7% in the tumor. In contrast, SH1 targeted tumor-associated immune cells (Ly6Chigh monocyte; 48.6%, Ly6Clow monocyte; 43.1%, Macrophage; 45.7%, CD11b+ DCs; 45.4%, CD103+ DCs; 23.8%). Additionally, the % injection doses (%ID) of each injected dye in cancer areas at 24 and 48 h were estimated based on a three-dimensional (3D) tomographic fluorescence imaging technique using the InSyTe™ FLECT/CT system (TriFoil Imaging, Chatsworth, CA) (Figure 4g,h, Figure S15, Supporting Information). The %ID of SH1 increased more than 2-fold from 24 h to 48 h post-injection, which also supports our hypothesis that SH1 targeted TAIC migration increases TBR over time.
Figure 4.
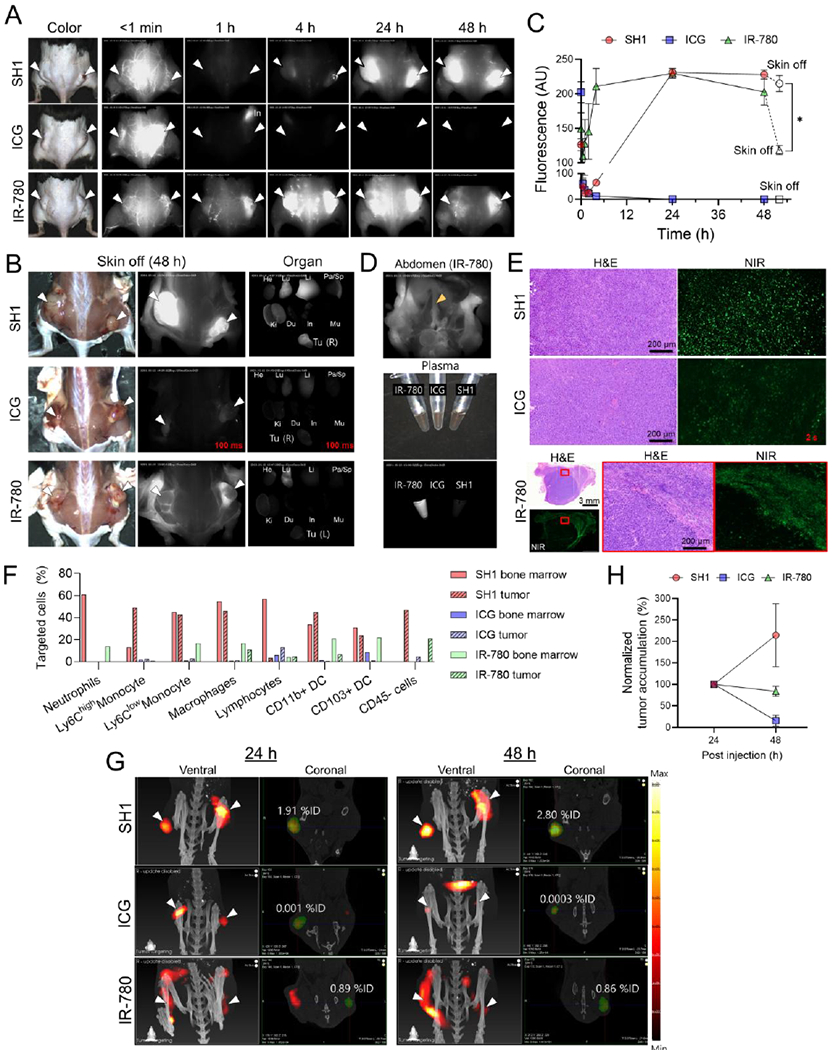
In vivo imaging of SH1 tumor targetability based on tumor-associated immune cells on lung carcinoma (LLC cell line) bearing C57BL/6 mice compared to IR-780 and ICG as a control. A) NIR-II fluorescence imaging until 48 h post-injection, B) after removing skin and ex vivo imaging of tumor and each organ, and C) signal intensities of tumor site. (n = 4, mean ± s.e.m., p values <0.05 were considered significant: *p < 0.05) (excitation = 808 nm; power density = 30 mW cm−2; exposure time = 15 ms except images for ICG in B; optical filter = 1,070 nm LP) D) Abdominal image of mouse injected with IR-780. Yellow arrowhead indicates that IR-780 is circulating in the blood stream such as the inferior vena cava. E) H&E and NIR images of resected tumors. Exposure time = 500 ms except images for ICG due to low signal. F) Flow cytometry summary of a portion of targeted cells for each fluorophore from Figure S14 in Supporting Information. G) 3D fluorescence emission computed tomography with x-ray CT (FLECT/CT) images for relative quantification of tumor accumulation at 24 h and 48 h post-injection and H) their tumor accumulations. (n = 2-3, mean ± s.e.m.) The green area indicates the volume-of-interest (VOI) for quantification. White arrowheads indicate tumors in all images.
Lastly, tumor targeting of SH1 was performed on Pan02 cell inoculated immune-deficient athymic nude mice (NCr nude homozygous CrTac:NCr-Foxn1nu) (Figure S16, Supporting Information). The SH1-injected mice showed high uptake in the immune-related cells of bone marrow initially, of which signals decreased gradually after 1-day post-injection. However, the skin background signal increased instead of the tumor signal which might imply immune cells are not recruited to the tumor likely due to the immune deficiency. As a result of the high background, the tumor-to-muscle signal ratio was calculated to be ~3.0. This result of tumor targeting on immune-deficient mice strongly supports that SH1 tumor targetability is associated with SH1 targeted immune cell migrations from the bone marrow to the tumor area. Overall, the results of various analyses support the TAIC-mediated tumor targeting mechanism for SH1 as the mode of transport to tumor which occurs via 1) direct targeting to tumor cells as well as TAICs such as macrophages, monocytes, lymphocytes, neutrophils, and dendritic cells, and 2) migration of targeted TAICs through blood vessels followed by infiltration to a cancerous region.
To examine the pharmacokinetics and biodistribution characteristics of the TAIC targeted fluorophore SH1, CD-1 mice were intravenously administered SH1 (1 μmol/kg). Blood concentration in serum and biodistribution was quantified by measuring the fluorescence signal (Figure S17, Supporting Information). The results demonstrated that SH1 follows a one-compartment model and distributed completely within 24 h (t½ = 5.39 ± 1.53 h), with major distribution in the liver and spleen which are immune cell abundant organs.
SH1 could potentially target varying types of tumors due to its universal targeting mechanism. To evaluate its broad-spectrum tumor targeting, three syngeneic tumor models with different tumor types and sizes including pancreatic, lung, and triple negative breast cancers were established (Figure 5a). The syngeneic mouse models which have a functional immune system presents the tumor development, the microenvironment, and the immune response. Despite the absence of specific targeting moieties, SH1 has excellent targeting performance in pancreatic ductal adenocarcinoma (PDAC) less than 5 mm in size with high TBR (~9.5) compared to the healthy tissue region. In larger-sized tumors, TBRs were 23.7 and 17.6 in lung and breast cancers, respectively. This suggests that SH1 shows broad spectrum tumor-targeting capability, which is independent of cancer type and size.
Figure 5.
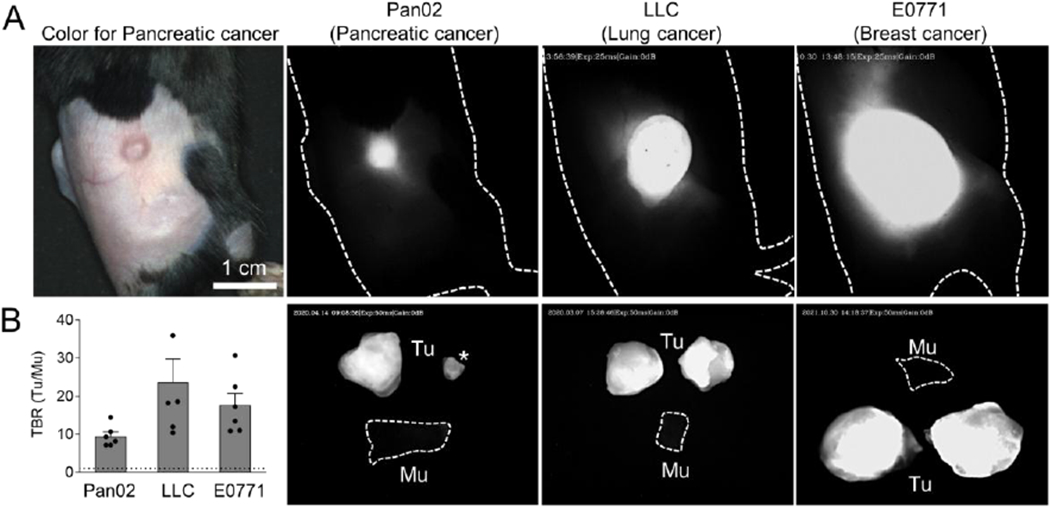
In vivo imaging of SH1 tumor targetability based on tumor-associated immune cells. A) NIR-II fluorescence imaging of subcutaneous tumor mouse models such as pancreatic ductal adenocarcinoma (PDAC; Pan02 cell), lung carcinoma (LLC cell), and triple-negative breast adenocarcinoma (E0771 cell) with various tumor sizes. 2×10⁵ cells of each cell line (100 μL of DMEM/Matrigel; 50 v/v%) were inoculated in the C57BL/6 mouse flank region, respectively. Female C57BL/6 mice were used for the breast cancer model, otherwise male mice were used. These mice were on active surveillance until diameters of their tumors reached to desired sizes such as 5 mm, 10 mm, and 15 mm, respectively. (excitation = 808 nm; power density = 30 mW cm−2; exposure time = 25-50 ms; optical filter = 1,070 nm LP) B) Tumor-to-background signal ratios of dissected tumors compared with muscles (n=6, mean ± s.e.m.). Asterisk indicates the same pancreatic tumor in A.
We next evaluated the tumor targetability of SH1 in an orthotopic lung tumor model. This model can provide a reliable representation of the tumor environment as cells are placed directly into their organ of origin. Fluorescence signals from the small tumors were clearly shown in a real-time image (Figure 6). The high TBRs 47.3 and 3.12 were calculated against normal tissue and the lung, respectively, suggesting SH1 has significant potential as a contrast agent in intraoperative thoracic surgery. We also confirmed the margin in the dissected tumor can be distinguished by the strong fluorescence signals of SH1, and it is well-correlated with the H&E staining result (Figure 6d).
Figure 6.
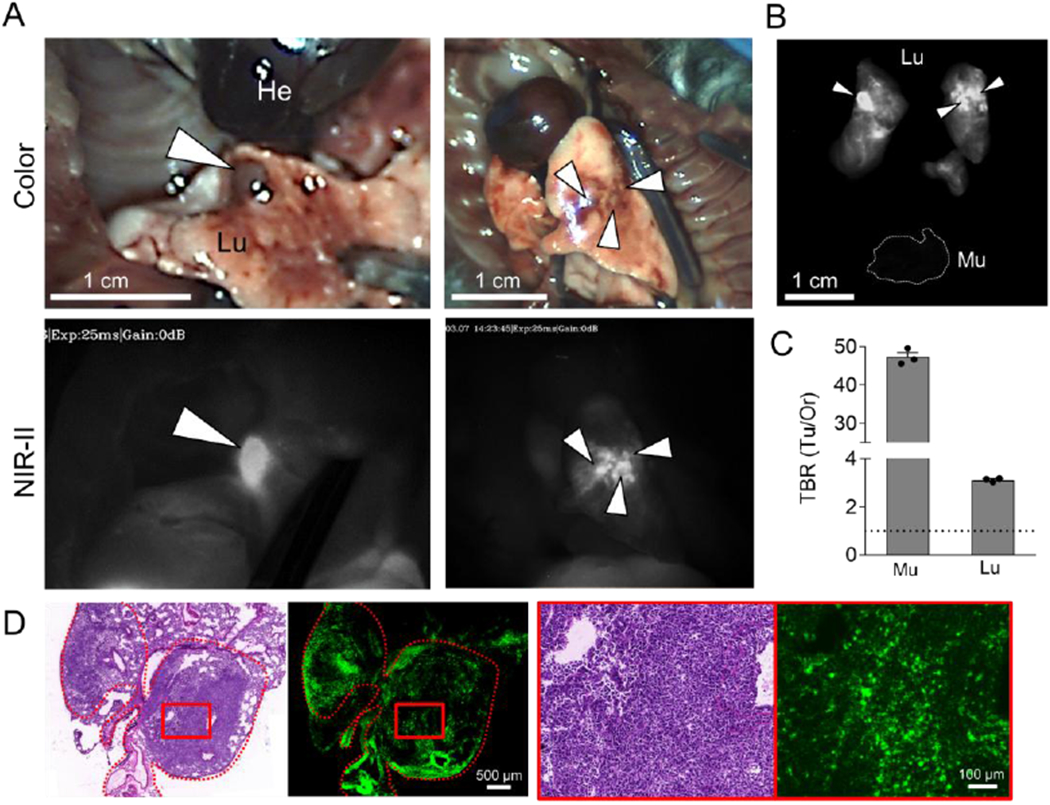
Orthotopic lung tumor targeting. A) 50 nmol of SH1 was injected into the mouse model of orthotopic lung cancer tumors 48 h prior to imaging. White arrowheads indicate lung tumors. (excitation = 808 nm; power density = 30 mW cm−2; exposure time = 25 ms; optical filter = 1,070 nm LP) B) NIR images and C) tumor-to-background signal ratios of dissected tumors compared with muscle and lung (n = 3, mean ± s.e.m.). D) Postoperative histopathological examination; H&E staining images and NIR fluorescence microscopic images.
3. Conclusion
In this study, inspired by our recent success in the development of organ- or disease-specific fluorophores, we designed and synthesized TAIC-targeted fluorophore SH1 as a SITT agent for intraoperative NIR-II fluorescence imaging. To the best of our knowledge, we have demonstrated, for the first time, the TAIC-mediated tumor targeting mechanism, which was confirmed by flow cytometry and histological studies, in vivo NIR-II fluorescence imaging, and 3D tomographic imaging. The NIR-II capability of SH1 along with the InGaAs camera built-in NIR-II imaging system greatly facilitated image quality permitting the observation of signals in deep tissues and significantly improved the sensitivity in intraoperative cancer surgery. The SH1 fluorophore can reach a high TBR (9 to 47 in various cancer types) in tumor sites in comparison with healthy tissue. Furthermore, SH1 can also be used to detect small lesions such as metastatic tumors. Thus, SH1 presents itself as a promising cancer-targeting agent which will have a bright future in intraoperative optical imaging.
4. Experimental Section
Reagents and Materials:
All the materials related to synthesis are described in Supporting Information. Reagents were purchased from Fisher Scientific (Pittsburgh, PA), Sigma-Aldrich (Saint Louis, MO), or Acros Organics (Morris Plains, NJ). RAW 264.7, Pan02, E0771, and Lewis lung carcinoma (LLC) cells were purchased from ATCC (Manassas, VA).
Flow cytometry analysis:
Bone marrow tissue was mechanically dissociated and digested with collagenase D (175 unit/mL, Roche) and DNase I (100 unit/mL, Roche) followed by EDTA (2 mM, Invitrogen). Erythrocytes were removed using RBC Lysis Buffer (Invitrogen). Tumor tissue was mechanically dissociated and digested with collagenase I (175 unit/mL, Thermo-fisher), Collagenase IV (250 unit/mL, Thermo-fisher, 1700019), and DNase I (100 unit/mL) followed by EDTA (2 mm). Immune cells were isolated from cell suspensions of the bone marrow or tumor tissue using Ficoll® Paque Plus (GE Healthcare). Isolated cells were stained with anti-mouse F4/80 (BM8, Biolegend, 123131), anti-mouse Ly-6G (1A8, Biolegend, 127639), anti-mouse Ly-6C (HK1.4, Biolegend, 128011), anti-mouse CD11c (N418, Biolegend, 117313), anti-mouse CD103 (2E7, Biolegend, 121425), anti-mouse I-A/I-E (M5/114.15.2 Biolegend, 107611), anti-mouse/human CD11b (M1/70, Biolegend, 101254) and anti-mouse CD45 antibodies (30-F11, Biolegend, 103105) conjugated to fluorophores. We also stained isolated cells with Live/dead®-Aqua (Life Technologies) to distinguish live cells. Stained cells were fixed using 1% paraformaldehyde prior to analysis. Data acquisition was performed on a Fortessa cytometer (BD) followed by analysis on FlowJo software (Tree Star).
General NIR-II fluorescence imaging:
A 640 × 512-pixel InGaAs camera (Ninox640, Raptor Photonics) and macro zoom lens (0-10×; Navitar Zoom 7000 with SWIR coating) along with 900, 1070, 1100, and 1200 nm long-pass (LP) filters from either Thorlab or Edmund optics were used to collect the NIR-II signal. InGaAs camera plays a key role as an open-air imaging system along with the support of the FLARE system. An 808 nm fiber-coupled diode laser (30-35 mW/cm−2 at the sample) was used as an excitation source. Data acquisition was done using in-house developed software. The mice fur on the region of interest was shaved prior to imaging using a clipper and removed completely using a depilatory cream. 100 μL of SH1 in 5w/v% BSA saline (500 μm) was injected through the tail vein. Mice were imaged with intact skin using InGaAs camera. At least 3 mice were analyzed for each sample.
Tumor-bearing mouse models:
Animals were housed in an AAALAC-certified facility and were studied under the protocols approved by the MGH IACUC (2016N000136). Mice were maintained under anesthesia with isoflurane and oxygen during the experiment. To establish the various tumor-bearing mouse models including lung carcinoma, pancreatic ductal adenocarcinoma (PDAC), and triple negative breast adenocarcinoma, eight-week-old C57BL/6 mice (Taconic Farms, Germantown, NY) were subcutaneously injected with 2×10⁵ LLC, Pan02, and E0771 cells suspended in DMEM/Matrigel (100 μL, 50 v/v%) in the flank region, respectively. Female C57BL/6 mice were used for the breast cancer (E0771) model, otherwise male mice were used. An orthotopic lung cancer model was established in C57BL/6 mice by inoculation of LLC cell suspension (20 μL, 106 in 100 μl DMEM media) after intratracheal intubation.
Tumor histopathology evaluation:
The tumor tissue was fixed in 10% neutral buffered formalin and was dehydrated in ethanol, embedded in paraffin, and sectioned into slices (5 μm). After rinsing with PBS, the fixed sections were counterstained with nuclear fast red, dehydrated by ethanol, transferred into xylene, and finally mounted according to the standard protocol. To determine the tissue distribution of the NIR fluorophore, the dissected tissues were embedded in Tissue-Tek optimum cutting temperature compound (Sakura Finetek, Torrance, CA) without a pre-fixation step. The tissue block was frozen at −80 °C. Frozen sections were cut at a thickness of 10 or 50 μm by a cryostat (Leica, Germany). Then, the tissue sections were stained with hematoxylin and eosin (H&E). We used the BioTek Cytation 5 (Winooski, VT) for pathological fluorescence imaging and observation.
Quantitative analysis using InSyTe FLECT/CT:
3D fluorescence images were acquired with the TriFoil Imaging InSyTe FLECT/CT, a commercial preclinical imaging system with full 3D fluorescence tomography imaging capability and an inline CT system. Animals were anesthetized with isoflurane during scans. FLECT scans were performed with 116 projections per slice, 780 nm laser for excitation, and 853/45 bandpass fluorescence emission filter. After data collection, fluorescence images were reconstructed using a proprietary FLECT reconstruction engine. CT scans were performed with 360 projections per slice, 35 kV tube voltage, 950 μA tube current, and 100 ms exposure. CT images were reconstructed using the COBRA filtered back-projection algorithm (Exxim, Computing Corporation, Pleasanton, CA). Quantitative analysis of 3D fluorescence images was performed using the VivoQuant 2020 image analysis software (Invicro, Boston, MA). FLECT and CT images were co-registered in VivoQuant 2020. Volumes-of-interest (VOI) were segmented via intensity thresholding, where the threshold limits were set to the local full-width-half-maximum (FWHM) intensity value for the lower threshold bound and local maximum intensity value for the upper threshold bound. Instrument linear response was demonstrated by performing sequential scans of a tissue-mimicking phantom filled with increasing concentrations of a control fluorescent dye (SH1) and performing the VOI analysis above.
Statistical analysis:
The fluorescence and background intensities of a region of interest over each tissue were quantified using customized imaging software and ImageJ v1.48 (National Institutes of Health, Bethesda, MD). The signal-to-background ratio (SBR) was calculated as SBR = fluorescence/background, where background is the fluorescence intensity of muscle. Data are reported as mean ± s.e.m. with a minimum of three biological replicates. Student’s t-test statistical analysis was performed to evaluate the significance of the experimental data. The differences among groups were determined using one-way ANOVA analysis to assess the statistical differences among more than two groups. A p value of less than 0.05 was considered significant. The data was indicated with *p <0.05, **p <0.01, ***p <0.001, and ****p <0.0001.
Supplementary Material
Acknowledgments:
We thank Wesley Stiles for manuscript editing. This study was supported by NIBIB #R01EB022230, NHLBI #R01HL143020, the Creative Materials Discovery Program through the National Research Foundation of Korea (2019M3D1A1078938). The content expressed is solely the responsibility of the authors and do not necessarily represent the official views of the NIH. Some components in Scheme 1 were from BioRender.com.
Footnotes
Supporting Information
Supporting Information is available from the Wiley Online Library or from the author.
Conflict of Interests
The authors declare no competing interests.
Contributor Information
Homan Kang, Gordon Center for Medical Imaging, Department of Radiology, Massachusetts General Hospital and Harvard Medical School, Boston, MA 02114, United States.
Md Shamim, Department of Chemistry, Center of Diagnostics and Therapeutics, Georgia State University, Atlanta, GA 30303, United States.
Xiaoran Yin, Gordon Center for Medical Imaging, Department of Radiology, Massachusetts General Hospital and Harvard Medical School, Boston, MA 02114, United States; Department of Oncology, The Second Affiliated Hospital of Xi’an Jiaotong University, Xi’an, Shaanxi, 710004, China.
Eeswar Adluru, Gordon Center for Medical Imaging, Department of Radiology, Massachusetts General Hospital and Harvard Medical School, Boston, MA 02114, United States.
Takeshi Fukuda, Gordon Center for Medical Imaging, Department of Radiology, Massachusetts General Hospital and Harvard Medical School, Boston, MA 02114, United States; Department of Obstetrics and Gynecology, Osaka City University Graduate School of Medicine, 1-4-3, Asahimachi, Abeno-ku, Osaka, 545-8585, Japan.
Shinya Yokomizo, Gordon Center for Medical Imaging, Department of Radiology, Massachusetts General Hospital and Harvard Medical School, Boston, MA 02114, United States; Department of Radiological Sciences, Tokyo Metropolitan University, 7-2-10 Higashi-Ogu, Arakawa, Tokyo 116-8551, Japan.
Hyejin Chang, Division of Science Education, Kangwon National University, Chuncheon 24341, South Korea.
Seung Hun Park, Gordon Center for Medical Imaging, Department of Radiology, Massachusetts General Hospital and Harvard Medical School, Boston, MA 02114, United States.
Yanan Cui, Gordon Center for Medical Imaging, Department of Radiology, Massachusetts General Hospital and Harvard Medical School, Boston, MA 02114, United States; School of Pharmacy, Jining Medical College, Rizhao, Shandong, 276826, China.
Austin J. Moy, Trifoil Imaging, 9449 De Soto Ave, Chatsworth, CA 91311, United States
Satoshi Kashiwagi, Gordon Center for Medical Imaging, Department of Radiology, Massachusetts General Hospital and Harvard Medical School, Boston, MA 02114, United States.
Maged Henary, Department of Chemistry, Center of Diagnostics and Therapeutics, Georgia State University, Atlanta, GA 30303, United States.
Hak Soo Choi, Gordon Center for Medical Imaging, Department of Radiology, Massachusetts General Hospital and Harvard Medical School, Boston, MA 02114, United States.
References
- [1].a) Joyce JA, Cancer Cell 2005, 7, 513; [DOI] [PubMed] [Google Scholar]; b) Wang M, Zhao J, Zhang L, Wei F, Lian Y, Wu Y, Gong Z, Zhang S, Zhou J, Cao K, Li X, Xiong W, Li G, Zeng Z, Guo C, J Cancer 2017, 8, 761. [DOI] [PMC free article] [PubMed] [Google Scholar]
- [2].a) Balkwill F, Charles KA, Mantovani A, Cancer cell 2005, 7, 211; [DOI] [PubMed] [Google Scholar]; b) Coussens LM, Werb Z, Nature 2002, 420, 860. [DOI] [PMC free article] [PubMed] [Google Scholar]
- [3].Wynn TA, Chawla A, Pollard JW, Nature 2013, 496, 445. [DOI] [PMC free article] [PubMed] [Google Scholar]
- [4].Vinogradov S, Warren G, Wei X, Nanomedicine 2014, 9, 695. [DOI] [PMC free article] [PubMed] [Google Scholar]
- [5].a) Hu Z, Fang C, Li B, Zhang Z, Cao C, Cai M, Su S, Sun X, Shi X, Li C, Zhou T, Zhang Y, Chi C, He P, Xia X, Chen Y, Gambhir SS, Cheng Z, Tian J, Nat Biomed Eng 2020, 4, 259; [DOI] [PubMed] [Google Scholar]; b) Choi HS, Kim HK, Nat Biomed Eng 2020, 4, 245; [DOI] [PubMed] [Google Scholar]; c) Hong G, Antaris AL, Dai H, Nature Biomedical Engineering 2017, 1, 0010; [Google Scholar]; d) Ding F, Fan Y, Sun Y, Zhang F, Adv Healthc Mater 2019, 8, e1900260; [DOI] [PubMed] [Google Scholar]; e) Kilian HI, Kang H, Nyayapathi N, Fukuda T, Adluru E, Zhang H, Quinn B, Xia J, Choi HS, Lovell JF, Biomaterials Science 2020, 8, 4199; [DOI] [PMC free article] [PubMed] [Google Scholar]; f) Lucero MY, East AK, Chan J, Methods Enzymol 2021, 657, 157; [DOI] [PubMed] [Google Scholar]; g) Huang J, Pu K, Angew Chem Int Ed Engl 2020, 59, 11717; [DOI] [PubMed] [Google Scholar]; h) Cheng P, Pu K, Nature Reviews Materials 2021, 10.1038/s41578-021-00328-6. [DOI] [Google Scholar]
- [6].a) Yang Q, Ma Z, Wang H, Zhou B, Zhu S, Zhong Y, Wang J, Wan H, Antaris A, Ma R, Zhang X, Yang J, Zhang X, Sun H, Liu W, Liang Y, Dai H, Adv Mater 2017, 29; [DOI] [PubMed] [Google Scholar]; b) Wan H, Yue J, Zhu S, Uno T, Zhang X, Yang Q, Yu K, Hong G, Wang J, Li L, Ma Z, Gao H, Zhong Y, Su J, Antaris AL, Xia Y, Luo J, Liang Y, Dai H, Nat Commun 2018, 9, 1171. [DOI] [PMC free article] [PubMed] [Google Scholar]
- [7].a) Antaris AL, Chen H, Cheng K, Sun Y, Hong G, Qu C, Diao S, Deng Z, Hu X, Zhang B, Zhang X, Yaghi OK, Alamparambil ZR, Hong X, Cheng Z, Dai H, Nat Mater 2016, 15, 235; [DOI] [PubMed] [Google Scholar]; b) Antaris AL, Chen H, Diao S, Ma Z, Zhang Z, Zhu S, Wang J, Lozano AX, Fan Q, Chew L, Zhu M, Cheng K, Hong X, Dai H, Cheng Z, Nat Commun 2017, 8, 15269. [DOI] [PMC free article] [PubMed] [Google Scholar]
- [8].Li B, Lu L, Zhao M, Lei Z, Zhang F, Angew Chem Int Ed Engl 2018, 57, 7483. [DOI] [PubMed] [Google Scholar]
- [9].a) Cosco ED, Caram JR, Bruns OT, Franke D, Day RA, Farr EP, Bawendi MG, Sletten EM, Angew Chem Int Ed Engl 2017, 56, 13126; [DOI] [PubMed] [Google Scholar]; b) Cosco ED, Spearman AL, Ramakrishnan S, Lingg JGP, Saccomano M, Pengshung M, Arus BA, Wong KCY, Glasl S, Ntziachristos V, Warmer M, McLaughlin RR, Bruns OT, Sletten EM, Nat Chem 2020, 12, 1123. [DOI] [PMC free article] [PubMed] [Google Scholar]
- [10].a) Li J, Pu K, Chemical Society Reviews 2019, 48, 38; [DOI] [PubMed] [Google Scholar]; b) Guo B, Feng Z, Hu D, Xu S, Middha E, Pan Y, Liu C, Zheng H, Qian J, Sheng Z, Liu B, Adv Mater 2019, 31, e1902504. [DOI] [PubMed] [Google Scholar]
- [11].a) Wang S, Fan Y, Li D, Sun C, Lei Z, Lu L, Wang T, Zhang F, Nat Commun 2019, 10, 1058; [DOI] [PMC free article] [PubMed] [Google Scholar]; b) Miranda D, Huang H, Kang H, Zhan Y, Wang D, Zhou Y, Geng J, Kilian HI, Stiles W, Razi A, Ortega J, Xia J, Choi HS, Lovell JF, Theranostics 2019, 9, 381; [DOI] [PMC free article] [PubMed] [Google Scholar]; c) Yan Y, Laine RM, Liu H, Chempluschem 2019, 84, 1630; [DOI] [PubMed] [Google Scholar]; d) Li DH, Schreiber CL, Smith BD, Angew Chem Int Ed Engl 2020, 59, 12154. [DOI] [PMC free article] [PubMed] [Google Scholar]
- [12].a) Zhu S, Hu Z, Tian R, Yung BC, Yang Q, Zhao S, Kiesewetter DO, Niu G, Sun H, Antaris AL, Chen X, Adv Mater 2018, 10.1002/adma.201802546, e1802546; [DOI] [PubMed] [Google Scholar]; b) Tian R, Zeng Q, Zhu S, Lau J, Chandra S, Ertsey R, Hettie KS, Teraphongphom T, Hu Z, Niu G, Kiesewetter DO, Sun H, Zhang X, Antaris AL, Brooks BR, Chen X, Sci Adv 2019, 5, eaaw0672; [DOI] [PMC free article] [PubMed] [Google Scholar]; c) Starosolski Z, Bhavane R, Ghaghada KB, Vasudevan SA, Kaay A, Annapragada A, PLoS One 2017, 12, e0187563; [DOI] [PMC free article] [PubMed] [Google Scholar]; d) Bhavane R, Starosolski Z, Stupin I, Ghaghada KB, Annapragada A, Sci Rep 2018, 8, 14455; [DOI] [PMC free article] [PubMed] [Google Scholar]; e) Carr JA, Franke D, Caram JR, Perkinson CF, Saif M, Askoxylakis V, Datta M, Fukumura D, Jain RK, Bawendi MG, Bruns OT, Proc Natl Acad Sci U S A 2018, 115, 4465. [DOI] [PMC free article] [PubMed] [Google Scholar]
- [13].a) Jo D, Hyun H, Chonnam Med J 2017, 53, 95; [DOI] [PMC free article] [PubMed] [Google Scholar]; b) Hyun H, Park MH, Owens EA, Wada H, Henary M, Handgraaf HJ, Vahrmeijer AL, Frangioni JV, Choi HS, Nature medicine 2015, 21, 192. [DOI] [PMC free article] [PubMed] [Google Scholar]
- [14].a) Luo S, Tan X, Fang S, Wang Y, Liu T, Wang X, Yuan Y, Sun H, Qi Q, Shi C, Advanced Functional Materials 2016, 26, 2826; [Google Scholar]; b) He S, Li J, Lyu Y, Huang J, Pu K, J Am Chem Soc 2020, 142, 7075. [DOI] [PubMed] [Google Scholar]
- [15].Tan X, Luo S, Wang D, Su Y, Cheng T, Shi C, Biomaterials 2012, 33, 2230. [DOI] [PubMed] [Google Scholar]
- [16].a) Tan X, Luo S, Long L, Wang Y, Wang D, Fang S, Ouyang Q, Su Y, Cheng T, Shi C, Adv Mater 2017, 29; [DOI] [PubMed] [Google Scholar]; b) Wang Y, Luo S, Zhang C, Liao X, Liu T, Jiang Z, Liu D, Tan X, Long L, Wang Y, Chen Z, Liu Y, Yang F, Gan Y, Shi C, Adv Mater 2018, 10.1002/adma.201800475, e1800475; [DOI] [PubMed] [Google Scholar]; c) Wang Y, Liao X, Sun J, Yi B, Luo S, Liu T, Tan X, Liu D, Chen Z, Wang X, Shi C, Adv Sci (Weinh) 2018, 5, 1700392. [DOI] [PMC free article] [PubMed] [Google Scholar]
- [17].a) Kang H, Rho S, Stiles WR, Hu S, Baek Y, Hwang DW, Kashiwagi S, Kim MS, Choi HS, Advanced Healthcare Materials 2020, 9, 1901223; [DOI] [PMC free article] [PubMed] [Google Scholar]; b) Usama SM, Park GK, Nomura S, Baek Y, Choi HS, Burgess K, Bioconjug Chem 2020, 31, 248; [DOI] [PMC free article] [PubMed] [Google Scholar]; c) Usama SM, Lin CM, Burgess K, Bioconjug Chem 2018, 29, 3886; [DOI] [PubMed] [Google Scholar]; d) Thavornpradit S, Usama SM, Park GK, Shrestha JP, Nomura S, Baek Y, Choi HS, Burgess K, Theranostics 2019, 9, 2856. [DOI] [PMC free article] [PubMed] [Google Scholar]
- [18].Lee JH, Park G, Hong GH, Choi J, Choi HS, Quantitative Imaging in Medicine and Surgery 2012, 2, 266. [DOI] [PMC free article] [PubMed] [Google Scholar]
- [19].James NS, Chen Y, Joshi P, Ohulchanskyy TY, Ethirajan M, Henary M, Strekowsk L, Pandey RK, Theranostics 2013, 3, 692. [DOI] [PMC free article] [PubMed] [Google Scholar]
- [20].a) Roth M, Obaidat A, Hagenbuch B, British Journal of Pharmacology 2012, 165, 1260; [DOI] [PMC free article] [PubMed] [Google Scholar]; b) Zhang E, Luo S, Tan X, Shi C, Biomaterials 2014, 35, 771. [DOI] [PubMed] [Google Scholar]
- [21].Rennick JJ, Johnston APR, Parton RG, Nat Nanotechnol 2021, 16, 266. [DOI] [PubMed] [Google Scholar]
- [22].Casamento A, Boucrot E, Biochemical Journal 2020, 477, 2327. [DOI] [PMC free article] [PubMed] [Google Scholar]
Associated Data
This section collects any data citations, data availability statements, or supplementary materials included in this article.


