Abstract
An ultrasensitive label-free electrochemical immunosensor was developed for hepatitis C antibodies (anti-HCV). Worldwide, it is estimated 71 million people have HCV infection in a chronic stage that may lead to cirrose and cancer. To achieve HCV elimination, health programs should include screening testing based on anti-HCV detection allowing the early-stage treatment. The immunosensor was based on a graphene oxide-polypyrrole (PPy–GO) film one-step electropolymerized on the electrode surface. Ultrasensitive anti-HCV detection was ensured by HCV antigen conjugated to biotin that was immobilized in a great amount on streptavidin-coated nanostructured surface. Analytical responses were obtained by anodic peaks from the square wave voltammetry in the presence of ferrocyanide/ferricyanide as a redox probe. This immunosensor exhibited a linear range from 2 to 14 ng mL−1 of anti-HCV and a limit of detection in the clinical range (1.63 ng mL−1). Furthermore, the immunosensor presented an efficient performance for the determination of anti-HCV in spiked serum samples, becoming this developed nanosensor as potential tools for early HCV diagnosis and screening.
Supplementary Information
The online version contains supplementary material available at 10.1007/s10853-022-06992-5.
Introduction
Hepatitis C is a silent viral infection that can result in significant liver damage leading to, in most cases, liver cirrhosis and hepatocellular carcinoma [1]. Many of the individuals carrying the virus are unaware that they are, therefore they are immediately potential virus transmitters. According to the World Health Organization (WHO), approximately 3% worldwide are infected by hepatitis C virus (HCV), and it is annually estimated 3–4 million new infections and at least 150 million chronic carriers. Recently, the COVID-19 outbreak has increased even more mortality by HCV complications [2], even though the discovery of potent antivirals has considerably increased the chances of cure [3]. WHO plans to eradicate HCV by 2030 [4]. To achieve this goal requires the creation of more treatment programs and efficient screening tests for a rapid and accurate diagnostic. The first choice for HCV diagnostic is the detection of anti-HCV antibodies and sequentially research of the viral genome in serum or plasma samples by PCR testing, in order to confirm the HCV infection [5, 6]. Nowadays, enzyme-linked immunosorbent (ELISA) and electrochemiluminescence assays have been employed for anti-HCV detection in hospitals [7, 8]. Otherwise, lateral-flow immunochromatographic tests have been used as point-of-care for HCV with detection in blood or oral fluids, however, these methods are restricted to positive or negative results and have shown a low sensitivity [9]. Recently, new possibilities for the development of point-of-care immunosensors have been successfully described, with the advantage of being a quantitative method [10]. A remarkable advance in the sensitivity of electrochemical immunosensors has been achieved with carbon nanomaterials due to the increase in electron transfer rate and higher amount of immobilized biomolecules [11–13]. Graphene has been shown as an attractive nanomaterial for electrochemical immunosensors due to its facile synthesis, high surface area, and excellent biocompatibility.
Graphene oxide (GO) is usually derived from natural graphite by different processes, including exfoliation and chemical synthesis. In this oxidative state, sheets of GO have a good dispersion in water as a consequence of a highly oxidized structure with a large number of oxygen containing functional groups, such as alkoxy, epoxy, carbonyl, and carboxyl groups, serving as attractive for immobilization of biomolecules [14, 15]. However, this oxidative state implies a moderate conductivity attributed to the disruption of the sp2 bonding by functional groups [16]. An alternative to improve the GO electrical conduction is its incorporation in conductive polymers, resulting in highly conductive nanocomposites [17, 18].
The use of GO associated with conductive polymers in a supramolecular assembly has shown a significant increase in electrical conductivity and chemical stability [19, 20]. Polypyrrole (PPy) is one of the most widely used conductive polymer films in electronic devices due to its high charge storage capacity, besides good dispersion and easy synthesis [21, 22]. PPy–GO presents attractive electrochemical properties and cycling performance becoming promising in the manufacturing of supercapacitors and high-performance electrochemical sensors [23, 24]. Synergism between PPy and GO can be assigned to the π bond of the pyrrole ring attaching to the GO surface by π–π interaction. In brief, the PPy acts as a spacer connecting graphene sheets and conductive bridges to avoid re-stacking of graphene sheets [25].
PPy–GO nanocomposite can be obtained by traditional bulk polymerization; nevertheless, electrochemical synthesis is a more attractive method mainly due to its ability to control the thickness, chain size, and stability of nanocomposite formed [22, 26]. Cyclic voltammetry (CV) is an electrochemical technique for in situ electrosynthesis PPy–GO that allows easier adherence to the electrode surface. Conducting proprieties can be controlled by changing the potential applied, current density, and the number of cycles of the CV [25, 27].
In this study, a conductive nanocomposite film PPy–GO was assembled by one-step electrosynthesis in a glassy-carbon electrode. The strong affinity of the avidin–biotin guaranteed the immobilization of the biotinylated HCV antigens on the PPy–GO modified electrode, and 4:1 favorable stoichiometric ratio of biotin-streptavidin [28], permitting a more significant amount of the HCV antigen biotinylated immobilized. This combination of an efficient immobilization yield and the synergism achieved due to a highly conductive thin film resulted in a successful immunosensor for the ultrasensitive detection of anti-HCV antibodies in spiked samples. The detection of the anti-HCV antibodies is very essential in the transfusion services, since once infected with HCV virus, the individual presents the biomarker for all life. The developed immunosensor was able for detecting in clinical range of anti-HCV, being comparable to conventional methods.
Materials and methods
Reagents
Py monomers (98%, v/v), GO in aqueous solution (0.2 µg mL−1), Streptavidin (STV), glycine, potassium ferrocyanide (K4Fe(CN)6), potassium ferricyanide (K3Fe(CN)6), N-hydroxysuccinimide (NHS), and N-ethyl-N′-(3-dimethylami-nopropyl) carbodiimide (EDC) were obtained from Merck (St. Louis, USTV). The biotinylated HCV core antigen (HCVcAg) and monoclonal human anti-HCV were purchased from Abcam (Cambridge, UK). All chemicals used in the study were of analytical reagent grade purity. The ultrapure water was obtained from a water purification system Milli-Q (Billerica, USA) (18 MΩ) was used to prepare all solutions.
Anti-HCV spiked, and non-spiked serum samples were diluted in 0.01 mmol L−1 phosphate-buffered saline (pH 7.4). Serum samples were collected from healthy individuals, asymptomatics that were certificated non-Anti-HCV by the automatic Elecsys 2010 Immunoassay Analyzer (Roche Diagnostics). Venous blood was collected from twelve volunteers, according to the ethic committee recommendations and informed consent, protocol number 63441516.6.0000.5190 approved by the Aggeu Magalhes Human Research committee, Brazil.
Experimental apparatus and measurements
The electrochemical measurements were carried out in an Autolab PGSTAT12 potentiostat (Eco Chemie, The Netherlands) interfaced to PC system and controlled by Autolab software NOVA (2.1.2). It was used a three-electrode system, consisting of a glassy-carbon electrode (GCE) (Ø = 3 mm) as a working electrode, a helical platinum wire as a counter electrode, and Ag/AgCl(saturated KCl) as a reference electrode. The measurements were taken at room temperature (~ 23 °C).
Cyclic voltammetry measurements were taken for electrode characterization, with a potential ranging from − 0.2 to + 0.6 V with 80 mV s−1 of scan rate. For analytical curves and stepwise preparation of the immunoelectrode, the square wave voltammetry (SWV) technique was performed varying the potential window from 0.0 to + 0.5 V, frequence of 10 Hz, amplitude of 100 mV, and step potential of 2.5 mV. All electrochemical measurements were recorded in presence of the 0.005 mol L−1 of K3Fe(CN)6/K4Fe(CN)6 prepared in 0.1 mol L−1 KCl as a redox probe. Current variation (∆Ip) were measured after the sample incubations from the height of the anodic current peaks of SWV curves subtracting from blank (before the sample incubation).
The structural characterization was accomplished with Fourier Transform Infrared in the Attenuated Total Reflectance mode (FTIR–ATR) by using the Bruker IFS 66 model FTIR spectrometer (Billerica, USA). Spectra were acquired at 4000–500 cm−1.
Scanning electron microscopy (SEM) assays were performed in the Scanning Electron Microscope JEOL—JSM 5600LV. A glassy-carbon disk (~ 0.5 cm diameter) was adapted in an electrochemical cell home-made with a reduced volume (0.8 mL) and the nanocomposite PPy–GO was electrosynthetized.
Preparation of the PPy–GO nanoelectrode
Before modification, the GCE was polished with alumina powder (1 and 0.5 mm) for 3 min with a polishing cloth until obtaining a mirror-like surface. The electrode was carefully rinsed with anhydrous ethanol and ultrapure water sequentially to remove any residual impurities. Then, the GCE was immersed in a mixed solution of the Py monomers (0.3 mmol L−1) and GO (0.2 mg mL−1) and subjected to an electropolymerization procedure in the presence of 0.3 mmol L−1 sulfuric acid [22]. It was performed in a single one-step of synthesis by using the cyclic voltammetry technique, a potential window between − 0.8 and + 0.8 V, 20 cycles at 20 mV s−1 of scan rate.
HCV antigen immobilization
The carboxyl groups derived from GO nanocomposite on the modified GCE were activated using a mixture of 0.02 mol L−1 EDC and 0.05 mol L−1 NHS aqueous solution, incubating for 1 h at room temperature. Afterward, an aliquot of 5 µL of the STV PBS diluted (10 µg mL−1) was pipetted on the electrode surface and left to react for 1 h in a moist chamber, followed by two washes with PBS. Then, the biotinylated antigen (HCVcAg) was immobilized based on the biotin-streptavidin affinity by incubating an aliquot (5 µL) of the HCVcAg (100 µg mL−1) at pH 7.4 for 1 h at room temperature. Next, non-specific bindings were blocked with a glycine solution (0.05 mol L−1) incubating for 40 min at room temperature. When not in use, the HCVcAg electrodes were stored at 8 °C in a moist chamber.
Results and discussion
Characterization of the PPy–GO film on the GCE
Cyclic voltammetry (CV) is a powerful electrochemical technique to study electron transfer kinetics of an electroactive species in solution and mechanisms of redox reactions in immunosensor development. It is possible to analyze PPy–GO nanocomposite and the role of each component regarding the conductivity and electron transfer. According to Fig. 1a, after GO layer assembling by dropcasting (curve II), an increase in current was observed compared to the bare electrode (curve I). This discrete increase can be attributed to the disruption of sp2 bonds derived from functional groups like carboxyl and epoxy that impact the electron transfer of the GO [16, 29]. After the Py monomers were electropolymerized on the electrode surface (curve III), a significant increase in the electroactive area was observed compared to the bare electrode (curve I). Several factors can result in changes in the conductivity of PPy film, which primarily depend on the anion charge introduced in synthesis. Herein, the PPY was synthesized in sulfuric acid, resulting in highly porous film, which contributed to the electron transfer, also derived from the high number of electrons forming a long chain of the PPy [30].
Figure 1.
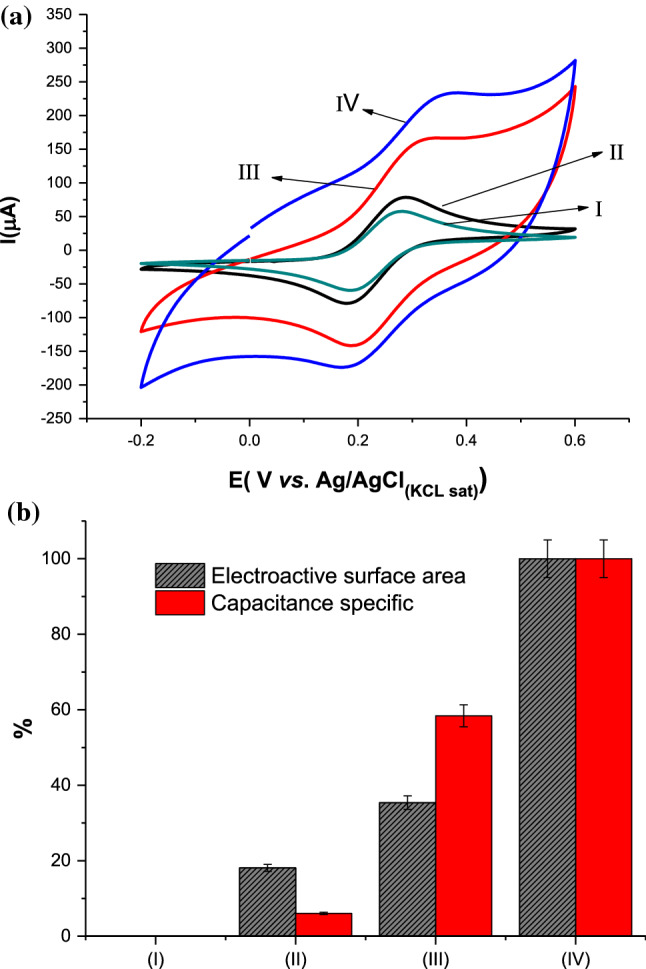
a Typical CVs measured at 80 mV s−1, and b Bar plot of the electroactive areas and Capacitance specific (means of three replicates): (I) Bare GCE; (II) GO/GCE; (III) PPy/GCE, and (IV) PPy–GO/GCE. Bar error represents the standard deviations of three replicates. All measurements were performed in 0.005 mol L−1 of K3Fe(CN)6/K4Fe(CN)6 prepared in 0.1 mol L−1 KCl as redox probe
Additionally, the PPy synthesis occurred below 0.8 V, avoiding over-oxidation and preserving the doping and de-doping process in the PPy explained by the redox peaks' excellent reversibility. This study allowed the choice of parameters for PPy–GO, obtaining a good performance as shown in Curve IV. An increase in area to the CV compared to the PPY/GCE (curve III) was observed, suggesting that the formation of the nanocomposite occurred with capacitive characteristics. This increase can be attributed to the capacitance that originates from the double-layer capacitance of graphene and the pseudocapacitance of PPy derived from over-oxidation. Given the large aspect ratio and surface area of the GO sheets, they may serve as effective percolate conducting bridges, thereby increasing the conductivity of the composite. In this process, the relatively large anionic GO acts as a weak electrolyte and is entrapped in the nanocomposite during the electropolymerization of pyrrole, serving as an effective charge-balancing dopant within the PPy film [31].
Using the CV is also possible to determine the electroactive surface area that contributes to the diffusion process [32]. Calculation of the active surface area of the electrode is carried out through the equation of Randles–Sevcik (Eq. 1):
| 1 |
where Ip is the current peak; n is the number of electrons involved; A is the electroactive area/cm2; Do is diffusion coefficient of the [K3Fe(CN)6] (7.70 × 10⁻⁶ cm2 s−1); [Ox] is the concentration of the K3[Fe(CN)6] (0.005 mol L−1); and ν is the scan rate in V s−1. In Fig. 1b is shown the bar graph of the electroactive surface area of each compound employed in the PPy–GO synthesis.
Comparing the obtained area by the GO and PPy, the nanocomposite of the PPy–GO obtained an increase of 88.2% and 35.3%, respectively, in the electroactive surface area, indicating the ease of electronic transfer and porous nanomaterial.
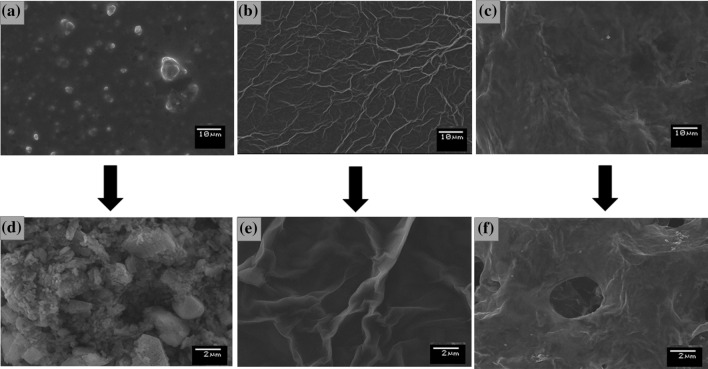
The SEM micrographs were employed to evaluate the morphology of the nanocomposite PPy–GO on the electrode surface. In Fig. 2a, d, the micrograph of the Ppy showed granular structures characteristic of the PPy. In Fig. 2b, e, the SEM of the GO shows the superposition of the graphene sheets. The alignment of the GO is probably due to the van der Waals interaction between GO sheets and electrode surface [33]. In Fig. 2c, f the micrograph formed by the PPy–GO showed that the nanocomposite was successfully obtained, since the PPy and GO structures can not be observed individually probably due to the forming of the nanocomposite [34]. According to the micrography, PPy and GO were integrated by forming a porous surface, probably due to the simultaneous co-electrodeposition of these two structures, by applying the cyclic voltammetry procedure. It is believed that two-dimensional GO nanosheets were interconnected through the PPy, which own a high charge storage capacity. Hence, the GO improves the electron transfer resulting in the synergic effect of electrochemical proprieties.
Figure 2.
SEM images of the PPy (a, d); GO (b, e); PPy–GO (c, f)
The electron diffusion study of the PPy–GO/GCE was investigated, subjecting the electrode to different scan rates. As observed in Fig. S1, CVs were registered in presence of redox probe solution of K3[Fe(CN)6]/K4[Fe(CN)6] (0.005 mol L−1), exhibiting a proportional and linear increase in both cathodic and anodic current peaks (Ipa and Ipc, respectively), according to the scan rate (10–150 mV s−1). Ipa and Ipc peaks were directly proportional to the square root of scan rates (Fig. S1, inset) with the following linear regression equations: Ipa (µA) = 29,823 ν (V s−1)–37,537 (r = 0.99) and Ipc (µA) = –26,567 ν (V s−1) + 22,477 (r = 0.99), suggesting a controlled diffusion process [32].
The film stability of the PPy–GO/GCE film was evaluated through 20 successive CVs performed in a potential window varying from − 0.2 to 0.6 V, at 50 mVs−1 of scan rate. According to Fig. S2, the amplitude of redox peaks was practically constant during all scanning. The coefficient of variation was 0.75% for the anodic and cathodic peaks, indicating high stability of the PPy–GO/GCE film. It can be attributed to the π–π interactions between pyrrole and GO [35].
Structural characterization of the PPy–GO by FTIR–ATR
FTIR–ATR is a good technique for studying the surface properties since that allows an infrared beam penetration in the depth around 0.5–3 µm, depending on the ATR crystal material. Here, it was used the Ge crystal, in which the evanescent wave penetrates ~ 0.65 µm at the surface. Analyses of the FTIR–ATR spectrum confirmed the presence of PPy and GO as a nanocomposite, according to Fig. 3. In curves I and II, the peaks at 1159 cm–1 847 cm–1 were attributed to C–H wagging, respectively [36, 37]. It was also observed, in curve I, the characteristic peak at 1635 cm–1, representing the C=N bonds of PPy [19]. Additionally, small peaks at 3400 cm–1 corresponds to the N–H stretching vibrations of PPy, these peaks were also previously described for PPy [25, 26]. In curves II e III, peaks at 3466 cm−1 and 3418 cm−1 were, respectively, attributed to O–H stretching vibrations of GO [36, 37]. The peak at 1652 cm–1 and 1151 cm–1 were attributed to C=O and C–O stretching, respectively, also indicating the GO presence. It was assigned to C−H and C−C backbone stretching of PPy, the peak at 626 cm−1 (curve III), as probable indicative that the PPy was successfully polymerized on the GO.
Figure 3.
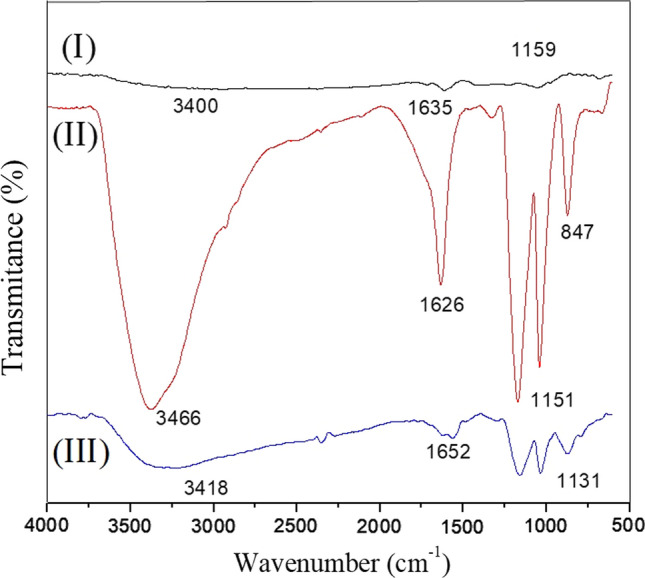
ATR FTIR spectra of the (I) GO; (II) PPy, (III) PPy–GO
Immobilization of the HCVc antigen and immunoassay
The immobilization of the biotinylated HCV core antigen was obtained by the STV layer on the PPy–GO film. First, STV was covalently linked to the GO sheets present in the nanocomposite through activation by EDC/NHS chemical forming amide bonds [38]. EDC interacts with the carboxyl groups for the formation of reactive esters. However, the attack of the amine on this intermediate complex may become slow and hydrolyze in aqueous solutions. In this way, it is necessary the assistance of the NHS for the formation of more reactive esters and prone to the formation of stable amide bonds [39]. After chemical activation with EDC/NHS, the STV was immobilized varying the concentration from 10 to 50 µg mL−1. According to Fig. S3(a), a proportional increase in the peak currents of the CV with an increase in the STV concentration was observed, reaching a plateau at 50 µg L−1. Since the highest concentration of STV evaluated presented the most intense current response without any interference in the immunosensor performance, the concentration of 50 µg L−1 of STV was used in the further studies.
Streptavidin–biotin strategy to conjugate biomolecules has been used in several immunosensors [28, 40]. These proteins provide a high affinity constant, being the strongest noncovalent biological interaction known with a dissociation constant (Kd) in femtomolar order [41]. Besides, the stoichiometry of streptavidin–biotin is favorable; only using one molecule of avidin, four biotinylated molecules can be strongly attached to the sensor surface, increasing its sensitivity. Taking into account that the biomolecule immobilization step is crucial for immunosensor performance, the maximal concentration of STV was investigated in this study, in attempting to reach the more amount of the HCVcAg immobilized. The maximal concentration of STV was reached at 100 µg mL−1, according to the plateau of the curve shown in Fig. S3(b).
Figure 4 exhibits the electrochemical characterization of the immunosensor in each step of preparation through the square wave voltammetry (SWV) technique. An increase in anodic peak in curve II was observed compared with curve I (bare GCE); this increase means that the conductive PPy–GO film was successfully electropolymerized on the electrode surface. The insulating nature of biomolecules induces a hindering on the electron transfer to the electrolyte from the electrode surface [42]. Herein, it is observed in Curve III a decrease in the anodic peak by the STV linkage to the PPy–GO/GCE. Likewise, biotinylated HCVcAg was effectively bound to the STV due to decreased anodic peak (Curve IV). It was observed that the decrease in anodic peak by HCVcAg is too much less than due to the STV, probably indicating more amount of immobilized protein in this step as a resulting 1:4 stoichiometric relation between STV-biotinylated HCVcAg. In the immunoassay tests is critical to block the non-specific binding since they can produce false-positive results, reducing the specificity. Glycine is the minor amino acid found; it has been widely used in immunosensors [43–45]; primarily due to the reduced molecular weight with advantaging of does not perturb the electron transfer on the sensing surface and reducing the sensitivity by steric hindering. Hence, the decrease in the anodic peak indicated the glycine present as a blocking agent (Curve V).
Figure 4.
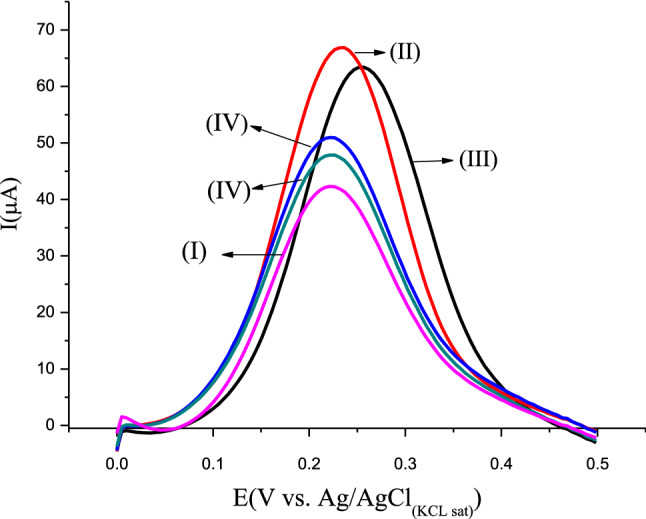
SWV curves in each step of the immunosensor preparation (I) Bare GCE, (II) PPy–GO/GCE, (III) STV/PPy–GO/GCE, (IV) HCVcAg/STV/PPy–GO/GCE, (V) Glycine/HCVcAg/STV/PPy–GO/GCE
Analytical response to the immunosensor
Analytical curves were obtained by incubating the sensor electrode with an aliquot (5 µL) of the anti-HCV for 30 min at room temperature, in a moist chamber to avoid evaporation before immunocomplex formation. This incubation time was optimal for maximal antigen–antibody interactions and was agreed with previous studies [46]. SWV curves in Fig. 5 showed a decrease in the height of anodic peaks with an increase in anti-HCV concentrations. According to inset, a linear straight linear of the relative current responses (ΔI%) was obtained varying anti-HCV concentrations from 2 to 14 ng mL−1. Data were processed in Origin software adjusted by linear regression equation I(µA) = 5.17 [anti-HCV](IU) + 19.89, showed a correlation coefficient of 0.981 (p < 0.01). The limit of detection was 1.63 ng mL−1 obtained according to the IUPAC (LOD = 3 sd/slope). Herein, the LOD obtained allowed measurements in the clinical range of the HCV diagnoses.
Figure 5.
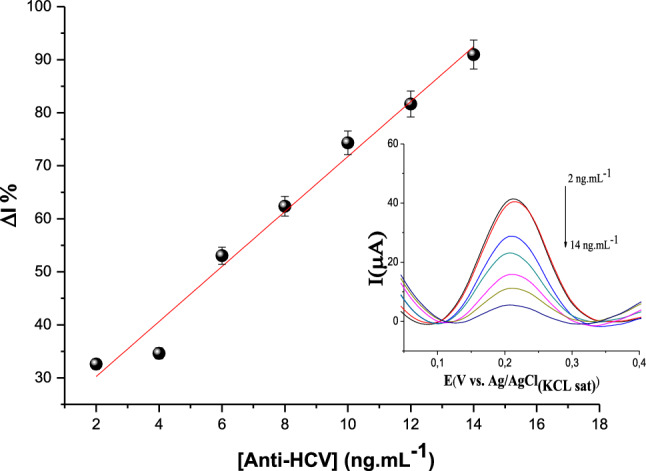
Analytical response of the immunosensor to the anti-HCV (from 2 to 14 ng mL−1) obtained by SWV. All the measurements were performed in K3Fe (CN)6/K4Fe(CN)6 (0.005 mol L−1) prepared in KCl solution (0.1 mol L−1). Inset: SWV curves decreasing the current peaks with increase in the anti-HCV concentrations
Repeatibility and reproducibility and real samples analysis
Reproducibility and repeatability studies were performed to evaluate the robustness and precision of the immunosensor. Repeatability was obtained by analyzing five successive measurements after incubating the electrode with the same sample serum spiked with anti-HCV (5 ng mL−1), running an interval of 10 min for each one, which the coefficient of variation (CV) was found at 5.5% for anodic peaks. Reproducibility was assessed by measuring the immunosensor responses to the anti-HCV spiked serum samples in five different electrodes, resulting in a CV < 5%. These results indicated a good performance of immunosensor in measurements of intra- and inter-assay, respectively.
Selectivity studies were performed subjecting this immunosensor to the Anti-HCV spiked serum samples that contain several interferents. The sensor surface was incubated with an aliquot of 5 µL of serum for 30 min at room temperature, in a moist chamber to preserve the sample against evaporation due to the low volume. Anodic peaks of SWV measurements were obtained in the presence of the redox probe of 5 mM K3[Fe(CN)6]/K4[Fe(CN)6] prepared in 0.1 KCl. According to Fig. 6, observed that the difference of peak currents from the blank gradually increased with the anti-HCV concentration of spiked serum, contrary to the unspiked serum that has been kept practically constant the current. Under optimal conditions, the cutoff value was established at 2.4 ng mL−1, showing a limit of reaction acetable for real samples. It means that the blocking agent was effective and contributed to distinguishing the anti-HCV in a complex medium/matrix, containing several proteins, lipids, cells, debris, and other contaminants.
Figure 6.
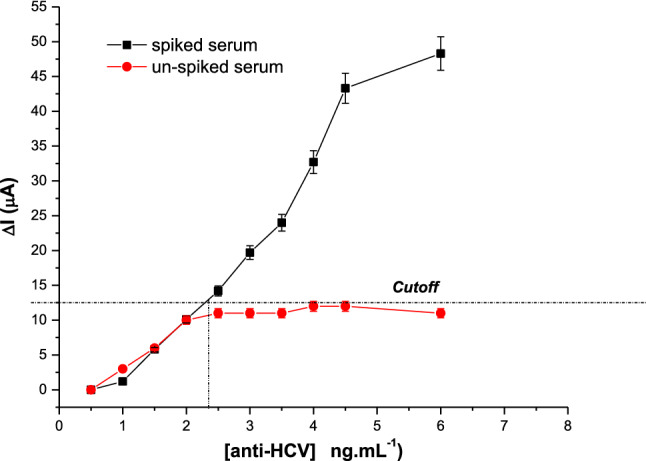
Analytical responses of the immunosensor to the anti-HCV spiked (positive) and unspiked (negative) serum, under optimal experimental conditions
There are many immunosensors for detecting the antigens in an attempt to diagnose HCV acute infection. So far, few works are dedicated to anti-HCV, although antibody detection is considered the first-choice biomarker for HCV screening since it indicates that individuals were infected once by the virus in their life [6]. Here, the LOD found was similar to the Electrochemiluminescence method-ECLIA (1.0 ng mL−1), being lower than before described for immunosensors (Table S1), besides significant improvements with advantages of being a label-free immunosensor. Considering the limit of reaction to interferents, the cutoff value found showed that the immunosensor developed is superior in terms of reported immunosensors, as well as in terms of linear response range (Table S1). Furthermore, the immunosensor allows the detection of antibodies anti-HCV in serum compatible with the clinical range of response.
Conclusions
A label-free immunosensor was successfully developed to detect HCV antibodies in clinical range levels. The high performance seems probable due to the PPy–GO synergism that enabled a high conductivity of nanocomposite. Moreover, the avidin–biotin strategy to immobilize HCVc, leading to many immobilized biomolecules antigens, resulted in a stable and sensitive platform for the HCV diagnostic. Anti-HCV is a valuable marker the HCV screening since it indicates prior contact with the virus at any time in life.
Supplementary Information
Below is the link to the electronic supplementary material.
Acknowledgements
The authors gratefully acknowledge the financial support of the Brazilian National Council for Scientific and Technological Development of Brazil, grant number 440605/2016-4 and the CAPES—Coordination for the Improvement of Higher Education Personnel, Brazil (Grant number 88881.130797/2016-01), and National Institute of Science and Technology in Bioanalytics (INCTBio).
Declarations
Conflict of interest
All authors declare that they have no conflict of interest.
Footnotes
Publisher's Note
Springer Nature remains neutral with regard to jurisdictional claims in published maps and institutional affiliations.
References
- 1.Valva P, Ríos DA, De Matteo E, Preciado MV. Chronic hepatitis C virus infection: serum biomarkers in predicting liver damage. World J Gastroenterol. 2016;22:1367–1381. doi: 10.3748/wjg.v22.i4.1367. [DOI] [PMC free article] [PubMed] [Google Scholar]
- 2.Stasi C, Silvestri C, Voller F. Update on hepatitis C epidemiology: unaware and untreated infected population could be the key to elimination. SN Compr Clin Med. 2020;2:2808–2815. doi: 10.1007/s42399-020-00588-3. [DOI] [PMC free article] [PubMed] [Google Scholar]
- 3.Gómez L, Reygosa C, Morales-Arráez DE, et al. Diagnostic test accuracy of the cobas 6800 system for detection of hepatitis C virus viraemia levels from dried blood spots. Enferm Infecc y Microbiol Clin (English ed) 2020;38:267–274. doi: 10.1016/j.eimce.2020.04.001. [DOI] [PubMed] [Google Scholar]
- 4.Organization WH (2016) Combating hepatitis B and C to reach elimination by 2030 may 2016 advocacy brief
- 5.Karimi G, Zadsar M, Vafaei N, et al. Prevalence of antibody to hepatitis B core antigen and hepatitis B virus DNA in HBsAg negative healthy blood donors. Virol J. 2016;13:36. doi: 10.1186/s12985-016-0492-8. [DOI] [PMC free article] [PubMed] [Google Scholar]
- 6.Kabamba AT, Mwamba CM, Dessilly G, et al. Evaluation of the analytical performance of six rapid diagnostic tests for the detection of viral hepatitis B and C in Lubumbashi, Democratic Republic of Congo. J Virol Methods. 2020 doi: 10.1016/j.jviromet.2020.113961. [DOI] [PubMed] [Google Scholar]
- 7.Villar LM, Cruz HM, Barbosa JR, et al. Update on hepatitis B and C virus diagnosis. World J Virol. 2015;4:323. doi: 10.5501/wjv.v4.i4.323. [DOI] [PMC free article] [PubMed] [Google Scholar]
- 8.Albertoni G, Castelo Girão MJB, Schor N. Mini review: Current molecular methods for the detection and quantification of hepatitis B virus, hepatitis C virus, and human immunodeficiency virus type 1. Int J Infect Dis. 2014;25:145–149. doi: 10.1016/j.ijid.2014.04.007. [DOI] [PubMed] [Google Scholar]
- 9.Chevaliez S, Pawlotsky JM. New virological tools for screening, diagnosis and monitoring of hepatitis B and C in resource-limited settings. J Hepatol. 2018;69:916–926. doi: 10.1016/j.jhep.2018.05.017. [DOI] [PubMed] [Google Scholar]
- 10.Filik H, Avan AA. Nanostructures for nonlabeled and labeled electrochemical immunosensors: simultaneous electrochemical detection of cancer markers: a review. Talanta. 2019;205:120153. doi: 10.1016/j.talanta.2019.120153. [DOI] [PubMed] [Google Scholar]
- 11.Arca-Lafuente S, Martínez-Román P, Mate-Cano I, et al. Nanotechnology: a reality for diagnosis of HCV infectious disease. J Infect. 2020;80:8–15. doi: 10.1016/j.jinf.2019.09.010. [DOI] [PubMed] [Google Scholar]
- 12.Gomes-Filho SLR, Dias ACMS, Silva MMS, et al. A carbon nanotube-based electrochemical immunosensor for cardiac troponin. T Microchem J. 2013;109:10–15. doi: 10.1016/j.microc.2012.05.033. [DOI] [Google Scholar]
- 13.Lara S, Perez-Potti A. Applications of nanomaterials for immunosensing. Biosensors. 2018;8:104. doi: 10.3390/bios8040104. [DOI] [PMC free article] [PubMed] [Google Scholar]
- 14.Österholm A, Lindfors T, Kauppila J, et al. Electrochemical incorporation of graphene oxide into conducting polymer films. Electrochim Acta. 2012;83:463–470. doi: 10.1016/j.electacta.2012.07.121. [DOI] [Google Scholar]
- 15.Chen L, Moon JH, Ma X, et al. High performance graphene oxide nanofiltration membrane prepared by electrospraying for wastewater purification. Carbon N Y. 2018;130:487–494. doi: 10.1016/j.carbon.2018.01.062. [DOI] [Google Scholar]
- 16.Deb A, Vimala R. Natural and synthetic polymer for graphene oxide mediated anticancer drug delivery—a comparative study. Int J Biol Macromol. 2018;107:2320–2333. doi: 10.1016/j.ijbiomac.2017.10.119. [DOI] [PubMed] [Google Scholar]
- 17.Chee WK, Lim HN, Huang NM, Harrison I. Nanocomposites of graphene/polymers: a review. RSC Adv. 2015;5:68014–68051. doi: 10.1039/c5ra07989f. [DOI] [Google Scholar]
- 18.Pourbeyram S, Kheyri P. Graphene/polypyrrole nanofiber prepared by simple one step green method for electrochemical supercapacitors. Synth Met. 2018;238:22–27. doi: 10.1016/j.synthmet.2018.02.002. [DOI] [Google Scholar]
- 19.Ghanbari K, Bonyadi S. An electrochemical sensor based on reduced graphene oxide decorated with polypyrrole nanofibers and zinc oxide-copper oxide p–n junction heterostructures for the simultaneous voltammetric determination of ascorbic acid, dopamine, paracetamol, and tryptophan. New J Chem. 2018;42:8512–8523. doi: 10.1039/c8nj00857d. [DOI] [Google Scholar]
- 20.Ott C, Raicopol MD, Andronescu C, et al. Functionalized polypyrrole/sulfonated graphene nanocomposites: improved biosensing platforms through aryl diazonium electrochemistry. Synth Met. 2018;235:20–28. doi: 10.1016/j.synthmet.2017.11.006. [DOI] [Google Scholar]
- 21.Moozarm Nia P, Meng WP, Lorestani F, et al. Electrodeposition of copper oxide/polypyrrole/reduced graphene oxide as a nonenzymatic glucose biosensor. Sens Actuators B Chem. 2015;209:100–108. doi: 10.1016/j.snb.2014.11.072. [DOI] [Google Scholar]
- 22.Ferreira PAB, de Araujo MCM, Prado CM, et al. An ultrasensitive Cystatin C renal failure immunosensor based on a PPy/CNT electrochemical capacitor grafted on interdigitated electrode. Coll Surf B Biointerfaces. 2020 doi: 10.1016/j.colsurfb.2020.110834. [DOI] [PubMed] [Google Scholar]
- 23.Pratiwi E, Mulyasuryani A, Sabarudin A. Modification of screen printed carbon electrode (SPCE) with polypyrrole (Ppy)–SiO2 for phenol determination. J Pure Appl Chem Res. 2018;7:12–18. doi: 10.21776/ub.jpacr.2018.007.01.364. [DOI] [Google Scholar]
- 24.Dai H, Wang N, Wang D, et al. An electrochemical sensor based on phytic acid functionalized polypyrrole/graphene oxide nanocomposites for simultaneous determination of Cd(II) and Pb(II) Chem Eng J. 2016;299:150–155. doi: 10.1016/j.cej.2016.04.083. [DOI] [Google Scholar]
- 25.Cai Z, Xiong H, Zhu Z, et al. Electrochemical synthesis of graphene/polypyrrole nanotube composites for multifunctional applications. Synth Met. 2017;227:100–105. doi: 10.1016/j.synthmet.2017.03.012. [DOI] [Google Scholar]
- 26.Liu S, Wang J, Zeng J, et al. “Green” electrochemical synthesis of Pt/graphene sheet nanocomposite film and its electrocatalytic property. J Power Sources. 2010;195:4628–4633. doi: 10.1016/j.jpowsour.2010.02.024. [DOI] [Google Scholar]
- 27.Li C, Bai H, Shi G. Conducting polymer nanomaterials: electrosynthesis and applications. Chem Soc Rev. 2009;38:2397–2409. doi: 10.1039/b816681c. [DOI] [PubMed] [Google Scholar]
- 28.Dutra RF, Kubota LT. An SPR immunosensor for human cardiac troponin T using specific binding avidin to biotin at carboxymethyldextran-modified gold chip. Clin Chim Acta. 2007;376:114–120. doi: 10.1016/j.cca.2006.07.029. [DOI] [PubMed] [Google Scholar]
- 29.Dreyer DR, Todd AD, Bielawski CW. Harnessing the chemistry of graphene oxide. Chem Soc Rev. 2014;43:5288–5301. doi: 10.1039/C4CS00060A. [DOI] [PubMed] [Google Scholar]
- 30.Afzal A, Abuilaiwi FA, Habib A, et al. Polypyrrole/carbon nanotube supercapacitors technological advances and challenges. J Power Sources. 2017;352:174–186. doi: 10.1016/j.jpowsour.2017.03.128. [DOI] [Google Scholar]
- 31.Lota K, Lota G, Sierczynska A, Acznik I. Carbon/polypyrrole composites for electrochemical capacitors. Synth Met. 2015;203:44–48. doi: 10.1016/J.SYNTHMET.2015.02.014. [DOI] [Google Scholar]
- 32.Bard AJ, Faulkner LR. Electrochemical methods : fundamentals and applications. New York: Wiley; 2001. [Google Scholar]
- 33.Moosaei R, Sharif M, Ramezannezhad A. Enhancement of tensile, electrical and thermal properties of epoxy nanocomposites through chemical hybridization of polypyrrole and graphene oxide. Polym Test. 2017;60:173–186. doi: 10.1016/j.polymertesting.2017.03.022. [DOI] [Google Scholar]
- 34.Ji J, Yu X, Cheng P, et al. Assembly of polypyrrole-graphene oxide hydrogel nanocomposites and their swelling properties. J Macromol Sci Part B. 2015;54:1122–1131. doi: 10.1080/00222348.2015.1065558. [DOI] [Google Scholar]
- 35.Amarnath CA, Hong CE, Kim NH, et al. Efficient synthesis of graphene sheets using pyrrole as a reducing agent. Carbon N Y. 2011 doi: 10.1016/j.carbon.2011.04.048. [DOI] [Google Scholar]
- 36.Bora C, Dolui SK. Fabrication of polypyrrole/graphene oxide nanocomposites by liquid/liquid interfacial polymerization and evaluation of their optical, electrical and electrochemical properties. Polymer (Guildf) 2012;53:923–932. doi: 10.1016/j.polymer.2011.12.054. [DOI] [Google Scholar]
- 37.Zhu C, Zhai J, Wen D, Dong S. Graphene oxide/polypyrrole nanocomposites: one-step electrochemical doping, coating and synergistic effect for energy storage. J Mater Chem. 2012;22:6300–6306. doi: 10.1039/c2jm16699b. [DOI] [Google Scholar]
- 38.Ferreira PAB, Araujo MCM, Prado CM, et al. An ultrasensitive Cystatin C renal failure immunosensor based on a PPy/CNT electrochemical capacitor grafted on interdigitated electrode. Coll Surf B Biointerfaces. 2020 doi: 10.1016/j.colsurfb.2020.110834. [DOI] [PubMed] [Google Scholar]
- 39.Guler Z, Sarac AS. Electrochemical impedance and spectroscopy study of the EDC/NHS activation of the carboxyl groups on poly(ε-caprolactone)/poly(m-anthranilic acid) nanofibers. Express Polym Lett. 2016;10:96–110. doi: 10.3144/expresspolymlett.2016.11. [DOI] [Google Scholar]
- 40.Singh R, Sharma A, Hong S, Jang J. Electrical immunosensor based on dielectrophoretically-deposited carbon nanotubes for detection of influenza virus H1N1. Analyst. 2014;139:5415–5421. doi: 10.1039/c4an01335b. [DOI] [PubMed] [Google Scholar]
- 41.Bansal N, Zheng Z, Song LF, et al. The role of the active site flap in streptavidin/biotin complex formation. J Am Chem Soc. 2018;140:5434–5446. doi: 10.1021/jacs.8b00743. [DOI] [PubMed] [Google Scholar]
- 42.Silva MMS, Dias ACMS, Cordeiro MT, et al. A thiophene-modified screen printed electrode for detection of dengue virus NS1 protein. Talanta. 2014;128:505–510. doi: 10.1016/j.talanta.2014.06.009. [DOI] [PubMed] [Google Scholar]
- 43.Hartati YW, Nurmalasari R, Gaffar S, Subroto T. B-type natriuretic peptide (BNP) detection using electrochemical immunosensor based on Sandwich ELISA with horseradish peroxidase-tetramethylbenzidine system. Proced Technol. 2017;27:149–150. doi: 10.1016/j.protcy.2017.04.065. [DOI] [Google Scholar]
- 44.Martín M, Salazar P, Jiménez C, et al. Rapid Legionella pneumophila determination based on a disposable core–shell Fe3O4 @poly(dopamine) magnetic nanoparticles immunoplatform. Anal Chim Acta. 2015;887:51–58. doi: 10.1016/j.aca.2015.05.048. [DOI] [PubMed] [Google Scholar]
- 45.Ramos-Jesus J, Pontes-de-Carvalho LC, Melo SMB, et al. A gold nanoparticle piezoelectric immunosensor using a recombinant antigen for detecting Leishmania infantum antibodies in canine serum. Biochem Eng J. 2016;110:43–50. doi: 10.1016/j.bej.2016.01.027. [DOI] [Google Scholar]
- 46.Cabral DGA, Lima ECS, Moura P, Dutra RF. A label-free electrochemical immunosensor for hepatitis B based on hyaluronic acid–carbon nanotube hybrid film. Talanta. 2016;148:209–215. doi: 10.1016/j.talanta.2015.10.083. [DOI] [PubMed] [Google Scholar]
Associated Data
This section collects any data citations, data availability statements, or supplementary materials included in this article.


