Abstract
For salinity stress tolerance in plants, the vacuolar type H+-ATPase (V-ATPase) is of prime importance in energizing sodium sequestration into the central vacuole and it is known to respond to salt stress with increased expression and enzyme activity. In this work we provide information that the expressional response to salinity of the V-ATPase is regulated tissue and cell specifically under developmental control in the facultative halophyte common ice plant (Mesembryanthemum crystallinum). By transcript analysis of subunit E of the V-ATPase, amounts did not change in response to salinity stress in juvenile plants that are not salt-tolerant. In a converse manner, in halotolerant mature plants the transcript levels increased in leaves, but not in roots when salt stressed for 72 h. By in situ hybridizations and immunocytological protein analysis, subunit E was shown to be synthesized in all cell types. During salt stress, signal intensity declined in root cortex cells and in the cells of the root vascular cylinder. In salt-stressed leaves of mature plants, the strongest signals were localized surrounding the vasculature. Within control cells and with highest abundance in mesophyll cells of salt-treated leaves, accumulation of subunit E protein was observed in the cytoplasm, indicating its presence not only in the tonoplast, but also in other endoplasmic compartments.
The facultative halophyte common ice plant (Mesembryanthemum crystallinum L. Aizoaceae) has become a model plant for studying salinity stress responses at physiological, biochemical, and gene levels. Mechanisms involved in adaptation to salinity stress in the common ice plant include metabolic transition from C3 to crassulacean acid metabolism (CAM), synthesis and cytoplasmic accumulation of osmoprotective metabolites, and accumulation of sodium in the vacuolar compartment (Adams et al., 1998). The salt-inducible shift from C3 to the more water conserving CAM metabolism involves transcriptional induction of CAM-specific genes as the phosphoenolpyruvate carboxylase isogene Ppc1 (Cushman and Bohnert, 1997). Increased synthesis of osmoprotectants d-ononitol, d-pinitol, and of Pro in response to salinity allows osmotic adjustment of the cytoplasm by balancing the increased osmotic potential caused by sodium sequestration inside the vacuole (Adams et al., 1998). Stress-induced synthesis of compatible solutes is transcriptionally activated as shown for the myo-inositol O-methyl transferase Imt1 in the biosynthetic pathway of the osmoprotectants d -ononitol and d -pinitol (Vernon and Bohnert, 1992; Ishitani et al., 1996).
Knowledge of sodium chloride uptake and transport processes in halophytes is mainly based on physiological and biochemical studies. Ion transport systems responsible for cytoplasmic sodium homeostasis in the common ice plant have to be identified on the gene level yet. Salinity-induced Na+/H+ antiport at the tonoplast has been demonstrated physiologically in common ice plant, suggesting that vacuolar sodium sequestration is mediated by a secondary active Na+/H+ antiporter energized by the proton motive force, which is generated and maintained by primary active H+ transport at the tonoplast (Barkla et al., 1995). Considerable and fast increase in vacuolar type H+-ATPase (V-ATPase) activity was observed in tonoplast vesicles from common ice plant plants irrigated with high NaCl concentrations (Ratajczak et al., 1994), demonstrating the prime importance of the V-ATPase in the adaptation of common ice plant to high sodium concentrations.
The V-ATPase is a multimeric enzyme localized in endomembranes of eukaryotic cells that establishes an electrochemical H+-gradient. It has been identified at the vacuolar membrane (Lüttge and Ratajczak, 1997). V-ATPases consist of a hydrophilic domain (V1) on the cytosolic side and a hydrophobic membrane-integral domain (V0). Based on biochemical findings, the V1 complex is composed of eight subunits with three copies each of subunit A (catalytic subunit) and B (non-catalytic ATP binding) and probably one copy each of subunits C, D, E, F, G, and H that are known to be essential for V-ATPase stalk assembly, at least in yeast (Arai et al., 1988; Ratajczak, 2000). The most abundant subunits of the V0 domain are six copies of subunit c involved in proton translocation (for review, see Sze et al., 1999). Recently, a 100-kD polypeptide of yet unidentified function has been found to be associated with the unassembled V0 domain, but not with the active V-ATPase (Li and Sze, 1999).
Transcriptional changes of subunits of the vacuolar ATPase in response to salinity stress have been reported from a number of plants. Salt-induced transcriptional activation of V-ATPase subunits A, B, E, and c have been shown in common ice plant (Dietz and Arbinger, 1996; Löw et al., 1996, Tsiantis et al., 1996). Salt-induced increase of V-ATPase subunit A transcription has been observed in salt-adapted and salt-stressed cell suspension cultures of tobacco (Narasimhan et al., 1991) and of subunits A and c in the halotolerant sugar beet (Kirsch et al., 1996). In leaves of the glycophytic tomato, subunit A transcription increased transiently following NaCl treatment, but showed lower pre-stress levels after 3 d of stress (Binzel, 1995). Accumulation of subunit E in barley was only slightly modified by salt stress (Dietz et al., 1995; Dietz and Arbinger, 1996). Expression of subunit D in Arabidopsis was not changed by sodium chloride exposure (Kluge et al., 1999). It is apparent that salt stress affects V-ATPase gene expression differently in glycophytes and halophytes. However, a comparative analysis is not available and in addition, knowledge on cell-specific expression of V-ATPase genes is completely missing, although it is likely to provide clues on the physiological importance of the V-ATPase for adaptation to salinity stress.
Employing in situ hybridization and protein immunocytochemistry, this study addresses for the first time the question of tissue- and cell-specific expression of the V-type H+-ATPase in plants. Emphasis is laid on the adaptive role of the V-ATPase for growth on saline substrates. This approach takes advantage of the developmental control of halotolerance in the common ice plant. Therefore, the expression of subunit E of the V-ATPase was analyzed in 3-, 5-, and 10-week-old plants that differ in their ability to adapt to salinity stress and was compared with the expression of the stress marker genes Imt1 and Ppc1.
RESULTS
Developmental Differences of Salt-Inducible Expression of V-ATPase Subunit E
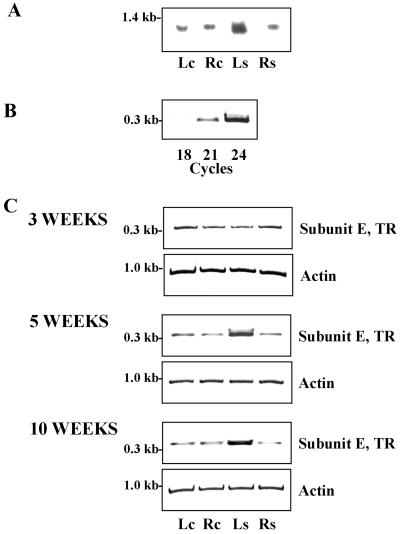
Experimental conditions were established to investigate the transcription of V-ATPase subunit E in response to salinity (Fig. 1). In 5-week-old common ice plant, transcripts of subunit E were found in roots and leaves with northern analysis (Fig. 1A). Increased expression was observed in leaves of plants exposed to 400 mm NaCl for 72 h, whereas the transcript level did not significantly change in salt-stressed roots. Quantitation of subunit E transcript by reverse transcriptase (RT)-PCR is shown in Figure 1, B and C. A 336-bp fragment of the coding region of AtpvE cDNA was amplified by gene specific primers. Linearity of signal amplification was tested in up to 24 amplification cycles (Fig. 1B). In plants stressed for 72 h, the RT-PCR signal increased in leaves, but the amount was unchanged in the roots. Since northern analysis and RT-PCR indicated identical expression patterns, RT-PCR was preferred for expressional analysis in the following.
Figure 1.
Tissue-specific differences in transcript accumulation of V-ATPase subunit E in common ice plant. A, Northern-blot analysis of total RNA (15 μg per lane) isolated fom leaves (Lc) and roots (Rc) of 5-week-old unstressed plants and leaves (Ls) and roots (Rs) from 5-week-old plants stressed with 400 mm NaCl for 72 h. The northern blot was hybridized with a digoxigenin-labeled probe corresponding to the full-length AtpvE cDNA sequence. The lanes were loaded with aliquots from the same RNA preparation as used for the transcript quantitation shown in C. B, Amplification of a fragment of the coding region of AtpvE (TR) by RT-PCR. Linearity of amplification was tested in up to 24 amplification cycles in 5-week-old common ice plant. C, Quantitation of transcript amounts of V-ATPase subunit E in 3-, 5-, and 10-week-old common ice plant.
To investigate a developmental requirement for the salt-response of subunit E, expression was studied in salt-sensitive 3-week-old and in mature 10-week-old plants. In 3-week-old plants salt stress had no major effect on the abundance of subunit E in leaves and roots, whereas in older plants the signal strength increased in the leaves the same way it was observed in 5-week-old common ice plant (Fig. 1C).
In Situ Hybridizations and Immunocytological Analysis
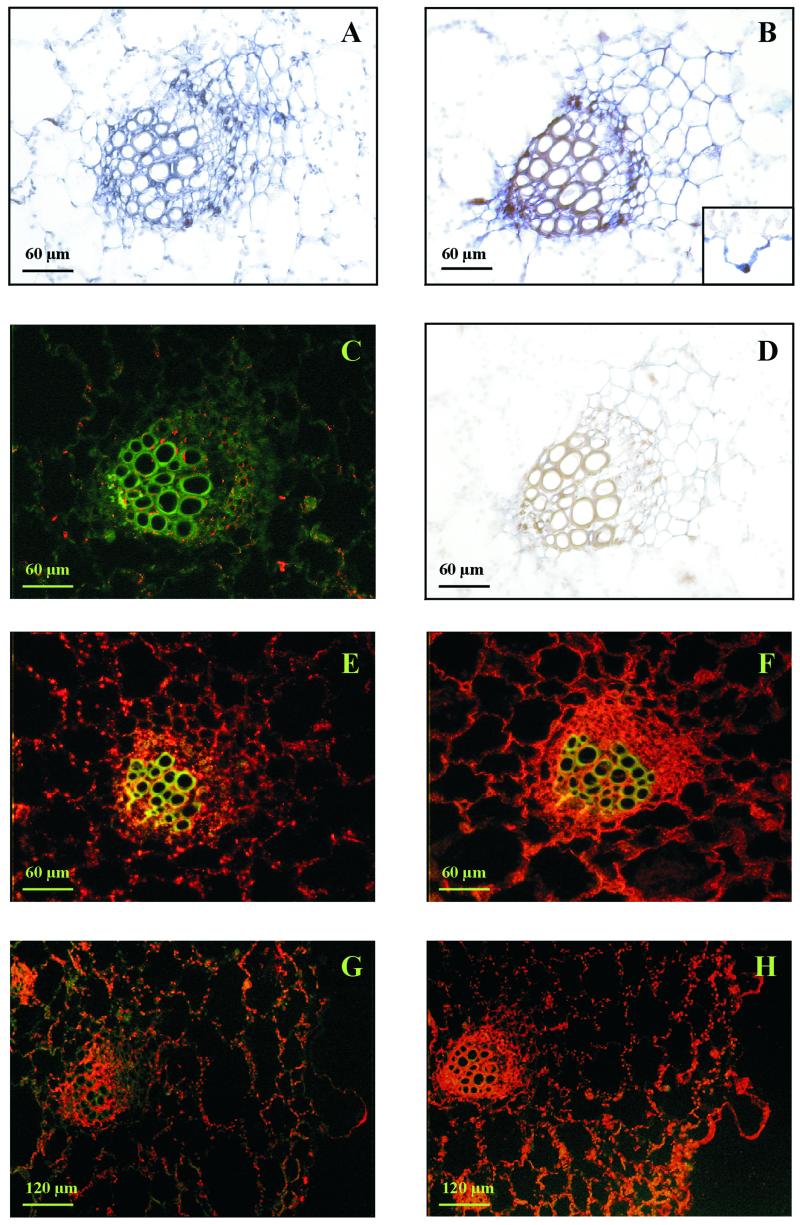
To provide information on the cell specificity of expression of subunit E, in situ hybridizations and protein cytolocalizations were performed in leaf tissue, root tips, and mature roots of common ice plant at the age of 3, 5, and 10 weeks. At the age of 3 weeks, in control and stressed plants, mRNA and protein of subunit E were present in all cells with the strongest signals in the vasculature (not shown). In Figure 2, leaf sections of 5- and 10-week-old common ice plant are shown focusing on a vascular bundle. Signals of subunit E were obtained in all cell types on the RNA and protein level. In non-stressed control plants the signal strength was the same in the epidermis, in mesophyll cells, and in the vascular bundles. In leaves of stressed plants the signals were most concentrated in cells surrounding the xylem and in the cambial tissue. Transcripts and protein of subunit E were also present in the bladder cells, which are a morphological characteristic of the ice plant as shown in Figure 2, B, G, and H.
Figure 2.
In situ hybridization and immunocytological analysis of V-ATPase subunit E in leaves of common ice plant. A, In situ hybridization in a leaf cross-section, focusing on a vascular bundle of 5-week-old control plants. Antisense. B, In situ hybridization in a leaf cross-section of 5-week-old plants stressed for 72 h. The insert shows a bladder cell from a leaf cross section of 10-week-old common ice plant treated with 400 mm NaCl for 72 h. Antisense. C, Immunolocalization in a leaf cross-section of 5-week-old control plants stressed with 400 mm NaCl for 72 h stained with preimmune serum. The green signals represent the autofluorescence of the tissue as a negative control. D, In situ hybridization to leaf cross-sections of 5-week-old plants stressed with 400 mm NaCl for 72 h. Sense probe for control of nonspecific hybridization. E, Immunolocalization of subunit E in leaves of 10-week-old control plants. Subunit E localization is shown with red fluorescence signals. F, Immunological detection of V-ATPase subunit E in 10-week-old plants stressed with 400 mm NaCl for 72 h. G, Immunolocalization of subunit E in leaves of 5-week-old control plants. On the right side, a bladder cell protrudes from the epidermis. H, Immunological detection of V-ATPase subunit E in 5-week-old plants stressed with 400 mm NaCl for 72 h.
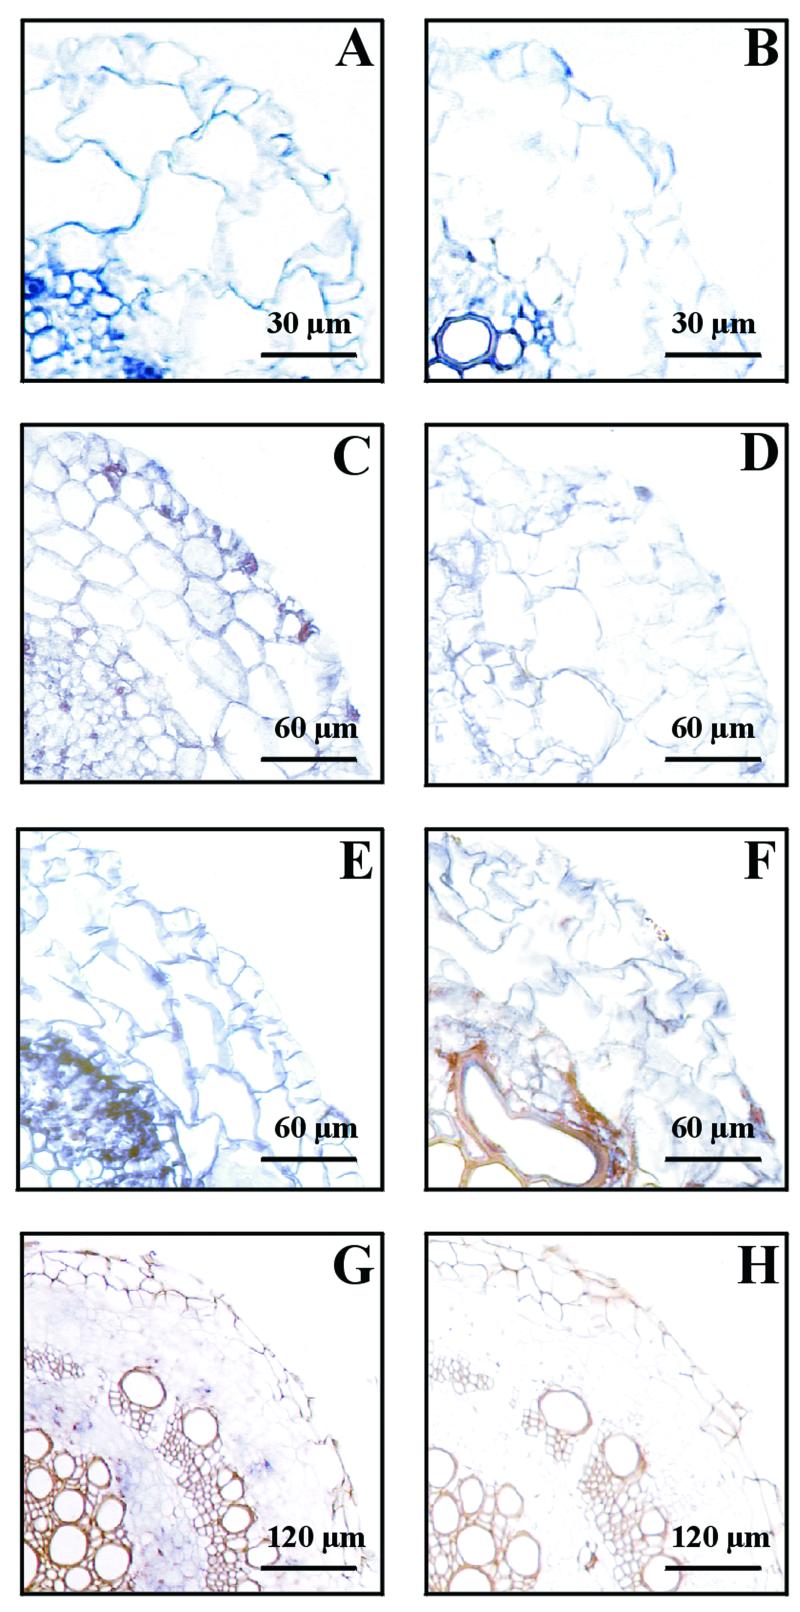
In situ hybridizations and protein cytolocalizations of subunit E in root cross sections are shown in Figures 3 and 4. In untreated and in salt-stressed 3-week-old plants (Fig. 3, A and B) subunit E expression was detected in the vascular cylinder, in cells of the exodermis, and the outer cortex, whereas the cells of the inner cortex showed lower signal intensity. At 5 weeks of age (Fig. 3, C and D), in control root tips at a distance of about 200 μm from the meristem, signals were found in the vascular cylinder, in the cortex, and the strongest expression was in the epidermis. In root tips of salt-treated plants all cells showed signals of decreased intensity. A different expression pattern could be found in cross-sections of roots at about a 5-cm distance from the meristem (Fig. 3, E and F). In situ hybridization showed expression of subunit E in all cell types. In non-stressed plants, cells of the vascular bundle showed higher density than cortex cells with a strong expression in cells of the endodermis. In salt-treated roots of 5-week-old plants subunit E expression was decreased to a similarly low level in all cell types.
Figure 3.
In situ hybridization of V-ATPase subunit E to root cross-sections of control plants and plants treated with 400 mm NaCl for 72 h. A, 3-week-old plant. Cross-section about 5 cm from the tip. Control. Antisense. B, Same as A, but salt stressed. Antisense. C, 5-week-old plant. Cross-section about 200 μm from the tip. Control. Antisense. D, Same as C, but salt stressed. Antisense. E, 5-week-old plant. Cross-section about 5 cm from the tip. Control. Antisense. F, Same as E, but salt stressed. Antisense. G, Ten-week-old plant. Cross-section about 8 cm from the tip. Salt stress. Antisense. H, Ten-week-old plant. Cross-section about 8 cm from the tip. Salt stress. Sense.
Figure 4.
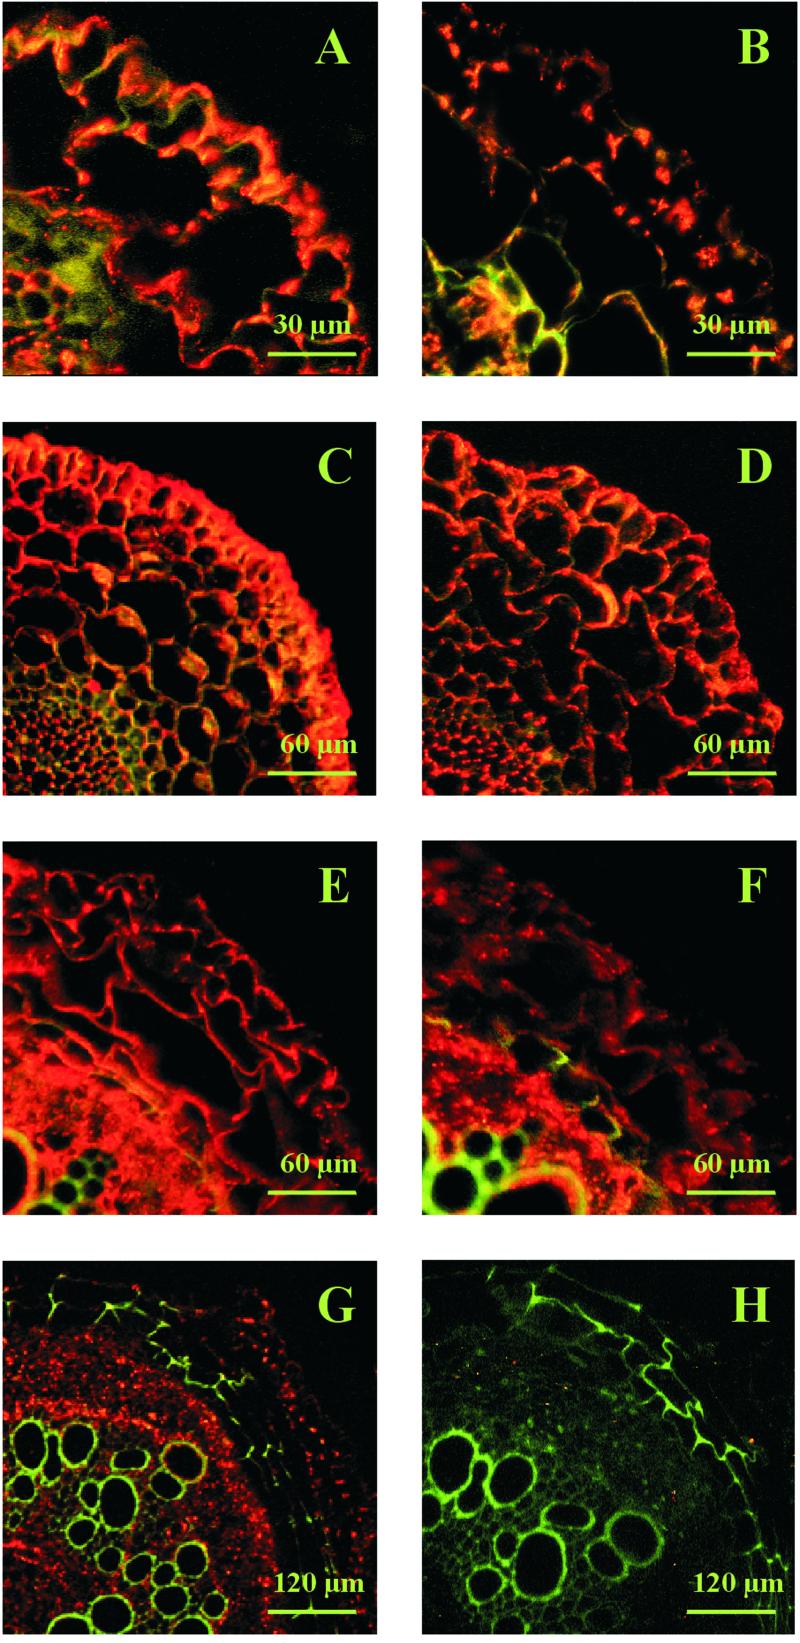
Immunolocalization of V-ATPase subunit E in root cross-sections of control plants and plants treated with 400 mm NaCl for 72 h. A through F are labeled as in Figure 3. G, Ten-week-old plant. Cross-section about 8 cm from the tip. Control. H, Same as G, but salt-stressed.
The cell type and salt-specific expression observed for the transcript level was confirmed on the protein level using immunolocalization (Fig. 4). In control plants of 3 weeks age subunit E protein was abundant in the exodermis and the cortex, and was particularly strong in the vascular tissue (Fig. 4A). In salt-treated roots subunit E amounts decreased. Cells of the vascular cylinder showed higher signal densities than the cortex cells. In the innermost cortex layer subunit E signals were very faint. A similar down-regulation of subunit E protein upon salt stress was seen in the tip, as well as in the mature part of roots of 5-week-old plants (Fig. 4, C–F). In roots of 10-week-old common ice plant subunit E transcripts and proteins were predominantly detected in the cortex, with no difference between salt-treated and untreated roots.
The patchy subcellular signal distribution of the subunit E protein shown for a mesophyll cell of leaves indicates that the protein is not uniformly distributed within the cells (Fig. 5). The staining pattern suggests that subunit E is not only associated with the tonoplast, but is also found in the cytoplasmic compartment and probably the plasma membrane. This is supported by the diffuse distribution of the protein in cells without a large central vacuole as found for the cambial tissue in the leaf vasculature and the epidermal cells at the root tip.
Figure 5.
Immunolocalization of V-ATPase subunit E in leaf mesophyll cells of 5-week-old control plants (A) and plants treated with 400 mm NaCl for 72 h (B). C, 5-week-old control plant stained with pre-immune serum.
Transcript Abundance of V-ATPase Subunit E, Imt1, and Ppc1
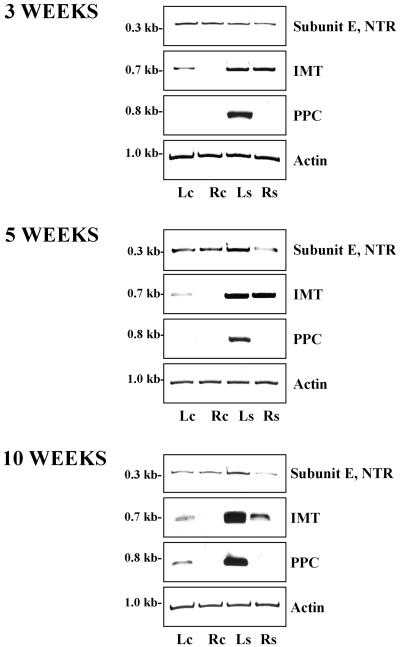
In pea, Kawamura et al. (2000) detected two isoforms of V-ATPase subunit E proteins with western-blot analysis. In the present study we quantitated subunit E RNA by RT-PCR with specific oligonucleotides for the non-translated region of the gene to test whether a single gene or isoforms of V-ATPase subunit E were monitored by transcript analyses. The same age-dependent expression pattern of subunit E as shown in Figure 1 was observed by PCR amplification of a 304-bp fragment of the 3′-non-translated region of AtpvE with gene specific primers in the common ice plant at the age of 3, 5, and 10 weeks (Fig. 6). These data indicate that differences in transcriptional activation of subunit E in response to salinity stress reflect tissue-specific regulation of the expression of one gene and are not due to the additional expression of another isoform.
Figure 6.
Quantitation of transcript amounts of V-ATPase subunit E using a probe including the extreme 3′ end of the coding region and part of the 3′-non-translated region of the gene (NTR), of Imt1, and Ppc1 in 3-, 5-, and 10-week-old common ice plant. RNA from leaves (Lc) and roots (Rc) of unstressed plants and leaves (Ls) and roots (Rs) from plants stressed with 400 mm NaCl for 72 h was quantitated by RT-PCR. Transcripts were amplified in the linear range of amplification with 23 cycles for subunit E, Twenty-five cycles for Imt1, and 25 cycles for Ppc1. Actin served as a loading control.
To compare the salt-dependent regulation of V-ATPase subunit E with the regulation of osmolyte production and CAM induction in salt-stressed common ice plant, the expression of Imt1 and Ppc1 transcripts were examined together with subunit E (Fig. 6). At all three developmental stages the Imt1 gene was weakly expressed in non-stressed leaf tissue. Salt stress led to increased transcript levels of Imt1 in leaves and roots with the strongest induction in leaves of 10-week-old plants. A weak signal of Ppc1 was observed in leaf tissue of common ice plant at the age of 10 weeks. The expression of the Ppc1 gene was salt-inducible in leaves at all three developmental stages.
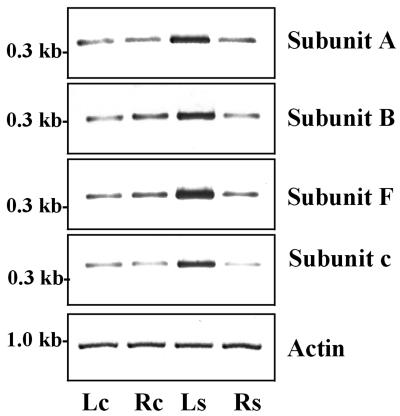
To compare salt-dependent expression of subunit E with other V-ATPase subunits, gene specific primers were designed for subunits A, B, F, and c and were included in the analysis. For transcript quantitations, for each subunit a cycle number in the linear range of amplification was chosen. All subunits investigated showed the same expressional pattern, indicating coordinate regulation of different subunits from the V1 and V0 domains of the V-ATPase in response to salinity stress (Fig. 7).
Figure 7.
Quantitation of V-ATPase subunits A, B, F, and c transcripts by RT-PCR. Template DNA was obtained from leaves (Lc) and roots (Rc) of unstressed plants and leaves (Ls) and roots (Rs) from stressed plants. Transcripts were amplified with specific primers as outlined in “Materials and Methods” in the linear range of amplification with 25 cycles for subunit A, 20 cycles for subunit B, 21 cycles for subunit E, 28 cycles for subunit F, 20 cycles for subunit c, and 25 cycles for actin.
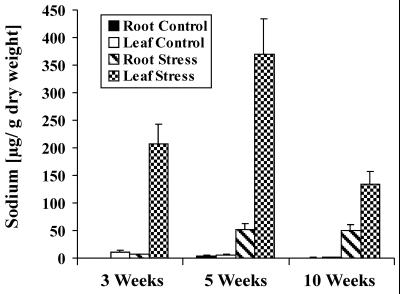
As a physiological reference parameter related to salt stress, whole tissue accumulation of sodium was determined in dependence of plant age (Fig. 8). In general, less sodium was accumulated in roots than in leaves upon salt treatment. Highest sodium concentrations were found in leaves of 5-week-old plants. It is interesting that leaves of 10-week-old plants accumulated less Na+ than leaves of 3-week-old plants during the 3 d treatment, most likely due to the development of side shoots with their functional bladder cells as an additional storage place for excess sodium.
Figure 8.
Age-dependent sodium uptake in common ice plant. Sodium contents of roots and leaves of hydroponically grown 3-, 5-, and 10-week-old plants. Plants were grown without sodium or treated with 400 mm NaCl for 72 h (n = 6).
Analysis of Signaling Pathways Involved in Salt-Induced Gene Expression
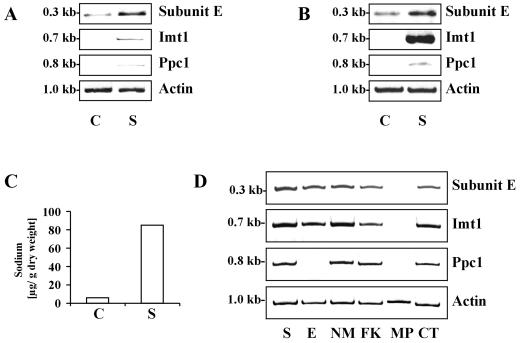
To obtain information on possible components of the signaling pathways controlling the salt-inducible gene expression of the V-ATPase subunit E, Imt1, and Ppc1, selected signal transduction activators and inhibitors were studied for their effect on transcript accumulation. The signaling effectors were applied via the transpiration stream to detached leaves for 6 h. The uptake of sodium into detached leaves was quantitated by inductively coupled plasma atomic emission spectrometry (ICPAES) analysis (Fig. 9C). As shown in Figure 9, A and B, an increase of transcript amounts of subunit E, Imt1, and Ppc1 could be induced during a 6-h salt stress treatment of detached leaves. Transcript levels of subunit E and Ppc1 were comparable with non-detached leaves, whereas the Imt1 expression was considerably higher. EGTA and membrane permeable EGTA/AM were applied to the detached leaves as calcium-chelating agents for depletion of extracellular and intracellular calcium concentration. Neomycin acts as an inhibitor of phospholipase C and inhibits the turnover of inositol phospholipid (Smith et al., 1995). Forskolin activates adenylate cyclase, thus causing an elevation of intracellular cAMP levels (Adashi and Resnick, 1986). Mastoparan activates pertussis toxin sensitive G-proteins (Yokokawa et al., 1989) and cholera toxin inhibits GTPase activity (Kahn and Gilman, 1986). All of these signaling effectors have been successfully used in plants (Legendre et al., 1992; Kurosaki and Nishi, 1993; Knight et al., 1997).
Figure 9.
Pharmacological study of salt-induced expression of V-ATPase subunit E, Imt1, and Ppc1 in detached leaves of 5-week-old common ice plant. A, Intact plant stress. RT-PCR-quantitation of transcript amounts of V-ATPase subunit E, Imt1, and Ppc1 in leaves of unstressed plants (label C) and plants stressed for 6 h with 400 mm NaCl (label S). Transcripts were amplified with 21 cycles for subunit E and 25 cycles for Imt1 and Ppc1. Actin is shown as a loading control. B, Salt effect on detached leaves. Quantitation of transcript amounts of V-ATPase subunit E, Imt1, and Ppc1 in non-treated detached leaves (C) and detached leaves stressed for 6 h with 400 mm NaCl (S) as described for Figure 8A. C, Sodium concentration in leaves of non-stressed control plants (C) and in detached leaves stressed for 6 h with 400 mm NaCl (S) (n = 2). D, Pharmacological analysis of salt-induced expression. Transcript amounts of V-ATPase subunit E, Imt1, and Ppc1 were quantified in detached leaves stressed for 6 h with 400 mm NaCl (S), or with 400 mm NaCl supplemented with 20 mm EGTA/0.8 mm EGTA/AM (E), 50 μm neomycin sulfate (NM), 400 μm forskolin (FK), 10 μm mastoparan (MP), or 120 nm cholera toxin (CT). Transcripts were amplified within the linear cycle range with 21 cycles for subunit E, 20 cycles for Imt1, and 27 cycles for Ppc1.
The effects of the pharmacological agents on salt-inducible synthesis of V-ATPase subunit E, Imt1, and Ppc1 were monitored by RT-PCR. As seen in Figure 9D, chelating Ca2+ inhibited the salt stress induced synthesis of Ppc1 transcripts, but had no effects on the expression of subunit E and Imt1. The application of mastoparan prevented the induction of subunit E, Imt1, and Ppc1 in response to salt stress. Neomycin, forskolin, and cholera toxin did not affect the synthesis of the three transcripts.
DISCUSSION
Increase in E Expression in Leaves Accompanies Acquisition of Salt Tolerance
The facultative halophyte common ice plant shows developmental differences in salinity tolerance and is thus an attractive model plant for studying the salt-dependent expression of the V-ATPase. The life cycle of the common ice plant spans from the juvenile stage at which NaCl treatment results in severe growth inhibition to the halotolerant mature plant (Adams et al., 1998). In this work we have shown that the expression of V-ATPase subunit E was not increased in roots upon salt stress in young salt-sensitive plants or in halotolerant old plants. These data indicate that increased levels of V-ATPase in roots do not play a major role in establishing salt tolerance for two reasons: Na+ is not accumulated in roots; and V-ATPase levels are unchanged by salt treatment. In a converse manner, subunit E transcript levels increased in leaves of older plants, but again were unaffected in leaves of juvenile plants, although these leaves accumulated considerable amounts of Na+. This suggests that the salt sensitivity of young plants might be related to a lack of salt sequestration capacity of the leaves. This interpretation is supported by the finding that the other investigated stress marker genes Imt1 and Ppc1 were already responsive to salt at that early stage of plant development. It is interesting that the salt-dependent up-regulation of V-ATPase expression in leaves was not restricted to photosynthetic cells that are involved in the metabolic switch from C3 photosynthesis to CAM.
V-ATPase Expression Is Abundant in Specific Cells
The in situ hybridizations and immunocytochemistry demonstrate that the V-ATPase is not uniformly expressed in all plant cells. In control plants, cells with particularly high level of V-ATPase expression were the epidermis and the parenchyma cells inside the vascular cylinder of the roots, as well as in the vascular bundles of the leaves, on the transcript and protein level. It may be hypothesized that these are sites where a high capacity for homeostatic buffering of ions and metabolites inside the vacuole is essential in responding to sudden environmental changes. The response to salt stress affected the leaf vascular bundles and mesophyll cells with increased subunit E transcript level. No up-regulation of subunit E expression was seen in any root cell. In contrast, the highly sensitive in situ hybridizations and histochemical analyses even indicated down-regulations in selected root cells.
At all three developmental stages lower amounts of sodium were associated with the roots than with the leaves, indicating efficient transport from the roots to the leaves once the sodium is taken up into the symplast of the roots. Cell-specific differences of subunit E transcript abundance and protein levels in salt-treated plants compared with control plants indicate the involvement of these cells in sodium accumulation or exclusion. The down-regulation of V-ATPase expression in the roots suggests that roots are apparently unable to accumulate Na+ and that Na+ is passed to the xylem for translocation to the leaves. Thus, differences of subunit E amounts may reflect the transport routes of sodium in the plant: uptake of sodium mainly in the root tip, long distance transport to the leaves, and cell-specific distribution in the leaves with a high transient buffer capacity in the parenchyma cells of the vascular bundles, and final a deposition in epidermal bladder cells.
Histochemical staining of subunit E as shown for a leaf mesophyll cell (Fig. 5) clearly indicated that the protein localization is not restricted to the tonoplast, but subunit E seems to be localized also in the cytoplasm and probably the plasma membrane. These data support previous findings of the subcellular distribution of the V-ATPase in plant cells. With membrane fractionations and immunogold labeling, the V-ATPase was found to be present in the endoplasmic reticulum, the Golgi apparatus, provacuoles, and the plasma membrane (Herman et al., 1994; Robinson et al., 1996). The cytosolic distribution of subunit E protein may be also due to a localization on small vesicles and the endoplasmic reticulum. Subunit E is a soluble protein, so it may be synthesized in the cytosol. It is interesting that in salt-stressed leaves of common ice plant the diffuse appearance of subunit E was enhanced in all cells, with highest signal intensities in cells surrounding the xylem. We suggest that these increased protein amounts indicate transport of sodium into the central vacuole through vesicles or provacuoles similar to intracellular sodium sequestration in Saccharomyces cerevisiae. In yeast, sodium is primarily accumulated in prevacuoles and then deposited into large vacuoles by vesicle trafficking and probably membrane assembly (Nass and Rao, 1998; Gaxiola et al., 1999). The sodium uptake in the provacuoles is mediated by the Na+/H+ exchanger Nhx1 and is energized by the vacuolar H+-ATPase, while water channels are involved in the osmotically driven water uptake in these organelles (Nass and Rao, 1998; Gaxiola et al., 1999).
In the glycophyte Arabidopsis, Apse et al. (1999) found the plant homolog of the Na+/H+ exchanger, AtNHX1, to colocalize with the V-ATPase in tonoplast, as well as Golgi/endoplasmic reticulum-enriched membrane fractions in wild-type plants and in salt-tolerant AtNHX1-overexpressing plants. For common ice plant it was recently suggested that water channel proteins do not strictly localize only to the plasma membrane or tonoplast, but also to the endosomal compartment and might undergo intracellular trafficking (Kirch et al., 2000). These findings strongly support the hypothesis that vesicles or provacuoles might be involved in intracellular sodium detoxification in plant cells.
Five Different Subunits of the V-ATPase Respond to Salt Stress in Parallel
Expression of subunits A, B, E, F, and c increased upon salt stress in leaves, but not in roots of 5-week-old plants treated with 400 mm NaCl for 72 h. The extent of stimulation was similar for all subunits and apparently coordinated. Löw et al. (1996) compared the expression of V-ATPase subunits A, B, and c during a 24-h salt stress and found differential accumulation of the subunits in 4-week-old soil-grown common ice plant. In fully expanded leaves only subunit c amounts increased, whereas in roots and young leaves the mRNAs of subunits A, B, and c were up-regulated in a coordinate way. Tsiantis et al. (1996) observed an increase of subunit c transcript levels in roots and leaves of 6-week-old hydroponically grown common ice plant salt stressed for 24 h. Comparing these studies with the results from this work, it may be concluded that non-stoichiometric regulation of transcript levels of the V-ATPase subunits is transient and restricted to short-term stress in common ice plant, whereas longer salt treatment causes coordinate changes of transcript amounts. The coordinate increase of the subunits observed in leaves of salt-adapted plants in this study indicates an increase of the amount of the holoenzyme complex—an observation consistent with the increased V-ATPase activity found in salt-adapted leaves of common ice plant (Ratajczak et al., 1994; Barkla et al., 1995). A coordinated salt-induced increase of transcript amounts of V-ATPase subunits has been reported for other halotolerant plants as well. In the halotolerant sugar beet, transcripts of the V-ATPase subunits A and c were found in root and leaf tissue and NaCl treatment caused an increase of the transcript levels in leaves, but not in the roots (Kirsch et al., 1996; Lehr et al., 1999), similar to what is shown in Figures 1 and 6 of this study. This indicates that coordinate enhanced steady-state transcript levels of V-ATPase subunits are a characteristic for salinity-stressed halotolerant plants.
Distinct Signaling Pathways Induce Transcription of Subunit E, Imt1, and Ppc1
In whole plants and detached leaves, the transcript levels of subunit E, Imt1, and Ppc1 responded similarly to salt stress in 5- and 10-week-old plants and to mastoparan treatment. However, specific differences occurred in salt response during other treatments: No effect of salinity stress was seen on subunit E expression in 3-week-old plants, whereas Imt1 and Ppc1 transcripts accumulated; in the detached leaf system, Imt1 was particularly responsive to the salt feeding; and upon feeding Ca2+-chelating agents, Ppc1 was not inducible by salt stress. The data show that the three key mechanisms contributing to the salt stress tolerance of the ice plant occur distinctly during the plant's life cycle and are regulated independently of each other. The development and tissue-independent expression of Imt1 upon salt stress indicates that genetic induction of osmolyte production is not coupled to the ability of vacuolar sodium sequestration. The latter apparently requires a certain morphological and physiological stage and is different in leaf and root tissue.
The results also strongly suggest the involvement of calcium in the signal transduction pathway leading to Ppc1 synthesis under salt stress. This supports the recent finding that stress-induced Ppc1 transcription was inhibited by chelating extracellular calcium in common ice plant (Taybi and Cushman, 1999). Modifications of stress-induced gene expression were not observed when applying neomycin that interferes with the inositol triphosphate pathway, forskolin that modifies the activity of adenylate cyclase, and cholera toxin to detached leaves. These results do not necessarily imply that the affected signaling events are not involved in the pathways activating the synthesis of the proteins. Assuming that salt stress activates expression of these genes to a maximum level, no further increase of the transcription could be expected from compounds activating the involved cross-talking signaling pathways. Thus, only the inhibition of salt-induced transcription by pharmacological compounds may be observed using this experimental approach.
GTP-binding proteins seem to be involved in stress-responsive V-ATPase stimulation, induction of osmolyte synthesis, and of CAM in common ice plant. Next to their role for signal transduction processes, GTP-binding proteins may be involved in vesicle trafficking and membrane fusion events (Valenti et al., 1998).
In plants the existence of isoforms has been reported for several V-ATPase subunits. For common ice plant, subunits c and B are, for instance, encoded by small gene families (Löw et al., 1996; Tsiantis et al., 1996). With western-blot analysis, two isoforms of V-ATPase subunit E proteins have recently been found in pea (Kawamura et al., 2000). For the common ice plant it is not known whether subunit E is expressed by one or more genes. In our experiments we were using gene-specific oligonucleotide primers in expression studies that were derived from the transcribed and from the highly gene-specific 3′-non-transcribed region of the sequence. We detected the same gene in root and leaf tissue at all developmental stages. The same stress-induced modifications of transcript amounts were monitored with the translated and non-translated regions of the gene, proving that the expression of the subunit E gene analyzed in this study is regulated by salt.
Our analyses clearly indicate a tight regulation of subunit E expression under salt stress in a tissue- and cell-specific way under developmental control. According to these findings the adaptation of the common ice plant to increased salinity is not due to a general and uniform cell response to stress that mediates tolerance, but is a complex multicellular whole plant response that depends on intercellular signaling processes.
MATERIALS AND METHODS
Plant Material
Common ice plant (Mesembryanthemum crystallinum) was grown in a growth chamber with 10 h of light (300 μE m−2 s−1, 23°C) and 14 h of darkness (18°C) with 50% relative humidity. Seeds were germinated in vermiculite soaked with one-half-strength Hoagland nutrition solution (Ostrem et al., 1987). Plants were transferred to hydroponic tanks with one-half-strength Hoagland nutrition solution 3 weeks after germination. Aeration of the hydroponic cultures was started 1 week after transferring the plants. For salt stress, the nutrient solution was supplemented with 400 mm NaCl for 72 h. Unstressed control plants were grown in parallel and harvested at the same time. Plants were harvested 5 h after the onset of illumination. For leaf analysis, the second youngest leaf pair of the plants was used.
RNA Extraction, Northern Analysis, RT-PCR, and Measurement of Sodium Concentration
RNA from roots and leaves was isolated by guanidinium thioisocyanate extraction (Chomczynski and Sacci, 1987). Northern analyses were performed according to standard procedures with 15 μg of total RNA per lane (Sambrook et al., 1989). The detection probe corresponding to the common ice plant V-ATPase subunit E full-length cDNA clone AtpvE (Dietz and Arbinger, 1996) was prepared by PCR with digoxigenin-dUTP (Roche Diagnostics Mannheim) as a label. Signal detection was performed with anti-digoxigenin alkaline phosphatase conjugated Fab fragments and disodium 3-(4-methoxyspiro{1,2-dioxetane-3,2′-(5′-chloro)tricyclo[3.3.1.13,7]decan}4-yl)phenylphosphate as substrate. Filters were washed with 0.5× SSC at 42°C for 30 min.
cDNA for RT-PCR was synthesized from each 3 μg of total RNA with Superscript RT II (Gibco-BRL, Cleveland) in 20-μL reactions. The cDNA was diluted 1:10 and 10-μL aliquots of cDNA were used as template for PCR amplifications in 50-μL standard reactions. The following sequence-specific forward and reverse primers were used for PCR amplifications: coding region of V-ATPase subunit E (GenBank accession no. X92118) 5′-GAGAAGGCCACCGAGATC-3′ and 5′-GCAACGCAACAAGACAGC-3′, non-coding region of V-ATPase subunit E 5′-GTTGACGACATCCATCTT-3′ and 5′-GATTGG TAGTGGACTCAA-3′; Imt1 (GenBank accession no. M87340) 5′-TGGCAGTGACA TTAGCAA-3′ and 5′-AGCAATGACATGAGGCAA-3′; Ppc1 (GenBank accession no. X13660) 5′-ATCCGAGAGTAACACCTG-3′ and 5′-CACGTTGCAGAAGCTCAA-3′; Actin 5′-GTGATCTCCTTGCTCATACG-3′ and 5′-GGNACTGGAATGGTNAAGG-3′; V-ATPase subunit A (GenBank accession nos. AA762035 and AA856216) 5′-GATCCTGTTACAT CTGCA-3′ and 5′-AGACTGACTTGTAGAACG-3′; V-ATPase subunit B (GenBank accession no. AA713368) 5′-GCTAGAGGGCAGAAGATT-3′ and 5′-GTGGTGTGAT GATACGCT-3′; V-ATPase subunit F (GenBank accession no. AA832528) 5′-GGA CATTGCGGTTGTACT-3′ and 5′-TGATATGGCTGCTCGACT-3′; and V-ATPase subunit c (GenBank accession no. X94999) 5′-ACCGTCTTCAATGGCGAT-3′ and 5′-CGACAATGAGACCGTAGA-3′.
PCR cycle parameters were 94°C for 1:30 min in the first cycle and 1 min in all consecutive cycles, followed by 1 min at 55°C, 2 min at 72°C with cycle numbers as indicated, and a final extension at 72°C for 10 min. The PCR products were separated on 1.7% (w/v) agarose gels and stained with ethidium bromide. Photographic images were obtained with a gel documentation system (INTAS, Göttingen, Germany). To verify the amplification of the correct sequences, the fragments were cloned in PCR-TOPO-2.1 and PCR-TOPO-II (Invitrogen, Carlsbad, CA), respectively, and sequenced (DNA sequencing facility, University of Bielefeld, Germany).
Sodium concentration was measured with an ICPAES according to Brune et al. (1995).
In Situ Hybridization and Immunolocalization of Proteins
Root or leaf sections were fixed with formaldehyde-acetic acid, dehydrated, and were embedded with Paraplast Plus (Fisher Scientific, Pittsburgh) according to McKhann and Hirsch (1993). Ten-micrometer sections were mounted on poly-L-Lys-coated microscopic slides. pBluescript plasmid harboring the full-length AtpvE was linearized with NotI and XhoI, respectively, and sense and antisense RNA transcripts were synthesized by T3 and T7 RNA polymerase with digoxigenin-UTP (Roche Diagnostics Mannheim) as a label. Transcripts were hydrolyzed to an average length of 200 nucleotides by alkaline treatment (Cox and Goldberg, 1988). In situ hybridizations were performed according to Yamada et al. (1995). Signal detection was performed with antidigoxigenin alkaline phosphatase conjugated Fab fragments and 5-bromo-4-chloro-3-indolyl-phosphate and nitroblue tetrazolium as substrates.
Immunolocalization of common ice plant subunit E proteins of V-ATPase was performed according to Maliga et al. (1995) with polyclonal antibodies against the subunit E of the V-ATPase from barley (Betz and Dietz, 1991) or preimmune serum in 1:200 dilution. An alkaline phosphatase conjugated goat anti-rabbit IgG was used as secondary antibody, and naphthol-AS-phosphate and Fast Red TR were used as substrates (Roche Diagnostics Mannheim). No specific signals were obtained by preimmune serum staining of tissue sections.
Microscopic images were obtained with a cooled charged-couple device camera coupled to an Axioskop fluorescence microscope (Zeiss, Germany) and processed through Axiovision (Zeiss) and Adobe Photoshop (Adobe Systems, Mountain View, CA).
Detached Leaf Experiments
Leaves were cut with scalpel blades, transferred to each 3 mL of 0.1-strength Hoagland nutrition solution (Ostrem et al., 1987) in 24-well plates, and cut a second time in the nutrient solution to prevent air embolism. The nutrient solution containing wells were covered with Parafilm to avoid evaporation. Preliminary experiments showed that no induction of Imt1, Ppc1, and subunit E occurred in detached leaves incubated in 0.1-strength Hoagland nutrition solution compared with non-detached leaves (results not shown). The solution was supplemented with 400 mm NaCl or 400 mm NaCl and effectors, i.e. 20 mm EGTA/800 μm EGTA/AM (Calbiochem, La Jolla, CA), 50 μm neomycin sulfate (Calbiochem), 400 μm forskolin (Calbiochem), 10 μm mastoparan (Sigma, St. Louis), or 120 nm cholera toxin (Calbiochem). The detached leaves were incubated for 6 h. Detached leaves and non-detached leaves were harvested at the same time. RNA extraction and RT-PCR were carried out as described above.
ACKNOWLEDGMENT
We are grateful to Ms. Elfriede Reisberg (University of Würzburg) for performing the ICPAES measurements.
Footnotes
This work was supported by the Deutsche Forschungsgemeinschaft within the Sonderforschungsbereich 176.
LITERATURE CITED
- Adams P, Nelson DE, Yamada S, Chmara W, Jensen RG, Bohnert HJ, Griffiths H. Growth and development of Mesembryanthemum crystallinum (Aizoaceae) New Phytol. 1998;138:171–190. doi: 10.1046/j.1469-8137.1998.00111.x. [DOI] [PubMed] [Google Scholar]
- Adashi EY, Resnick CE. 3′,5′-Cyclic adenosine monophosphate as an intracellular second messenger of luteinizing hormone: application of the forskolin criteria. J Cell Biochem. 1986;31:217–28. doi: 10.1002/jcb.240310304. [DOI] [PubMed] [Google Scholar]
- Apse MP, Aharon GS, Snedden WA, Blumwald E. Salt tolerance conferred by overexpression of a vacuolar Na+/H+ antiport in Arabidopsis. Science. 1999;285:1256–1258. doi: 10.1126/science.285.5431.1256. [DOI] [PubMed] [Google Scholar]
- Arai H, Terres G, Pink S, Forgac M. Topography and subunit composition of the coated vesicle proton pump. J Biol Chem. 1988;263:8796–8802. [PubMed] [Google Scholar]
- Barkla BJ, Zingarelli L, Blumwald E, Smith JAC. Tonoplast Na+/H+ antiport activity and its energization by the vacuolar H+-ATPase in the halophytic plant Mesembryanthemum crystallinum L. Plant Physiol. 1995;109:549–556. doi: 10.1104/pp.109.2.549. [DOI] [PMC free article] [PubMed] [Google Scholar]
- Betz M, Dietz KJ. Immunological characterization of two dominant tonoplast polypeptides. Plant Physiol. 1991;97:1294–1301. doi: 10.1104/pp.97.4.1294. [DOI] [PMC free article] [PubMed] [Google Scholar]
- Binzel ML. NaCl-induced accumulation of tonoplast and plasma-membrane H+-ATPase message in tomato. Physiol Planta. 1995;94:722–728. [Google Scholar]
- Brune A, Urbach W, Dietz KJ. Differential toxicity of heavy-metals is partly related to a loss of preferential extraplasmic compartmentation: a comparison of Cd-stress, Mo-, Ni- and Zn-stress. New Phytol. 1995;129:403–409. [Google Scholar]
- Chomczynski P, Sacci N. Single-step method of RNA isolation by acid guanidinium thiocyanate-phenol-chloroform extraction. Anal Biochem. 1987;162:156–159. doi: 10.1006/abio.1987.9999. [DOI] [PubMed] [Google Scholar]
- Cox KH, Goldberg RB. Analysis of plant gene expression. In: Shaw CH, editor. Plant Molecular Biology: A Practical Approach. Oxford: IRL Press; 1988. p. 27. [Google Scholar]
- Cushman JC, Bohnert HJ. Molecular genetics of crassulacean acid metabolism. Plant Physiol. 1997;113:667–676. doi: 10.1104/pp.113.3.667. [DOI] [PMC free article] [PubMed] [Google Scholar]
- Dietz KJ, Arbinger B. cDNA sequence and expression of SuE of the vacuolar H+-ATPase in the inducible crassulacean acid metabolism plant Mesembryanthemum crystallinum. Biochim Biophys Acta. 1996;1281:134–138. doi: 10.1016/0005-2736(96)00044-2. [DOI] [PubMed] [Google Scholar]
- Dietz KJ, Rudloff S, Ageorges A, Eckerskorn C, Fischer K, Arbinger B. Subunit E of the vacuolar H(+)-ATPase of Hordeum vulgare L.: cDNA cloning, expression and immunological analysis. Plant J. 1995;8:521–529. doi: 10.1046/j.1365-313x.1995.8040521.x. [DOI] [PubMed] [Google Scholar]
- Gaxiola RA, Rao R, Sherman A, Grisafi P, Alper SL, Fink GR. The Arabidopsis thaliana proton transporters, AtNhx1 and Avp1, can function in cation detoxification in yeast. Proc Natl Acad Sci USA. 1999;96:1480–1485. doi: 10.1073/pnas.96.4.1480. [DOI] [PMC free article] [PubMed] [Google Scholar]
- Herman EM, Li X, Su RT, Larsen P, Hsu H, Sze H. Vacuolar-type H+-ATPases are associated with the endoplasmic reticulum and provacuoles of root tip cells. Plant Physiol. 1994;106:1313–1324. doi: 10.1104/pp.106.4.1313. [DOI] [PMC free article] [PubMed] [Google Scholar]
- Ishitani M, Majumder AL, Bornhouser A, Michalowski CB, Jensen RG, Bohnert HJ. Coordinate transcriptional induction of myo-inositol metabolism during environmental stress. Plant J. 1996;9:537–548. doi: 10.1046/j.1365-313x.1996.09040537.x. [DOI] [PubMed] [Google Scholar]
- Kahn RA, Gilman AG. The protein cofactor necessary for ADP-ribosylation of Gs by cholera toxin is itself a GTP binding protein. J Biol Chem. 1986;261:7906–7911. [PubMed] [Google Scholar]
- Kawamura Y, Arakawa K, Maeshima M, Yoshida S. Tissue specificity of E subunit isoforms of plant vacuolar H(+)-ATPase and existence of isotype enzymes. J Biol Chem. 2000;275:6515–6522. doi: 10.1074/jbc.275.9.6515. [DOI] [PubMed] [Google Scholar]
- Kirch HH, Vera-Estrella R, Golldack D, Quigley F, Michalowski CB, Barkla BJ, Bohnert HJ. Expression of water channel proteins in Mesembryanthemum crystallinum. Plant Physiol. 2000;123:111–124. doi: 10.1104/pp.123.1.111. [DOI] [PMC free article] [PubMed] [Google Scholar]
- Kirsch M, An Z, Viereck R, Löw R, Rausch T. Salt stress induces an increased expression of V-type H(+)-ATPase in mature sugar beet leaves. Plant Mol Biol. 1996;32:543–547. doi: 10.1007/BF00019107. [DOI] [PubMed] [Google Scholar]
- Kluge C, Golldack D, Dietz KJ. Subunit D of the vacuolar H+-ATPase of Arabidopsis thaliana. Biochim Biophys Acta. 1999;1419:105–110. doi: 10.1016/s0005-2736(99)00055-3. [DOI] [PubMed] [Google Scholar]
- Knight H, Trewavas AJ, Knight MR. Calcium signalling in Arabidopsis thaliana responding to drought and salinity. Plant J. 1997;12:1067–1078. doi: 10.1046/j.1365-313x.1997.12051067.x. [DOI] [PubMed] [Google Scholar]
- Kurosaki F, Nishi A. Stimulation of calcium influx and calcium cascade by cyclic AMP in cultured carrot cells. Arch Biochem Biophys. 1993;302:144–151. doi: 10.1006/abbi.1993.1192. [DOI] [PubMed] [Google Scholar]
- Legendre L, Heinstein PF, Low PS. Evidence for participation of GTP-binding proteins in elicitation of the rapid oxidative burst in cultured soybean cells. J Biol Chem. 1992;267:20140–20147. [PubMed] [Google Scholar]
- Lehr A, Kirsch M, Viereck R, Schiemann J, Rausch T. cDNA and genomic cloning of sugar beet V-type H+-ATPase subunit A and c isoforms: evidence for coordinate expression during plant development and coordinate induction in response to high salinity. Plant Mol Biol. 1999;39:463–475. doi: 10.1023/a:1006158310891. [DOI] [PubMed] [Google Scholar]
- Li X, Sze H. A 100 kDa polypeptide associates with the V0 membrane sector but not with the active oat vacuolar H(+)-ATPase, suggesting a role in assembly. Plant J. 1999;17:19–30. doi: 10.1046/j.1365-313x.1999.00345.x. [DOI] [PubMed] [Google Scholar]
- Löw R, Rockel B, Kirsch M, Ratajczak R, Hortensteiner S, Martinoia E, Lüttge U, Rausch T. Early salt stress effects on the differential expression of vacuolar H(+)-ATPase genes in roots and leaves of Mesembryanthemum crystallinum. Plant Physiol. 1996;110:259–265. doi: 10.1104/pp.110.1.259. [DOI] [PMC free article] [PubMed] [Google Scholar]
- Lüttge U, Ratajczak R. The physiology, biochemistry and molecular biology of the plant vacuolar ATPase. Adv Bot Res. 1997;25:253–296. [Google Scholar]
- Maliga P, Klessig DF, Cashmore AR, Gruissem W, Varner JE. Methods in Plant Molecular Biology: A Laboratory Course Manual. Cold Spring Harbor, NY: Cold Spring Harbor Laboratory Press; 1995. Immunolocalization of proteins in fixed and embedded plant tissues; pp. 95–110. [Google Scholar]
- McKhann HI, Hirsch AM. In situ localization of specific mRNAs in plant tissues. In: Glick BR, Thompson JE, editors. Methods in Plant Molecular Biology and Biotechnology. Boca Raton, FL: CRC Press; 1993. pp. 179–205. [Google Scholar]
- Narasimhan ML, Binzel ML, Perez-Prat E, Chen Z, Nelson DE, Singh NK, Bressan RB, Hasegawa PM. NaCl regulation of tonoplast ATPase 70-kilodalton subunit mRNA in tobacco cells. Plant Physiol. 1991;97:562–568. doi: 10.1104/pp.97.2.562. [DOI] [PMC free article] [PubMed] [Google Scholar]
- Nass R, Rao R. Novel localization of a Na+/H+ exchanger in a late endosomal compartment of yeast: implications for vacuole biogenesis. J Biol Chem. 1998;2732:1054–1060. doi: 10.1074/jbc.273.33.21054. [DOI] [PubMed] [Google Scholar]
- Ostrem JA, Olson SW, Schmitt JM, Bohnert HJ. Salt stress increases the level of translatable mRNA for phosphoenolpyruvate carboxylase in Mesembryanthemum crystallinum. Plant Physiol. 1987;84:1270–1275. doi: 10.1104/pp.84.4.1270. [DOI] [PMC free article] [PubMed] [Google Scholar]
- Ratajczak R. Structure, function and regulation of the plant vacuolar H(+)-translocating ATPase. Biochim Biophys Acta. 2000;1465:17–36. doi: 10.1016/s0005-2736(00)00129-2. [DOI] [PubMed] [Google Scholar]
- Ratajczak R, Richter J, Lüttge U. Adaptation of the tonoplast V-type H+-ATPase of Mesembryanthemum crystallinum to salt stress, C3-CAM transition and plant age. Plant Cell Environ. 1994;17:1101–1112. [Google Scholar]
- Robinson DG, Haschke HP, Hinz G, Hoh B, Maeshima M, Marty F. Immunological detection of tonoplast polypeptides in the plasma membrane of pea cotyledons. Planta. 1996;198:95–103. [Google Scholar]
- Sambrook J, Fritsch EF, Maniatis T. Molecular Cloning: A Laboratory Manual. Ed 2. Cold Spring Harbor, NY: Cold Spring Harbor Laboratory Press; 1989. [Google Scholar]
- Smith MJ, Globus M, Vethamany-Globus S. Nerve extracts and substance P activate the phosphatidylinositol signaling pathway and mitogenesis in newt forelimb regenerates. Dev Biol. 1995;167:239–251. doi: 10.1006/dbio.1995.1020. [DOI] [PubMed] [Google Scholar]
- Sze H, Li X, Palmgren MG. Energization of plant cell membranes by H+-pumping ATPases: regulation and biosynthesis. Plant Cell. 1999;11:677–690. doi: 10.1105/tpc.11.4.677. [DOI] [PMC free article] [PubMed] [Google Scholar]
- Taybi T, Cushman JC. Signaling events leading to crassulacean acid metabolism induction in the common ice plant. Plant Physiol. 1999;121:545–56. doi: 10.1104/pp.121.2.545. [DOI] [PMC free article] [PubMed] [Google Scholar]
- Tsiantis MS, Bartholomew DM, Smith JAC. Salt regulation of transcript levels for the c subunit of a leaf vacuolar H(+)-ATPase in the halophyte Mesembryanthemum crystallinum. Plant J. 1996;9:729–736. doi: 10.1046/j.1365-313x.1996.9050729.x. [DOI] [PubMed] [Google Scholar]
- Valenti G, Procino G, Liebenhoff U, Frigeri A, Benedetti PA, Ahnert-Hilger G, Nürnberg B, Svelto M, Rosenthal W. A heterotrimeric G protein of the Gi family is required for cAMP-triggered trafficking of aquaporin 2 in kidney epithelial cells. J Biol Chem. 1998;273:22627–22634. doi: 10.1074/jbc.273.35.22627. [DOI] [PubMed] [Google Scholar]
- Vernon DM, Bohnert HJ. A novel methyl transferase induced by osmotic stress in the facultative halophyte Mesembryanthemum crystallinum. EMBO J. 1992;11:2077–2085. doi: 10.1002/j.1460-2075.1992.tb05266.x. [DOI] [PMC free article] [PubMed] [Google Scholar]
- Yamada S, Katsuhara M, Kelly WB, Michalowski CB, Bohnert HJ. A family of transcripts encoding water channel proteins: tissue-specific expression in the common ice plant. Plant Cell. 1995;7:1129–1142. doi: 10.1105/tpc.7.8.1129. [DOI] [PMC free article] [PubMed] [Google Scholar]
- Yokokawa N, Komatsu M, Takeda T, Aizawa T, Yamada T. Mastoparan, a wasp venom, stimulates insulin release by pancreatic islets through pertussis toxin sensitive GTP-binding protein. Biochem Biophys Res Commun. 1989;158:712–716. doi: 10.1016/0006-291x(89)92779-4. [DOI] [PubMed] [Google Scholar]


