

Abstract
The purpose of the current study was to examine the effect of adding secondary ingredients such as green tea derived water-soluble polysaccharides (GTP) and flavonol aglycone rich fractions derived from cellulase treated green tea extract (FVN) into catechin rich green tea extracts (GTE) on wheat starch digestion and intestinal glucose transport using in vitro digestion with Caco-2 cells. Co-digestion of wheat starch with GTE (16.88 g L−1) or GTE + GTP + FVN (16.69 g L−1) appeared to promote starch hydrolysis compared to control (15.49 g L−1). In case of major flavonoids, addition of epigallocatechin gallate (EGCG), EGCG + myricetin (M) into wheat starch significantly increased the digestion of starch into glucose. Glucose transport rate decreased by 22.35% in wheat starch + GTE + GTP + FVN (1.39%), while the least amount of glucose (1.70%) was transported in EGCG mixed with M (1% of EGCG) as secondary ingredients among individual flavonoids formulation. It indicated that inhibitory effect on glucose transport was higher in addition of GTE, GTP, and FVN as excipients ingredients rather than targeted major flavonoids. Results from the current study suggest that whole green tea including flavonoid rich fractions could enhance hypoglycemic potential of GTE.
Supplementary Information
The online version contains supplementary material available at 10.1007/s13197-021-05140-2.
Keywords: Wheat starch, Green tea extracts, Polysaccharides, Flavonol aglycone, Myricetin, Quercetin, Kaempferol, Hydrolysis, Glucose, Intestinal transport
Introduction
Starch, a main source of energy for humans, is digested to oligosaccharides including maltose by α-amylase secreted from the salivary glands and the pancreas and then subsequently to glucose by α-glucosidase and oligo-1,6-glucosidase in the intestine (Takahama and Hirota 2018). Long-term consumption of starchy food with a high content in rapidly digestible starch may cause type 2 diabetes (Shevkani et al. 2017). Diabetes is a global burden disease that caused 1.6 million deaths in 2016 (Organization 2018). It comprises many metabolic disorders, obesity and disturbances of carbohydrate metabolism characterized by hyperglycemia (Organization 2019). As a way of controlling diabetes, carbohydrate-hydrolyzing enzymes inhibiting drug such as acarbose has been used, but it had some adverse effects such as diarrhea. Therefore, nutritional treatment by natural products could be a good strategy for glycemic control (Silva et al. 2018). It has been well known that among natural products, plant foods rich for bioactive phytochemicals such as flavonoides, phenolic acids, saponins, anthocyanins etc. (Senica et al. 2019; Engin and Mert 2020; Gecer et al. 2020). Among plant foods the anti-diabetic activity of green tea (Camellia sinensis) and its derived products are gaining attention because the flavonoids have suppressive effects on α-glucosidase and glucose co-transporters which mainly act as anti-diabetic agents (Fang et al. 2019). It was reported that CG, GCG, ECG and EGCG in crude catechin showed potent inhibitor of α-amylase with 2.0 g L−1 starch solution as a substrate of maltose (Hara and Honda 2014). In addition, flavonols that can be found in green tea were the potent inhibitors of α-amylase and α-glucosidase (Tadera et al. 2006). It was recently revealed that the addition of quercetin rich fraction of green tea extract into catechins increased trans-epithelial absorption of total catechins by Caco-2 through inhibiting COMT or efflux transporters including MRP1, MRP2 and p-glycoprotein (Choi et al. 2019). In addition to flavonoids, green tea extracts containing pectic polysaccharides of unlignified cell wall such as rhamnogalactouronan-II significantly inhibited trans-epithelial glucose transport and rice starch digestion (Chung et al. 2019). GTP were also known to have inhibitory effect on α-amylase and α-glucosidase without posing any cytotoxicity in animal study (Karadag et al. 2018; Sun et al. 2018). GTE, GTP, FVN, and GTE + GTP + FVN were also not toxic to Caco-2 cells over 1000 ppm (Supplement 1). In our previous study, the expression of mRNA of SGLT1 was drastically reduced by 34% after co-consumption of wheat starch with green tea extracts and polysaccharides (Lee et al. 2020). The results elucidated the mechanism that glucose transport was controlled by down-regulating SGLT1 expression. However, there was no study relating the effect of extracts of whole green tea extracts.
In this study, we narrowed down to a number of promising candidates which have hypoglycemic potential from GTE that can be used as excipient ingredients. Despite the potential hypoglycemic effect of individual components such as catechins, polysaccharides, and flavonols, the impact of adding secondary ingredients obtained from green tea derived products including GTP, FVN and GTE on starch hydrolysis during digestion and glucose intestinal transport has not been evaluated. Hence, the current study examined the effect of either GTE formulated with GTP and FVN, or EGCG as major catechins in GTE formulated with M, Q, or K as excipient ingredients on wheat starch digestion and intestinal glucose transport by using in vitro digestion with Caco-2 cell.
Materials and methods
Chemicals and reagents
Hydrochloric acid and sodium hydroxide were purchased from Daejung Chemicals and Metals (Gyeonggi-do, Korea). Phosphoric acid was purchased from Junsei Chemical (Tokyo, Japan). Distilled water was purchased from Joylife (Busan, Korea). Wheat starch, dipotassium phosphate, monopotassium phosphate, 3,5-dinitrosalicylic acid, potassium sodium tartrate (Rochelle salt), α-amylase from human saliva and bovine originated pepsin, bile acid, pancreatin, and lipase, sodium bicarbonate, HPLC grade (95% of purity) of M, Q, K, and formic acid, Dulbecco’s modified eagle media, and phosphate buffered saline were purchased from Sigma Aldrich (Missouri, USA). Acetonitrile, methanol and water were obtained from J.T.Baker (New Jersey, USA). EC, EGC, ECG, EGCG standards for HPLC (99% of purity) were purchased from Wako (Osaka, Japan). Fetal bovine serum and 1% penicillin/streptomycin and were purchased from Biopure (Massachusetts, USA) and Biotechnics Research (California, USA). RO water was made by an RO machine (CP-01, HD Tech. Corp, Korea). Cellulase from trichoderma reesei (EC 3.2.1.6, Bision Corp., Gyeonggi-do, Korea) were purchased from Bision Corp. (Seoul, Korea).
Preparation of GTE, GTP, and FVN
To prepare GTE, the dried Camellia sinensis leaves (1 kg, Osulloc farm, Jeju Island, Korea) were extracted two times in 70% ethanol using a water bath at 70 °C for 1 h. The supernatants were concentrated with a vacuum evaporator (05-1-EV-02; Hanteul, Gyeonggi-do, Korea) and dried with a spray dryer (ODA-40, Seogang Eng., Chungcheongnam-do, Korea). On the other hand, the remaining residue obtained after GTE extraction was extracted with water at 90 °C for 3 h and then filtered to remove insoluble residue. The supernatant was concentrated in a vacuum evaporator and precipitated with the addition of 95% ethanol. The resulting precipitates were dissolved in a small volume of water and then spray-dried to obtain the water soluble polysaccharide (GTP). To obtained flavonol aglycone fraction (FVN), 2.15 kg of GTE and 215 L of RO water at pH 5.0 was combined and incubated at 50 °C for 24 h with 1% (w/w of GTE) of cellulase solution. The reaction was stopped by heat at 70 °C for 30 min and then the mixture was cooled to 30 °C. The fraction was collected to obtain flavonol aglycone rich fraction and then evaporated to a powder by a spray dryer. The dried powders of the GTE, GTP, and FVN stored at − 20 °C until used. Chemical properties such as neutral sugar, uronic acid, protein, and KDO-liked from GTE and GTP fractions isolated from the leaves of green tea were described in previous study (Chung et al. 2019). GTE contained 27.2% of neutral sugar, 13.8% of uronic acid, 10.9% of protein, and 0.9% of KDO-liked materials. GTP contained 46.8% of neutral sugar, 21.4% of uronic acid, 9.9% of protein, and 2.2% of KDO-liked materials. GTE used in the current study contained 20.6% of EGCG, 12.6% of EGC, 5.6% of EC, and 4.03% of ECG in dried material (Lee et al. 2020). FVN contained eight flavonol glycosides (Apigenin-6-C-glucosyl-8-C-arabinoside or isomer, Myricetin-3-O-glucoside, Quercetin-3-O-galactosylrutinoside, Quercetin-3-O-glucosylrutinoside Quercetin-3-O-rhamnosylgalactoside, Apigenin-6-C-glucoside, Quercetin-3-O-glucoside, Kaempferol-3-O-glucosylrutinoside) and three aglycones, M, Q, and K (Choi et al. 2019). FVN mainly contained M, Q, and K as of 0.5%, 0.9%, and 0.4% in dried material, respectively (Lee et al. 2020).
In vitro digestion model system
Wheat starch sample (1.4 g) was gelatinized at 95 °C for 20 min with 10 mL phosphate buffer (20 mM) in 50 mL conical tubes. The gelatinized samples were cooled down to 37 °C for 1 h in a water bath and equilibrated for 5 min with a vortex mixer (KMC-1300 V, Vision Scientific, Daejeon, Korea). GTE, GTP, FVN, or each green tea flavonoids (M, Q, and K) was added into an aliquot amount of wheat starch. The formulation of FVN (10% or 1% of GTE) and flavonols found in FVN i.e., M, Q, or K as excipient ingredients (10% or 1% of EGCG) was decided according to our maximum mass production yield of FVN (data not shown). To mimic salivary phase, 2 mL of α-amylase (5 unit/mL) was added and directly put into the shaking water bath (37 °C, 200 rpm, 5 min). The tubes were put into an ice basket (4 °C) to stop enzyme activity. Subsequently, the mixture went through a gastric phase with 4 mL of pepsin (200 mg/mL in 0.1 M HCl) and then it was adjusted to pH 2 ± 0.1 by 1 M HCl. To mimic small intestinal phase, 1 M NaHCO3 was added to adjust the pH to 5.3 ± 0.1. After that, pancreatin (10 mg/mL), amyloglucosidase (2.5 unit/mL), lipase (5 mg/mL), and bile acid (60 mg/mL) were added and then 1 M NaOH was added to adjust the pH to 7.0 ± 0.1. The digestion conditions were 37 °C with 200 rpm in a shaking water bath. The digested samples were centrifuged at 4 °C with 10,000 rpm for 20 min and then filtrated with a syringe filter (0.45 μm, 13 mm, ADVENTEC, Ontario, Canada).
Measurement of wheat starch hydrolysis by using a dinitrosalicylic acid (DNS) Assay and labassay
It was conducted by DNS method with slight modification from previous study (Gonçalves et al. 2010). Each sample of AQ and the triple distilled water were mixed with the ratio of 1 to 24 (v:v) in 1.5 mL micro tubes. In the case of basolateral media from transwell seeded with Caco-2 cell culture, it was used directly without dilution. Aliquot amount of sample (25 μL) and 25 μL of the DNS reagent were gently added to the bottom of 96 well plate (Corning, New York, USA) under the dark place. It was fully covered with aluminum foil and then put into a dry oven (105 °C, 10 min) for the colorimetric reaction. The plate was immediately placed into an ice box (4 °C) and then 250 μL of distilled water was added by using a multichannel pipette (Thermo Fisher scientific, Massachusetts, USA) without exposure to light. The absorbance of samples was measured using a Varioskan Flash microplate reader (Thermo Fisher scientific, Waltham, Massachusetts, USA) at 540 nm. Glucose equivalents of the collected AQ and cell culture media were measured using a LabAssay glucose kit (Wako, Japan).
The measurement of glucose transport by Caco-2 cell culture
The human colon carcinoma cell line, Caco-2 cells from the Korean Cell Line Bank (KCLB, Seoul, Korea) between passages 50–55 were used to measure the epithelium intestinal glucose transport. The cells (105 cells/cm2) were seeded and cultivated in a collagen-coated 12-transwell insert (Corning, New York, USA) and were treated with AQ for the experiments after 14–21 days of seeding. The cells were grown in Dulbecco’s modified eagle media with 10% fetal bovine serum and 1% penicillin/streptomycin. Both the apical and basolateral media were changed and washed with a phosphate buffer solution every second day. The cells were cultivated at 37 °C until 100% of cell confluence was reached. Before adding treatments, the cells were washed with a DPBS. The trans-epithelial electrical resistance (TEER) values were measured using a Millicell ERS-2 system (Millipore, M.A., USA). The cells that had TEER values beyond 250 Ω cm2 were selected for the glucose transport experiment. Aliquot amount of AQ (0.5 mL) was diluted with DPBS (Sigma-Aldrich, UK) in a 1:4 (v:v) ratio and then added to each trans-well insert. After incubation for 2 h in 5% CO2 and 95% air, both apical and basolateral media were collected. Glucose equivalents of the collected media were measured using a LabAssay glucose kit (Wako, Osaka, Japan) according to the manufacturer’s instructions. The glucose transport rate (%) was calculated using the following formula:
| 1 |
At is the concentration of transported glucose from digesta by intestinal epithelium cell of sample, and A0 is the concentration of glucose from digesta of sample.
Statistical analysis
The values were reported as the mean ± standard deviation. A one-way ANOVA and Bonferroni’s post hoc test were performed to measure significant differences among groups at a significance level of p < 0.05 using GraphPad Prism 3.0 software (GraphPad, CA, USA). All the experiments were performed in triplicates samples from two independent experiments.
Results and discussion
Effect of GTE, GTE formulating with GTP and FVN, or targeted green tea flavonoids on digestion of wheat starch into reducing sugar and glucose after in vitro digestion
The amount of glucose and reducing sugar released after undergoing salivary and gastric digestion of wheat starch co-treated with GTE, GTP, or GTE + GTP + FVN are described in Table 1. The contents of glucose released in AQ after digestion were 15.49 ± 0.91, 16.88 ± 0.62, 16.15 ± 0.45, and 16.69 ± 0.10 g·L−1 of digestive fluid for wheat starch, wheat starch + GTE, wheat starch + GTE + GTP + FVN (0.002 g), and wheat starch + GTE + GTP + FVN (0.0002 g), respectively (Table 1). The addition of GTE into hydrolysis wheat starch significantly increased the released glucose content of AQ, but there was no significant difference with the amount released when both GTE and GTE + GTP + FVN were added. It was relatively equivalent to 41.58 ± 1.56, 45.94 ± 2.55, 42.38 ± 2.31, and 44.15 ± 2.73% of reducing sugar for wheat starch, wheat starch + GTE, wheat starch + GTE + GTP + FVN (0.002 g), and wheat starch + GTE + GTP + FVN, respectively. The addition of GTE into wheat starch showed the least amount of reducing sugar (36.82 ± 1.98 g·L−1) but the highest relative amount of glucose (45.94 ± 2.55%). Results from our study indicated that GTE was the most effective on hydrolyzing wheat starch into glucose. In contrast, there were no statistically significant differences in the reducing sugar contents from AQs of GTE and GTE + GTP + FVN added groups. Addition of GTP and FVN into GTE could inhibit starch hydrolysis into glucose during digestion, which can directly affect blood glucose after small intestine absorption (Navarro et al. 2019).
Table 1.
Reducing sugar content and relative glucose amount of the aqueous fraction of digesta from digestion at 120 min of small intestinal phase
| Treatments (in 10 mL phosphate buffer) | Glucose content | Reducing Sugar content | Relative glucose amount |
|---|---|---|---|
| (g·L−1) | (g·L−1) | (% of reducing sugar) | |
| Wheat starch (1.4 g) | 15.49 ± 0.91c | 37.28 ± 1.42a | 41.58 ± 1.56a |
| Wheat starch (1.4 g) + GTE (0.02 g) | 16.88 ± 0.62ab | 36.82 ± 1.98a | 45.94 ± 2.55a |
| Wheat starch (1.4 g) + GTE (0.02 g) + GTP (0.002 g) + FVN (0.0002 g) | 16.69 ± 0.10bc | 37.91 ± 2.35a | 44.15 ± 2.73a |
| Wheat starch (1.4 g) + GTE (0.02 g) + GTP (0.002 g) + FVN (0.002 g) | 16.15 ± 0.45bc | 38.17 ± 2.06a | 42.38 ± 2.31a |
GTE catechin rich green tea extracts, GTP green tea derived water-soluble polysaccharides, FVN flavonol aglycone rich fractions derived from cellulase treated green tea extract
Different letters on the bars indicate that there was a significant difference between treatments that were significantly different among concentrations (p < 0.05)
Since GTE contained at least 35% of catechin epimers and EGCG was the major one, the current study aimed to see the effect of tea flavonoids, EGCG derived from green tea on starch hydrolysis. Thus, 0.3 g of EGCG was chosen based on the recommended daily allowance of EGCG in GTE as reported by the European Food Safety Authority to avoid toxicity (Additives et al. 2018). The potential effect of its formulation EGCG with flavonols found in FVN i.e., M, Q, or K as excipient ingredients (10% or 1% of EGCG) according to our mass production yield (data not shown) was further evaluated in the current study.
Wheat starch was broken down into reducing sugar, ranged from 29.83 ± 1.76 to 41.05 ± 0.33 g·L−1 by co-treatment of flavonoid components derived from green tea (Table 2). In this study, reducing sugar contents of AQ were significantly decreased in the presence of EGCG, EGCG + M (0.6 mg), EGCG + Q (0.6 mg), EGCG + K (0.6 mg). There was no significant difference among the reducing sugar contents in the presence of EGCG + M (0.06 mg) and EGCG + Q (0.06 mg) with wheat starch, but there was a significant increase in wheat starch + EGCG + K (0.06 mg) compared to wheat starch. Wheat starch was mostly hydrolyzed into glucose (from 43.19 to 59.83% of reducing sugar) in the presence of EGCG, M, Q, and K. The hydrolyzed glucose concentrations in AQ by treatment of individual flavonoids were represented in Table 2. The released amount of glucose from wheat starch (1.4 g) with EGCG + K (0.6 mg) and EGCG + Q (0.06 mg) was 16.01 ± 0.11 and 16.56 ± 0.71 g L−1, respectively. Results showed that the released amounts of glucose in AQ from wheat starch with EGCG + K (0.6 mg) and EGCG + Q (0.06 mg) was significantly lower than glucose content in AQ of wheat starch. However, in the case of co-treatment of EGCG, EGCG + M (0.6 mg), EGCG + Q (0.6 mg), EGCG + M (0.06 mg), or EGCG + K (0.06 mg), hydrolysis of wheat starch into glucose was significantly higher than wheat starch by itself (p < 0.05). Relative glucose amounts were equivalent to 53.45 ± 4.09, 59.83 ± 3.42, 54.12 ± 4.84, 50.71 ± 3.84, 51.43 ± 2.15, 43.19 ± 0.76, and 48.07 ± 0.39% of reducing sugar content at 120 min of digestion for wheat starch (1.4 g) with EGCG (0.006 g), EGCG (0.006 g) + M (0.6 mg), EGCG (0.006 g) + Q (0.6 mg), EGCG (0.006 g) + K (0.6 mg), EGCG (0.006 g) + M (0.06 mg), EGCG (0.006 g) + Q (0.06 mg), and EGCG + K (0.06 mg), respectively. Remarkably, relative glucose amount was dose-dependently increased when we added single flavonoid M, Q, and K with EGCG to wheat starch. Relative glucose amount was significantly increased by 44% through addition of M to wheat starch. Addition of EGCG + M (0.6 mg) had stronger hydrolyzation promoting effect than addition of Q and K to wheat starch. Consequently, green tea derived extracts did not show any significant effect to wheat starch hydrolyzation but major single flavonoid accelerated digestion.
Table 2.
Reducing sugar content and relative glucose amount of the aqueous fraction of digesta from digestion at 120 min of small intestinal phase
| Treatments (in 10 mL phosphate buffer) | Glucose content | Reducing sugar content | Relative glucose amount |
|---|---|---|---|
| (g·L−1) | (g·L−1) | (% of Reducing Sugar) | |
| Wheat starch (1.4 g) | 15.49 ± 0.91e | 37.28 ± 1.42b | 41.58 ± 1.56e |
| Wheat starch (1.4 g) + EGCG (0.006 g) | 16.84 ± 0.66 cd* | 31.62 ± 2.52d* | 53.45 ± 4.09bc* |
| Wheat starch (1.4 g) + EGCG (0.006 g) + Myricetin (0.06 mg) | 18.55 ± 0.74ab* | 36.11 ± 1.54bc | 51.43 ± 2.15bc* |
| Wheat starch (1.4 g) + EGCG (0.006 g) + Myricetin (0.6 mg) | 17.81 ± 0.84bc* | 29.83 ± 1.76d* | 59.83 ± 3.42a* |
| Wheat starch (1.4 g) + EGCG (0.006 g) + Quercetin (0.06 mg) | 16.56 ± 0.71cde | 38.35 ± 0.66ab | 43.19 ± 0.76de |
| Wheat starch (1.4 g) + EGCG (0.006 g) + Quercetin (0.6 mg) | 17.78 ± 0.99bc* | 33.03 ± 3.08 cd* | 54.12 ± 4.84b* |
| Wheat starch (1.4 g) + EGCG (0.006 g) + Kaempferol (0.06 mg) | 19.73 ± 0.28a* | 41.05 ± 0.33a* | 48.07 ± 0.39 cd* |
| Wheat starch (1.4 g) + EGCG (0.006 g) + Kaempferol (0.6 mg) | 16.01 ± 0.11de | 31.71 ± 2.50d* | 50.71 ± 3.84bc* |
EGCG epigallocatechin gallate
An asterisk (*) on the bar indicates a significant difference from wheat starch (p < 0.05)
Different letters on the bars indicate that there was a significant difference between treatments that were significantly different among concentrations (p < 0.05)
It was found that the hydroxyl group of flavonoids interacted with the catalytic active site of α-amylase with hydrogen bonds, resulted in inhibitory activity of α-amylase and α-glucosidase was known to increase with an increase in the number of the hydroxyl group on the B ring of flavonols (M > Q > K) and flavan-3-ol (EGC > EC) (Tadera et al. 2006; Miao et al. 2014). Previous study also reported that flavonols (M, Q, K, and fisetin) had a lower half inhibition concentration value (IC50) than catechins for enzyme activity (Lo Piparo et al. 2008). These results were obtained under in vitro conditions rather than under physiologically simulated digestion conditions. In contrast to the results from those previous study, our data suggest that the flavonoids from green tea increased hydrolysis of starch into glucose during digestion of wheat starch. Evidences from the in vitro studies indicated that amylose and green tea catechins could make a complex through hydrogen bonding (Liu et al. 2011; Chai et al. 2013). The hydrodynamic radius of high amylose (more than 70%) starch increased in the presence of tea polyphenols particularly epi-catechins, and the starch was hydrolyzed into glucose more rapidly than the starch only sample during digestion (Chai et al. 2013). Similar to our finding, starch digestibility was also enhanced in cooked high amylose corn starch (contained 79.4% of amylose) by tea polyphenol containing 66.90% of EGCG, 10.62% of ECG, 15.70% of EC, and 5.88% of EGC (Liu et al. 2011). The results imply that enzymatic attackable surface was made by amylose-flavonoids as well as the starch digestibility enhanced by gelatinization in high temperatures in the presence of water due to the increase in glucose bound chains (Ali Asgar 2012). A recent study supported our result with showing a possible mechanism that starch-flavonoid complex enhanced starch digestibility without affecting α-amylase and α-glucosidase activity (Takahama and Hirota 2018). Findings from the current study suggest that the addition of GTE or single flavonol extracted from FVN could enhance the digestibility of wheat starch by making starch-flavonoid complex without influencing on starch hydrolyzing enzymes. Our results found that addition of either GTE or EGCG released similar amount of glucose with showing 16.88 ± 0.62 g L−1 or 16.84 ± 0.66 g L−1 of glucose which significantly exceeded the glucose content of wheat starch group. It is implying that 4.29 mg of EGCG/g starch was not only sufficient to hydrolyze starch into glucose but also EGCG could be major component in GTE for increasing starch digestibility.
Effect of GTE, GTE formulating with GTP and FVN, or green tea flavonoids on glucose transport across intestinal epithelial cell (Caco-2)
In order to investigate how GTE, GTE with GTP and FVN, or targeted green tea flavonoids affect intestinal glucose absorption followed by digestion, the glucose transport rate (%) at 120 min of incubation in Caco-2 cell was estimated. Compared to wheat starch (1.79 ± 0.02%), significantly lower (p < 0.05) amount of glucose was transported by co-digestion of GTE, GTE + GTP + FVN (0.002 g), and GTE + GTP + FVN (0.0002 g) with showing 1.49 ± 0.00, 1.42 ± 0.03, and 1.39 ± 0.04% of glucose transport rate, respectively (Fig. 1). The transport rates of GTE + GTP + FVN (0.002 g) and GTE + GTP + FVN (0.0002 g) were far lower than that of GTE and EGCG with flavonols (Fig. 1). Addition of GTE and GTE + FVN (0.0002 g) to wheat starch significantly reduced the glucose transport rate by 16.75% and 22.35% each. There was no significant difference existed by FVN concentrations. However, it was observed that the glucose transport rate was noticeably higher in the co-digestion of wheat starch with EGCG (2.18 ± 0.02%), EGCG + M (0.6 mg) (1.95 ± 0.02%), EGCG + Q (0.6 mg) (1.97 ± 0.02), EGCG + K (0.6 mg) (2.01 ± 0.02%), and EGCG + Q (0.06 mg) (1.95 ± 0.01%) than wheat starch only as shown in Fig. 2. Among treatments, the lowest level of glucose transport rate was found in EGCG + M (0.06 mg) (1.70 ± 0.01%). EGCG + K (0.06 mg) (1.78 ± 0.00%) had no significant difference from wheat starch only (1.79 ± 0.02%). Glucose transport rates in Fig. 3 shows that there was a synergistic effect of EGCG, M, Q, and K. The results verified that the glucose transport rates were 14% decreased by combinational addition of EGCG + M (0.6 mg) + Q (0.6 mg) + K (0.6 mg) than wheat starch.
Fig. 1.
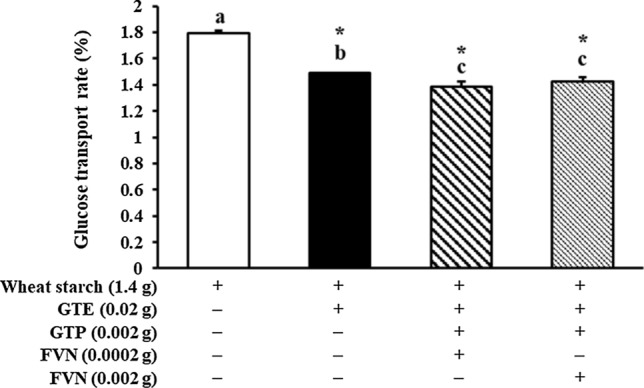
Effect of GTE, GTP and FVN on glucose transport inhibition by using Caco-2 (epithelial cell) transepithelial glucose transport assay coupled with Lab-assay kit; GTE: catechin rich green tea extracts, GTP: green tea derived water-soluble polysaccharides, FVN: flavonol aglycone rich fractions derived from cellulase treated green tea extract. An asterisk (*) on the bar indicates a significant difference from wheat starch (p < 0.05). ( +): with, (−): without
Fig. 2.

Effect of single flavonoid, EGCG, myricetin, quercetin and kaempferol in green tea on glucose transport inhibition by using Caco-2 (epithelial cell) trans-epithelial glucose transport assay coupled with Lab-assay kit; EGCG: epigallocatechin gallate. An asterisk (*) on the bar indicates a significant difference from wheat starch (p < 0.05). ( +): with, (−): without
Fig. 3.
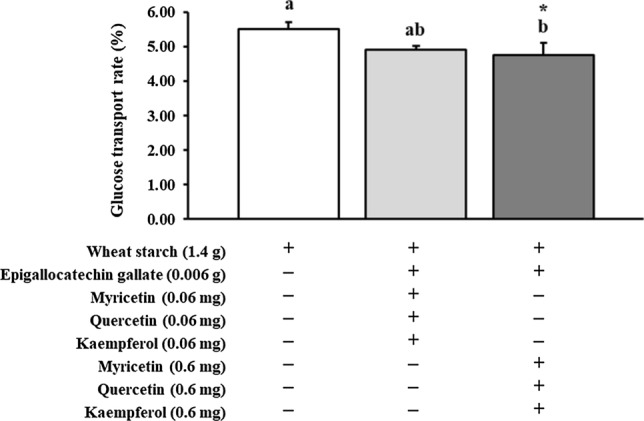
Combinational effect of EGCG, myricetin, quercetin and kaempferol in green tea on glucose transport inhibition using Caco-2 (epithelial cell) trans-epithelial glucose transport assay coupled with Lab-assay kit; EGCG: epigallocatechin gallate. An asterisk (*) on the bar indicates a significant difference from wheat starch (p < 0.05). ( +): with, (−): without
Several studies found that flavonols showed that a great potential in suppressing hyperglycemia (Ong and Khoo 2000; Kim et al. 2011). For instance, a previous study reported that injecting 3 mg of myricetin 12 h for 2 days reduced serum glucose by 50% in diabetic rats (Ong and Khoo 2000). Kim et al. (2011) showed that plasma glucose level and the postprandial glucose response of diabetic rats significantly decreased after administration of starch with quercetin (100 mg/kg) compared to the control group. A similar result was found in the current study wherein significant decreases in glucose transport were observed in the FVN and GTP supplemented with GTE by Caco-2 cells, indicating that it was ranged from 77 to 79% (Fig. 1). In addition, flavonols including myricetin, quercetin, and kaempferol are the second major flavonoids found in dry green tea next to flavan-3-ols (Peterson et al. 2005). Among the flavonols, kaempferol and quercetin were revealed to regulate glucose homeostasis by enhancing insulin secretion, improved the antioxidant status and reducing insulin resistance in diabetic in vivo model (Fang et al. 2019). The results from a recent study imply that FVN could indirectly affect and regulate glucose intestinal uptake, resulted in modulating glucose transporters by enhanced intestinal uptaken catechin. It was supported by results from previous study that flavonols could enhance the intestinal absorption of catechins by strongly binding to COMT, which can methylate epi-catechins such as EGC and EGCG (Chung et al. 2018). It was also reported that a mixture of FVN and GTE enhanced catechin absorption by inhibiting efflux transporters, MRP2 and p-glycoprotein, compared to only GTE treatment on Caco-2 cells (Choi et al. 2019). SGLT1 and GLUT2 protein levels were over-expressed up to four-fold and three-fold in type 2 diabetes (Williamson 2013; Rios et al. 2015). The hypoglycemic mechanism of phlorizin, polyphenolic inhibitor of SGLT1 was suggested that flavonols might bind to SGLT1 due to aromatic rings in flavonols (Raja et al. 2003). In our previous research, GTE or GTE + GTP down-regulate the mRNA level of SGLT1 while not affected GLUT2 (Lee et al. 2020). Therefore, not only GTE + GTP, but GTE + GTP + FVN could be a potential natural hypoglycemic agent by down-regulation of SGLT1. Further study on elucidating mechanism on inhibiting intestinal glucose transport should be conducted.
Conclusion
In conclusion, results from the current study found that flavonol-rich extracts derived from green tea combined with catechin rich extracts as secondary ingredients did not strongly promote the wheat starch hydrolysis. GTE, GTP and FVN mixture significantly decreased glucose transport rate through Caco-2 cells monolayer by 22.35% of wheat starch. The inhibitory effect of glucose transportation was being stronger when formulating flavonols mixture, M, Q, and K with major catechin, EGCG in GTE rather than formulating each flavonol component in FVN. To the best of our knowledge, it is the first finding that adding flavonols derived from green tea or single flavonol such as M, Q and K as excipient ingredients into catechin rich extract or major catechins delayed starch digestion and intestinal glucose uptake. The results suggest that hypoglycemic potential of catechin rich extracts could be fortified with flavonoid-rich fraction and polysaccharides, which are the secondary ingredients obtained during extraction of green tea catechins by delaying rapid glucose absorption. In further study, accurate inhibitory efficiency of α-amylase and α-glucosidase, in vivo study, and pharmacological manipulation of gene using whole green tea extract fractions should be conducted.
Supplementary information
Below is the link to the electronic supplementary material.
Acknowledgements
This research was supported by the AMOREPACIFIC
Abbreviations
- ANOVA
Analysis of variance
- AQ
Aqueous fraction from digesta
- CG
Catechin gallate
- COMT
Catechol-O-methyl transferase
- DPBS
Dulbecco’s Phosphate Buffered Saline
- EC
Epigallocatechin
- ECG
Epicatechin gallate
- EGC
Epigallocatechin
- EGCG
Epigallocatechin gallate
- FVN
Flavonol aglycone rich fractions derived from cellulase treated green tea extract
- GCG
Gallocatechin gallate
- GLUT2
Glucose transporter 2
- GTE
Catechin rich green tea extracts
- GTP
Green tea derived water-soluble polysaccharides
- HPLC
High performance liquid chromatography
- K
Kaempferol
- M
Myricetin
- MRP
Efflux transporters including multidrug resistance associated protein
- Q
Quercetin
- RO
Reverse osmosis
- SGLT1
Sodium dependent glucose transporter 1
- v
Volume
- v/v
Volume fraction
- w/w
Weight fraction
Author contributions
In this study, CJO, RCS, PMY, HYD, and SSM did conceptualize and supervise the experiment. LYE and YSH did in vitro study and formal analysis and writing original draft. LHJ, OJH did in vitro study. LYE and SSM did review & editing.
Funding
Not Applicable.
Declarations
Conflicts of interest
The authors declare no conflict of interest.
Footnotes
Publisher's Note
Springer Nature remains neutral with regard to jurisdictional claims in published maps and institutional affiliations.
Contributor Information
Yong-Deog Hong, Email: hydhong@amorepacific.com.
Soon-Mi Shim, Email: soonmishim@sejong.ac.kr.
References
- Additives EPOF, Food NSAT, Younes M, Aggett P, Aguilar F, Crebelli R, Dusemund B, Filipič M, Frutos MJ, Galtier P, Gott D. Scientific opinion on the safety of green tea catechins. EFSA J. 2018;16(4):e05239. doi: 10.2903/j.efsa.2018.5239. [DOI] [PMC free article] [PubMed] [Google Scholar]
- Ali Asgar M. Anti-diabetic potential of phenolic compounds: a review. Int J Food Prop. 2012;16(1):91–103. doi: 10.1080/10942912.2011.595864. [DOI] [Google Scholar]
- Azevedo MF, Lima CF, Fernandes-Ferreira M, Almeida MJ, Wilson JM, Pereira-Wilson C. Rosmarinic acid, major phenolic constituent of Greek sage herbal tea, modulates rat intestinal SGLT1 levels with effects on blood glucose. Mol Nutr Food Res. 2011;55(Suppl 1):S15–25. doi: 10.1002/mnfr.201000472. [DOI] [PubMed] [Google Scholar]
- Chai Y, Wang M, Zhang G. Interaction between amylose and tea polyphenols modulates the postprandial glycemic response to high-amylose maize starch. J Agric Food Chem. 2013;61(36):8608–8615. doi: 10.1021/jf402821r. [DOI] [PubMed] [Google Scholar]
- Choi EH, Rha CS, Balusamy SR, Kim DO, Shim SM. Impact of bioconversion of gallated catechins and flavonol glycosides on bioaccessibility and iIntestinal cellular uptake of catechins. J Agric Food Chem. 2019;67(8):2331–2339. doi: 10.1021/acs.jafc.8b05733. [DOI] [PubMed] [Google Scholar]
- Chung JO, Lee SB, Jeong KH, Song JH, Kim SK, Joo KM, Jeong HW, Choi JK, Kim JK, Kim WG, Shin SS, Shim SM. Quercetin and fisetin enhanced the small intestine cellular uptake and plasma levels of epi-catechins in in vitro and in vivo models. Food Funct. 2018;9(1):234–242. doi: 10.1039/c7fo01576c. [DOI] [PubMed] [Google Scholar]
- Chung JO, Yoo SH, Lee YE, Shin KS, Yoo SJ, Park SH, Park TS, Shim SM. Hypoglycemic potential of whole green tea: water-soluble green tea polysaccharides combined with green tea extract delays digestibility and intestinal glucose transport of rice starch. Food Funct. 2019;10(2):746–753. doi: 10.1039/c8fo01936c. [DOI] [PubMed] [Google Scholar]
- Engin SP, Mert C. The effects of harvesting time on the physicochemical components of aronia berry. Turk J Agric for. 2020;44:361–370. doi: 10.3906/tar-1903-130. [DOI] [Google Scholar]
- Fang JY, Lin CH, Huang TH, Chuang SY. In vivo rodent models of type 2 diabetes and their usefulness for evaluating flavonoid bioactivity. Nutrients. 2019;11(3):530. doi: 10.3390/nu11030530. [DOI] [PMC free article] [PubMed] [Google Scholar]
- Francini F, Schinella GR, Ríos JL. Activation of AMPK by medicinal plants and natural products: its role in type 2 diabetes mellitus. Mini-Rev Med Chem. 2019;19(11):880–901. doi: 10.2174/1389557519666181128120726. [DOI] [PubMed] [Google Scholar]
- Gecer MK, Kan T, Gundogdu M, Ercisli S, Ilhan G, Sagbas HI. Physicochemical characteristics of wild and cultivated apricots (Prunus armeniaca L.) from Aras valley in Turkey. Genet Resour Crop Evol. 2020;67:935–945. doi: 10.1007/s10722-020-00893-9. [DOI] [Google Scholar]
- Gonçalves C, Rodriguez-Jasso RM, Gomes N, Teixeira JA, Belo I. Adaptation of dinitrosalicylic acid method to microtiter plates. Anal Methods. 2010;2(12):2046–2048. doi: 10.1039/c0ay00525h. [DOI] [Google Scholar]
- Hara Y, Honda M. The inhibition of α-amylase by tea Polyphenols. Agric Biol Chem. 2014;54(8):1939–1945. doi: 10.1080/00021369.1990.10870239. [DOI] [Google Scholar]
- Karadag A, Dogan K, Pelvan E, Tas A, Eklioglu OA, Aksu S, Alasalvar C. α-Glucosidase inhibitory activities, functional properties, and safety of green tea polysaccharides as a potential source of dietary supplement. J Food Bioact. 2018;3:124–132. doi: 10.31665/jfb.2018.3155. [DOI] [Google Scholar]
- Kim JH, Kang MJ, Choi HN, Jeong SM, Lee YM, Kim JI. Quercetin attenuates fasting and postprandial hyperglycemia in animal models of diabetes mellitus. Nutr Res Pract. 2011;5(2):107–111. doi: 10.4162/nrp.2011.5.2.107. [DOI] [PMC free article] [PubMed] [Google Scholar]
- Lee YE, Yoo SH, Chung JO, Park TS, Park SH, Shim SM. Hypoglycemic effect of soluble polysaccharide and catechins from green tea on inhibiting intestinal transport of glucose. J Sci Food Agric. 2020;100(10):3979–3986. doi: 10.1002/jsfa.10442. [DOI] [PubMed] [Google Scholar]
- Liu J, Wang M, Peng S, Zhang G. Effect of green tea catechins on the postprandial glycemic response to starches differing in amylose content. J Agric Food Chem. 2011;59(9):4582–4588. doi: 10.1021/jf200355q. [DOI] [PubMed] [Google Scholar]
- Lo Piparo E, Scheib H, Frei N, Williamson G, Grigorov M, Chou C. Flavonoids for controlling starch digestion: structural requirements for inhibiting human α-amylase. J Med Chem. 2008;51(12):3555–3561. doi: 10.1021/jm800115x. [DOI] [PubMed] [Google Scholar]
- Miao M, Jiang H, Jiang B, Li Y, Cui SW, Zhang T. Structure elucidation of catechins for modulation of starch digestion. LWT Food Sci Technol. 2014;57(1):188–193. doi: 10.1016/j.lwt.2014.01.005. [DOI] [Google Scholar]
- Navarro DM, Abelilla JJ, Stein HH. Structures and characteristics of carbohydrates in diets fed to pigs: a review. J Anim Sci Biotechnol. 2019;10(1):1–17. doi: 10.1186/s40104-019-0345-6. [DOI] [PMC free article] [PubMed] [Google Scholar]
- Ong KC, Khoo HE. Effects of myricetin on glycemia and glycogen metabolism in diabetic rats. Life Sci. 2000;67(14):1695–1705. doi: 10.1016/S0024-3205(00)00758-X. [DOI] [PubMed] [Google Scholar]
- Peterson J, Dwyer J, Bhagwat S, Haytowitz D, Holden J, Eldridge AL, Beecher G, Aladesanmi J. Major flavonoids in dry tea. J Food Compos Anal. 2005;18(6):487–501. doi: 10.1016/j.jfca.2004.05.006. [DOI] [Google Scholar]
- Raja MM, Tyagi NK, Kinne RK. Phlorizin recognition in a C-terminal fragment of SGLT1 studied by tryptophan scanning and affinity labeling. J Biol Chem. 2003;278(49):49154–49163. doi: 10.1074/jbc.M306881200. [DOI] [PubMed] [Google Scholar]
- Rios JL, Francini F, Schinella GR. Natural products for the treatment of type 2 diabetes mellitus. Planta Med. 2015;81(12–13):975–994. doi: 10.1055/s-0035-1546131. [DOI] [PubMed] [Google Scholar]
- Senica M, Stampar F, Mikulic-Petkovsek M. Different extraction processes affect the metabolites in blue honeysuckle (Lonicera caerulea L. subsp. edulis) food products. Turk J Agric for. 2019;43:576–585. doi: 10.3906/tar-1907-48. [DOI] [Google Scholar]
- Shevkani K, Singh N, Bajaj R, Kaur A. Wheat starch production, structure, functionality and applications-a review. Int J Food Sci. 2017;52(1):38–58. doi: 10.1111/ijfs.13266. [DOI] [Google Scholar]
- Silva CP, Sampaio GR, Freitas R, Torres E. Polyphenols from guarana after in vitro digestion: evaluation of bioacessibility and inhibition of activity of carbohydrate-hydrolyzing enzymes. Food Chem. 2018;267:405–409. doi: 10.1016/j.foodchem.2017.08.078. [DOI] [PubMed] [Google Scholar]
- Sun L, Warren FJ, Gidley MJ. Soluble polysaccharides reduce binding and inhibitory activity of tea polyphenols against porcine pancreatic α-amylase. Food Hydrocoll. 2018;79:63–70. doi: 10.1016/j.foodhyd.2017.12.011. [DOI] [Google Scholar]
- Tadera K, Minami Y, Takamatsu K, Matsuoka T. Inhibition of α-glucosidase and α-amylase by flavonoids. J Nutr Sci Vitaminol. 2006;52(2):149–153. doi: 10.3177/jnsv.52.149. [DOI] [PubMed] [Google Scholar]
- Takahama U, Hirota S. Interactions of flavonoids with alpha-amylase and starch slowing down its digestion. Food Funct. 2018;9(2):677–687. doi: 10.1039/c7fo01539a. [DOI] [PubMed] [Google Scholar]
- Williamson G. Possible effects of dietary polyphenols on sugar absorption and digestion. Mol Nutr Food Res. 2013;57(1):48–57. doi: 10.1002/mnfr.201200511. [DOI] [PubMed] [Google Scholar]
- World Health Organization (2018) Global health estimates 2016: disease burden by cause, age, sex, by country and by region, 2000–2016. Geneva: World Health Organization. https://www.who.int/news-room/fact-sheets/detail/diabetes
- World Health Organization (2019) Classification of diabetes mellitus. Geneva: World Health Organization. https://apps.who.int/iris/handle/10665/325182
Associated Data
This section collects any data citations, data availability statements, or supplementary materials included in this article.