Abstract
To measure stomatal traits automatically and nondestructively, a new method for detecting stomata and extracting stomatal traits was proposed. Two portable microscopes with different resolutions (TipScope with a 40× lens attached to a smartphone and ProScope HR2 with a 400× lens) are used to acquire images of living stomata in maize leaves. FPN model was used to detect stomata in the TipScope images and measure the stomata number and stomatal density. Faster RCNN model was used to detect opening and closing stomata in the ProScope HR2 images, and the number of opening and closing stomata was measured. An improved CV model was used to segment pores of opening stomata, and a total of 6 pore traits were measured. Compared to manual measurements, the square of the correlation coefficient (R 2) of the 6 pore traits was higher than 0.85, and the mean absolute percentage error (MAPE) of these traits was 0.02%–6.34%. The dynamic stomata changes between wild‐type B73 and mutant Zmfab1a were explored under drought and re‐watering condition. The results showed that Zmfab1a had a higher resilience than B73 on leaf stomata. In addition, the proposed method was tested to measure the leaf stomatal traits of other nine species. In conclusion, a portable and low‐cost stomata phenotyping method that could accurately and dynamically measure the characteristic parameters of living stomata was developed. An open‐access and user‐friendly web portal was also developed which has the potential to be used in the stomata phenotyping of large populations in the future.
Keywords: living stomata, stomata detection, pore segmentation, stomatal density, pore traits, improved CV model, deep learning
Introduction
Maize (Zea mays L.) is one of the three most important crops. The stomata of maize leaves are formed by specialized epidermal cells that act as a main channel for gas exchange between the interior and external environments of maize plants (Wagner et al., 2011). Leaf stomata play an important role in the regulation of the carbon and water cycles during maize plant growth and affect the strength of transpiration and photosynthesis of maize plants (Hepworth et al., 2018; Qu et al., 2017). Measuring stomatal traits, including the number of stomata, pore shape and stomata distribution, is important in the research on maize cultivation, yield growth and stress resistance (Bertolino et al., 2019; Rudall et al., 2013; Zarinkamar, 2007).
The stomata imaging can be included two types: destructive and nondestructive. The most traditional method of stomata imaging is blotting, belonging to destructive, which the stomatal morphology is fixed with a fixator for observation with a microscope (Gitz and Baker, 2009; Iodibia et al., 2017). In recent years, some works have been done to improve these traditional methods. Eisele et al. (2016) used Rhodamine6G to pre‐stain the leaves and combined with the method of protoplast isolation, which not only did not influence the closing or opening of stomata, but also simplified the measurement of stomatal traits. Bourdais et al. (2019) used the spinning disc automated Opera microscope to image the leaves on 96‐well plates, which had a high imaging efficiency. Millstead et al. (2020) mounted the imprint on the microscope slide to improve the common nail polish imprint method, which could reduce any unevenness of the leaf imprint and allow shallow depth‐of‐field sensors to keep larger areas of the sample in focus. Although images acquired by traditional methods are clear, these methods are time‐consuming, vulnerable to human error and destructive to plant leaves. The other stomata imaging method is nondestructive, such as acquiring images of living leaf by Keyence VHX‐200 (Song et al., 2020) or by a portable microscopy 3R‐MSUSB601 (Sun et al., 2021). This method can achieve higher imaging efficiency with no need to prepare samples. However, the images acquired by this method are lower quality than the destructive method.
With the development of computer vision, image processing technology has been widely used in detecting stomata and measuring the stomatal size of plant leaves. Sanyal et al. (2008) studied the stomatal morphological features of different tomato cultivars based on scanning electron microscopy (SEM) images. They used a watershed algorithm and morphological processing to separate a single stoma from other neighbouring stomata and measured the area, centre of gravity and compactness of the single stoma. Laga et al. (2014) used template matching to detect individual stomatal cells and local analysis to measure the stomatal features of wheat, but the template they used was not suitable for other crops. Liu et al. (2016) applied maximum stable external regions (MSERs) to measure the pore size of vine leaf stomata and developed a smartphone‐based system. Jayakody et al. (2017) developed a cascade object detection learning algorithm to identify multiple stomata and combined segmentation and skeletonization with the ellipse fitting techniques to measure stomatal pore openings in microscopic images of grapevines. Zhu et al. (2018) used the object‐oriented method of the eCognition software to extract the stomata of plant leaves. However, the detection accuracy of these threshold‐based image processing methods was vulnerable to the contrast of the images (Li et al., 2019). Nassuth et al. (2021) calculated stomatal density and stomatal index of leaves of different grape species based on ImageJ software. The results showed that stomatal parameters were significantly affected by species or cultivar and growing conditions. Li et al. (2019) developed a stomatal segmentation method based on the Chan‐Vese (CV) model for single stoma images of different plants. The CV model was superior to the existing traditional image processing methods, such as the threshold and skeletonization methods, in terms of versatility.
Currently, deep learning algorithms are used for object detection and not only perform well in agricultural macro phenotyping but also have broad application prospects in micro phenotyping, such as for stomata detection in plant leaves (Aono et al., 2019; Higaki et al., 2014). Vialet‐Chabrand and Brendel (2014) used the cascade classifier to identify and extract the coordinates of oak stomata and characterized the clustering of stomata with the expectation maximization (EM) algorithm. Sakoda et al. (2019) used the single‐shot multibox detector (SSD) to automatically detect soybean stomata. Bhugra et al. (2019) compared several existing stomatal feature detection methods (Bhugra et al., 2018) and proposed an automated pipeline leveraging deep convolutional neural networks for the stomata phenotyping of plant leaves based on SEM images with low contrast. Toda et al. (2018) developed a program called ‘DeepStomata’ for the automatic measurement of the stomatal diameter. Fetter et al. (2019) developed the ‘StomataCounter’ tool to detect stomata in different microscopic images. Casado‐García et al. (2020) developed ‘LabelStoma’, an open‐source and simple‐to‐use graphical user interface that employs the YOLO model. Andayani et al. (2020) used the convolutional neural network (CNN) method to identify Curcuma plant stomata, with the Gabor filter algorithm to preprocess microscopic images and the grey‐level cooccurrence matrix to extract features. Meeus et al. (2020) used a deep neural network for stomata detection in 35 species. Jayakody et al. (2021) proposed a methodology to detect stomata for a wide variety of plant type combinations of an FPN‐backed mask RCNN with a statistical filter algorithm. The Mask RCNN algorithm was also used to detect the stomata of citrus and black polar plants (Costa et al., 2020; Song et al., 2020). Recent works on leaf stomata detection based on deep learning are listed in Table S1. However, based on the microscopes used in the laboratory, most of these methods are destructive because stomatal imprints were peeled off from plant leaf surface and mounted on glass slides for observation; hence, high‐throughput and nondestructive phenotyping of leaf stomatal traits is urgently needed.
In this study, a StomataScorer installed with two portable and high‐throughput microscopy devices was developed for acquiring leaf stomata images with different image resolutions (~6 and ~1.5 μm/pixel). An image analysis pipeline was implemented for extracting the number of stomata and stomatal pore traits by combining deep learning (Faster RCNN and FPN) with an improved CV model. In addition, the proposed method was tested to monitor the stomata change of drought response and also can be applied to measure the leaf stomatal traits of other species. Studying stomatal traits of plant leaf through the whole growth stage could explore the plant response mechanism to environmental changes.
Results
The stomatal traits measurement pipeline
In this study, two portable microscopes (TipScope, Kenweijiesi Wuhan Technology Co., Ltd, Wuhan City, China and ProScope HR2, Bodelin Technology Co., Ltd, Oregon City, OR, USA) were used to measure the living stomatal traits of maize. The images acquired by TipScope had a large field of view (4608 × 3456 pixels) and relatively lower resolution (~6 μm/pixel). A stomata detection model based on the FPN algorithm was established to measure the number of stomata and stomatal density. TipScope image processing for extracting stomata number was shown in Figure 1a–f.
Figure 1.
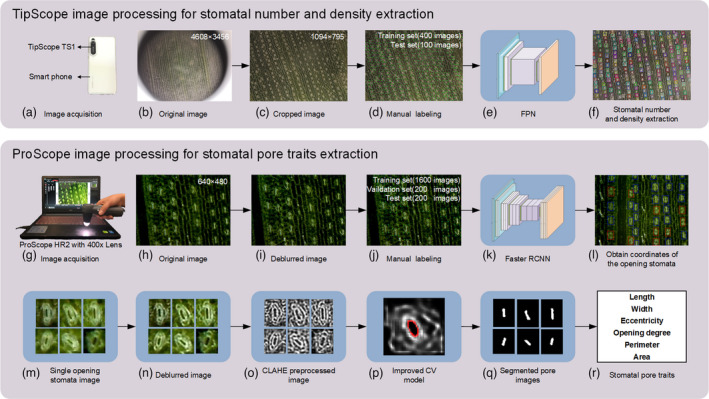
Stomatal traits measurement pipeline. (a–f) The stomata number and stomatal density extraction pipeline for the images acquired by TipScope. (g–r) The stomatal traits extraction pipeline for the images acquired by ProScope HR2.
Compared to TipScope, the images acquired by ProScope HR2 had a small field of view (640 × 480 pixels) and relatively higher resolution (~1.5 μm/pixel). A dual‐object detection model based on the Faster RCNN was established to detect opening stomata and closing stomata. The number of opening stomata, number of closing stomata and the ratio of opening stomata number to total stomata number were obtained (Figure 1l). For the opening stomata, an image analysis pipeline was proposed to automatically segment and measure the pore traits for living stomata based on an improved CV model. ProScope image processing for extracting stomatal pore traits was shown in Figure 1g–r. The operating procedure for stomatal trait extraction is provided in Video S1. The main instructions of the stomatal trait extraction are shown in Note S1.
Detection accuracy of stomata number based on a single‐object detection model using images acquired by TipScope
Detecting the stomata number dynamically would enable the evaluation of the physiological status of maize leaves. In this study, a single‐object detection model using images acquired by TipScope was established based on the FPN algorithm. The results of stomata detection based on the FPN model are shown in Figure 2b. Two hundred images were used to validate the model, and the detection precision, recall, accuracy and F‐score were 1.00, 0.99, 99% and 0.99 respectively. The stomata number was determined, and the square of the correlation coefficient (R 2) value and the mean absolute percentage error (MAPE) of the automatic measurement versus manual measurement were 0.99 and 1.03% respectively (Figure 2c).
Figure 2.

Results of stomata detection and the stomata number. (a) The cropped original image. (b) The stomata detection results. (c) The scatter plots of the automatic measurement versus manual measurement of the number of stomata.
Detection accuracy of the dual‐object detection model using images acquired by ProScope HR2
The stomatal status (opening or closing) was vulnerable to the changes of the environment. In this study, a dual‐object detection model was established based on the Faster RCNN algorithm for images (Figure 3a) acquired by ProScope HR2. The results of stomata detection based on the Faster RCNN model are shown in Figure 3b, where the red box indicates opening stomata and the blue box indicates closing stomata. Two hundred images were used to validate the model. The detection precision, recall, accuracy and F‐score for opening stomata were 1.00, 0.97, 97% and 0.98 respectively. The detection precision, recall, accuracy and F‐score for closing stomata were 0.96, 0.97, 93% and 0.96 respectively. Compared to manual measurements, the R 2 and MAPE for the number of opening stomata were 0.99 and 2.93% respectively (Figure 3d); the R 2 and MAPE for the number of closing stomata were 0.98 and 5.95% respectively (Figure 3e); and the R 2 and MAPE for the ratio of opening stomata number to total stomata number were 0.98 and 3.27% respectively (Figure 3f).
Figure 3.
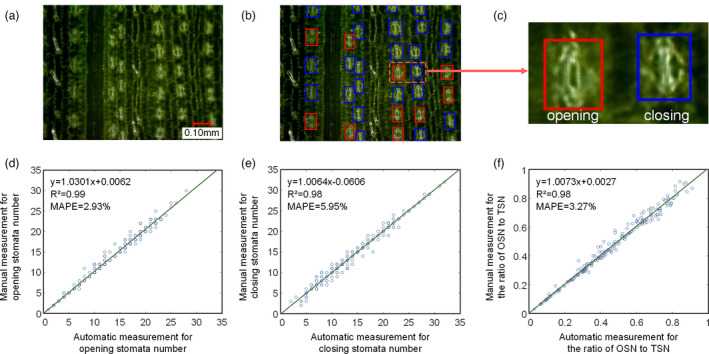
Results of stomata detection based on the dual‐object detection model. (a) The original image. (b) The stomata detection results, where the red box is for opening stomata and the blue box is for closing stomata. (c) An opening stoma and a closing stoma. (d–f) The scatter plots of the automatic measurement versus manual measurement of the number of opening stomata (d), number of closing stomata (e) and the ratio of opening stomata number to total stomata number (f).
Measurement accuracy of pore traits
The pore shape of the opening stoma reflects the strength of gas exchange between the interior of the leaf and the external environment. In this study, two hundred images with a single stoma were analysed. Compared to manual measurements, the R 2 for the pore length, pore width, pore eccentricity, pore opening degree, pore area and pore perimeter ranged from 0.85 to 0.96, and the MAPE for the pore length, pore width, pore eccentricity, pore opening degree, pore area and pore perimeter ranged from 0.02% to 6.34% (Figure 4a–f).
Figure 4.
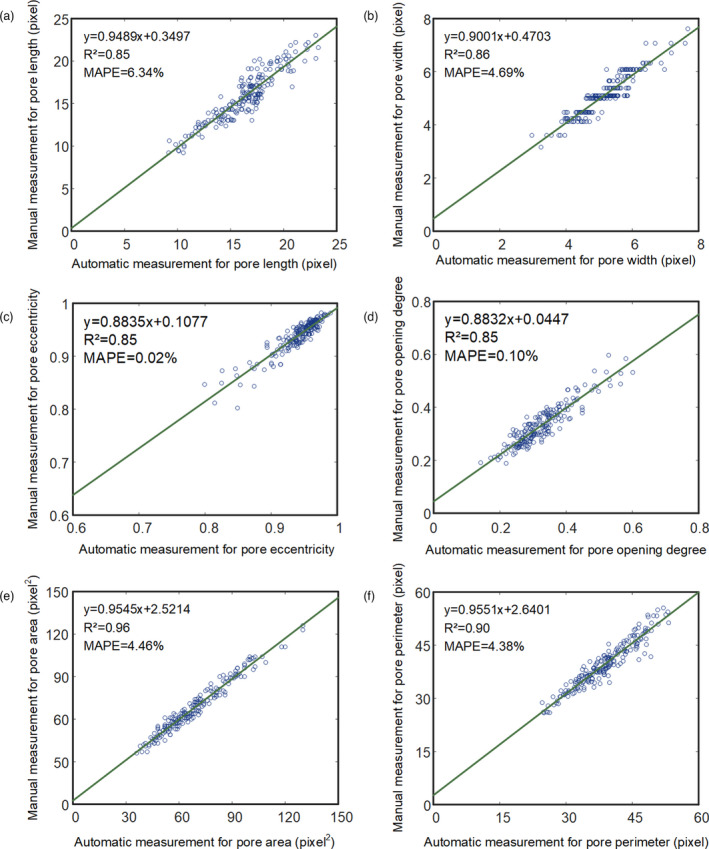
Scatter plots of the automatic measurements versus the manual measurements of pore traits, including the pore length (a), pore width (b), pore eccentricity (c), pore opening degree (d), pore area (e) and pore perimeter (f).
Measurement efficiency
In this study, two portable microscopes were used to measure stomatal traits, both of which acquire stomata images directly from living leaves. A total of 500 TipScope images were used to evaluate the performance of FPN model, and it took about 42 s. That is the average time for measuring the stomata number in each TipScope image was approximately 0.084 s.
There was no need to preprocess the samples, and the time to acquire one image was approximately 5–10 s by ProScope HR2. A total of 500 ProScope images were used to evaluate the performance of Faster RCNN model and pore segmentation algorithm, and it took about 40 min. That is the average time for detecting opening/closing stomata, segmenting pores of opening stomata and measuring stomata traits was approximately 4.8 s (Windows 10 environment, MATLAB 2019a, 3.4 GHz CPU, 64.0 GB of RAM). Thus, the total time consumption for extracting all stomata traits for each leaf was approximately 10–15 s.
EXE software and open‐access web portal for stomatal trait extraction
The software interface of EXE software was illustrated in Figure 5a. The original colour image, the stomata detection results image, the mask image, stomatal traits and the image ID were displayed on the interface. The software included three main parts: stomata detection, pore segmentation and stomatal traits extraction which were carried out simultaneously based on multithread technique. It could process a batch of images in one folder and displayed the stomatal traits on the interface and also saved the traits in the predefined Excel file. The software could work in two modes: one‐key operation and step‐by‐step operation. In the one‐key operation mode, users could obtain all stomatal traits after clicked ‘One‐Button Start’ button. In the step‐by‐step operation mode, users could obtain stomata number, opening or closing stomata number after clicked ‘Stomata Detection’ button and obtained pore traits after clicked ‘Pore Segmentation’ button. The software operation procedure of the maize leaf stomata detection and pore segmentation was shown in Video S2. The whole program was packaged as an EXE executable software using PyInstaller software. The EXE executable software could be installed on other computer without the need to configure a deep learning environment.
Figure 5.
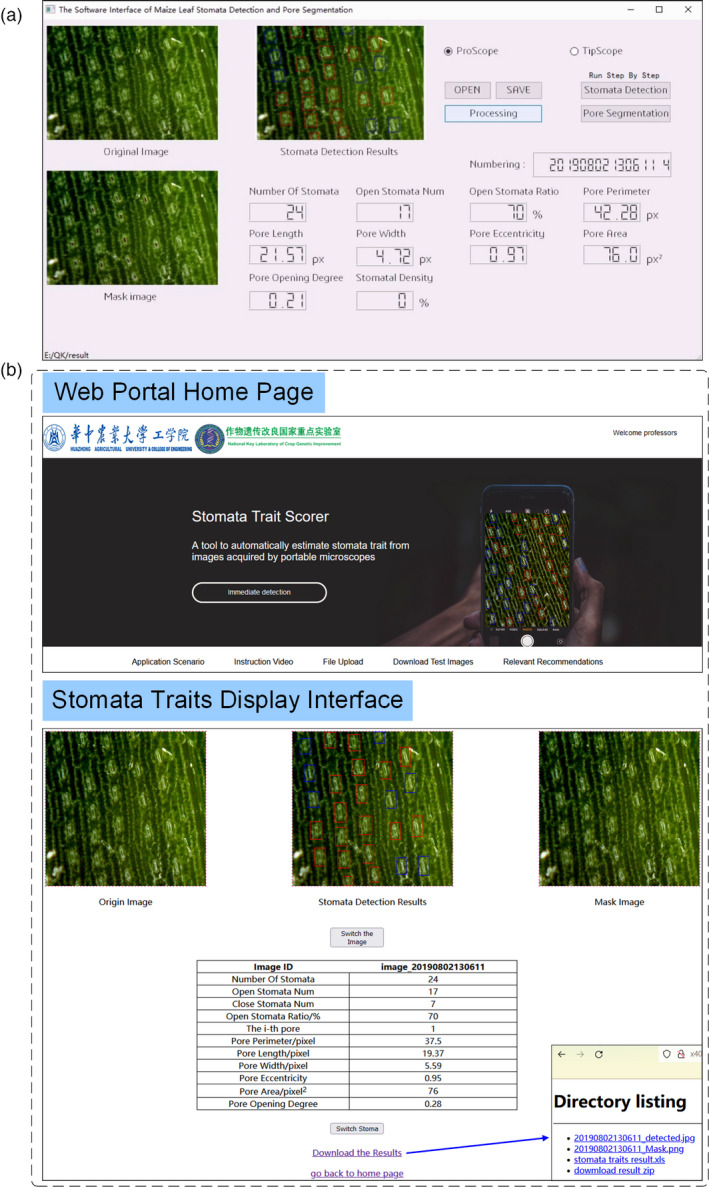
Software interface of EXE software and the open‐access web portal. (a) The software interface of the EXE executable software which was packaged with the whole program by PyInstaller software. (b) The open‐access web portal to extract stomatal traits.
A user‐friendly web portal was also developed for stomatal researchers around the world to easily use the method to extract stomatal traits. The webserver was available at http://x40833180q.zicp.vip. To use the Stomatascorer, users upload single.jpg image or a zip file of their.jpg images. Then, the image of stomata detection results, mask image and stomatal traits were returned which were displayed on the web interface (Figure 5b) and saved in which users could download them. The web portal operation procedure was shown in Video S3. The detailed information for developing web portal was shown in File S1.
The dynamic process of wheat and maize leaf pore from closing to opening
To observe the dynamic process of pore from closing to opening, the images of maize leaf were acquired continually from 0 AM to 2 PM on 26 July 2021 and the images of wheat leaf continually from 0 AM to 2 PM on 18 April 2021 respectively. The image acquisition equipment and the parts of images were shown in Figure 6. The movies of the dynamic process of wheat leaf pore and maize leaf pore were shown in the Video S4 and S5 respectively.
Figure 6.

Image acquisition equipment (ProScope HR2) and the parts of stomata images. (a) The image acquisition equipment. (b) Parts of stomata images.
Leaf stomatal traits to reflect drought response among B73 and mutant Zmfab1a
Stomatal traits were also used to explore the differences of drought response between B73 wild‐type and Zmfab1a mutant (Figure S1) (Wu et al., 2021) under well‐watered (WW) and drought‐stressed (DS) conditions. The important role of Zmfab1a was found to regulate maize photosynthesis, WUE and drought tolerance in our previous work (Wu et al., 2021).
Stomatal traits were extracted, and the ratio of opening stomata number to total stomata number, total pore areas, pore opening degree and single pore area were used to explore the different drought response between B73 and Zmfab1a. The results were shown in Figure 7, and the results with error arrange were shown in Figure S2. The average of the 4 stomatal traits of 4 days were calculated which the ratio of opening stomata number to total stomata number, and the total pore areas showed significant differences (** means P < 0.05 and *** means P < 0.01, Figure 7c) and the other two were not significant. From Figure 7c, the ratio of opening stomata number to total stomata number and the total pore area of B73 were higher than Zmfab1a under WW condition and had the negative results under DS condition. This was consistent with the results described in the literature by Wu et al. (2021). The values of DS/WW of the 4 traits for B73 and Zmfab1awere calculated respectively (Figure 7d). The results showed that the ratio of opening stomata number to total stomata number and the total pore area of Zmfab1a were higher than B73 under DS condition and after re‐watering, which indicated that Zmfab1a had a higher resilience than B73 on leaf stomata.
Figure 7.
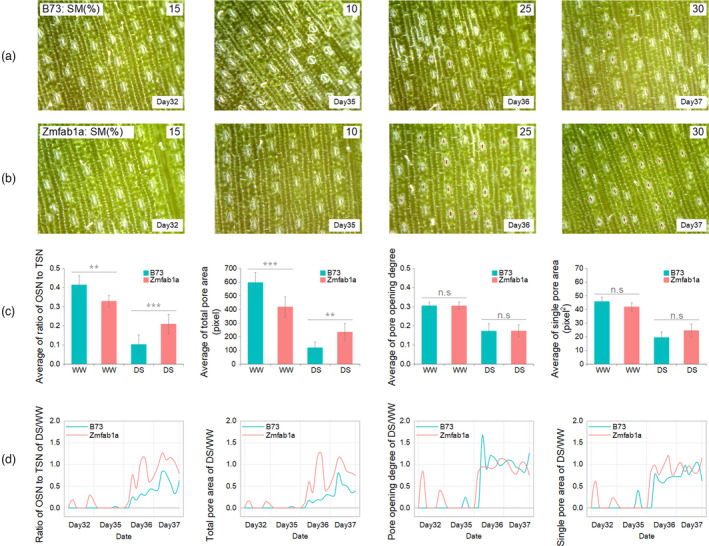
Dynamic stomata response of wild‐type B73 and mutant Zmfab1a under well‐watered (WW) and drought‐stressed (DS) conditions. (a) The stomata images of B73 wild type on D32, D35, D36 and D37 with the soil moisture content of 15%, 10%, 25% and 35% respectively. (b) The stomata images of Zmfab1a mutant plants on D32, D35, D36 and D37 with the soil moisture content of 15%, 10%, 25% and 35% respectively. (c) The mean value of 4 days for the 4 stomatal traits (the ratio of opening stomata number (OSN) to total stomata number (TSN), total pore area, pore opening degree, single pore area) for B73 and Zmfab1a on well‐watered and drought‐stressed condition respectively. Statistical significance was determined by Student’s test: **P < 0.05; ***P < 0.01. (d) The change curve of DS/WW of the 4 traits for B73 and Zmfab1a during 4 days respectively.
Discussion
Performance of the improved CV model for pore segmentation
In this study, a fast, nondestructive and accurate stomata detection method was proposed. The segmentation method proposed by Li (Li et al., 2005) was used to segment pores of the stomata images of maize leaves acquired by ProScope, and the results are shown in Figure 8d. The grey‐level images segmented with the CV model were preprocessed with the Lucy–Richardson deblurred method and contrast‐limited adaptive histogram equalization (CLAHE) method. The results of clear images with high contrast between the pores and other regions were satisfactory. However, the pores of the blurred images could not be segmented. Observing the procedure of the segmentation method, each pore was segmented at the beginning of each iteration. However, with the increase in the number of iterations, the pores became connected to the other areas (Figure 8d), because of which the pores could not be extracted effectively. Based on the CV model proposed by Li et al. (2005), an improved CV model was proposed to segment pores of the stomata images, the results of which are shown in Figure 8c. The results showed that the improved CV model could segment pores effectively from both clear images and blurred images. The dynamic process of pore segmentation based on the improved CV model was shown in the Video S6.
Figure 8.
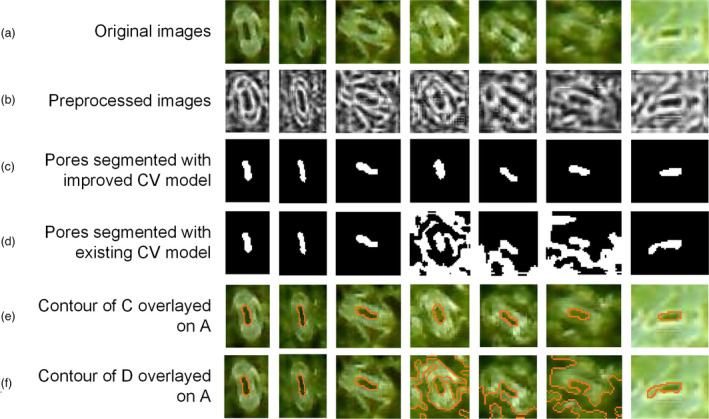
Pore segmentation of a single stoma image of the improved CV model vs Li’s CV model. (a) Original stoma images. (b) Preprocessed grey‐level image obtained with the Lucy–Richardson algorithm and CLAHE. (c) The pores segmented with the improved CV model. (d) The pores segmented with existing CV model. (e) The contour of C overlayed on the original images. (f) The contour of D overlayed on the original images.
Performance evaluation of the improved CV model for segmenting pores of small opening and blurred stomata
To verify the performance of the segmentation method based on the improved CV model, our method was used to segment 16 microscope images from the literature (Li et al., 2019). These included images with nonuniform illumination that require reflection removal before segmentation by the corresponding method and images with blurred stomata, stomata with too small of an opening, and obscured stomata that failed according to the corresponding method. The segmented results of each are shown in Figure 9. From Figure 9a, the images with nonuniform illumination were segmented successfully by the improved CV model segmentation method without reflection removal. From Figure 9b,c, most of the images discarded in the literature (Li et al., 2019) were segmented successfully in this work, which proved that the method used in this study is suitable not only for images of different resolutions but also for stomata with small openings and blurred stomata.
Figure 9.
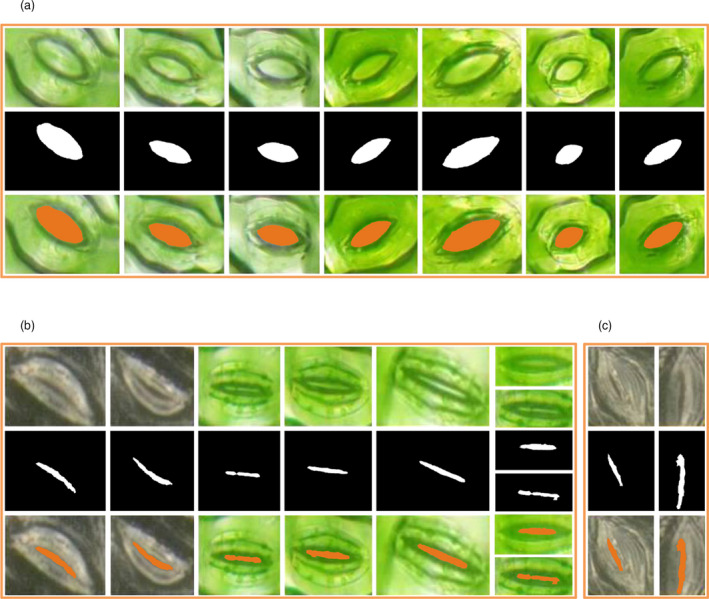
Results of stomatal pore segmentation by our method for images from the literature by Li et al. (2019). (a) Without reflection removal. (b) Stomata with small opening degree. (c) Blurred stomata.
Performance evaluation of the improved CV model for segmenting pores of other species
To estimate the feasibility of the pore segmentation method based on the improved CV model, other nine species, such as wheat, rice, rapeseed, lettuce, tobacco, potato, broad bean, cotton and soybean, were used. The segmented results are shown in Figure 10a–i, which show that the pore segmentation method is flexible and could be extended to other species. In addition, the costs of TipScope with a smartphone (~300 dollars) and ProScope (~1000 dollars) were reasonable, which means that if multiple sensor arrays were installed, the presented method could potentially be extended to the phenotyping of dynamic stomatal changes for large populations in the future.
Figure 10.
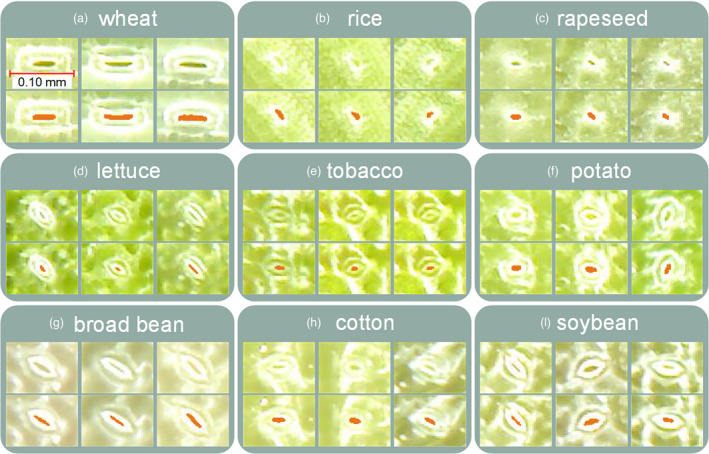
Results of stomatal pore segmentation for different crops: (a) wheat; (b) rice; (c) rapeseed; (d) lettuce; (e) tobacco; (f) potato; (g) vicia faba; (h) cotton; (i) glycine max.
In the future work, to provide more stomatal traits with higher efficiency, automatically cropping clear image from original blurred image and extracting stomata closure traits will be developed. Other imaging sensors, such as hyperspectral imaging, and environmental sensors, such as temperature, humidity and illumination intensity, will be integrated to simultaneously provide more leaf stomatal traits and environmental factors and promote the study of phenotype–environment interaction of different genotypes.
Conclusions
In this study, based on two portable microscopes (TipScope and ProScope HR2) equipped with different magnification lenses and used to extract living stomata images, StomataScorer, an image analysis pipeline to extract the stomata number, was developed to detect opening or closing stomata, and extract 6 stomatal pore traits with deep learning (Faster RCNN and FPN) and improved the CV model. Compared with manual measurements, the R 2 of these traits was higher than 0.85. The dynamic stomata change between wild‐type B73 and mutant Zmfab1a was explored under drought and re‐watering condition. The results showed that Zmfab1a had a higher resilience than B73 on leaf stomata. In addition, the proposed method was tested to measure the leaf stomatal traits of other species. The stomata image analysis pipeline was open‐access and was packaged to an EXE software and could be accessed through free‐use web portal. In conclusion, a portable and low‐cost stomata phenotyping method was proposed that could accurately and dynamically measure the characteristic parameters of living stomata and has the potential to be used in the stomata phenotyping of large populations in the future.
Materials and methods
Materials
From July to October 2019, maize leaf stomata image acquisition experiments were carried out at the Huazhong Agricultural University Crop Phenotyping Center (Wuhan, China). Two different maize accessions, that is inbred lines TY6 and 7381, were used. All plants were planted in pots, and the soil was dried in the sun, crushed and sieved to remove stones. Each pot was 30 cm high and 23 cm in diameter and could hold 15 kg of soil. Fertilizers were made of urea, potassium dihydrogen phosphate and potassium chloride at a ratio of 4:3:1.
Maize lines of wild‐type B73 and mutant Zmfab1a were used to explore drought response based on stomatal traits. Zmfab1a is an ethyl methanesulfonate (EMS) mutant based on B73, and its wild type is Zmfab1a. Wild‐type B73 and mutant Zmfab1a with 2 treatments were planted in the pots in Crop Phenotyping Center, Huazhong Agricultural University, China. Seeds were sown directly in pots with 5 kg soil on 26 May 2021. From the 6‐leaf stage (D27), the DS group was stopped irrigation, the WW group was watering normally, and the soil moisture (SM) was measured by a DELTA‐T Soil moisture Kit (Delta‐T Devices Ltd., UK). From the 9‐leaf stage (D36), the DS group was watering normally. Microscopic images of all maize plants using ProScope HR2 microscope were acquired on D32, D35, D36 and D37 respectively. The average SM of drought‐stressed group on D32, D35, D36 and D37 was 15%, 10%, 25% and 35% respectively (Figure 7a,b). The images were acquired 6 times per day from 8 AM to 18 PM with an interval of 2 h.
Image acquisition
When 6 leaves were fully expanded, stomata image acquisition of the top three leaves was initiated with the TipScope portable mobile phone microscope and the ProScope HR2 portable microscope every three days. The images were acquired from the middle part of the abaxial leaf surface, and the acquisition time was from 11:30 AM to 13:30 PM.
TipScope: portable mobile phone microscope
The TipScope portable mobile phone microscope (defined as TipScope, Figure 1a) was constructed with TipScope (Kenweijiesi (Wuhan) Technology Co., Ltd) attached to the camera of the HUAWEI Honor 10 mobile phone (Huawei Technology Co., Ltd, Shenzhen City, China). The images acquired with this microscope have a resolution of 4608 × 3456 pixels and ~6 μm/pixel. For each pot‐grown maize plant, the top three leaves and one middle part of each abaxial leaf surface were chosen to obtain the stomata images. The images were obtained every three days, and a total of 21 time points were acquired. Finally, a total of 1512 images were acquired for stomata number extraction.
ProScope HR2: portable microscope
The ProScope HR2 portable microscope (defined as ProScope HR2, Bodelin Technology Co., Ltd, Figure 1g) was composed of a ProScope HR2 with a 400× lens. The images (Figure 1h) acquired with this microscope have a resolution of 640 × 480 pixels and ~1.5 μm/pixel. For each pot‐grown maize plant, the top three leaves and three middle parts of the abaxial surface of each leaf were chosen to obtain the stomata images. The images were obtained every three days, and a total of 21 time points were acquired, yielding a total of 4536 images for further image analysis and pore trait extraction.
Stomata number extraction using the images acquired by TipScope
The flow chart of stomata number extraction using the images acquired by TipScope is shown in Figure 1a–f. (a) Sketches were cropped in the middle of the original images acquired by TipScope (Figure 1b). The size of each sketch was 1094 × 795 pixels (Figure 1c). (b) The sketches were labelled manually, and the TFRecord data set was generated (Figure 1d). (c) The object detection model based on the FPN algorithm was trained using the TFRecord data set, and the evaluation indexes were calculated. (d) If the evaluation indexes did not meet the required accuracy, the model was trained again using augmented data and tuned model parameters until the evaluation indexes met the required accuracy. (e) New images were acquired, and stomata were detected using the final object detection model based on the FPN algorithm. (f) The detected stomata were counted, and the stomatal density was calculated using the stomata number divided by the area of the image (Figure 1f).
Data annotation
Maize living leaf is not flat, and excessive pressure will cause blade damage. In addition, the image acquisition is sensitive to the depth of views. So, part of stomata in image are blurred (Note S1) and a fixed size of ROI with clear stomata should be cropped from the original image. In this study, the middle part (7 mm × 5 mm, 1094 pixel × 795 pixel, Figure 2a) with clear stomata between the adjacent veins of maize leaf was manually cropped from the original image (4608 pixel × 3456 pixel) using Photoshop (Adobe Systems Incorporated, San Jose, CA, USA). Then from 1512 TipScope images, a total of 500 cropped images were randomly chosen and labelled. Every individual stoma was labelled with a minimum rectangular bounding box on the LabelImg platform (Tzutalin, 2015). If the stomata were at the border of the image, those stomata whose area exceeded 1/2 of the whole stomatal area would be labelled; otherwise, they would not be labelled. All labelled images were saved in XML format, which contained the coordinates of the annotated bounding boxes. The labelled files and original images were used to made up the TFRecord data set, and the ratio of the training data set to the test data set was 8:2.
Object detection model based on the FPN algorithm
An object detection model based on the idea of a feature pyramid in a feature pyramid network (FPN) was established, the whole process of which is shown in Figure 11. The FPN not only exploited the inherent multiscale, pyramidal hierarchy of deep convolutional networks to calculate strong semantic features efficiently but also extracted feature maps with rich semantic information via a top‐down pathway, bottom‐up pathway and lateral connections (Lin et al., 2017). The FPN algorithm was advantageous for detecting small objects.
Figure 11.
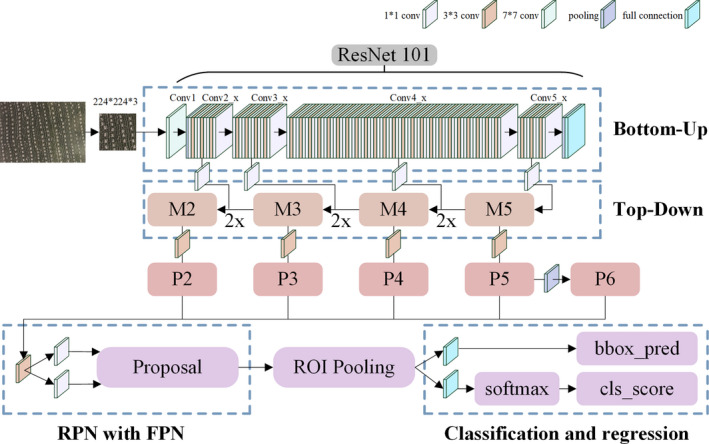
FPN network structure.
The experiment was based on the Ubuntu operating system, and the graphics processing unit (GPU) was an NVIDIA 1660 Ti (6 GB of graphic memory), while the central processing unit (CPU) was an Intel Core i7‐8700 (8 GB of memory). The open‐source code of the FPN detection algorithm was based on the TensorFlow framework and can be accessed at https://github.com/yangxue0827/FPN_Tensorflow.git. The major hyperparameter settings included learning rate of 0.001 and iterations of 100 000. The TFRecord data set was made from the TipScope stomata microscopic images.
Stomatal trait extraction using the images acquired ProScope HR2
The flow chart of pore trait extraction using the images acquired by ProScope HR2 is shown in Figure 1g–r. (a) The images obtained after deblurring (Figure 1i) the original images acquired by ProScope HR2 were labelled with three classes: opening stoma, closing stoma and the background (Figure 1j). For the generated VOC data set, the size of each image was 640 × 480 pixels. (b) The dual‐object detection model based on the Faster RCNN algorithm was trained using the VOC data set, and the evaluation indexes were calculated. (c) If the evaluation indexes did not meet the required accuracy, the model was trained again using augmented data and tuned model parameters until the evaluation indexes met the required accuracy. (d) The final dual‐object detection model was established based on the Faster RCNN algorithm (Figure 1k). (e) The opening stomata and closing stomata were counted, and the ratio of opening stomata number total stomata number was calculated. The coordinates of the minimum rectangular bounding box of the opening stomata were also obtained (Figure 1l). (f) A single opening stoma was extracted from the original image (Figure 1m), and the single stoma image was preprocessed with the Lucy–Richardson and CLAHE algorithms (Figure 1n,o). (g) The pores were segmented using the improved CV model (Figure 1p,q) and fitted elliptically. Then, the MajorAxisLength of each ellipse was defined as the pore length and the MinorAxisLength of each ellipse was defined as the pore width. The pore eccentricity and pore opening degree were calculated using Equation 1 and Equation 2 (Li et al., 2019) respectively. The area and perimeter of the pores were also calculated. All these pore traits (Figure 1r) were saved in the specified Excel file.
| (1) |
| (2) |
where a represents the MajorAxisLength of the ellipse, that is the pore length and b represents the MinorAxisLength of the ellipse, that is the pore width.
Data set
From 4536 ProScope images, a total of 500 images, which contained both opening stomata and closing stomata, were chosen and labelled. On the LabelImg platform, we annotated the opening stomata and the closing stomata with the minimum rectangular bounding boxes, and the incomplete stomata at the edge of the image were not annotated. All labelled images were saved in XML format, which contained the coordinates of the annotated bounding boxes. Then data augmentation methods such as flipping, Gaussian filtering and brightness changes were used to increase the number of labelled images to 2000. The labelled files and original images were used to made up the VOC data set and the training data set to the test data set to the validation data set was 8:1:1.
Image preprocessing
Because the maize leaves were uneven and the field depth of ProScope HR2 was insufficient, the stomata images were blurred, which affected the accuracy of opening stomata detection. Therefore, it was necessary to deblur the stomata images before establishing the dual‐object detection model. In this study, we used the Lucy–Richardson algorithm (Fang et al., 2020; Richardson, 1972) to deblur the stomata images, and the optimal number of iterations was 5. The contrast between the pore and guard cells of the stomata images was low, which affected the pore segmentation accuracy. CLAHE is an image enhancement technique that was originally developed for the enhancement of low‐contrast medical images (Thamizharasi and Jayasudha, 2016). In this study, the grey‐level image after deblurring was divided into 8 × 8 contextual regions, calculated the histogram of the pixels contained in each contextual region and then optimized the regions. Then, a bilinear interpolation algorithm was used to avoid visibility of the region boundaries between the contextual regions. The contrast enhancement was limited to 0.01.
Dual‐object detection model based on the faster RCNN algorithm
In this study, to obtain the coordinates of the opening stomata, a dual‐object (opening stomata and closing stomata) detection model was established based on the Faster RCNN algorithm, which combines the RPN and Fast RCNN (Ren et al., 2017). The Faster RCNN algorithm is mainly composed of four parts: convolutional layers that extract image feature maps, a region proposal network that generates region proposals, ROI pooling that integrates feature maps and region proposals into proposal feature maps, and classification that uses the proposal feature maps to calculate the category of the proposal and regresses the bounding box to obtain the locations of the final detection boxes. The Faster RCNN algorithm has the characteristics of fast convergence speed and high accuracy and is suitable for stomata detection (Simonyan and Zisserman, 2015). The server configuration is the same as in 2.3.2. The open‐source code of the Faster RCNN detection algorithm was based on the TensorFlow framework and can be accessed at https://github.com/endernewton/tf‐faster‐rcnn.git. ResNet‐101 was used as the backbone network of the Faster RCNN in our research. The major hyperparameter settings included learning rate of 0.001, mini‐batch size of 256 and iterations of 100000. The VOC2007 data set comprises ProScope HR2 stomata microscopic images.
Improved CV model
The CV model is an active contour model for image segmentation (Chan and Vese, 2001). The segmentation of the CV model was mainly realized by the level set algorithm. The level set promotes the evolution of the active contours and finally stops the evolution process at the object boundary on the basis of energy minimization. The traditional level set method needed to reinitialize the level set function is costly. Li et al. (2005) proposed a new variational level set formulation to eliminate the need for a reinitialization procedure and speed up the curve evolution. They proposed a region‐based initialization of the level set function that allows for more flexible application. Their source code can be accessed at https://github.com/gaomingqi/Chan‐Vese‐model.
Based on the CV model proposed by Li et al. (2005), an improved CV model was proposed, the flow chart of which is shown in Figure 12. (a) Set the parameters of Li’s CV model and calculate the value of the sign distance function (SDF). Then, run the program of the curve evolution 10 times. (b) Calculate the coordinates of the centroid, area and bounding box of all objects in the stomata image. Then, record the coordinates of the centroid as (x i ‐1, y i ‐1) and the area as S i ‐1. (c) Calculate the distances from the centroid of all objects with no contact with the image border to the centre of the stomata image and determine the pore with the minimum distance. (d) Track the pore using the principles of |x i ‐x i ‐1|<1, |y i ‐y i ‐1|<1 and |S i ‐S i ‐1|<5. That is, if the coordinates (x i , y i ) and area (S i ) of the pore of the i‐th iteration meet the principles, the iteration continues; otherwise, the iteration is stopped, and the pore image is output. If the coordinates of the pore satisfy |x i ‐x i ‐1|<1 and |y i ‐y i ‐1|<1 and the area of the pore does not change for 30 successive iterations, the iteration also stops, and the pore image is output (Figure 8c). (e) Calculate the pore traits.
Figure 12.
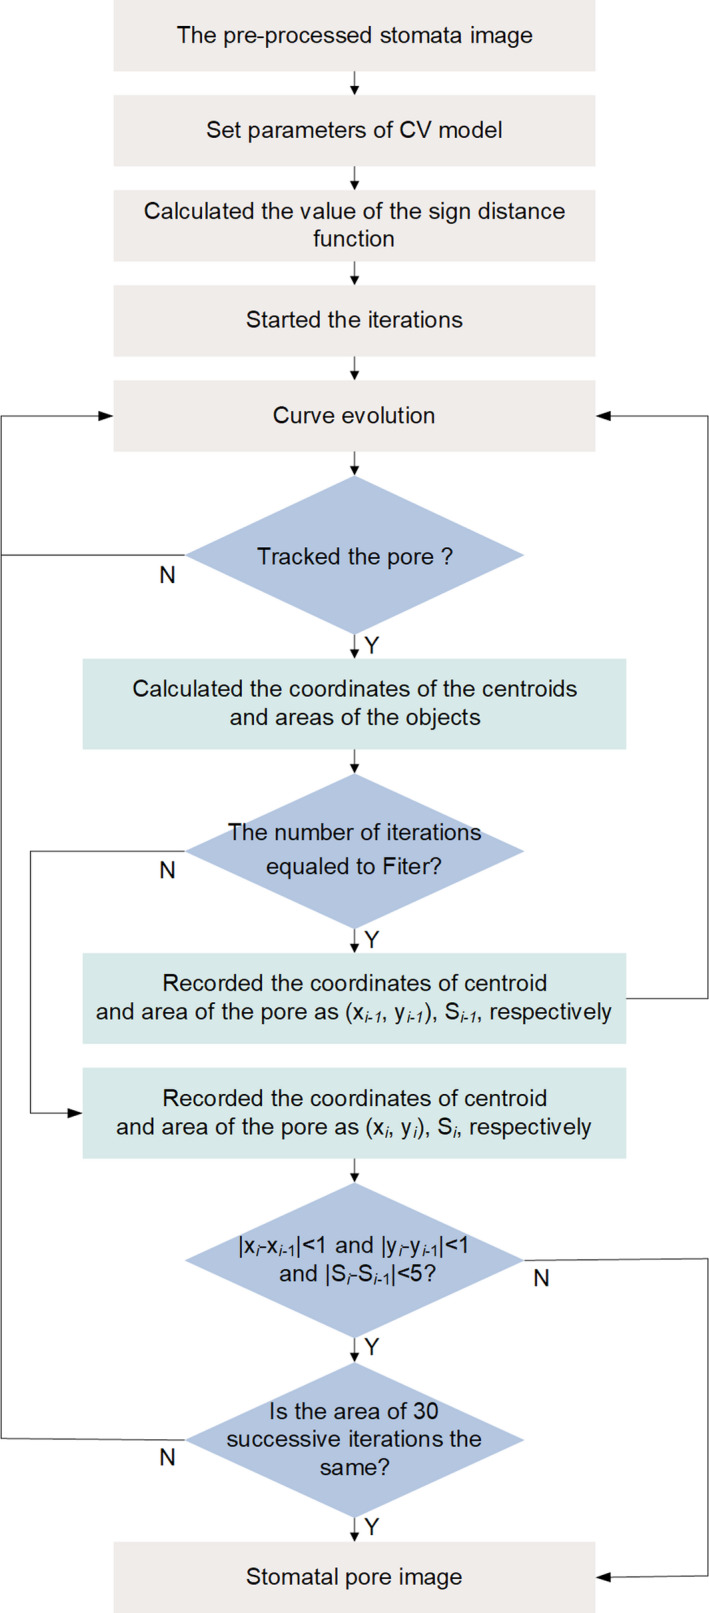
Flow chart of the improved CV model. (x i ‐1, y i ‐1) and S i ‐1 are the coordinates and area of pores of the (i‐1)‐th iteration respectively. (x i , y i ) and S i are the coordinates and area of pores of the i‐th iteration respectively. ‘Fiter’ is the number of iterations required before pore tracking commences, which here is 10.
Evaluation indexes of the object detection model
In this study, the output of the FPN model was a list of bounding boxes that contained stomata in an image, and the outputs of the Faster RCNN model were two lists of bounding boxes, one for the opening stomata and the other for the closing stomata in an image. Using the FPN model to detect stomata, denoting boxes as stomata or nonstomata could have one of three potential results: true positive (TP) – correctly classifying a region as a stoma; false positive (FP) – incorrectly classifying a background region as a stoma as well as multiple detections of the same stoma; and false negative (FN) – incorrectly classifying a stoma as a background region. Using the Faster RCNN model to detect opening stomata (as for closing stomata), denoting boxes as opening stomata or nonopening stomata could have one of four potential results: true positive (TP) – correctly classifying a region as an opening stoma; false positive (FP) – incorrectly classifying a background region or closing stoma as an opening stoma as well as multiple detections of the same stoma; false negative (FN) – incorrectly classifying an opening stoma as a background region or closing stoma; true negative (TN) – correctly classifying a background region or a closing stoma. In this study, the recall, precision, accuracy and F1 score were used to evaluate the performance of the object detection model. These evaluation indexes are defined in (3), (4), (5), (6) (Hasan et al., 2018).
| (3) |
| (4) |
| (5) |
| (6) |
Where the recall measures how many of the stomata in the image have been captured; the precision measures how many of the detected regions were actually stomata; the accuracy evaluates the model’s performance; and the F1 score synthesizes the recall and precision to evaluate the object detection model.
Compared with manual measurement, R 2 and MAPE were used to evaluate the performance of the model. The MAPE of the automatic measurement versus manual measurement was defined in Equation 7.
| (7) |
Imaging device for observing the dynamic process of stomata
To observe dynamic process of maize leaf pore from closing to opening, an imaging device (Figure 6a) was designed. The main parts of the device are chamber, stand and ProScope HR2 with 400× lens. The chamber and ProScope HR2 with 400× lens were fixed on the stand. The chamber was used to fix plant leaf and keep the leaf flat as much as possible. Sponge was used to protect the leaf surface from damage when lens attached to the leaf surface. The ProScope HR2 with 400x lens was fixed updown and was used to acquire stomata image of abaxial leaf surface continually.
Conflicts of interest
The authors declare that they have no conflicts of interest.
Author contributions
Liang X processed the images, analysed the data and wrote the paper. Xu X performed the experiments, analysed the data and designed the figures. Wang Z, Zhang K and Liang B analysed parts of the data and performed parts of the experiments. He L designed the web portal. Ye J provided the TipScope. Shi J designed parts of the figures. Wu X and Dai M provided the maize materials and performed the drought experiment. Yang W supervised this project and revised the paper.
Supporting information
Figure S1 Wild‐type B73 and mutant maize plants Zmfab1a.
Figure S2 Dynamic stomata response of wild‐type B73 and mutant Zmfab1a under well‐watered (WW) and drought‐stressed (DS) conditions.
Table S1 Comparison of published works on object detection based on deep learning.
Table S2 Settings of TipScope and mobile phone.
Table S3 Settings of ProScope HR2 and 400x lens.
Video S1 Operating procedure for stomatal trait extraction.
Video S2 The software operation procedure of the maize leaf stomata detection and pore segmentation.
Video S3 The operation procedure of web portal.
Video S4 The dynamic process of wheat leaf pore from closing to opening.
Video S5 The dynamic process of maize leaf pore from closing to opening.
Video S6 The dynamic process of pore segmentation based on the improved CV model.
Note S1 The Instructions for stomatal trait extraction.
File S1 Technical document of web portal.
File S2 Technical document of EXE software.
Acknowledgements
This work was supported by grants from the National Key Research and Development Program (2020YFD1000904‐1‐3), the National Natural Science Foundation of China (31770397), Major science and technology projects in Hubei Province, Fundamental Research Funds for the Central Universities (2662020GXPY010, 2662020ZKPY017, 2021ZKPY006) and Cooperative funding between Huazhong Agricultural University and Shenzhen Institute of agricultural genomics (SZYJY2021005, SZYJY2021007).
Liang, X. , Xu, X. , Wang, Z. , He, L. , Zhang, K. , Liang, B. , Ye, J. , Shi, J. , Wu, X. , Dai, M. and Yang, W. (2022) StomataScorer: a portable and high‐throughput leaf stomata trait scorer combined with deep learning and an improved CV model. Plant Biotechnol. J., 10.1111/pbi.13741
Data Availability Statement
The operating procedure for stomatal trait extraction is shown in Video S1. The detailed technical documentation is given in Note S1. The trained model, user guideline and all the labelled images of leaf stomata are available at http://plantphenomics.hzau.edu.cn/download_checkiflogin_en.action. The source codes are available from the first/corresponding author. The web portal of extracting stomatal traits was available at http://x40833180q.zicp.vip.
References
- Andayani, U. , Sumantri, I.B. , Pahala, A. and Muchtar, M.A. (2020) The implementation of deep learning using convolutional neural network to classify based on stomata microscopic image of curcuma herbal plants[J]. IOP Conf. Ser. Mater. Sci. Eng. 851, 012035. [Google Scholar]
- Aono, A.H. , Nagai, J.S. , Dickel, G.D.S.M. , Marinho, R.C. , Macedo de Oliveira, P.E. , Papa, J.P. and Faria, F.A. (2019) A stomata classification and detection system in microscope images of maize cultivars. BioRXiv. 10.1101/538165 [DOI] [PMC free article] [PubMed]
- Bertolino, L.T. , Caine, R.S. and Gray, J.E. (2019) Impact of stomatal density and morphology on water‐use efficiency in a changing world[J]. Front. Plant Sci. 10, 225. [DOI] [PMC free article] [PubMed] [Google Scholar]
- Bhugra, S. , Mishra, D. , Anupama, A. , Chaudhury, S. , Lall, B. and Chugh, A. (2018) Automatic Quantification of Stomata for High‐Throughput Plant Phenotyping[C]. 10.1109/ICPR.2018.8546196.2018 24th International Conference on Pattern Recognition (ICPR) [DOI] [Google Scholar]
- Bhugra, S. , Mishra, D. , Anupama, A. , Chaudhury, S. and Chinnusamy, V. (2019) Deep convolutional neural networks based framework for estimation of stomata density and structure from microscopic images: Munich, Germany, September 8‐14, 2018, Proceedings, Part VI[M]. Computer Vision – ECCV 2018 Workshops. 10.1007/978-3-030-11024-6_31 [DOI]
- Bourdais, G. , McLachlan, D.H. , Rickett, L.M. , Zhou, J.I. , Siwoszek, A. , Häweker, H. , Hartley, M. et al. (2019) The use of quantitative imaging to investigate regulators of membrane trafficking in Arabidopsis stomatal closure[J]. Traffic, 20, 168–180. [DOI] [PubMed] [Google Scholar]
- Casado‐García, A. , del‐Canto, A. , Sanz‐Saez, A. , Pérez‐López, U. and Heras J. (2020) LabelStoma: a tool for stomata detection based on the YOLO algorithm [J]. Comput. Electronics Agric. 178, 105751. 10.1016/J.COMPAG.2020.105751 [DOI] [Google Scholar]
- Chan, T.F. and Vese, L.A. (2001) Active contours without edges[J]. IEEE Trans. Image Process. 10, 266–277. [DOI] [PubMed] [Google Scholar]
- Costa, L. , Archer, L. , Ampatzidis, Y. , Casteluci, L. , Caurin, G.A.P. and Albrecht, U. (2020) Determining leaf stomatal properties in citrus trees utilizing machine vision and artificial intelligence[J]. Precision Agric. 4, 1–13. [Google Scholar]
- Eisele, J.F. , Fäβler, F. , Bürgel, P.F. and Chaban, C. (2016) A rapid and simple method for microscopy‐based stomata analyses[J]. PLoS One, 11, e0164576. [DOI] [PMC free article] [PubMed] [Google Scholar]
- Fang, Y. , Gong, W. , Li, J. , Li, W. , Tan, J. , Xie, S. and Huang, Z. (2020) Toward image quality assessment in optical coherence tomography (OCT) of rat kidney[J]. Photodiagn. Photodyn. Ther. 32, 101983. [DOI] [PubMed] [Google Scholar]
- Fetter, K.C. , Eberhardt, S. , Barclay, R.S. , Wing, S. and Keller, S.R. (2019) StomataCounter: a neural network for automatic stomata identification and counting [J]. New Phytol. 223, 1671–1681. [DOI] [PubMed] [Google Scholar]
- Gitz, D.C. and Baker, J.T. (2009) Methods for creating stomatal impressions directly onto archivable slides[J]. Agron. J. 101, 232–236. [Google Scholar]
- Hasan, M.M. , Chopin, J.P. , Laga, H. and Miklavcic, S.J. (2018) Detection and analysis of wheat spikes using Convolutional Neural Networks[J]. Plant Methods, 14, 100. 10.1186/s13007-018-0366-8 [DOI] [PMC free article] [PubMed] [Google Scholar]
- Hepworth, C. , Caine, R.S. , Harrison, E.L. , Sloan, J. and Gray, J.E. (2018) Stomatal development: focusing on the grasses[J]. Curr. Opin. Plant Biol. 41, 1–7. [DOI] [PubMed] [Google Scholar]
- Higaki, T. , Kutsuna, N. and Hasezawa, S. (2014) CARTA‐based semi‐automatic detection of stomatal regions on an Arabidopsis cotyledon surface. Jpn. Soc. Plant Morphol. 26, 9–12. [Google Scholar]
- Iodibia, C.V. , Achebe, U.A. and Nnaji, E. (2017) A study on the anatomy of Zanthoxylum macrophylla (Rutaceae). Asian J. Biol. 5, 143–147. [Google Scholar]
- Jayakody, H. , Liu, S. , Whitty, M. and Petrie, P. (2017) Microscope image based fully automated stomata detection and pore measurement method for grapevines[J]. Plant Methods, 13, 94. [DOI] [PMC free article] [PubMed] [Google Scholar]
- Jayakody, H. , Petrie, P. , Boer, H.D. and Whitty, M. (2021) A generalised approach for high‐throughput instance segmentation of stomata in microscope images[J]. Plant Methods 17, 27. 10.1186/S13007-021-00727-4 [DOI] [PMC free article] [PubMed] [Google Scholar]
- Laga, H. , Shahinnia, F. & Fleury, D. (2014) Image‐based plant stomata phenotyping[C]. International Conference on Control Automation Robotics and Vision (ICARCV 2014). At Marina Bay Sands, Singapore 2014. 10.1109/ICARCV.2014.7064307 [DOI]
- Li, C. , Xu, C. , Gui, C. and Fox, M.D. (2005) Level set evolution without re‐initialization: A new variational formulation[C]. Computer Vision and Pattern Recognition, 2005. CVPR 2005. IEEE Computer Society Conference on 1. 10.1109/CVPR.2005.213 [DOI]
- Li, K. , Huang, J. , Song, W. , Wang, J. and Wang, X. (2019) Automatic segmentation and measurement methods of living stomata of plants based on the CV model[J]. Plant Methods 15, 67. 10.1186/s13007-019-0453-5 [DOI] [PMC free article] [PubMed] [Google Scholar]
- Lin, T.Y. , Dollar, P. , Girshick, R. , He, K. , Hariharan, B. and Belongie, S. (2017) Feature pyramid networks for object detection[J]. IEEE Conf. Comput. vis. Pattern Recognit. 2017, 936–944. [Google Scholar]
- Liu, S. , Tang, J. , Petrie, P. and Whitty, M. (2016) A Fast method to measure stomatal aperture by MSER on smart mobile phone[C]. Applied industrial optics: spectroscopy, imaging and metrology. 10.1364/AIO.2016.AIW2B.2 [DOI]
- Meeus, S. , Bulcke, J. and Wyffels, F. (2020) From leaf to label: a robust automated workflow for stomata detection[J]. Ecol. Evol. 10, 9178–9191. [DOI] [PMC free article] [PubMed] [Google Scholar]
- Millstead, L. , Jayakody, H. , Patel, H. , Kaura, V. , Petrie, P.R. , Tomasetig, F. and Whitty, M. (2020) Accelerating automated stomata analysis through simplified sample collection and imaging techniques[J]. Front. Plant Sci. 11, 580389. [DOI] [PMC free article] [PubMed] [Google Scholar]
- Nassuth, N. , Rahman, M.A. , Nguyen, T. , Ebadi, A. and Lee, C. (2021) Leaves of more cold hardy grapes have a higher density of small, sunken stomata[J]. Vitis, 60, 63–67. [Google Scholar]
- Qu, X. , Peterson, K.M. and Torii, K.U. (2017) Stomatal development in time: the past and the future[J]. Curr. Opin. Genet. Dev. 45, 1–9. [DOI] [PubMed] [Google Scholar]
- Ren, S. , He, K. , Girshick, R. and Sun, J. (2017) Faster R‐CNN: towards real‐time object detection with region proposal networks[J]. IEEE Trans. Pattern Anal. Mach. Intell. 39, 1137–1149. [DOI] [PubMed] [Google Scholar]
- Richardson, W.H. (1972) Bayesian‐based iterative method of image restoration[J]. J. Optical Soc. Am. 62, 55–59. [Google Scholar]
- Rudall, P.J. , Hilton, J. and Bateman, R.M. (2013) Several developmental and morphogenetic factors govern the evolution of stomatal patterning in land plants[J]. New Phytol. 200, 598–614. [DOI] [PubMed] [Google Scholar]
- Sakoda, K. , Watanabe, T. , Sukemura, S. , Kobayashi, S. , Nagasaki, Y. , Tanaka, Y.U. and Shiraiwa, T. (2019) Genetic diversity in stomatal density among soybeans elucidated using high‐throughput technique based on an algorithm for object detection[J]. Sci. Rep. 9, 215–220. [DOI] [PMC free article] [PubMed] [Google Scholar]
- Sanyal, P. , Bhattacharya, U. and Bandyopadhyay, S.K. (2008) Analysis of SEM Images of Stomata of Different Tomato Cultivars Based on Morphological Features[C]. Asia International Conference on Modeling & Simulation. IEEE, 2008. 10.1109/AMS.2008.81 [DOI]
- Simonyan, K. and Zisserman, A. (2014) Very deep convolutional networks for large‐scale image recognition. arXiv:1409.1556v6 [cs.CV].
- Song, W. , Li, J. , Li, K. , Chen, J. and Huang, J. (2020) An automatic method for stomatal pore detection and measurement in microscope images of plant leaf based on a convolutional neural network model[J]. Forests, 11, 954. [Google Scholar]
- Sun, Z. , Song, Y. , Li, Q. , Cai, J. , Wang, X. , Zhou, Q. , Huang, M. et al. (2021) An integrated method for tracking and monitoring stomata dynamics from microscope videos[J]. Plant Phenomics, 2021, 9835961. [DOI] [PMC free article] [PubMed] [Google Scholar]
- Thamizharasi, A. and Jayasudha, J.S. (2016) An illumination invariant face recognition by enhanced contrast limited adaptive histogram equalization [J]. ICTACT J. Image Video Proc. 6, 1258–1266. [Google Scholar]
- Toda, Y. , Toh, S. , Bourdais, G. , Robatzek, S. , Maclean, D. and Kinoshita, T. (2018) DeepStomata: facial recognition technology for automated stomata aperture measurement. bioRxiv. 10.1101/365098 [DOI]
- Tzutalin, L. (2015) Git code. https://github.com/tzutalin/labelImg
- Vialet‐Chabrand, S. and Brendel, O. (2014) Automatic measurement of stomatal density from microphotographs [J]. Trees, 28, 1859–1865. [Google Scholar]
- Wagner, L.A. , Alisdair, R.F. and Adriano, N.N. (2011) Control of stomatal aperture[J]. Plant Signal. Behav. 6, 1305–1311. [DOI] [PMC free article] [PubMed] [Google Scholar]
- Wu, X.I. , Feng, H. , Wu, D.I. , Yan, S. , Zhang, P. , Wang, W. , Zhang, J. et al. (2021) Using high‐throughput multiple optical phenotyping to decipher the genetic architecture of maize drought tolerance [J]. Genome Biol. 22, 185. [DOI] [PMC free article] [PubMed] [Google Scholar]
- Zarinkamar, F. (2007) Stomatal observations in dicotyledons[J]. Pak. J. Biol. Sci. 10, 199–219. [DOI] [PubMed] [Google Scholar]
- Zhu, J. , Qiang, Y. , Xu, C. , Li, J. and Qin, G. (2018) Rapid estimation of stomatal density and stomatal area of plant leaves based on object‐oriented classification and its ecological trade‐off strategy analysis[J]. Forests, 9, 616. [Google Scholar]
Associated Data
This section collects any data citations, data availability statements, or supplementary materials included in this article.
Supplementary Materials
Figure S1 Wild‐type B73 and mutant maize plants Zmfab1a.
Figure S2 Dynamic stomata response of wild‐type B73 and mutant Zmfab1a under well‐watered (WW) and drought‐stressed (DS) conditions.
Table S1 Comparison of published works on object detection based on deep learning.
Table S2 Settings of TipScope and mobile phone.
Table S3 Settings of ProScope HR2 and 400x lens.
Video S1 Operating procedure for stomatal trait extraction.
Video S2 The software operation procedure of the maize leaf stomata detection and pore segmentation.
Video S3 The operation procedure of web portal.
Video S4 The dynamic process of wheat leaf pore from closing to opening.
Video S5 The dynamic process of maize leaf pore from closing to opening.
Video S6 The dynamic process of pore segmentation based on the improved CV model.
Note S1 The Instructions for stomatal trait extraction.
File S1 Technical document of web portal.
File S2 Technical document of EXE software.
Data Availability Statement
The operating procedure for stomatal trait extraction is shown in Video S1. The detailed technical documentation is given in Note S1. The trained model, user guideline and all the labelled images of leaf stomata are available at http://plantphenomics.hzau.edu.cn/download_checkiflogin_en.action. The source codes are available from the first/corresponding author. The web portal of extracting stomatal traits was available at http://x40833180q.zicp.vip.


