Abstract
The goal of this study was to create a mass transport model (MTM) model for gastric emptying and upper gastrointestinal (GI) appearance that can capture the in vivo concentration–time profiles of the nonabsorbable drug phenol red in solution in the stomach and upper small intestine by direct luminal measurement while simultaneously recording the contractile activity (motility) via manometry. We advanced from a one-compartmental design of the stomach to a much more appropriate, multi-compartmental ‘mixing tank’ gastric model that reflects drug distribution along the different regions of the stomach as a consequence of randomly dosing relative to the different contractile phases of the migrating motor complex (MMC). To capture the intraluminal phenol red concentrations in the different segments of the GI tract both in fasted and fed state conditions, it was essential to include a bypass flow compartment (‘magenstrasse’) to facilitate the transport of the phenol red solution directly to the duodenum (fasted state) or antrum (fed state). The fasted and fed state models were validated with external reference data from an independent aspiration study using another nonabsorbable marker (paromomycin). These results will be essential for the development and optimization of computational programs for GI simulation and absorption prediction, providing a realistic gastric physiologically-based pharmacokinetic (PBPK) model based on direct measurement of gastric concentrations of the drug in the stomach.
Keywords: Human gastric emptying, Bioavailability, Gastrointestinal mass transport model, Bioequivalence, Aspiration/motility study, Phenol red, Paromomycin, In vivo dissolution, Oral absorption, Nonabsorbable marker, Gastrointestinal
1. Introduction
Following ingestion of an oral dosage form, the stomach is the first compartment where the drug product will reside. Where the tablet or capsule initially resides and disintegrates in the stomach may be determined by the motility patterns of the stomach and upper gastrointestinal (GI) tract at the time of dosing. The interaction of the oral drug product with the acidic pH of gastric fluids can have a further role in the drug’s behavior along the intestinal tract. For example, a plausible longer residence time in the stomach promoted intestinal absorption for the weak base posaconazole (pKa 3.6 & 4.6) after administration of a 400 mg therapeutic dose with the acidic beverage Coca-Cola® [1]. For the weakly acidic drug ibuprofen (pKa ~ 4.85), the onset of post-dose phase III contractions (TMMC-III) was correlated with the systemic Tmax and Cmax of the drug. The earlier this strong burst of contractions (phase III of the migrating motor complex (MMC)) appeared after oral ingestion of the immediate-release tablet of ibuprofen, the higher the maximal concentrations of ibuprofen that were observed in plasma [2,3]. Thus, random dosing of a drug product relative to the different phases of contractile activity of the migrating motor complex (MMC) is itself a significant (random) variable in the subsequent systemic drug exposure. The GI motility state at time dosing can lead to systemic availability variation that is not product related but GI state at the time of dosing related [4].
Recently, the stomach has received increasing attention as formulation and product development scientists are aware of the fact that this distensible organ cannot be neglected in predinical in vitro models in order to optimize their predictions of the in vivo performance [5,6]. Presenting the stomach as a one-compartmental reactor oversimplifies the dynamic gastric environment in terms of the present state of motility (i.e., contractile patterns), the gastric mixing of drug content, solution and solid, with gastric fluids, and the gastric emptying of the administered fluid volume. Revisions and optimizations of gastric compartments in different in vitro models have been considered [7-9]. For example, the gastric compartment of the TIM-1 model has recently been revised in order to reflect more adequately the dynamic gastric conditions. In order to simulate mixing liquid velocity and pressure (contractile) events, the stomach was redesigned to include separately controlled motility for the body and antrum [10].
It has been shown that, depending on the time of administration relative to the MMC phase, drug distribution along different regions of the stomach (i.e., antrum and body) can result in an inhomogeneous (i.e., not well mixed) presence of the drug (solution and particles) in the stomach [11]. The situation is even more complex in postprandial conditions, as the intake of a meal significantly changes the physiological response of the GI tract [12]. The intake of food will, typically, increase the gastric emptying time, increasingly with greater caloric content (particularly fat content). The antral contractile waves (ACW) initiate gastric mixing and the heterogeneous fluid shear forces (retropulsion) will aid in (i) particle size reduction, (ii) stimulates contact between residual gastric fluids and food content and (iii) partial digestion of the meal content in the stomach. After oral administration of the nonabsorbable marker paromomycin (Biopharmaceutics Classification System (BCS) class 3 drug), multiple concentration peaks were observed in the individual duodenal profiles of five healthy subjects in the fed state condition. The authors hypothesized that this phenomenon might be due to the ‘Magenstrasse’ (i.e., the stomach road), the route for liquids to travel directly from the fundus (i.e., the upper part of the stomach) to the upper small intestine via the antrum, independent of the ACW [13,14].
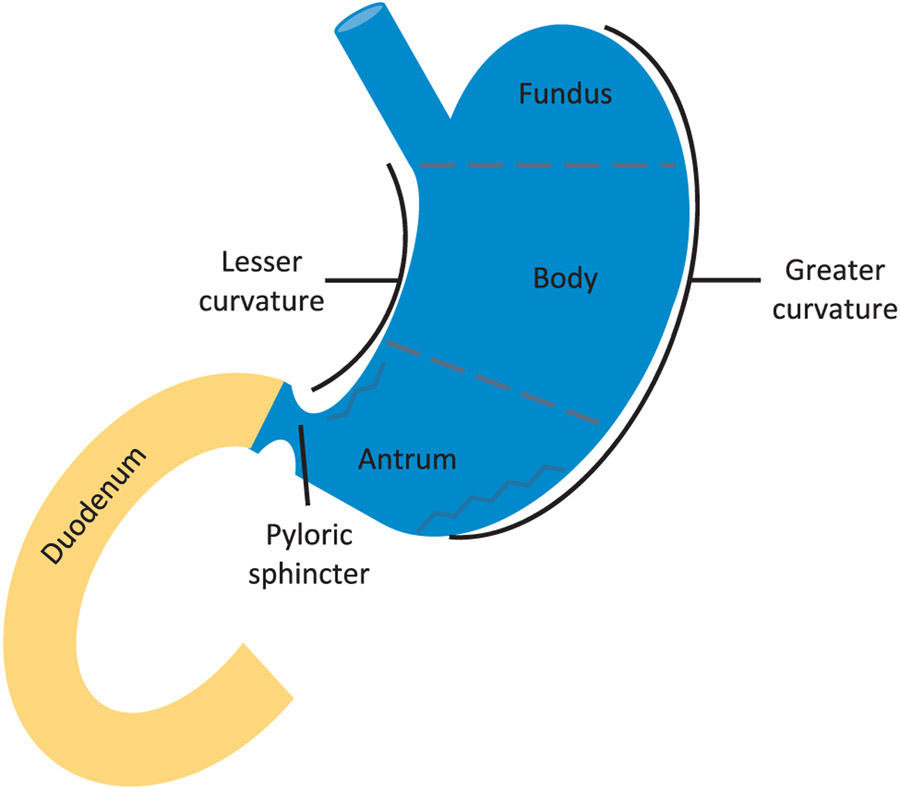
These results suggest that a new multi-compartmental paradigm is required and should reflect drug distribution in the different regions of the stomach as a consequence of random dosing relative to the different MMC phases (Fig. 1) [4,15-17].
Fig. 1.
Different segments of the upper GI tract, representing the fundus, body and antrum (i.e., the stomach) followed by the transfer to the duodenum (i.e., the upper small intestine).
As many in vitro models take into account the complex situation regarding the stomach, widely-used in silico models still handle the stomach as a one-compartmental, well-stirred design. Depending on the present motility at the time of administration, an inhomogeneous distribution of the drug along the stomach can be notified and may have an immense impact on gastric emptying of the drug. Especially when the rate-limiting step in drug absorption is related to gastric emptying, processes such as intragastric drug distribution in the different regions of the stomach should be considered to make the right predictions towards the in vivo exposure of the drug. Moreover, whenever data from the abovementioned in vitro models will be used as an input for in silico tools, a revision of the in silico gastric compartment will be crucial and necessary in order to be adequately attuned to each other.
The aim of this study was to develop a mass transport model (MTM), based on the continuous stirred-tank reactor (CSTR) concept, that adequately reflects the distribution of the administered solution of a nonabsorbable marker throughout the stomach, duodenum and jejunum. The scientific rationale of this MTM model is based on intraluminal concentration-time profiles of phenol red (nonabsorbable drug in solution), as administered to healthy subjects with 250 mL of water in fasted and fed states [2,3]. The development and validation of this model will be useful for a better understanding of drug delivery and distribution in the GI tract and the corresponding implications for the systemic availability and variability of orally administered drug products.
2. Materials and methods
2.1. Chemicals
Phenol red was obtained from U.S. Pharmacopeia (Rockville, MD). Trifluoroacetic acid (TFA), formic acid, methanol and acetonitrile were obtained from Fisher Scientific Inc. (Pittsburgh, PA). All chemicals were of analytical grade or HPLC grade. Purified water (i.e., filtrated and deionized) was used for the analysis method of phenol red (Millipore, Billerica, MA).
2.2. Intraluminal profiling of phenol red in GI fluids of healthy volunteers
Intraluminal concentrations of phenol red were measured in aspirated gastric, duodenal and jejunal fluids of healthy volunteers in fasted and fed state after oral administration of a phenol red solution. Phenol red was introduced as a nonabsorbable drug in 1923 by Gorham and has been intensively used as an indicator to study gastric emptying and intestinal transit times [18-20]. The drug is classified as a low permeable compound with less than 10% secreted in the urine after oral administration [21,22]. The design of the clinical study has recently been described by Hens et al. [2]. A total of 13 fasted state (6 women and 7 men) and 11 fed state subjects (4 women and 7 men) drank a glass of water containing phenol red. All subjects provided written informed consent before participating the clinical study. Samples collected in this study were part of clinical trial NCT02806869. The institutional review boards at the University of Michigan (IRBMED, protocol number HUM00085066) and the Department of Health and Human Services, Food and Drug Administration (Research Involving Human Subjects Committee/RIHSC, protocol number 14-029D), both approved the study protocol.
Upon arrival to the hospital, a customized multi-channel aspiration/manometry catheter (body length 292 cm; diameter 7 mm; MUI Scientific, Mississauga, ON) was intubated via the mouth and positioned in the distal/mid-jejunum, proximal jejunum, duodenum, and in the antrum of the stomach (i.e., lower part of the stomach), confirmed by fluoroscopic imaging. Each segment contains aspiration and motility channels to aspirate GI fluids and to measure pressure events along the GI tract, respectively. Manometry was simultaneously used to capture the contractile activity of the stomach and upper small intestine (i.e., duodenum and jejunum). Volunteers were asked to remain in a hospital bed in an upright sitting position (during the baseline motility test as well as the study). After performing a baseline motility test of 3–5 h (fasted state), an immediate-release tablet of ibuprofen (Dr. Reddy’s Laboratories Limited (Shreveport, LA; IBU-Ibuprofen Tablets, USP, 800 mg, Lot no. L400603)) was administered together with 250 mL of water containing 0.1 mg/mL USP grade phenol red as a nonabsorbable marker for monitoring GI fluid changes related to dilution, secretion, and absorption. Dosing was random relative to the fasted state cyclical contractile phase of the MMC in the stomach and upper small intestine. The use of phenol red as a nonabsorbable marker has been extensively described in the literature [22-25]. To induce the fed state condition, volunteers were asked to drink two cans of Pulmocare® (total volume of 474 mL, containing 29.6 g of proteins, 44.2 g of fat, 25 g of carbohydrates, and a total amount of 710 calories) prior to dose administration. Volunteers were not obliged to drink the total amount of administered water and/or liquid meal to avoid any feeling of nausea prior to the start of the study. In the fasted state, volunteers drank on average 239 mL of water (standard deviation of 30 mL). In the fed state, volunteers drank on average 200 mL of water (standard deviation of 67 mL) and 357 mL of Pulmocare® (standard deviation of 131 mL). The study drug, water, and/or Pulmocare® (Abbott Nutrition, Lake Forest, IL) were swallowed by the subjects rather than administered via the GI catheter. Subsequently, GI fluids were aspirated for 7 h and analyzed for ibuprofen and phenol red. Motility patterns were analyzed and classified as follows: powerful antral phase III contractions were defined as the regular occurrence of at least 2 contractions per minute for a period of no less than 2 min with an average amplitude of 75 mmHg. Duodenal phase III contractions are characterized by a rate of at least 11 contractions per minute with an average amplitude of 33 mmHg lasting at least 3 min [15]. The time of appearance of phase III post-dose activity was an important physiological variable responsible for empty a large quantity of drug product from stomach into small intestine [2,4].
2.3. Development of the MTM of phenol red and paromomycin in a multi-compartmental in silico model in the fasted state
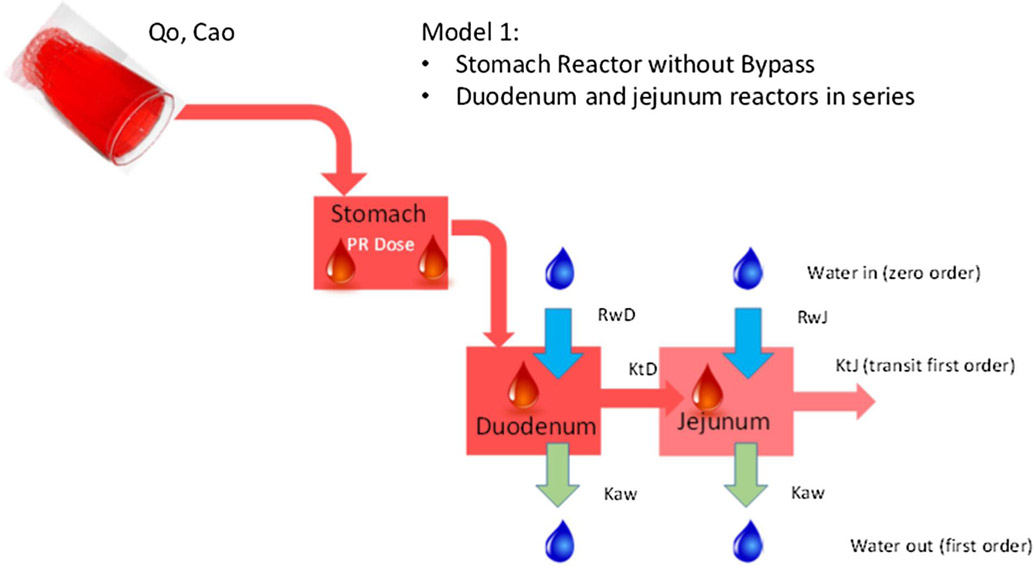
For the first approach, the average intraluminal phenol red concentrations of all volunteers were adjusted by a three-compartment model in series representing the stomach, duodenum and jejunum, respectively. We will refer to this model throughout the manuscript as ‘Model 1’ (Fig. 2). All simulations were performed in Berkeley Madonna (version 8.3.18, University of California at Berkeley, CA). For the underlying equations that were used for this MTM, the reader is referred to the supplementary information.
Fig. 2.
Representative illustration of the MTM of ‘Model 1’ that consists of three reactors in series representing the stomach, duodenum and jejunum, respectively. Ca0 stands for the initial concentration of phenol red present in the glass of water; Q0 stands for the input flow (namely 250 mL in 2 min); RwD and RwJ stands for the secretion rate constants in the duodenum and jejunum, respectively; Kaw represents the water absorption rate constants, present in the duodenum and jejunum; KtD and KtJ are the first-order transit rate constants in the duodenum and jejunum, respectively.
The different parameters that were used to simulate the average profile of phenol red for all volunteers (n = 13) via Model 1 are depicted in Table 1.
Table 1.
Integrated parameters that were used to describe the average phenol red concentrations along the different compartments in Model 1. The parameters assigned with the asterisk “*’ are the parameters that were subject of optimization to estimate their value for each individual dataset.
| Parameter | Meaning | Value | Reference |
|---|---|---|---|
| *t1/2_stm | Gastric half-life of emptying (min) | 13 | Optimized by curve fitting |
| *t1/2_duo | Duodenal half-life of emptying (min) | 10.8 | Optimized by curve fitting |
| *t1/2_jej | Jejunal half-life of emptying (min) | 25.6 | Optimized by curve fitting |
| Vrstm | Residual volume stomach (mL) | 35 | [26] |
| Vrduo | Residual volume duodenum (mL) | 6 | [26] |
| Vrjej | Residual volume jejunum (mL) | 12 | [26] |
| Ca0 | Initial dose phenol red administered (μg/mL) | 100 | [2] |
| kabs | First-order absorption rate constant of water in duodenum and jejunum (min−1) | 0.0096 | [27,28] |
A virtual run was simulated where the phenol red (0.1 mg/mL) was transported throughout the different segments of the GI tract. The software estimated half-life values in order to adjust the observed in vivo profiles from person to person. The mathematical software modeling package curve-fitted the intraluminal profiles of phenol red in each segment, representing the best value for each half-life value (as listed in Table 1 and highlighted with an asterisk), the most adjacent to the in vivo situation.
Models of increasing complexity were developed by including the following features:
An equivalent pathway such as the ‘magenstrasse’ to create a bypass flow to simulate the observed rapid arrival of the phenol red solution to the antrum/duodenum;
A compartment in the bypass flow to modulate the emptying rate from the bypass flow in the antrum (fed state) or duodenum (fasted state);
A slow-equilibrating compartment linked to the antrum described as “dead space”;
A second compartment in the stomach in series with the antrum that would correspond anatomically with the stomach body.
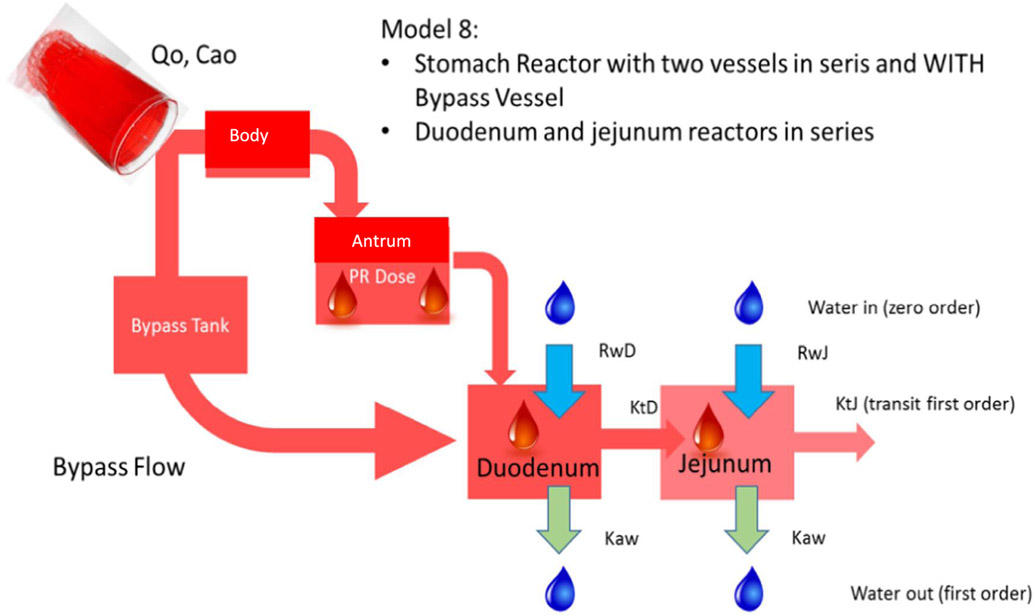
The combination of these features resulted in 10 different structural stomach reactor models. In order to select the adequate model, two criteria were used: (i) the goodness of fit indices as the sum of squared residuals (SSR), Akaike Information Criterion (AIC) values (n) and R2 and, on the other hand, (ii) the feasibility of the parameter values based on our current knowledge of gastric and intestinal physiology. Finally, the model providing the best fit while presenting parameters under physiological limits was selected. The final model, ‘Model 8’, that was evaluated for its predictive power using gastric, duodenal and jejunal phenol red concentrations of fasted state subjects B004-F2, B005-F2, B006-F1, B017-F2, B055-F2 and B063-F1 as reference data (Fig. 3). These volunteers demonstrated a complete dataset of phenol red concentrations in the stomach, duodenum and jejunum. Missing data at certain time points, however, were due to an inability to obtain an aspiration sample from an intestinal segment/aspiration port at that specific time point.
Fig. 3.
Representative illustration of the MTM of ‘Model 8’ that consists of a body and antrum in series and a bypass compartment. Duodenum and jejunum reactors are connected in series with the stomach compartment. The bypass compartment can directly empty the administered solution of phenol red into the duodenum. Ca0 stands for the initial given dose of phenol red present in the glass of water; Q0 stands for the input flow (namely 250 mL in 2 min); RwD and RwJ stands for the secretion rate constants in the duodenum and jejunum, respectively; Kaw represents the water absorption rate constants, present in the duodenum and jejunum; KtD and KtJ are the first-order transit rate constants in the duodenum and jejunum, respectively.
The different parameters to adjust the average phenol red concentration-time profile for all participating volunteers via Model 8 are depicted in Table 2.
Table 2.
Integrated parameters that were used to describe the average phenol red concentrations along the different compartments in Model 8. The parameters assigned with ‘*’ are the parameters that were subject of optimization to estimate their value for each individual dataset.
| Parameter | Meaning | Value | Reference |
|---|---|---|---|
| *t1/2stm_antrum | Half-life of emptying of the antrum (min) | 6.18 | Optimized by curve fitting |
| *t1/2stm_body | Half-life of emptying of the body (min) | 47.8 | Optimized by curve fitting |
| *t1/2stm_bypass | Half-life of emptying from gastric bypass compartment (min) | 4.14 | Optimized by curve fitting |
| *t1/2_duo | Duodenal half-life of emptying (min) | 3.96 | Optimized by curve fitting |
| *t1/2_jej | Jejunal half-life of emptying (min) | 15.4 | Optimized by curve fitting |
| *tlag | Initial lag time (min) | 0 | Optimized by curve fitting |
| Vrstm_antrum | Residual volume antrum (mL) | 35 | [26] |
| Vrstm_body | Residual volume body (mL) | 0 | [26] |
| Vrduo | Residual volume duodenum (mL) | 6 | [26] |
| Vrjej | Residual volume jejunum (mL) | 12 | [26] |
| Ca0 | Initial dose phenol red administered (μg/mL) | 100 | [2] |
| kabs | First-order absorption rate constant of water in duodenum and jejunum (min−1) | 0.0096 | [27,28] |
| *fbypass | Fraction initial dose emptied from stomach directly into duodenum | 0.698 | Optimized by curve fitting |
Model 8 was validated with external intraluminal data of another nonabsorbable marker, paromomycin (BCS class 3) [13]. In an independent study, this marker was orally administered to healthy volunteers as a solution (250 mL) in fasted and fed state conditions after which gastric and duodenal fluids were aspirated and intraluminal paromomycin concentrations were measured. Intragastric concentrations of this marker were also studied after oral ingestion of an immediate-release tablet of paromomycin with 240 mL of tap water to see how the drug would be distributed between antrum and body [11]. In all paromomycin studies, volunteers ingested the total amount of co-administered water/meal. This tablet was administered in a two-way cross-over study design: in the first arm, the tablet was administered during a quiescent phase (phase I of the MMC; i.e., no contractions observed); in the second arm, the tablet was administered during phase II of the MMC (i.e., phase of intermittent contractions). Extra parameters and equations were added to model 8 in order to describe dissolution following oral administration to the body and antrum. The tablet was assumed to directly reach the body compartment after administration in the simulation.
2.4. Development of the MTM of phenol red and paromomycin in a multi-compartmental in silico model in the fed state
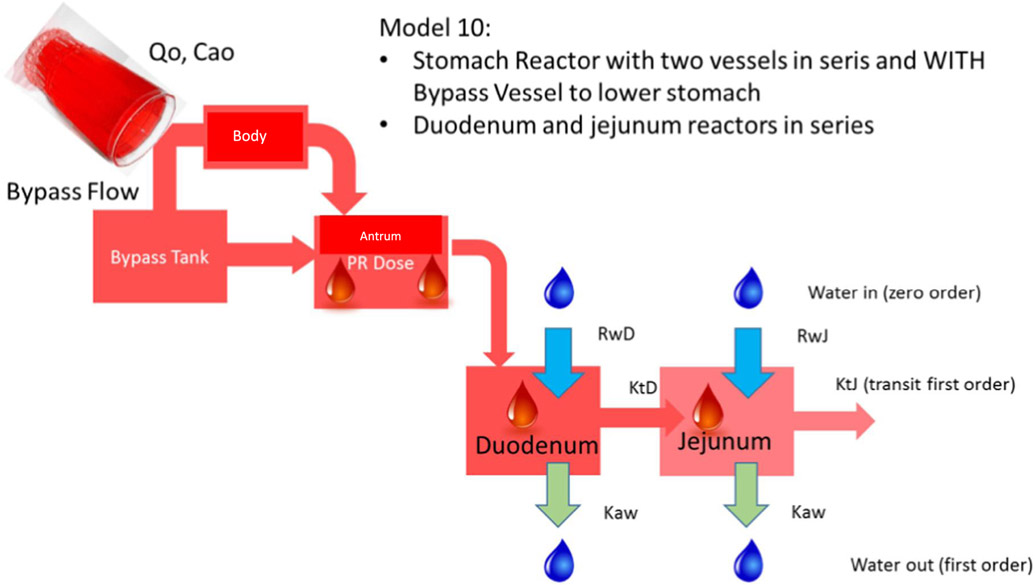
In a first experiment, average concentrations of phenol red were used as a reference and compared with adjusted concentration-time profiles derived from Model 1 (Fig. 1). In a second experiment, concentration-time profiles of fed state subjects B020-P1, B026-P1 and B060-P1 served as reference data and were compared with adjusted gastric, duodenal and jejunal profiles derived from Model 10 (Fig. 4), as only these volunteers had complete datasets of phenol red concentrations in the stomach, duodenum and jejunum.
Fig. 4.
Representative illustration of the MTM of ‘Model 10’ that consists of a body and antrum in series and a bypass compartment that can transfer the phenol red solution directly to the antrum. Duodenum and jejunum reactors are connected in series with the stomach compartment. Ca0 stands for the initial concentration of phenol red present in the glass of water; Q0 stands for input water flow i.e., 250 mL in 2 min; RwD and RwJ stands for the secretion rate constants in the duodenum and jejunum, respectively; Kaw represents the water absorption rate constants, present in the duodenum and jejunum; KtD and KtJ are the first-order transit rate constants in the duodenum and jejunum, respectively.
To validate Model 10, external intraluminal data of another nonabsorbable marker, paromomycin, was used once again [13]. Intraluminal gastric and duodenal concentrations of paromomycin were determined after oral administration of a solution of the marker to five healthy subjects. The simulation of fed state conditions was also assessed in this study by the oral administration of a liquid meal (Ensure Plus®). All volunteers ingested 400 mL of Ensure Plus® 20 min prior to administration of the 250 mL of paromomycin solution. All integrated parameters in Model 10 that were applied to describe the average phenol red concentration-time profile of all participating volunteers (n = 11) are depicted in Table 3.
Table 3.
Integrated parameters that were used to describe the average phenol red concentrations along the different compartments in Model 10. The parameters assigned with ‘*’ are the parameters that were subject of optimization to estimate their value for each individual dataset.
| Parameter | Meaning | Value | Reference |
|---|---|---|---|
| *t1/2stm_antrum | Half-life of emptying of the antrum (min) | 13 | Optimized by curve fitting |
| *t1/2stm_body | Half-life of emptying of the body (min) | 276 | Optimized by curve fitting |
| *t1/2stm_bypass | Half-life of emptying from gastric bypass compartment (min) | 13 | Optimized by curve fitting |
| *t1/2_duo | Duodenal half-life of emptying (min) | 10.8 | Optimized by curve fitting |
| *t1/2_jej | Jejunal half-life of emptying (min) | 25.6 | Optimized by curve fitting |
| *tlag | Initial lag time (min) | Optimized by curve fitting | |
| Vrstm | Residual volume stomach (mL) | 35 | [26] |
| Vrduo | Residual volume duodenum (mL) | 6 | [26] |
| Vrjej | Residual volume jejunum (mL) | 12 | [26] |
| Ca0 | Initial dose phenol red administered (μg/mL) | 100 | [2] |
| kabs | First-order absorption rate constant of water in duodenum and jejunum (min−1) | 0.0096 | [27,28] |
| *fbypass | Fraction initial dose emptied from stomach directly into antrum | 0.35 | Optimized by curve fitting |
2.5. Phenol red & paromomycin bioanalytical method
Phenol red concentrations were analyzed in gastric, duodenal and jejunal fluids for all healthy volunteers that participated the clinical study. Bioanalyses of phenol red were performed using an Agilent 1100 series high-performance liquid chromatography (HPLC) system controlled by Chemstation® 32 software (version B.01.03) which is equipped with an Agilent Zorbax Eclipse XDB-C18 (5 μm, reversed phase) 4.6 × 150 mm column. A mixture of 5% acetonitrile containing 0.1% TFA and 95% water containing 0.1% TFA served as mobile phases as the initial condition of gradient mode at a flow rate of 1.0 mL/min at ambient temperature. The acetonitrile gradient changes from 5% to 95% in a 14 min run for phenol red. The UV detection was accomplished at 430 nm. The concentration was calculated with the standard solution of phenol red and the bioanalysis method was validated according to the FDA guidelines [29]. Paromomycin was analyzed in human gastric and duodenal fluids by HPLC-FLUO as stated by Hens et al. [13]. Briefly, paromomycin was derivatized with 9-fluorenyl methoxycarbonyl chloride (FMOC-CL). After centrifugation, 20 μL of the supernatant was added to 430 μL of borate buffer (0.4 M, adjusted to pH 8 with 50% w/v potassium hydroxide solution). Upon addition of 500 μL of an FMOC-CL solution in acetonitrile (4 mM), the mixture was incubated in the dark and repeatedly vortexed to allow for paromomycin derivatization. After 10 min, the reaction was stopped by adding 50 μL of glycine solution in borate buffer (0.1 M). Potential protein in the samples was separated by centrifuging the samples. Subsequently, 10 μL of supernatant was injected into the HPLC. An isocratic run with acetonitrile: water (87:13 v/v) was performed with a flow rate of 1 mL/min to generate a retention time of 7.8 min. The bioanalytical method was validated according to the FDA guidelines [29].
2.6. External data acquisition
Experimental data from paromomycin (solution and tablet) [11,13] were extracted from literature data with the aid of “GetData Graph Digitizer” V.2.26.
3. Results and discussion
3.1. MTM of phenol red and paromomycin in the fasted state
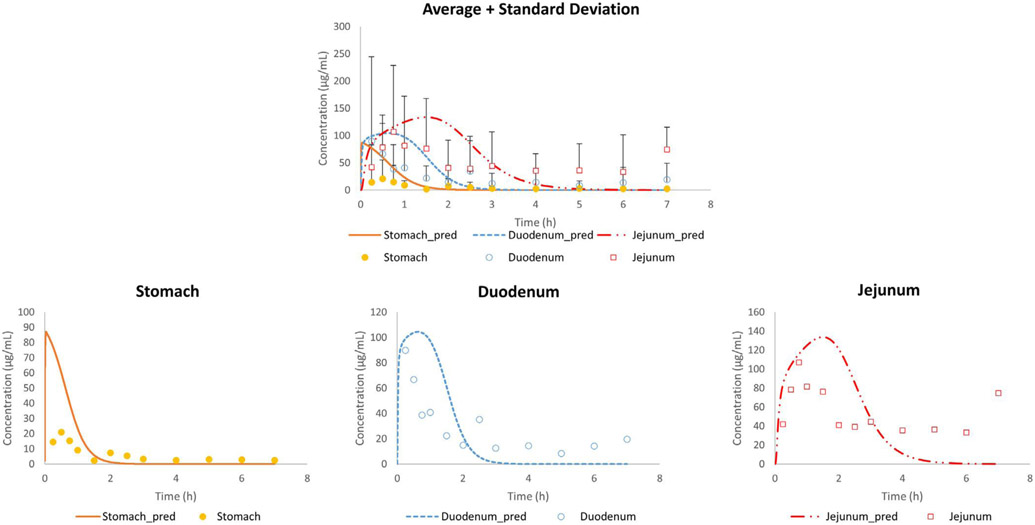
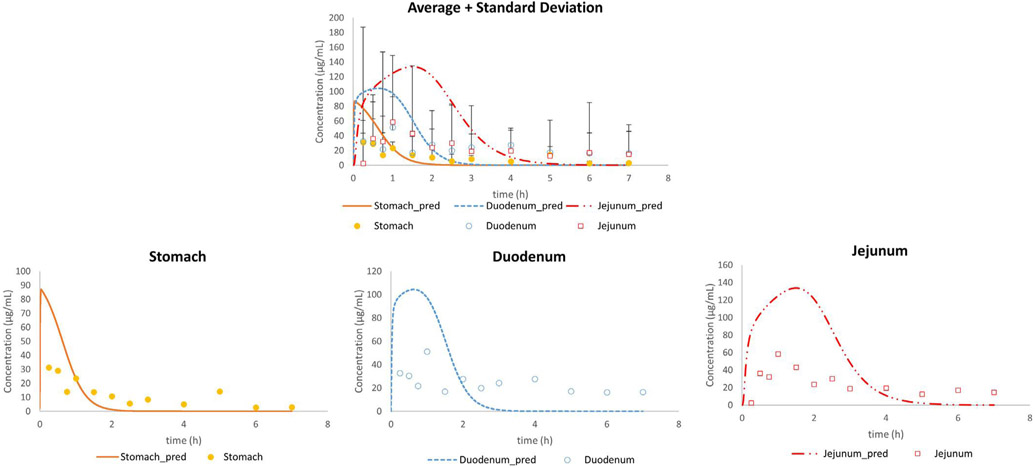
In the first set of experiments, the average concentration-time profiles of phenol red were compared with the adjusted outcomes of Model 1: observed gastric, duodenal and jejunal phenol red concentrations were directly compared with adjusted concentrations (Fig. 5).
Fig. 5.
Average in vivo (n = 13; mean + SD) and adjusted concentration-time profiles of phenol red for all subjects in the stomach, duodenum and jejunum using Model 1.
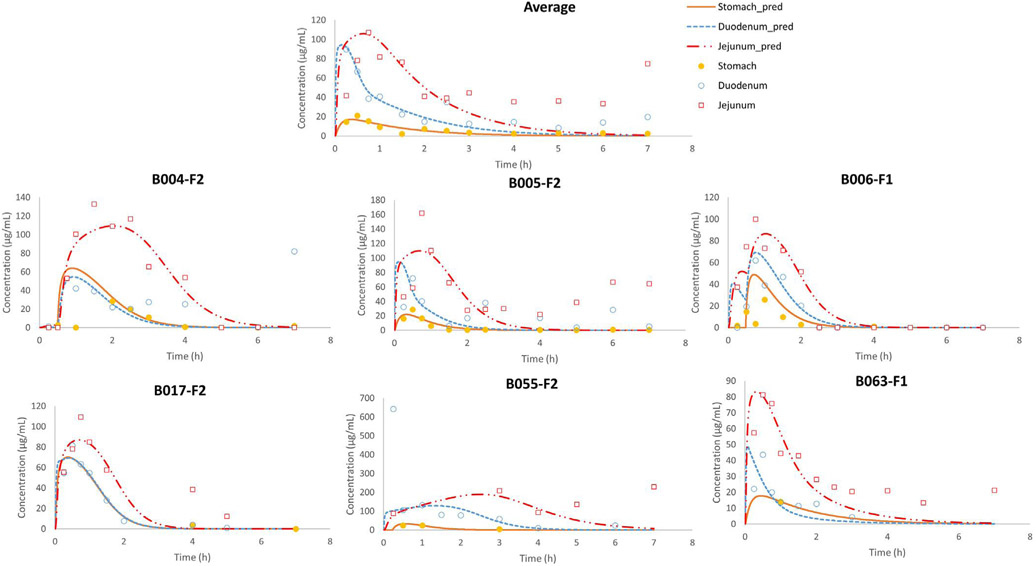
It was clear that the predictions did not match with the observed data, especially not for the initial gastric concentration-time points. Based on a previous magnetic resonance imaging (MRI) study, it was shown that a liquid empties the stomach extremely fast, captured by a first-order kinetic process [26]. However, to date, it is still a question how the administered water would be distributed in the stomach after oral administration. To the extent of our knowledge, only two external aspiration studies have been performed looking at the intragastric distribution of a nonabsorbable marker in humans. In the first study, a solution of paromomycin was administered to healthy volunteers and concentrations were measured in the antrum and duodenum. Based on the results of this study, gastric concentrations of paromomycin were very variable between subjects which could be attributed to (i) an extremely fast gastric emptying process due to the early and high maximal concentration of paromomycin in the duodenum after oral intake and/or (ii) inhomogeneous mixing of the residual gastric fluids and the solution at the time of administration. Gastric emptying time was measured in that particular study and confirmed the extremely fast process of gastric emptying. To investigate the second hypothesis, a follow-up study looked at the intragastric distribution of paromomycin in the body and antrum of the human stomach after oral administration of an immediate-release tablet during a phase I and a phase II period of the MMC cycle. It was observed that administration of the tablet during the more contractile phase II resulted in a more homogeneous distribution of the marker along the stomach. Additionally, Imai et al. have proposed, based on numerical simulations with an anatomically realistic geometry, the existence of an area in the proximal stomach with poor mixing, acting as a reservoir [30]. Urbain et al. clearly demonstrated the transit of the stomach content from the upper stomach to the antral zone with peristaltic contractions by applying a visualization technique with a radionuclide, demonstrating that the stomach content mixing is neither instantaneous nor homogeneous [31]. More recently, Weitschies et al. applied magnetic marker monitoring (MMM) of a solid dosage form and observed the location of the tablet in the stomach after the oral administration [32]. The tablet resided in the upper stomach for a while before transiting to the antrum. Based on these insights, we extended Model 1 to Model 8, that divides the gastric compartment into three different compartments: the body, the stomach and the bypass compartment, as demonstrated in Fig. 3. The revised model was able to adequately simulate the intraluminal concentrations of phenol red in the different segments of the GI tract for fasted state subjects B004-F2, B005-F2, B006-F1, B017-F2, B055-F2 and B063-F1 (Fig. 6).
Fig. 6.
Observed and simulated average and individual fasted state concentration-time profiles of phenol red as a function of time. Stomach concentrations refer to the concentrations measured (in vivo) and simulated (in silico) in the antrum. Adjusted values were derived from the simulations of model 8.
Table 4 depicts the values of the different parameters that were integrated into model 8 in order to simulate the observed phenol red concentration-time profiles of the different subjects.
Table 4.
Applied values for fasted state subjects B004-F2, B005-F2, B006-F1, B017-F2, B055-F2 and B063-F1 to adjust the gastric (antral), duodenal and jejunal concentrations of phenol red as a function of time.
| B004-F2 | B005-F2 | B006-F1 | B017-F2 | B055-F2 | B063-F1 | Median | Mean | SD | CV% | |
|---|---|---|---|---|---|---|---|---|---|---|
| t1/2 (min) antrum | 12 | 8.02 | 5.4 | 14.7 | 12.96 | 7.8 | 10 | 10.1 | 3.59 | 35.4 |
| t1/2 (min) body | 24 | 23.5 | 19.7 | 14.9 | 15 | 55.2 | 21.6 | 25.4 | 15.1 | 59.5 |
| t1/2 (min) bypass | 14.2 | 3.36 | 17.9 | 2.88 | 7.2 | 13.8 | 10.5 | 9.9 | 6.29 | 63.5 |
| t1/2 (min) duodenum | 1.37 | 3.24 | 1.92 | 2.26 | 22.8 | 0.54 | 2.1 | 5.4 | 8.59 | 160 |
| t1/2 (min) jejunum | 23.4 | 16.8 | 8.35 | 8.83 | 43.5 | 6.6 | 12.8 | 17.9 | 14.1 | 78.5 |
| Fraction bypassed | 0.003 | 0.8 | 0.2 | 0.1 | 0.8 | 0.7 | 0.45 | 0.434 | 0.372 | 85.7 |
| Lag time (tlag (min)) | 29.8 | / | 14.9 | / | 14 | / | 14.9 | 19.5 | 8.89 | 45.5 |
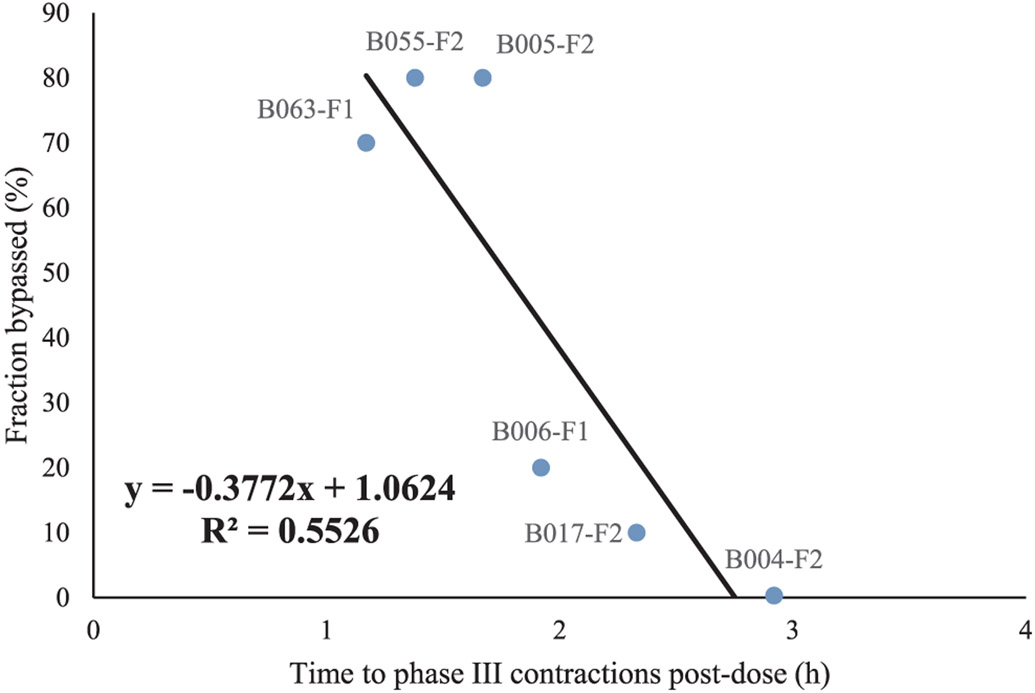
The coefficient of variation (CV) is highly variable, which can be explained by the fact that the phenol red solution will encounter a different chemical and physical environment in the stomach, depending on the dosing time relative to the GI motility cycle. The parameters displayed in Table 2 that were used to describe the average phenol red concentrations across 13 subjects are in good agreement with the optimized parameters for each individual subject as depicted in Table 4. For these 13 subjects, not a complete dataset of phenol red concentrations was available in all the different segments (stomach, duodenum and jejunum), but only partial data was available. The fraction of administered phenol red solution that was directly emptied into the duodenum was on average 43%, which is extremely high. The fast emptying of the administered solution was more pronounced for subjects with an early onset of phase III contractions post-dose, as demonstrated in Fig. 7.
Fig. 7.
The bypassed fraction of phenol red for each subject as a function of the time when the first phase III contractions were observed post-dose.
The fraction bypassed correlated negatively with the time to the MMC phase 3 post-dose, indicating that the motility state at the time of dosing is a principal determinant of initial gastric emptying rate. This trend between the bypassed fraction and the time to appearance of phase III contractions (i.e., the house-keeper wave) post-dose clearly demonstrates the motility-dependent gastric emptying of the phenol red solution. The same observations were observed by Oberle et al. in 1990 who clearly demonstrated how the interdigestive MMC influences the gastric emptying of liquids in humans after oral administration of 50- and 200 mL phenol red solutions [33]. In general, the gastric emptying of water in the fasted state is an extremely fast process: a recent MRI study performed by Grimm and colleagues showed the intersubject variability in gastric emptying of an administered glass of water. The measured gastric emptying half-life was on average 7 ± 4 min for the administered water, whereas a delayed gastric emptying was observed for grapefruit juice (35 ± 27 min) and an isocaloric glucose solution (33 ± 22 min), most likely due to the caloric content of these beverages [34].
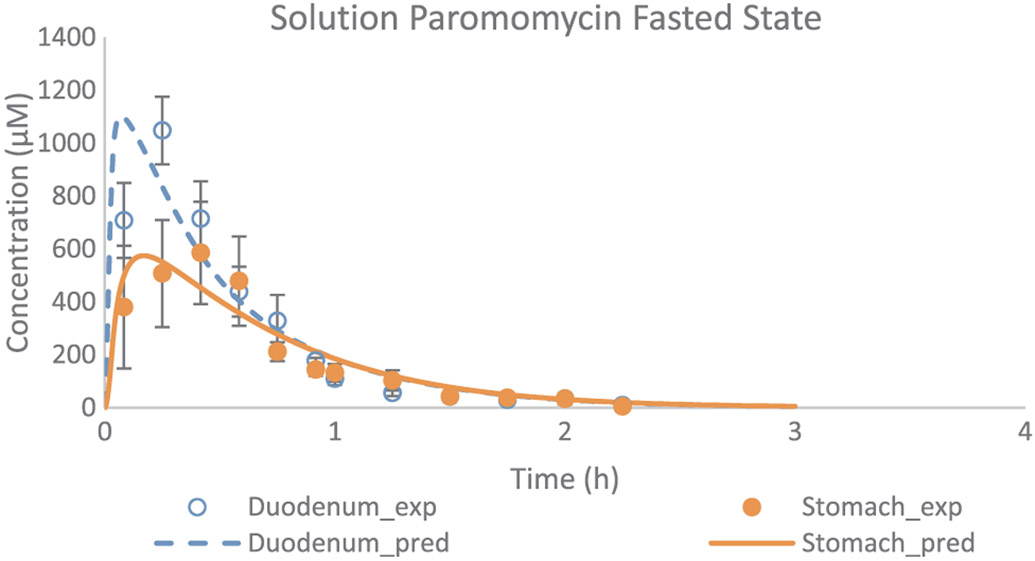
In addition, Model 8 was applied in a next step to simulate the gastric and duodenal paromomycin concentrations as observed in five healthy volunteers after oral administration of a paromomycin solution. Gastric and duodenal fluids were aspirated from the stomach and duodenum using two independent catheters (Salem Sump, TM PVC Gastroduodenal Tube, 14 Ch (4.7 mm) - 108 cm; Covidien, Dublin, Ireland). The sampling procedure was similar as performed at The University of Michigan. Observed and adjusted data are given in Fig. 8.
Fig. 8.
Experimental and adjusted fasted state concentration-time profiles of paromomycin as a function of time. Applied values were derived from the adjustments of Model 8. Observed values are expressed as mean ± SEM (n = 5) and obtained from literature [13].
Remarkably, the lower gastric concentrations that were observed in this study were hard to explain by the authors. As there were no manometric recordings in this study, dose administration could not be related to motility phase, which is an important variable in explaining gastric emptying of liquids (reflected in the high variability of SEM as depicted in Fig. 8). We estimated an average bypassed fraction of 49% approximately (Table 5).
Table 5.
Applied values to simulate the average gastric and duodenal concentrations of paromomycin as a function of time in fasted state conditions after oral administration.
| Mean profile | |
|---|---|
| t1/2 (min) antrum | 2.71 |
| t1/2 (min) body | 22.1 |
| t1/2 (min) bypass | 6 |
| t1/2 (min) duodenum | 0.76 |
| Fraction bypassed | 0.49 |
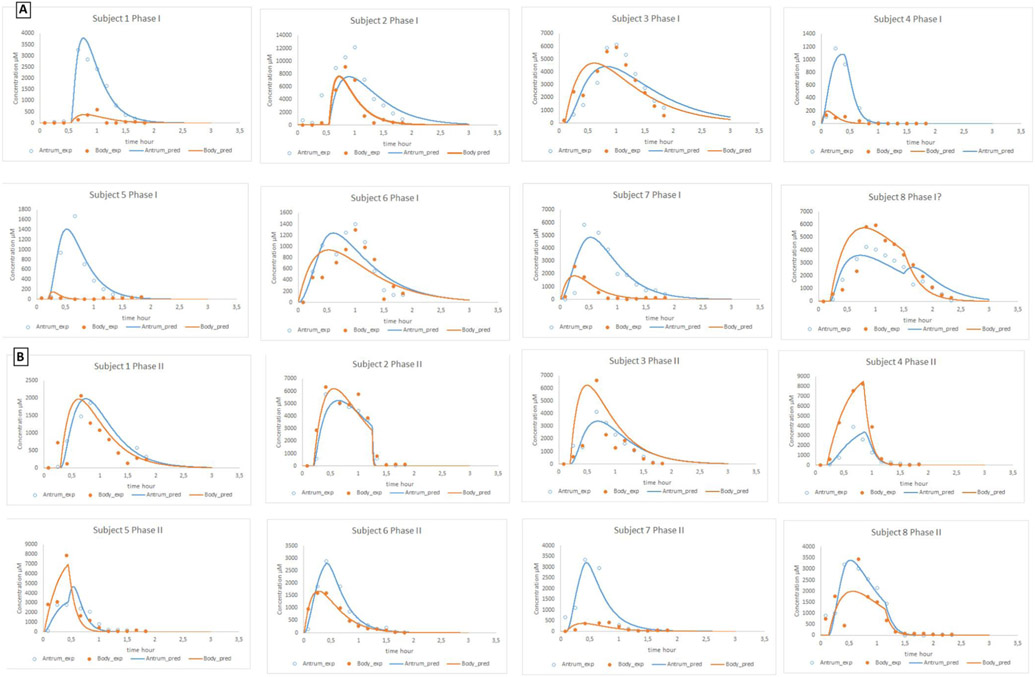
To validate the impact of the body and antrum compartment in Model 8, we used independent external reference data. In this study, an immediate-release tablet of paromomycin was administered to healthy volunteers and gastric fluids were aspirated from both segments in the stomach by two independent catheters [11]. The tablet was administered on two separate days: on the first test day, the tablet was administered during a phase I of the MMC cycle (Fig. 9A); on the second test day, the tablet was administered during a phase II of the MMC cycle (Fig. 9B).
Fig. 9.
(A) Experimental and adjusted concentration-time profiles of paromomycin after oral administration of an immediate-release tablet of 250 mg of paromomycin during a phase I contractile activity. (B) Experimental and simulated concentration-time profiles of paromomycin after oral administration of an immediate-release tablet of 250 mg of paromomycin during a phase II contractile activity. All observed data were obtained from literature [11].
A summary of the obtained values to simulate the observed profiles is given in Table 6.
Table 6.
Obtained values for all eight healthy volunteers in fasted to simulate the gastric, duodenal and jejunal concentrations of paromomycin after oral administration of an immediate-release tablet of 250 mg paromomycin. The upper table shows the values to simulate the GI concentrations when the tablet was administered during a phase I of the MMC cycle; the lower table shows the values to simulate the GI concentrations when the tablet was administered during a phase II of the MMC cycle. Tlag correspond to the lag time for starting the transit from body to antrum, while tlag diss is a lag time to initiate dissolution.
| Phase 1 | Average | SD | CV% | Median | Subject 1 | Subject 2 | Subject 3 | Subject 4 | Subject 5 | Subject 6 | Subject 7 | Subject 8 |
|---|---|---|---|---|---|---|---|---|---|---|---|---|
| t1/2 antrum (min) | 12 | 6 | 46 | 13 | 6 | 18 | 20 | 4 | 10 | 12 | 15 | 14 |
| t1/2 body (min) | 16 | 11 | 73 | 11 | 10 | 12 | 27 | 4 | 3 | 22 | 10 | 35 |
| t1/2 bypass (min) | 1 | 1 | 1 | 1 | 1 | 1 | 1 | 1 | 1 | 1 | ||
| t1/2 diss antrum (min) | 26 | 27 | 106 | 15 | 2 | 0 | 12 | 47 | 63 | 62 | 18 | 2 |
| t1/2 diss body (min) | 105 | 82 | 78 | 111 | 180 | 7 | 35 | 180 | 180 | 184 | 42 | 33 |
| tlag diss (min) | 12 | 14 | 114 | 9 | 32 | 33 | 6 | 0 | 12 | 0 | 1 | 12 |
| tlag (min) | 24 | / | / | 24 | 24 | 24 | 24 | 24 | 24 | 24 | 24 | 24 |
| Time to phase III contraction post-dose (min) | 90 | / | / | 90 | / | / | / | / | / | / | / | 90 |
| Fraction bypassed | 0.43 | / | / | 0.43 | 0.43 | 0.43 | 0.43 | 0.43 | 0.43 | 0.43 | 0.43 | 0.43 |
| Phase 2 | Average | SD | CV% | Median | Subject 1 | Subject 2 | Subject 3 | Subject 4 | Subject 5 | Subject 6 | Subject 7 | Subject 8 |
| t1/2 antrum (min) | 14 | 9 | 69 | 10 | 9 | 15 | 11 | 35 | 15 | 7 | 7 | 9 |
| t1/2 body (min) | 27 | 22 | 82 | 19 | 15 | 22 | 18 | 75 | 47 | 11 | 12 | 19 |
| t1/2 bypass (min) | 1 | 0 | 28 | 1 | 1 | 1 | 1 | 2 | 2 | 1 | 1 | 1 |
| t1/2 diss antrum (min) | 10 | 8 | 79 | 8 | 20 | 1 | 18 | 4 | 2 | 19 | 10 | 7 |
| t1/2 diss body (min) | 65 | 78 | 120 | 41 | 54 | 18 | 17 | 32 | 28 | 50 | 253 | 70 |
| tlag diss (min) | 9 | 6 | 68 | 10 | 18 | 12 | 12 | 12 | 1 | 1 | 6 | 8 |
| tlag (min) | 24 | / | / | 24 | 24 | 24 | 24 | 24 | 24 | 24 | 24 | 24 |
| Time to phase III contraction post-dose (min) | 56 | 22 | 39 | 60 | / | 75 | / | 51 | 27 | / | / | 69 |
| Fraction bypassed | 0.43 | / | / | 0.43 | 0.43 | 0.43 | 0.43 | 0.43 | 0.43 | 0.43 | 0.43 |
In some cases, a house-keeper wave (i.e., strong burst of phase III contractions) was implemented in order to remove the drug out of the stomach compartment as the in vivo data demonstrated a major drop in gastric concentrations of paromomycin after a certain time point. This was mostly seen for the second arm of the study when the tablet was administered during the phase II of the MMC cycle. For immediate-release dosage forms of BCS class I compounds, the absorption rate will be determined by the rate of gastric emptying [35]. The rate of gastric emptying for a 50 and 200 mL liquid is in the same line as observed for the immediate-release tablet of paromomycin, suggesting that if drug dissolution is fast enough (i.e., 85% dissolved in less than 15 min), bioequivalence can be insured as stated by the biowaiver guideline [35]. After administration, it is highly likely that a phase III contractile wave occurs in the subsequent two hours of the study time, thereby removing the drug content out from the stomach. From a historical point of view, it has always been assumed that no sex-related differences exist regarding gastric emptying. However, this remains controversial since there is more evidence that women have slower gastric emptying rates [36]. Gender-related differences in gastric emptying can also be attributed to the stomach shape, which is one of the future topics to investigate by MRI studies [36-42]. Differences in the half-life for dissolution between the body and antrum can be explained by the differences in motility patterns between both segments: the body and fundus are crucial for the accommodation of ingested food by acting as a distensible reservoir through the regulation of gastric wall tonicity, whereas the antrum is responsible for the mixing, propulsion and eventual expulsion of gastric contents from the stomach into the upper small intestine. This facilitates the disintegration of the tablet and dissolution of the drug compound [12].
3.2. MTM of phenol red and paromomycin in the fed state
Fig. 10 shows the average phenol red concentrations of all volunteers in the different segments of the GI tract using the simple Model 1.
Fig. 10.
Average in vivo (n = 11; mean + SD) and adjusted concentration-time profiles of phenol red for all fed subjects in the stomach, duodenum and jejunum using Model 1. Observed data is presented as average + SD.
Again, as seen for the fasted state adjustments, the simulated profiles did not capture the observed profiles. The intake of food will delay the gastric emptying time (increasingly with greater caloric density and fat content) as antral contraction waves (ACW) initiate digestion of food content in the stomach. The drug will reside in the antrum for a longer period of time compared to the fasted state due to the fact that the ACW primarily initiate food digestion in the stomach causing a delay in gastric emptying [12,43]. However, as earlier mentioned in the introduction, the gastric emptying of water is not necessarily influenced by the presence of food. In the case of a liquid meal, it has been demonstrated that water directly reached the antrum and was subsequently rapidly emptied from the stomach into the small intestine, following the ‘Magenstrasse’ [14,44].
Even for a solid meal, it was shown by Koziolek and colleagues that a fast gastric emptying of water was observed, orally administered 30 min after ingestion of high-caloric, high-fat standard breakfast [45]. After administration of a meal, the total gastric volume can expand tremendously in response to the ingested meal, which is also known as ‘gastric accommodation’. The fundus will serve as a reservoir and the food will be slowly transported to the antrum by gastric wall contractions. Due to the lipids present in the meal, differences in density between the water and food content will result in a flow of water that resides on top of the meal (as seen on MRI scans), resulting in a different distribution of the administered water throughout the stomach [45]. Therefore, revision of the gastric compartment is essential and necessary, both in the fasted as in the fed state. A recent study demonstrated how the texture of the meal, in terms of fat content, was identified as highly important for the formation of an intragastric pathway for water by performing MRI studies [44].
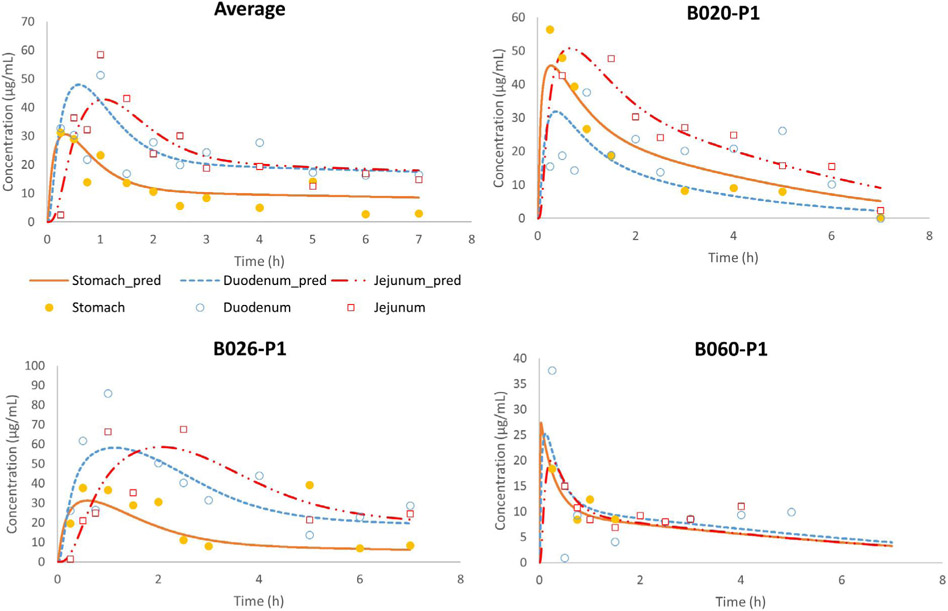
These insights led to Model 10 that describes the distribution of the drug in the body and antrum and contains a bypass compartment that can easily transport the drug towards the antrum after oral ingestion. Fig. 11 demonstrates the average and individual simulated gastric, duodenal and jejunal concentration-time profiles of phenol red derived from Model 10 and compared with the average concentration-time profiles as observed in the clinical study.
Fig. 11.
Observed and simulated average fed state concentration-time profiles of phenol red as a function of time. Stomach concentrations refer to the concentrations measured (in vivo) and simulated (in silico) in the antrum. Adjusted values were derived from the simulations of Model 10.
Table 7 demonstrates the applied values for the integrated parameters of Model 10 to describe the simulated individual profiles.
Table 7.
Applied values for fasted state subjects B020-P1, B026-P1 and B060-P1 to simulate the gastric (antral), duodenal and jejunal concentrations of phenol red as a function of time.
| B020-P1 | B026-P1 | B060-P1 | Median | Mean | SD | CV% | |
|---|---|---|---|---|---|---|---|
| t1/2(min) antrum | 24 | 16 | 10 | 16 | 17 | 7 | 42 |
| t1/2(min) body | 100 | 247 | 115 | 115 | 154 | 81 | 53 |
| t1/2(min) bypass | 8 | 33 | 0 | 8 | 14 | 17 | 126 |
| t1/2(min) duodenum | 2 | 29 | 2 | 2 | 11 | 16 | 142 |
| t1/2(min) jejunum | 14 | 26 | 4 | 14 | 15 | 11 | 75 |
| Fraction bypassed | 0.40 | 0.43 | 0.20 | 0.40 | 0.34 | 0.13 | 36 |
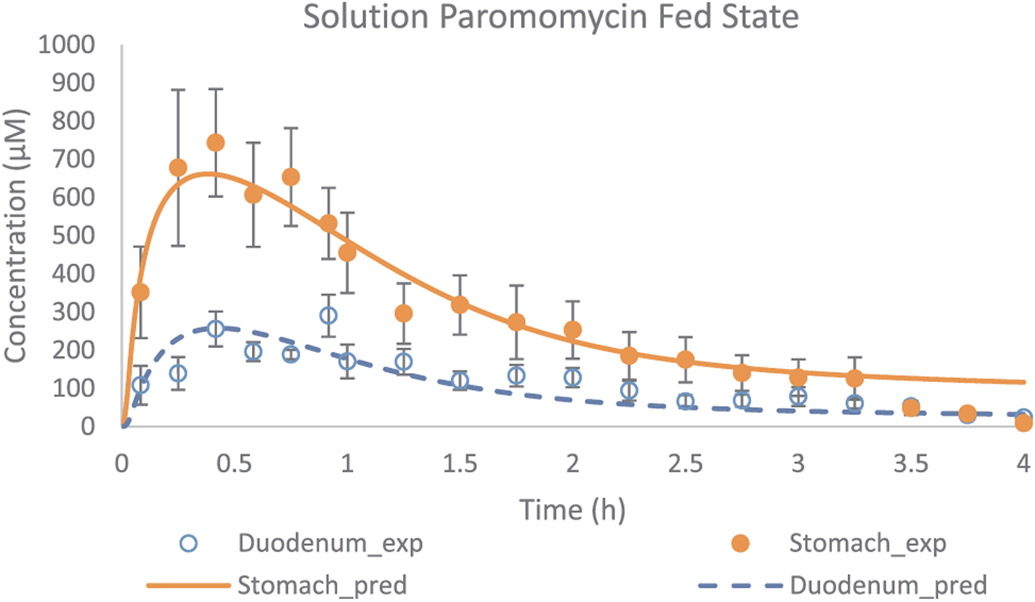
The parameters displayed in Table 3 that were used to describe the average phenol red concentrations across 11 subjects are in good agreement with the optimized parameters for each individual subject as depicted in Table 7. To validate this model, external intraluminal data of paromomycin concentrations were used. Twenty minutes after administration of the 400 mL liquid meal (Ensure Plus®), a 250 mL solution of paromomycin was administered to 5 healthy volunteers. Subsequently, antral and duodenal fluids were aspirated using two different catheters as a function of time and paromomycin concentrations were measured in these aspirates [13]. Fig. 12 depicts the observed concentration-time profiles of paromomycin versus the simulated ones, derived from Model 10.
Fig. 12.
Experimental and simulated fed state concentration-time profiles of paromomycin as a function of time. Applied values were derived from the adjustments of Model 10. Observed values are expressed as mean ± SEM (n = 5) and obtained from Hens et al. [13].
Table 8 presents the applied values to simulate the individual observed concentration-time profiles of paromomycin for each volunteer.
Table 8.
Applied values to simulate the average gastric and duodenal concentrations of paromomycin as a function of time.
| Average profile | |
|---|---|
| t1/2 (min) antrum | 11.4 |
| t1/2 (min) body | 276 |
| t1/2 (min) bypass | 22.6 |
| t1/2 (min) duodenum | 0.6 |
| Fraction bypassed | 0.45 |
| Volume meal (mL) | 400 |
Half-life values are quite low as the administered paromomycin solution can easily flow to the antrum and emptied rapidly into the duodenum. Gastric half-life values of the antrum are in line with the gastric half-life values observed in the fasted state. This can be explained by the fact that the gastric water emptying in the fed state can be as fast as in the fasted state, as recently demonstrated by Grimm et al. [44].
Overall, the approach to develop a predefined model to adequately describe the passage of water throughout the stomach and small intestine accurately simulates the experimental observations. Moreover, the model highlights the importance of integrating more complex yet essential aspects of GI physiology especially related to the stomach, both in fasted and fed state.
4. Conclusion and future directions
The present study developed a mechanistic, in silico multi-compartmental model that adequately simulates the mass transport of phenol red and paromomycin throughout the stomach, duodenum and jejunum. In order to capture the intraluminal concentrations of phenol red and paromomycin as observed in healthy volunteers, it was necessary to develop a dynamic, physiologically-relevant model that could capture the different concentration-time profiles in the several segments of the GI tract. The results required a change from a one-compartmental design of the stomach to a more accurate, multi-compartmental approach in order to reflect drug distribution in different regions of the stomach as a consequence of randomly dosing relative to the different contractile phases of the MMC. In case of the fasted state simulations, the alternative route for liquids to travel directly from the upper part of the stomach to the upper part of the small intestine is a major variable that must be considered for the volumes present in the intestinal tract for further drug dissolution. In case of the fed state, it was of utmost importance to include a bypass compartment to facilitate the transport of the phenol red solution directly to the antrum. The fasted state and fed state models were validated with external reference data from an independent aspiration study, using another nonabsorbable marker (paromomycin). Future studies will focus on implementing time-dependent motility into both models in order to evaluate the impact of motility pressure events on local drug concentrations along the GI tract. Furthermore, both models will serve as a template to simulate the MTM of ibuprofen, a BCS class 2a drug compound, in the different segments of the GI tract in fasted and fed state conditions. Additions to the models will be added in order to simulate intestinal absorption and pH-dependent dissolution. The predictive power of both models will need to be further validated by available intraluminal and systemic drug level results. Exploring the various physiological variables simultaneously will allow us to create more insights into GI physiology and how it affects oral drug absorption and systemic availability [41].
Supplementary Material
Acknowledgments
This work was supported by grant # HHSF223201510157C and grant # HHSF223201310144C by the U.S. Food and Drug Administration (FDA). This report represents the scientific views of the authors and not necessarily that of the FDA. Bart Hens would like to acknowledge the Internal Funds of KU Leuven (PDM/17/164).
Footnotes
Appendix A. Supplementary material
Supplementary data associated with this article can be found, in the online version, at https://doi.org/10.1016/j.ejpb.2018.05.033.
References
- [1].Walravens J, Brouwers J, Spriet I, Tack J, Annaert P, Augustijns P, Effect of pH and comedication on gastrointestinal absorption of posaconazole: monitoring of intraluminal and plasma drug concentrations, Clin. Pharmacokinet 50 (2011) 725–734, 10.2165/11592630-000000000-00000. [DOI] [PubMed] [Google Scholar]
- [2].Hens B, Tsume Y, Bermejo M, Paixao P, Koenigsknecht MJ, Baker JR, Hasler WL, Lionberger R, Fan J, Dickens J, Shedden K, Wen B, Wysocki J, Loebenberg R, Lee A, Frances A, Amidon G, Yu A, Benninghoff G, Salehi N, Talattof A, Sun D, Amidon GL, Low buffer capacity and alternating motility along the human gastrointestinal tract: implications for in vivo dissolution and absorption of ionizable drugs, Mol. Pharm 14 (2017) 4281–4294, 10.1021/acs.molpharmaceut.7b00426. [DOI] [PubMed] [Google Scholar]
- [3].Koenigsknecht MJ, Baker JR, Wen B, Frances A, Zhang H, Yu A, Zhao T, Tsume Y, Pai MP, Bleske BE, Zhang X, Lionberger R, Lee A, Amidon GL, Hasler WL, Sun D, In vivo dissolution and systemic absorption of immediate release ibuprofen in human gastrointestinal tract under fed and fasted conditions, Mol. Pharm 14 (2017) 4295–4304, 10.1021/acs.molpharmaceut.7b00425. [DOI] [PMC free article] [PubMed] [Google Scholar]
- [4].Talattof A, Price JC, Amidon GL, Gastrointestinal motility variation and implications for plasma level variation: oral drug products, Mol. Pharm 13 (2016) 557–567, 10.1021/acs.molpharmaceut.5b00774. [DOI] [PubMed] [Google Scholar]
- [5].Lennernäs H, Aarons L, Augustijns P, Beato S, Bolger M, Box K, Brewster M, Butler J, Dressman J, Holm R, Julia Frank K, Kendall R, Langguth P, Sydor J, Lindahl A, McAllister M, Muenster U, Müllertz A, Ojala K, Pepin X, Reppas C, Rostami-Hodjegan A, Verwei M, Weitschies W, Wilson C, Karlsson C, Abrahamsson B, Oral biopharmaceutics tools - time for a new initiative - an introduction to the IMI project OrBiTo, Eur. J. Pharm. Sci 57 (2014) 292–299, 10.1016/j.ejps.2013.10.012. [DOI] [PubMed] [Google Scholar]
- [6].Lennernäs H, Lindahl A, Van Peer A, Ollier C, Flanagan T, Lionberger R, Nordmark A, Yamashita S, Yu L, Amidon GL, Fischer V, Sjögren E, Zane P, McAllister M, Abrahamsson B, In vivo predictive dissolution (IPD) and biopharmaceutical modeling and yseion: future use of modern approaches and methodologies in a regulatory context, Mol. Pharm 14 (2017) 1307–1314, 10.1021/acs.molpharmaceut.6b00824. [DOI] [PubMed] [Google Scholar]
- [7].Verwei M, Minekus M, Zeijdner E, Schilderink R, Havenaar R, Evaluation of two dynamic in vitro models simulating fasted and fed state conditions in the upper gastrointestinal tract (TIM-1 and tiny-TIM) for investigating the bioaccessibility of pharmaceutical compounds from oral dosage forms, Int. J. Pharm 498 (2016) 178–186, 10.1016/j.ijpharm.2015.11.048. [DOI] [PubMed] [Google Scholar]
- [8].Matsui K, Tsume Y, Amidon GE, Amidon GL, The evaluation of in vitro drug dissolution of commercially available oral dosage forms for itraconazole in gastrointestinal simulator with biorelevant media, J. Pharm. Sci 105 (2016) 2804–2814, 10.1016/j.xphs.2016.02.020. [DOI] [PubMed] [Google Scholar]
- [9].Thuenemann EC, Mandalari G, Rich GT, Faulks RM, Dynamic Gastric Model (DGM), in: Verhoeckx K, Cotter P, López-Expósito I, Kleiveland C, Lea T, Mackie A, Requena T, Swiatecka D, Wichers H (Eds.), The Impact of Food Bioactives on Health, Springer International Publishing, 2015, pp. 47–59,, 10.1007/978-3-319-16104-4_6. [DOI] [PubMed] [Google Scholar]
- [10].Bellmann S, Lelieveld J, Gorissen T, Minekus M, Havenaar R, Development of an advanced in vitro model of the stomach and its evaluation versus human gastric physiology, Food Res. Int 88 (2016) 191–198, 10.1016/j.foodres.2016.01.030. [DOI] [Google Scholar]
- [11].Van Den Abeele J, Brouwers J, Tack J, Augustijns P, Exploring the link between gastric motility and intragastric drug distribution in man, Eur. J. Pharm. Biopharm 112 (2017) 75–84, 10.1016/j.ejpb.2016.10.027. [DOI] [PubMed] [Google Scholar]
- [12].Hasler WL, The physiology of gastric motility and gastric emptying, in: Adjunctessor TYMP (Ed.), Textbook of Gastroenterology, Blackwell Publishing Ltd., 2008, pp. 207–230, , 10.1002/9781444303254.ch10. [DOI] [Google Scholar]
- [13].Hens B, Brouwers J, Anneveld B, Corsetti M, Symillides M, Vertzoni M, Reppas C, Turner DB, Augustijns P, Gastrointestinal transfen in vivo evaluation and implementation in in vitro and in silico predictive tools, Eur. J. Pharm. Sci 63 (2014) 233–242, 10.1016/j.ejps.2014.07.008. [DOI] [PubMed] [Google Scholar]
- [14].Pal A, Brasseur JG, Abrahamsson B, A stomach road or “Magenstrasse” for gastric emptying, J. Biomech 40 (2007) 1202–1210, 10.1016/j.jbiomech.2006.06.006. [DOI] [PubMed] [Google Scholar]
- [15].Deloose E, Janssen P, Depoortere I, Tack J, The migrating motor complex: control mechanisms and its role in health and disease, Nat. Rev. Gastroenterol. Hepatol 9 (2012) 271–285, 10.1038/nrgastro.2012.57. [DOI] [PubMed] [Google Scholar]
- [16].Stein S, Auel T, Kempin W, Bogdahn M, Weitschies W, Seidlitz A, Influence of the test method on in vitro drug release from intravitreal model implants containing dexamethasone or fluorescein sodium in poly (D, L-lactide-co-glycolide) or polycaprolactone, Eur. J. Pharm. Biopharm (2018), 10.1016/j.ejpb.2018.02.034. [DOI] [PubMed] [Google Scholar]
- [17].Schneider F, Beeck R, Hoppe M, Koziolek M, Weitschies W, In vitro simulation of realistic gastric pressure profiles, Eur. J. Pharm. Sci 107 (2017) 71–77, 10.1016/j.ejps.2017.06.037. [DOI] [PubMed] [Google Scholar]
- [18].Gorham FD, The factor of dilution in gastric analysis, JAMA 81 (1923) 1738–1742, 10.1001/jama.1923.02650210004002. [DOI] [Google Scholar]
- [19].Bloom DS, Jacobson ED, Grossman MI, Validation of dilution indicators in the stomach, Gastroenterology 52 (1967) 205–210, 10.1016/S0016-5085(67)80008-8. [DOI] [PubMed] [Google Scholar]
- [20].Clarke RJ, Williams JA, The value of phenol red and chromic chloride as nonabsorbable gastric indicators, Gut 12 (1971) 389–392. [DOI] [PMC free article] [PubMed] [Google Scholar]
- [21].Dahlgren D, Roos C, Lundqvist A, Tannergren C, Langguth P, Sjöblom M, Sjögren E, Lennernäs H, Preclinical effect of absorption modifying excipients on rat intestinal transport of model compounds and the mucosal barrier marker 51Cr-EDTA, Mol. Pharm 14 (2017) 4243–4251, 10.1021/acs.molpharmaceut.7b00353. [DOI] [PubMed] [Google Scholar]
- [22].Schedl HP, Use of polyethylene glycol and phenol red as unabsorbed indicators for intestinal absorption studies in man, Gut 7 (1966) 159–163. [DOI] [PMC free article] [PubMed] [Google Scholar]
- [23].Ashley JJ, Levy G, Effect of vehicle viscosity and an anticholinergic agent on bioavailability of a poorly absorbed drug (phenolsulfonphthalein) in man, J. Pharm. Sci 62 (1973) 688–690. [DOI] [PubMed] [Google Scholar]
- [24].Gouda MW, Khalafalah N, Khalil SA, Effect of surfactants on absorption through membranes V: Concentration-dependent effect of a bile salt (sodium deoxycholate) on absorption of a poorly absorbable drug, phenolsulfonphthalein, in humans, J. Pharm. Sci 66 (1977) 727–728. [DOI] [PubMed] [Google Scholar]
- [25].Khalafallah N, Gouda MW, Khalil SA, Effect of surfactants on absorption through membranes IV: effects of dioctyl sodium sulfosuccinate on absorption of a poorly absorbable drug, phenolsulfonphthalein, in humans, J. Pharm. Sci 64 (1975) 991–994. [DOI] [PubMed] [Google Scholar]
- [26].Mudie DM, Murray K, Hoad CL, Pritchard SE, Garnett MC, Amidon GL, Gowland PA, Spiller RC, Amidon GE, Marciani L, Quantification of gastrointestinal liquid volumes and distribution following a 240 mL dose of water in the fasted state, Mol. Pharm 11 (2014) 3039–3047, 10.1021/mp500210c. [DOI] [PubMed] [Google Scholar]
- [27].Nilsson Fagerholm, Lennernäs Knutson, Jejunal permeability in humans invivo and rats insitu: investigation of molecular size selectivity and solvent drag, Acta Physiologica Scandinavica. 165 (1999) 315–324, 10.1046/j.1365-201x.1999.00510.x. [DOI] [PubMed] [Google Scholar]
- [28].Paixão P, Gouveia LF, Morais JAG, Prediction of the human oral bioavailability by using in vitro and in silico drug related parameters in a physiologically based absorption model, Int. J. Pharm 429 (2012) 84–98, 10.1016/j.ijpharm.2012.03.019. [DOI] [PubMed] [Google Scholar]
- [29].Food & Drug Administration, Guidance for Industry: Bioanalytical Method Validation, 2001. https://www.fda.gov/downloads/Drugs/GuidanceComplianceRegulatoryInformation/Guidances/UCM070107.pdf (accessed April 18, 2017).
- [30].Imai Y, Kobayashi I, Ishida S, Ishikawa T, Buist M, Yamaguchi T, Antral recirculation in the stomach during gastric mixing, Am. J. Physiol. Gastrointest. Liver Physiol 304 (2013) G536–G542, 10.1152/ajpgi.00350.2012. [DOI] [PubMed] [Google Scholar]
- [31].Urbain JL, Van Cutsem E, Siegel JA, Mayeur S, Vandecruys A, Janssens J, De Roo M, Vantrappen G, Visualization and characterization of gastric contractions using a radionuclide technique, Am. J. Physiol 259 (1990) G1062–G1067. [DOI] [PubMed] [Google Scholar]
- [32].Weitschies W, Blume H, Mönnikes H, Magnetic marker monitoring: high resolution real-time tracking of oral solid dosage forms in the gastrointestinal tract, Eur. J. Pharm. Biopharm 74 (2010) 93–101, 10.1016/j.ejpb.2009.07.007. [DOI] [PubMed] [Google Scholar]
- [33].Oberle RL, Chen TS, Lloyd C, Barnett JL, Owyang C, Meyer J, Amidon GL, The influence of the interdigestive migrating myoelectric complex on the gastric emptying of liquids, Gastroenterology 99 (1990) 1275–1282. [DOI] [PubMed] [Google Scholar]
- [34].Grimm M, Koziolek M, Saleh M, Schneider F, Garbacz G, Kuhn JP, Weitschies W, Gastric emptying and small bowel water content after administration of grapefruit juice compared to water and iso-caloric solutions of glucose and fructose: a four-way crossover MRI pilot study in healthy subjects, Mol. Pharm (2018), 10.1021/acs.molpharmaceut.7b00919. [DOI] [PubMed] [Google Scholar]
- [35].Amidon GL, Lennernäs H, Shah VP, Crison JR, A theoretical basis for a biopharmaceutic drug classification: the correlation of in vitro drug product dissolution and in vivo bioavailability, Pharm Res. 12 (1995) 413–420, 10.1023/A:1016212804288. [DOI] [PubMed] [Google Scholar]
- [36].Wang YT, Mohammed SD, Farmer AD, Wang D, Zarate N, Hobson AR, Hellström PM, Sender JR, Kuo B, Rao SS, Hasler WL, Camilleri M, Scott SM, Regional gastrointestinal transit and pH studied in 215 healthy volunteers using the wireless motility capsule: influence of age, gender, study country and testing protocol, Aliment. Pharmacol. Ther 42 (2015) 761–772, 10.1111/apt.13329. [DOI] [PubMed] [Google Scholar]
- [37].Burdan F, Rozylo-Kalinowska I, Szumilo J, Zinkiewicz K, Dworzanski W, Krupski W, Dabrowski A, Anatomical classification of the shape and topography of the stomach, Surg. Radiol. Anat 34 (2012) 171–178, 10.1007/s00276-011-0893-8. [DOI] [PMC free article] [PubMed] [Google Scholar]
- [38].Fukumoto S, Amano Y, Fukuda R, Gobaru Y, Adachi K, Ashizawa N, Yoshida H, Watanabe M, Shimada Y, Gastric emptying in deformed stomach, Gastroenterol. Jpn 22 (1987) 1–6. [DOI] [PubMed] [Google Scholar]
- [39].Kanaizumi T, Studies on the gastric emptying related to the types of stomach forms in healthy subjects, Nihon Heikatsukin Gakkai Zasshi. 20 (1984) 95–110. [DOI] [PubMed] [Google Scholar]
- [40].Khalaf A, Hoad CL, Spiller RC, Gowland PA, Moran GW, Marciani L, Magnetic resonance imaging biomarkers of gastrointestinal motor function and fluid distribution, World J. Gastrointest. Pathophysiol 6 (2015) 140–149, 10.4291/wjgp.v6.i4.140. [DOI] [PMC free article] [PubMed] [Google Scholar]
- [41].Hens B, Corsetti M, Spiller R, Marciani L, Vanuytsel T, Tack J, Talattof A, Amidon GL, Koziolek M, Weitschies W, Wilson CG, Bennink RJ, Brouwers J, Augustijns P, Exploring gastrointestinal variables affecting drug and formulation behavior: methodologies, challenges and opportunities, Int. J. Pharm 59 (2016) 79–97, 10.1016/j.ijpharm.2016.11.063. [DOI] [PubMed] [Google Scholar]
- [42].Datz FL, Christian PE, Moore J, Gender-related differences in gastric emptying, J. Nucl. Med 28 (1987) 1204–1207. [PubMed] [Google Scholar]
- [43].Houghton LA, Mangnall YF, Read NW, Effect of incorporating fat into a liquid test meal on the relation between intragastric distribution and gastric emptying in human volunteers, Gut 31 (1990) 1226–1229. [DOI] [PMC free article] [PubMed] [Google Scholar]
- [44].Grimm M, Scholz E, Koziolek M, Kühn J-P, Weitschies W, Gastric water emptying under fed state clinical trial conditions is as fast as under fasted conditions, Mol. Pharm (2017), 10.1021/acs.molpharmaceut.7b00623. [DOI] [PubMed] [Google Scholar]
- [45].Koziolek M, Grimm M, Garbacz G, Kühn J-P, Weitschies W, Intragastric volume changes after intake of a high-caloric, high-fat standard breakfast in healthy human subjects investigated by MRI, Mol. Pharm 11 (2014) 1632–1639, 10.1021/mp500022u. [DOI] [PubMed] [Google Scholar]
Associated Data
This section collects any data citations, data availability statements, or supplementary materials included in this article.


