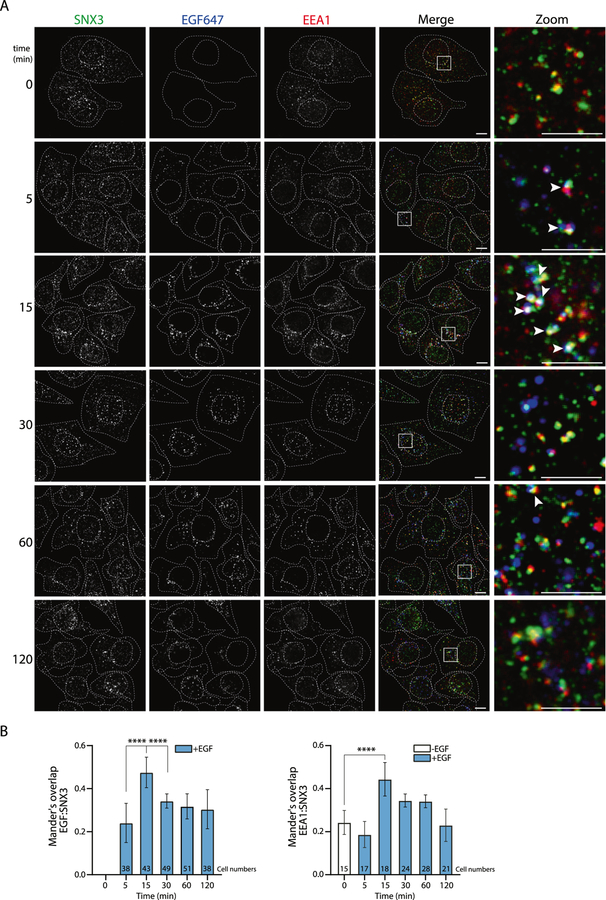
Fig. 4. Time-dependent interactions of SNX3.
A Representative images of confocal microscopy show SNX3, EEA1, and EGF in HeLa cells. Boxed regions in the merge images indicate zoomed areas. The colocalization of SNX3 (green), EGF (blue), and EEA1 (red) are highlighted with white arrows in the zoom images. Dashed white lines indicate cell and nuclear boundaries. Scale bars are 10 μm. B Graphs of colocalization analyses were plotted using Mander’s overlap values, which were quantified from multi-cell images. Cell numbers are shown in the bar graphs. Data are from 3 independent experiments. Statistical significance was calculated using one-way ANOVA with Tukey’s multiple comparison test. ****p < 0.0001.

