

Abstract
Background and Objectives
Short-chain fatty acids (SCFAs) are gut microbial metabolites that promote the disease process in a rodent model of Parkinson disease (PD), but fecal levels of SCFAs in patients with PD are reduced. Simultaneous assessments of fecal and plasma SCFA levels, and their interrelationships with the PD disease process, are scarce. We aimed to compare fecal and plasma levels of different SCFA subtypes in patients with PD and healthy controls to delineate their interrelations and link to gut microbiota changes and clinical severity of PD.
Methods
A cohort of 96 patients with PD and 85 controls were recruited from National Taiwan University Hospital. Fecal and plasma concentrations of SCFAs were measured using chromatography and mass spectrometry. Gut microbiota was analyzed using metagenomic shotgun sequencing. Body mass index and medical comorbidities were evaluated and dietary information was obtained using a food frequency questionnaire. To assess motor and cognitive impairment, we used the Movement Disorder Society–Unified Parkinson's Disease Rating Scale (MDS-UPDRS) and the Mini-Mental Status Examination (MMSE).
Results
Compared with controls, patients with PD had lower fecal but higher plasma concentrations of acetate, propionate, and butyrate. After adjustment for age, sex, disease duration, and anti-PD medication dosage, MDS-UPDRS part III motor scores correlated with reduced fecal levels of acetate (ρ = −0.37, p = 0.012), propionate (ρ = −0.32, p = 0.036), and butyrate (ρ = −0.40, p = 0.004) and with increased plasma propionate concentrations (ρ = 0.26, p = 0.042) in patients with PD. MMSE scores negatively correlated with plasma levels of butyrate (ρ = −0.09, p = 0.027) and valerate (ρ = −0.032, p = 0.033) after adjustment for confounders. SCFAs-producing gut bacteria correlated positively with fecal levels of SCFAs in healthy controls but revealed no association in patients with PD. In the PD patient group, the abundance of proinflammatory microbes, such as Clostridiales bacterium NK3B98 and Ruminococcus sp AM07-15, significantly correlated with decreased fecal levels and increased plasma levels of SCFAs, especially propionic acid.
Discussion
Reductions in fecal SCFAs but increased plasma SCFAs were observed in patients with PD and corelated to specific gut microbiota changes and the clinical severity of PD.
Classification of Evidence
This study provides Class III evidence that gut metabolite SCFAs distinguish between patients with PD and controls and are associated with disease severity in patients with PD.
Emerging evidence suggests that the pathologic hallmarks of Parkinson disease (PD), Lewy bodies, originate in the gut enteric nervous system before the onset of motor dysfunction in patients with PD.1 Studies in rodent PD models have shown that α-synuclein aggregations could propagate from the enteric nervous system to the brainstem through the vagus nerve.1,2 Gastrointestinal symptoms may precede motor symptoms by decades.3 This gut–brain hypothesis has led to numerous studies showing that patients with PD have a distinct gut microbiota structure compared with controls and that changes in gut microbiota correlate with disease severity and progression.4-6
Short-chain fatty acids (SCFAs) are the main metabolites produced by gut bacterial fermentation of dietary fiber and are speculated to be pivotal in gut–brain crosstalk.7,8 SCFAs are absorbed in the colonocytes and transported to the liver via the portal venous system, and some SCFAs enter the systemic circulation. Acetic acid (C2), propionic acid (C3), and butyric acid (C4) are the most abundant SCFAs in the colon.9 SCFAs have local effects in maintaining intestinal barrier integrity and shaping gut mucosal innate immunity.10 They also have remote effects in the blood–brain barrier (BBB) by promoting tight junction proteins and crossing BBB to activate neurons through stimulation of G protein–coupled receptors.11,12 An in vivo study using a transgenic α-synuclein–expressing mouse model demonstrated that a germ-free environment eliminates disease phenotypes but that oral feeding with SCFAs resurfaced PD-related neuropathology by augmenting neuroinflammation.7 These findings suggest that SCFAs are required for the development of the PD process. However, results for SCFAs in patients with PD conflict with these findings. Compared with healthy controls, patients with PD have reduced fecal SCFAs and their producing bacteria compared to healthy controls.8,13-15 Only a few studies have reported on circulating levels of SCFAs in patients with PD.16,17 An integrated study examining both fecal and plasma levels of SCFAs is lacking. Hence, we aimed to analyze and compare fecal and plasma levels of SCFAs in patients with PD and unaffected controls to delineate the interrelations of these levels and link to changes in gut microbiota and clinical severity of PD.
Primary Research Questions
Our primary research question was to determine whether fecal and plasma levels of SCFAs could distinguish patients with PD from controls and correlate with disease severity in patients with PD.
Methods
Standard Protocol Approvals, Registrations, and Patient Consents
The investigation conformed to the principles outlined in the Declaration of Helsinki. The study protocol was approved by the institutional review board of National Taiwan University Hospital. All participants signed written informed consent.
Participants and Clinical Evaluation
A total of 96 patients with PD and 85 control participants were recruited from National Taiwan University Hospital. PD was diagnosed according to the United Kingdom PD Society Brain Bank Clinical Diagnostic Criteria.18 Controls were neurologically unaffected participants who were spouses or accompanying friends of the patients with PD. Participants were excluded if they had previously used neuroleptic agents; had a history of inflammatory bowel disease, irritable bowel syndrome, colitis, colon cancer, or use of antibiotics or probiotic supplements within 3 months of enrollment; or were vegetarians. Of the enrolled participants, 30 patients with PD and 24 controls had also received 16S ribosomal RNA sequencing, which was previously published.19
A comprehensive dietary history was collected using the Food Frequency Questionnaire (FFQ).20,21 We evaluated motor symptom severity with the Movement Disorder Society–Unified Parkinson's Disease Rating Scale (MDS-UPDRS) part III score22 and Hoehn & Yahr staging during the “on” and “off” phase of PD.23 During “off” phase, patients with Hoehn & Yahr stage <3 were classified as having early-stage PD and those with stage ≥3 as having advanced-stage PD. Cognition was assessed with the Mini-Mental State Examination (MMSE) during the “on” phase of PD.24 PD with dementia (PDD) was diagnosed according to the criteria proposed by the Movement Disorder Society.25 An MMSE score ≤25 was applied as the cut-off value for significant cognitive impairment combined with any impairment in the 8 instrumental activities for the diagnosis of PDD.26 The dosage of anti-PD medications during the study period was converted into a levodopa equivalent daily dosage (LEDD).
Measurement of Fecal and Plasma Levels of SCFAs
We collected 10 mL of venous blood and fresh feces from each participant. Blood was sampled in the morning after participants had fasted for at least 10 hours. Total fecal DNA was extracted using a QIAamp DNA Stool Mini Kit (Qiagen). Fecal SCFA analysis was performed using the fresh fecal sample collected in a plastic tube within 24 hours after collection. Dietary information was obtained on the same day as blood collection using a self-administered FFQ.20,21 Fecal and plasma analyses for individual SCFAs were performed with gas chromatography–mass spectrometry and liquid chromatography–tandem mass spectrometry as described in eAppendix 1 (links.lww.com/WNL/B718).27,28
Measurement of Plasma Cytokine Levels
The plasma levels of proinflammatory cytokines, including interleukin-2, tumor necrosis factor–α, and interferon-γ (IFN-γ), were measured using the ProcartaPlex Human Th1/Th2 Cytokine Panel (Thermo Fisher Scientific) according to the manufacturer's instructions.
Gut Microbiota Analyses With Shotgun Metagenomic Sequencing
Fecal samples were collected into stool specimen collection tubes containing DNA stabilizer (Sarstedt), which were immediately flash-frozen on dry ice and stored at −80°C before analyses. Total fecal DNA was extracted using a QIAamp DNA Stool Mini Kit, as previously described and detailed in eAppendix 1 (links.lww.com/WNL/B718).19
Statistical Analysis
Continuous variables are expressed as mean ± SD and categorical variables as numbers and percentages. We tested the homogeneity of variances using the Levene test. Variables were compared with 2-tailed t tests or analysis of variance if normally distributed and with the nonparametric Mann-Whitney U test if assumptions of normality or homoscedasticity were violated. The concentrations of SCFAs in feces or plasma were log-transformed to achieve normal distribution before further analysis. A logistic regression model was applied to examine the relationship between SCFA levels and the occurrence of PD, with adjustment for age and sex. We used the area under the receiver operating characteristic (ROC) curve (AUC) to quantify the model's diagnostic performance for exploring the ability of SCFAs to distinguish between patients with PD and controls. To examine the associations between SCFAs and motor or cognitive symptom severity, we used multivariable linear regression models with MDS-UPDRS part III during “off” phase and MMSE scores as dependent factors. Independent variables included the log-transformed SCFA levels, age, sex, disease duration, LEDD, and usage of entacapone. For shotgun sequencing and bioinformatic analysis,29,30,31 details are addressed in eAppendix 1 (links.lww.com/WNL/B718).
Data Availability
The raw anonymized microbiome sequencing data were uploaded to the NCBI BioSample database (ncbi.nlm.nih.gov/biosample/) with the submission ID SUB10308106. Anonymized data not published within this article will be made available by request from any qualified investigator.
Results
A total of 181 participants including 96 patients with PD (67.5 ± 11.5 years of age, 60.4% male) and 85 normal controls (64.8 ± 8.2 years of age, 48.2% male) were enrolled in this study. Of the enrolled patients with PD, 10 were drug-naive (10.4%), 12 had motor fluctuation (12.5%), and 9 experienced peak-dose dyskinesia (9.4%) (Table 1). Among the control participants, 73 (85.9%) were spouse controls. The dietary intake patterns in all participants in the past year using the FFQ are summarized in eTable 1 (links.lww.com/WNL/B718). Patients and controls did not differ significantly in demographics or dietary intake patterns, including fiber intake, which is the main dietary source of SCFAs.
Table 1.
Clinical Characteristics and SCFA Levels in All Participants

Fecal and Plasma Levels of Different Types of SCFAs in Patients With PD and Controls
Patients with PD had significantly lower fecal concentrations of acetic acid (p = 0.004), propionic acid (p = 0.006), and butyric acid (p = 0.003) than controls (Table 1 and Figure 1, A–D). In contrast, plasma concentrations of circulating propionic acid (p = 0.009), butyric acid (p = 0.004), and valeric acid (p = 0.047) were increased in patients with PD compared to controls (Table 1 and Figure 2, A–D).
Figure 1. Comparison of Fecal Levels of Short Chain Fatty Acids in Patients With PD and Healthy Controls.
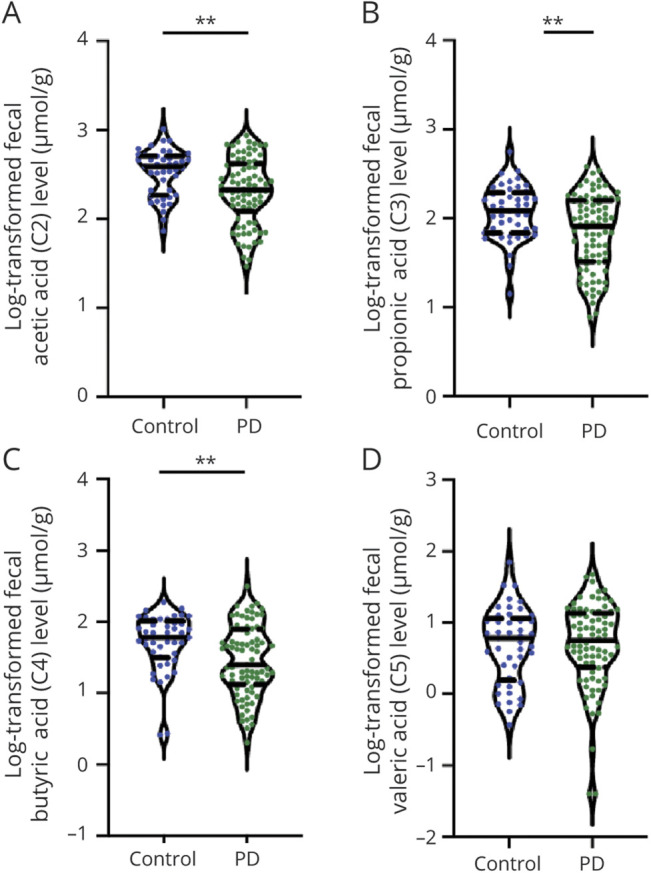
Violin plot shows data density and median with interquartile range (solid and dashed horizontal lines) for fecal levels of acetic acid (A), propionic acid (B), butyric acid (C), and valeric acid (D) in patients with Parkinson disease (PD) and unaffected controls. Mean ± SD (solid horizontal line, dashed horizontal line) is shown. *p < 0.05, **p < 0.01.
Figure 2. Comparison of Plasma Concentrations of Short Chain Fatty Acids in Patients With PD and Healthy Controls.
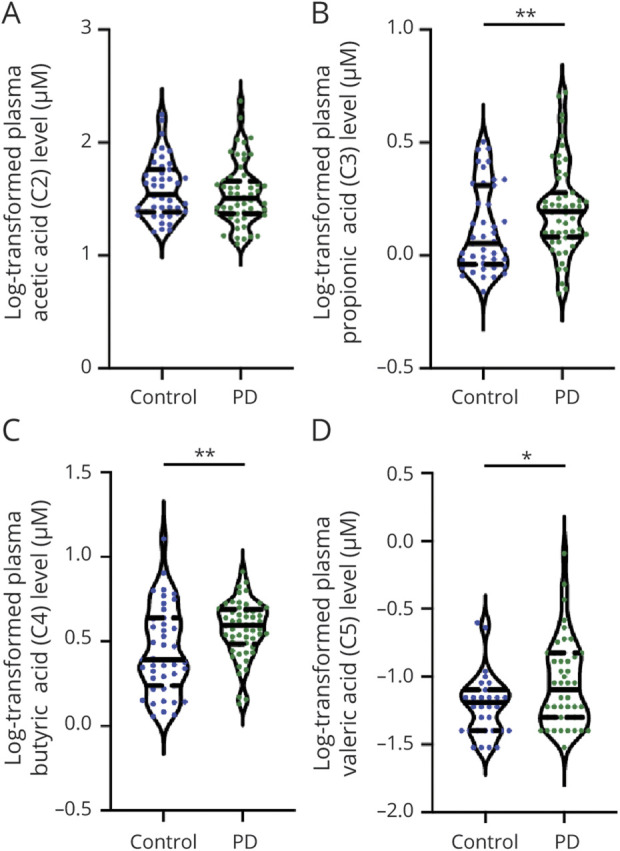
Violin plot shows data density and median with interquartile range (solid and dashed horizontal lines) for plasma concentrations of acetic acid (A), propionic acid (B), butyric acid (C), and valeric acid (D) in patients with Parkinson disease (PD) and unaffected controls. Mean ± SD (solid horizontal line, dashed horizontal line) is shown. *p < 0.05, **p < 0.01.
We first examined the possible influence of age on fecal and plasma SCFA levels. We found that age did not correlate with either measure for the individual SCFA types, except for plasma levels of isovaleric acid modestly correlating with age in controls (ρ = −0.37, p = 0.016). There were no significant correlations between fecal and plasma levels of the individual types of SCFAs (eFigure 1; links.lww.com/WNL/B718). We further observed that plasma levels of acetic acids correlated with IFN-γ (ρ = 0.301, p = 0.003) and showed a trend with TNF-α (ρ = 0.197, p = 0.051); plasma levels of butyric acids tended to correlate with IFN-γ (ρ = 0.194, p = 0.06) (eFigure 2).
We next examined whether fecal or plasma levels of individual SCFA types distinguished between patients with PD and controls. With adjustment for age and sex in multivariate logistic regression analysis, higher fecal levels of acetic acid (odds ratio [OR] 0.16, 95% confidence interval [CI] 0.04–0.57; p = 0.006), propionic acid (OR 0.20, 95% CI 0.06–0.60; p = 0.006), and butyric acid (OR 0.27, 95% CI 0.10–0.67; p = 0.007) were associated with a lower chance to be present in patients with PD. In contrast, the occurrence of PD was associated with higher plasma levels of propionic acid (OR 14.4, 95% CI 1.63–159; p = 0.021), butyric acid (OR 17.8, 95% CI 2.50–152; p = 0.006), and valeric acid (OR 8.70, 95% CI 1.49–67.3; p = 0.025) (eTable2, links.lww.com/WNL/B718).
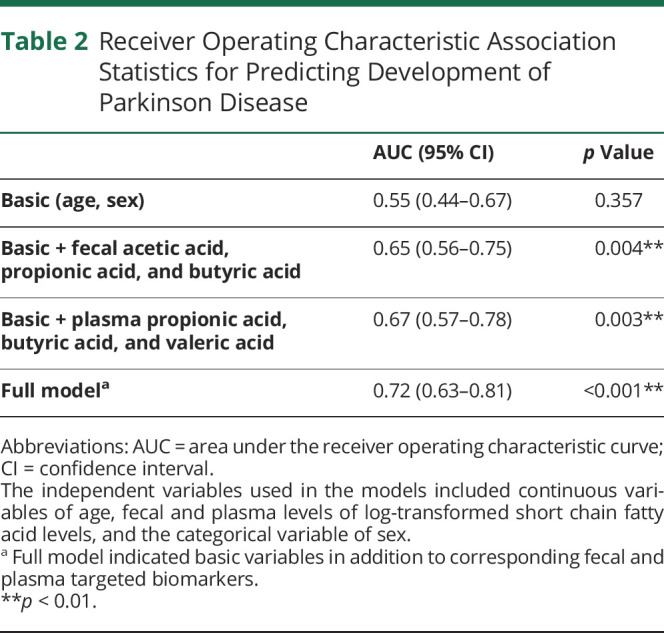
Based on the results of the logistic regression analyses, we next performed ROC curve analysis to predict PD occurrence. The prediction accuracy, expressed as the AUC, improved from 0.55 in the basic model (age and sex; p = 0.357) to 0.65 with the addition of fecal levels of acetic acid, propionic acid, and butyric acid, which differed significantly between the PD and control groups in the multivariate logistic regression analysis (p = 0.004). The AUC was 0.67 with the addition of plasma levels of propionic acid, butyric acid, and valeric acid (p = 0.003), which differed significantly between patients with PD and controls in the multivariate logistic regression analysis. The AUC further improved to 0.72 (p < 0.001) in the full model, which included age, sex, and the fecal and plasma levels of the targeted SCFAs (Figure 3A and Table 2).
Figure 3. ROC Curves for Distinguishing Patients With PD From Controls and Correlations Between SCFA Levels and Clinical Motor Symptom Severity in Patients With PD.

(A) The accuracy of estimating Parkinson disease (PD) using age and sex alone (area under the curve [AUC] = 0.55, p = 0.357) significantly improved with the addition of fecal levels of acetic acid, propionic acid, and butyric acid, which showed differences between patients with PD and controls (AUC = 0.65, p = 0.004). The accuracy of estimating the occurrence of PD further improved in a full model incorporating both fecal and plasma levels of targeted (SCFAs), which showed differences between patients with PD and controls (AUC = 0.72, p < 0.001). (B–D) Scatterplots show negative correlations between Movement Disorder Society–Unified Parkinson's Disease Rating Scale (MDS-UPDRS) part III motor scores and fecal levels of acetic acid (B), propionic acid (C), and butyric acid (D). ROC = receiving operating characteristic.
Table 2.
Receiver Operating Characteristic Association Statistics for Predicting Development of Parkinson Disease
Fecal and Plasma SCFA Levels and Motor Symptom Severity
Fecal levels of acetic acid, propionic acid, butyric acid, and valeric acid were all significantly reduced in patients with advanced-stage PD compared to those with early-stage disease (all p < 0.01; eFigure 3A, links.lww.com/WNL/B718). In contrast, plasma levels of valeric acid were significantly increased in patients with advanced-stage disease compared to those with early-stage PD (advanced-stage vs early-stage: 0.18 ± 0.19 vs 0.06 ± 0.06 µM; p = 0.003; eFigure 3B). Furthermore, fecal levels of acetic acid (ρ = −0.37, p = 0.005), propionic acid (ρ = −0.32, p = 0.015), and butyric acid (ρ = −0.40, p = 0.002) negatively correlated with MDS-UPDRS part III motor scores (Figure 3, B–D). However, plasma levels of propionic acid trended to correlate with MDS-UPDRS part III scores (ρ = 0.26, p = 0.086; eFigure 3C).
After adjustment for age, sex, disease duration, LEDD, and entacapone use, multivariate linear regression analysis revealed negative correlations of MDS-UPDRS part III scores with fecal levels of acetic acid, propionic acid, butyric acid, and isobutyric acid (Table 3). We included adjustment for LEDD and entacapone use in the multivariate analyses because of a recent study reporting that circulating propionic acid level is negatively correlated with entacapone use.15 Plasma propionic acid levels positively correlated with MDS-UPDRS part III scores after adjustment for the covariates (coefficient = 24.4, 95% CI 1.00–47.7, p = 0.042; Table 3). These findings suggested that lower fecal levels of most SCFAs and increased plasma levels of propionic acid were associated with worse motor performance in patients with PD.
Table 3.
Correlations Between Fecal and Plasma Levels of Individual Type of SCFAs and Symptom Severity in PD

Fecal and Plasma SCFAs Levels and Cognitive Symptom Severity
Fecal levels of different types of SCFAs were comparable between patients with PD with normal cognition and those with PDD (eFigure 4A, links.lww.com/WNL/B718). However, plasma levels of isobutyric acid (0.37 ± 0.17 vs 0.26 ± 0.08 µM; p = 0.023) and valeric acid (0.19 ± 0.21 vs 0.07 ± 0.06 µM; p = 0.005) were significantly higher in patients with PDD than in patients with PD with normal cognition (eFigure 4B). Consistent with this pattern, plasma levels of isobutyric acid (ρ = −0.41, p = 0.014) correlated negatively with MMSE scores, and valeric acid levels showed a trend to negatively correlate with MMSE scores in patients with PD (ρ = −0.32, p = 0.070; eFigure 4C).
With adjustment for age, sex, disease duration, LEDD, and entacapone use in the multivariate linear regression model, plasma levels of butyric acid (coefficient = −11.7, 95% CI −21.9 to −1.44; p = 0.027) and valeric acid (coefficient = −6.58, 95% CI −12.6 to −0.60; p = 0.033) were persistently found to negatively correlate with MMSE scores (Table 3), whereas fecal levels of butyric acid positively correlated with MMSE scores (coefficient = 2.95, 95% CI 0.60–5.31; p = 0.015; Table 3). These findings suggested that lower fecal but higher plasma butyric acid and increased plasma valeric acid were associated with worse cognition in patients with PD.
Gut Microbiome Species Correlate With Plasma and Fecal Levels of SCFAs
Metagenomic analysis of gut microbiome species showed that the bacterial richness within each sample (α-diversity) tended to be higher in patients with PD than in healthy controls (eFigure 5A, links.lww.com/WNL/B718), which are consistent with previous studies.19 The principal coordinates analysis revealed that patients with PD had different gut microbiota composition from healthy controls (β-diversity, analysis of similarities, p = 0.05; eFigure 5B).
We further explored the correlations between the relative abundance of gut microbiota and fecal or plasma levels of SCFAs. Heat maps representing Spearman correlations for the relative abundance of differential bacteria and SCFA concentrations in feces or plasma revealed that fecal levels of acetic acid, propionic acid, and butyric acid all correlated with the abundance of Bacteroides sp AM16-15 and Bacteroides sp AM25-34 in control participants (eFigure 6A, links.lww.com/WNL/B718). However, we did not find these positive correlations in patients with PD (eFigure 6B). Among patients with PD, the abundance of proinflammatory microbes, such as Clostridiales bacterium NK3B98 and Ruminococcus sp AM07-15, significantly correlated with decreased fecal levels and increased plasma levels of SCFAs, especially propionic acid (eFigure 6, B and C). Of note, plasma propionic acid levels were associated with PD occurrence and with motor symptom severity (Tables 2 and 3). Furthermore, the abundance of Ruminococcus sp AM28-29LB consistently correlated with reduced fecal levels of all SCFAs and increased plasma butyric acid (eFigure 6, B and C), which was associated with cognitive decline in PD (Table 3).
While combing the fecal and plasma SCFAs data as plasma-to-fecal ratios of the individual types of SCFAs, the abundance of Clostridiaceae bacterium AF31-3BH correlated with an elevated plasma-to-fecal ratio of propionic acid (Figure 4), a species closely related to Clostridium bacterium. The abundance of Roseburia sp Am16-25 correlated with the plasma-to-fecal ratio of acetic acid, and the abundance of Bifidobacterium bifidum and Eisenbergiella massiliensis correlated with an increased plasma-to-fecal ratio of butyric acid, which also was increased in patients with PDD. Of note, the abundance of Prevotella sp P3-122 was negatively associated with the plasma-to-fecal ratios of all measured SCFAs (Figure 4). Furthermore, as shotgun metagenomics analysis could provide extensive metabolic prediction capabilities, we observed that plasma levels of SCFAs, especially propionic acid, positively correlated with pathways of peptidoglycan maturation, guanosine nucleotides biosynthesis, L-aspartate and L-asparagine biosynthesis, and glycolysis IV (eFigure 7, links.lww.com/WNL/B718). Taken together, these findings indicate that alterations in the abundance of specific gut microbiota species with related metabolic pathways in patients with PD relative to unaffected controls are associated with plasma and fecal levels of different SCFAs, which correlate with either motor or cognitive severity in PD.
Figure 4. Heat Maps Representing the Spearman Correlation of the Relative Abundance of Different Bacteria and the Plasma-to-Fecal Ratios of SCFAs.
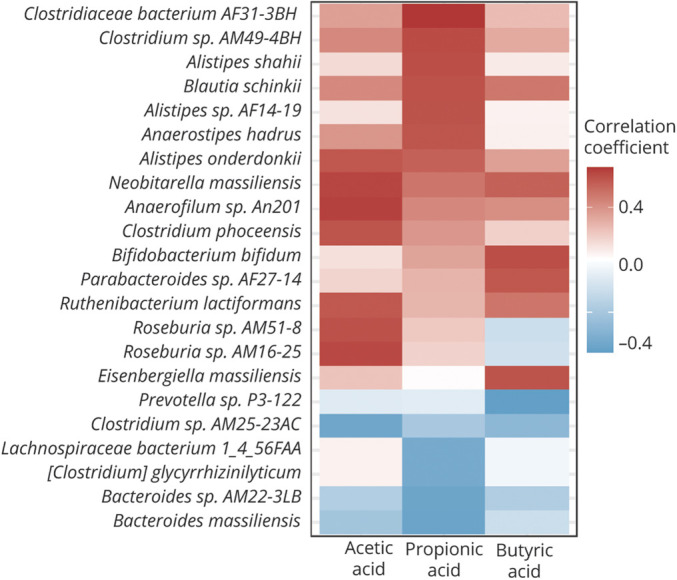
Correlations between plasma-to-fecal ratios of different types of short-chain fatty acids (SCFAs) in patients with Parkinson disease. The r values are represented by gradient colors, where red and blue cells indicate positive and negative correlations, respectively.
Classification of Evidence
This study provides Class III evidence that gut metabolite SCFAs distinguish between patients with PD and controls and are associated with disease severity in patients with PD.
Discussion
To our knowledge, this is the first integrated study concomitantly examining both plasma and fecal levels of individual SCFA types and linking to changes in gut microbiota and symptom severity in patients with PD compared with unaffected controls. We found that patients with PD had lower fecal but higher plasma concentrations of SCFAs compared to controls. We further demonstrated that after adjustment for confounders, the reduced fecal levels but increased plasma levels of SCFAs associated with gut microbiota changes and the clinical severity of PD.
In stool, we observed lower levels of SCFAs in patients with PD than controls, in line with several studies that previously found reduced fecal SCFAs levels in patients with PD.8,13-15 Similar to the findings of the current study, Tan et al.14 also found an association between reduced fecal SCFAs and worse cognitive and motor outcomes, whereas Aho et al.15 did not find correlations between fecal SCFAs and nonmotor symptom burden in PD. Consistently, recent evidence indicates that SCFAs-producing microbiota are also less abundant in association with PD disease severity, which predicts rapid motor and cognitive deterioration.4,32 In addition, we found that reduced fecal levels of SCFAs could distinguish patients with PD from controls and extend the current knowledge that levels of these SCFAs negatively correlated with motor severity after adjustment for potential confounders. Moreover, cognitive decline is one of the most disturbing nonmotor symptoms of PD. We observed that reduced fecal levels of butyric acid also correlated with cognitive decline in patients with PD. Gut luminal SCFAs are absorbed in colonocytes and are beneficial for maintaining the intestinal barrier and homeostasis.33 Reduced fecal SCFAs, especially butyric acid, are linked to the loss of intestinal tight junctions leading to leaky gut and increased intestinal inflammation, which is associated with aggravating the PD disease process.33 In healthy controls of this study, we found a positive correlation of fecal acetic acid, propionic acid, and butyric acid levels with abundance of Bacteroides sp AM16-15 and Bacteroides sp AM25-34, which are SCFA-producing microbiota.34,35 Notably, this correlation was not present in patients with PD. In line with these findings, in a recent study in a European population, a positive correlation between SCFAs and relative abundance of Bacteroides genera was reported in controls but not in patients with PD. Our results support a previous study that found SCFAs-producing bacteria to be reduced in PD but not REM sleep behavior disorder, suggesting that SCFAs may play a role in the development of PD.36
In plasma, we identified contradictory results that patients with PD had higher plasma concentrations of SCFAs than controls, except acetic acid. Plasma levels of propionic acid correlated with motor symptom severity, whereas butyrate and valerate concentrations associated with cognitive decline. One recent study similarly found plasma propionate level to be higher in patients with PD than controls, while the plasma levels of acetic acid and propionic acid decreased in patients with multiple system atrophy compared to those with PD.17 A case–control study in a Korean population also showed that plasma acetic acid was increased in patients with PD even though the level did not correlate with motor symptom severity.16 Recent evidence also revealed that concentrations of SCFAs are elevated in saliva and urine in patients with PD compared to the general population.15,37 Most of the SCFAs produced in the colon are absorbed and utilized by colonocytes, leaving only a minority entering the peripheral circulation.12 The current findings demonstrate that systemic levels of SCFAs were increased even as fecal levels of SCFAs were consistently reduced in patients with PD. One possible explanation for this divergence may come from increased intestinal permeability that allows SCFAs to enter the systemic circulation, implying an intestinal barrier malfunction. In support of this hypothesis, increased fecal zonulin level, a marker of gut permeability, and increased fecal calprotectin, a marker of gut inflammation, were recently reported in patients with PD compared to controls.15 In vivo rodent model studies also have shown that one of the earliest pathologic changes in PD is intestinal inflammation with impaired intestinal tight junctions that allow for increased infiltration of gut microbial metabolites into the systemic circulation.38 The “leaky gut phenomenon” in patients with PD may lead to a higher penetration of SCFAs from gut to the systemic circulation. However, among the subtypes of SCFAs, plasma level of acetic acid was not significantly increased in patients with PD. In addition to the possible leaky gut phenomenon effect, several conditions may contribute to the plasma levels of acetic acid. Acetic acid can be produced endogenously and the plasma level is influenced by metabolic stress, such as prolonged fasting, lipolysis, and glucagon-like peptide-1concentrations.39 These factors may influence the observed comparable plasma levels of acetic acid between patients with PD and controls in this study. The elevated SCFAs in systemic circulation may cross the BBB and affect the neuron–microglia microenvironment in the CNS. Although accumulating evidence supports the beneficial effects of SCFAs, including maintaining BBB integrity and affecting neurogenesis through epigenetic mechanisms, SCFAs may also exert pathologic effects if the level is over a concentration range that was shown to promote neuroinflammation in a transgenic α-synuclein rodent model.7 Further studies on the molecular mechanisms of different SCFAs at various concentration range in the CNS are warranted. Furthermore, while motor symptom severity positively correlated with plasma propionic acid levels, cognitive dysfunction correlated with circulating butyric acid and valeric acid concentrations. These associations may reflect the diverse pathophysiologic processes of motor and cognitive decline in PD.37 Links between systemic levels of valeric acid and brain pathology also have been reported in patients with Alzheimer disease,40 with higher plasma valeric acid associated with a greater degree of amyloid deposition and circulating inflammatory marker expression. In addition, levels of propionic acid in the systemic circulation correlated with motor symptom severity in the current work. In earlier studies, increased levels of this SCFA were reported to trigger mitochondrial dysfunction, activate T-cell immunity, and increase oxidative stress, especially in the striatum, leading to motor dysfunction in patients with autism spectrum disorder.41 The positive correlations between plasma levels of SCFAs and inflammatory markers in this study could be interpreted as supporting a relevant association between SCFAs and systemic inflammation. Further experimental studies exploring the molecular mechanisms of individual types of SCFAs in promoting neuroinflammation and neurodegeneration are warranted.
The plasma-to-fecal ratio of individual types of SCFAs could provide a better landscape of individual SCFAs in the leaky gut condition of PD process. We observed that the plasma-to-fecal ratios of separated SCFAs types were linked to the respective abundance of specific gut microbiota. For example, Bifidobacteria and Bacteroides spp produce acetate, whereas microbes from the Firmicutes phylum (Roseburia, Eubacterium, and Lachnospira) actively produce butyrate.42 The Bacteroides spp are Gram-negative Bacteroidetes and predominate in the human gut. Acetic acid is the most abundant SCFA and acts in maintenance of the normal structure, integrity, and function of the intestines.34 The absence of positive correlations between Bacteroides spp abundance and fecal levels of all types of SCFAs in patients with PD may suggest a dysbiosis state that leads to impaired intestinal barrier function in the disease process of PD.34 In addition, among patients with PD, we found that abundance of the proinflammatory Clostridiales bacterium correlated with the plasma-to-fecal ratio of propionic acid, whereas the abundance of another proinflammatory microbe, Ruminococcus sp AM28-29B, correlated with an increased plasma level of butyric acid. Clostridiales bacterium and Clostridiaceae taxa, such as Clostridium spp, are also associated with inflammatory bowel disease.43 The abundance of members of the Clostridiales order correlates positively with the regulatory T-cell transcription factor Foxp3, as does abundance of members of the phylum Verrucomicrobia.44 We therefore speculate that Clostridiales bacterium and Ruminococcus sp AM28-29B may be able to induce intestinal regulatory immune responses leading to intestinal inflammation and possibly explain the increased plasma-to-fecal ratios of propionic acid and butyric acid. Of note, the abundance of Prevotella spp P3-122 correlated with reduced plasma-to-fecal ratios of all SCFAs. Several studies, including our previous work, have shown a decreased abundance of Prevotellaceae and Prevotella genera in patients with PD.6,19 As commensals, Prevotellaceae bacteria are involved in mucin synthesis in the gut mucosal layer and in production of neuroactive SCFAs through fiber fermentation.45 The Prevotella sp P3-122 may partially explain the decreased plasma-to-fecal ratio of all SCFAs in patients with PD. Finally, although numerous studies have shown that propionic acid and butyric acid have anti-inflammatory effects, results conflict.7,13 Both pro- and anti-inflammatory activities of SCFAs have been documented, and dietary supplementation with SCFAs produces variable effects on inflammation that appear to be strongly influenced by SCFA concentration. Our further analysis showed plasma levels of SCFAs, especially propionic acids, positively correlated with peptidoglycan maturation pathway and glycolysis IV. Peptidoglycan is one of the pathogen-associated molecular patterns and has been shown to enhance proinflammatory cytokine secretion from activated microglia.46 Glycolysis is the conversion of glucose to pyruvate or lactate, which results in the generation of ATP and has been shown to be abnormally regulated in neurons in patients with PD.47 An in vivo model of zebrafish deficient in the familial PD–associated protein PTEN-induced kinase 1 observed an upregulation of TigarB, the ortholog of human TP53 induced glycolysis regulatory phosphatase (TIGAR).48 Further investigation is needed into how different concentrations of individual SCFA types affect immune responses in the context of PD pathology.
Our study has several limitations. First, we did not directly measure colonic SCFA concentrations but used fecal SCFA levels as a surrogate for colonic SCFA production and absorption. Second, we did not examine intestinal barrier function using a gut permeability assay in our participants, although one recent study has demonstrated gut hyperpermeability in patients with PD compared to controls.15 Third, cognitive function was assessed using MMSE. Further detailed neuropsychological tests are needed for assessing the correlation between SCFA levels and individual cognitive domain decline in patients with PD. Fourth, dietary intake pattern assessed by FFQ was comparable between patients with PD and controls, while some other studies reported between-group differences.49,50 As some controls enrolled in this study were spouses of the patients with PD, we speculate the common environment shared between spouse controls and patients with PD may contribute to the comparable dietary intake pattern between patients with PD and controls in this study. In addition, constipation and use of laxatives and anticholinergic agents or cholinesterase inhibitors may influence the results of gut microbiota and gut metabolites. Studies enrolling healthy controls from general populations and considering these potential confounders should be taken into account in the future. Furthermore, the diagnosis of PD was based on clinical diagnostic criteria in this study and lacks neuropathology confirmation. Finally, the cross-sectional study design precludes any inferences of a causal relationship between SCFAs and the disease process in PD. Further longitudinal follow-up studies with serial measurements of both fecal and plasma SCFAs are warranted.
Our findings suggest that gut metabolite SCFAs may serve as surrogate gut-oriented markers for distinguishing patients with PD from controls and reflecting disease severity. Further studies of the exact mechanisms of different SCFAs at neurons and microglia in experimental models should help to elucidate the complex gut–brain interactions in PD.
Acknowledgment
The authors thank the patients who participated in this study; the staff of the Second and Eighth Core Lab, Department of Medical Research, National Taiwan University Hospital, for technical support during the study; and the Ramaciotti Centre for Genomics, University of New South Wales, for the shotgun sequencing in this study.
Glossary
- AUC
area under the receiver operating characteristic curve
- BBB
blood–brain barrier
- CI
confidence interval
- FFQ
Food Frequency Questionnaire
- IFN-γ
interferon-γ
- LEDD
levodopa equivalent daily dose
- MDS-UPDRS
Movement Disorder Society–Unified Parkinson's Disease Rating Scale
- MMSE
Mini-Mental State Examination
- OR
odds ratio
- PD
Parkinson disease
- PDD
Parkinson disease with dementia
- ROC
receiver operating characteristic
- SCFA
short chain fatty acid
- TNF-α
tumor necrosis factor–α
Appendix. Authors

Footnotes
Class of Evidence: NPub.org/coe
Study Funding
This work was supported by grants from National Taiwan University (NTU-110-A-CC-5400-64841), National Taiwan University Hospital (NTUH 109-T18 and UN109-011), National Taiwan University Hospital Bei-Hu Branch (11005), and National Health Research Institutes (NHRI-EX110-10716NC).
Disclosure
The authors report no disclosures relevant to the manuscript. Go to Neurology.org/N for full disclosures.
References
- 1.Klingelhoefer L, Reichmann H. Pathogenesis of Parkinson disease: the gut–brain axis and environmental factors. Nat Rev Neurol. 2015;11(11):625-636. [DOI] [PubMed] [Google Scholar]
- 2.Kim S, Kwon SH, Kam TI, et al. Transneuronal propagation of pathologic α-synuclein from the gut to the brain models Parkinson's disease. Neuron. 2019;103(4):627-641. [DOI] [PMC free article] [PubMed] [Google Scholar]
- 3.Schrag A, Horsfall L, Walters K, Noyce A, Petersen I. Prediagnostic presentations of Parkinson's disease in primary care: a case-control study. Lancet Neurol. 2015;14(1):57-64. [DOI] [PubMed] [Google Scholar]
- 4.Nishiwaki H, Ito M, Ishida T, et al. Meta-analysis of gut dysbiosis in Parkinson's disease. Mov Disord. 2020;35(9):1626-1635. [DOI] [PubMed] [Google Scholar]
- 5.Qian Y, Yang X, Xu S, et al. Gut metagenomics-derived genes as potential biomarkers of Parkinson's disease. Brain. 2020;143(8):2474-2489. [DOI] [PubMed] [Google Scholar]
- 6.Scheperjans F, Aho V, Pereira PA, et al. Gut microbiota are related to Parkinson's disease and clinical phenotype. Mov Disord. 2015;30(3):350-358. [DOI] [PubMed] [Google Scholar]
- 7.Sampson TR, Debelius JW, Thron T, et al. Gut microbiota regulate motor deficits and neuroinflammation in a model of Parkinson's disease. Cell. 2016;167(6):1469-1480. [DOI] [PMC free article] [PubMed] [Google Scholar]
- 8.Unger MM, Spiegel J, Dillmann KU, et al. Short chain fatty acids and gut microbiota differ between patients with Parkinson's disease and age-matched controls. Parkinsonism Relat Disord. 2016;32:66-72. [DOI] [PubMed] [Google Scholar]
- 9.Cummings JH, Pomare EW, Branch WJ, Naylor CP, Macfarlane GT. Short chain fatty acids in human large intestine, portal, hepatic and venous blood. Gut. 1987;28(10):1221-1227. [DOI] [PMC free article] [PubMed] [Google Scholar]
- 10.Blacher E, Levy M, Tatirovsky E, Elinav E. Microbiome-modulated metabolites at the interface of host immunity. J Immunol. 2017;198(2):572-580. [DOI] [PubMed] [Google Scholar]
- 11.Vijay N, Morris ME. Role of monocarboxylate transporters in drug delivery to the brain. Curr Pharm Des. 2014;20(10):1487-1498. [DOI] [PMC free article] [PubMed] [Google Scholar]
- 12.Dalile B, Van Oudenhove L, Vervliet B, Verbeke K. The role of short-chain fatty acids in microbiota–gut–brain communication. Nat Rev Gastroenterol Hepatol. 2019;16(8):461-478. [DOI] [PubMed] [Google Scholar]
- 13.Mulak A. A controversy on the role of short-chain fatty acids in the pathogenesis of Parkinson's disease. Mov Disord. 2018;33(3):398-401. [DOI] [PubMed] [Google Scholar]
- 14.Tan AH, Chong CW, Lim SY, et al. Gut microbial ecosystem in Parkinson disease: new clinicobiological insights from multi-omics. Ann Neurol. 2021;89(3):546-559. [DOI] [PubMed] [Google Scholar]
- 15.Aho VTE, Houser MC, Pereira PAB, et al. Relationships of gut microbiota, short-chain fatty acids, inflammation, and the gut barrier in Parkinson's disease. Mol Neurodegener. 2021;16(1):6. [DOI] [PMC free article] [PubMed] [Google Scholar]
- 16.Shin C, Lim Y, Lim H, Ahn TB. Plasma short-chain fatty acids in patients with Parkinson's disease. Mov Disord. 2020;35(6):1021-1027. [DOI] [PubMed] [Google Scholar]
- 17.He X, Qian Y, Xu S, et al. Plasma short-chain fatty acids differences in multiple system atrophy from Parkinson's disease. J Parkinsons Dis. 2021;11(3):1167-1176. [DOI] [PubMed] [Google Scholar]
- 18.Hughes AJ, Daniel SE, Kilford L, Lees AJ. Accuracy of clinical diagnosis of idiopathic Parkinson's disease: a clinico-pathological study of 100 cases. J Neurol Neurosurg Psychiatry. 1992;55(3):181-184. [DOI] [PMC free article] [PubMed] [Google Scholar]
- 19.Lin CH, Chen CC, Chiang HL, et al. Altered gut microbiota and inflammatory cytokine responses in patients with Parkinson's disease. J Neuroinflammation. 2019;16(1):129. [DOI] [PMC free article] [PubMed] [Google Scholar]
- 20.Chiu TH, Huang HY, Chen KJ, et al. Relative validity and reproducibility of a quantitative FFQ for assessing nutrient intakes of vegetarians in Taiwan. Public Health Nutr. 2014;17(7):1459-1466. [DOI] [PMC free article] [PubMed] [Google Scholar]
- 21.Chiu THT, Chang HR, Wang LY, Chang CC, Lin MN, Lin CL. Vegetarian diet and incidence of total, ischemic, and hemorrhagic stroke in 2 cohorts in Taiwan. Neurology. 2020;94(11):e1112-e1121. [DOI] [PMC free article] [PubMed] [Google Scholar]
- 22.Goetz CG, Tilley BC, Shaftman SR, et al. Movement disorder society-sponsored revision of the Unified Parkinson's Disease Rating SCALE (MDS-UPDRS): scale presentation and clinimetric testing results. Mov Disord. 2008;23(15):2129-2170. [DOI] [PubMed] [Google Scholar]
- 23.Hoehn MM, Yahr MD. Parkinsonism: onset, progression and mortality. Neurology. 1967;17(5):427-442. [DOI] [PubMed] [Google Scholar]
- 24.Folstein MF, Folstein SE, McHugh PR. Mini-mental state: a practical method for grading the cognitive state of patients for the clinician. J Psychiatr Res. 1975;12(3):189-198. [DOI] [PubMed] [Google Scholar]
- 25.Dubois B, Burn D, Goetz C, et al. Diagnostic procedures for Parkinson's disease dementia: recommendations from the Movement Disorder Society task force. Mov Disord. 2007;22(16):2314-2324. [DOI] [PubMed] [Google Scholar]
- 26.Emre M, Aarsland D, Brown R, et al. Clinical diagnostic criteria for dementia associated with Parkinson's disease. Mov Disord. 2007;22(12):1689-1707. [DOI] [PubMed] [Google Scholar]
- 27.Hsu YL, Chen CC, Lin YT, et al. Evaluation and optimization of sample handling methods for quantification of short-chain fatty acids in human fecal samples by GC-MS. J Proteome Res. 2019;18(5):1948-1957. [DOI] [PubMed] [Google Scholar]
- 28.Liao HY, Wang CY, Lee CH, Kao HL, Wu WK, Kuo CH. Development of an efficient and sensitive chemical derivatization-based LC-MS/MS method for quantifying gut microbiota-derived metabolites in human plasma and its application in studying cardiovascular disease. J Proteome Res. 2021;20(7):3508-3518. [DOI] [PubMed] [Google Scholar]
- 29.Franzosa EA, McIver LJ, Rahnavard G, et al. Species-level functional profiling of metagenomes and metatranscriptomes. Nat Methods. 2018;15(11):962-968. [DOI] [PMC free article] [PubMed] [Google Scholar]
- 30.Oksanen J, Blanchet FG, Friendly M, et al. Community ecology package. 2020. Updated September 16, 2021. Available at: CRAN.R-project.org/package=vegan.
- 31.Team RC. R: A Language and Environment for Statistical Computing. R Foundation for Statistical Computing; 2020. [Google Scholar]
- 32.Cilia R, Piatti M, Cereda E, et al. Does gut microbiota influence the course of Parkinson's disease? A 3-year prospective exploratory study in de novo patients. J Parkinson Dis. 2021;11(1):159-170. [DOI] [PubMed] [Google Scholar]
- 33.Parada Venegas D, De la Fuente MK, Landskron G, et al. Short chain fatty acids (SCFAs)-mediated gut epithelial and immune regulation and its relevance for inflammatory bowel diseases. Front Immunol. 2019;10:277. [DOI] [PMC free article] [PubMed] [Google Scholar]
- 34.Koh A, De Vadder F, Kovatcheva-Datchary P, Backhed F. From dietary fiber to host physiology: short-chain fatty acids as key bacterial metabolites. Cell. 2016;165(6):1332-1345. [DOI] [PubMed] [Google Scholar]
- 35.Reichardt N, Duncan SH, Young P, et al. Phylogenetic distribution of three pathways for propionate production within the human gut microbiota. ISME J. 2014;8(6):1323-1335. [DOI] [PMC free article] [PubMed] [Google Scholar]
- 36.Nishiwaki H, Hamaguchi T, Ito M, et al. Short-chain fatty acid-producing gut microbiota is decreased in Parkinson's disease but not in rapid-eye-movement sleep behavior disorder. mSystems. 2020;5(6):e00797-20. [DOI] [PMC free article] [PubMed] [Google Scholar]
- 37.Kumari S, Goyal V, Kumaran SS, Dwivedi SN, Srivastava A, Jagannathan NR. Quantitative metabolomics of saliva using proton NMR spectroscopy in patients with Parkinson's disease and healthy controls. Neurol Sci. 2020;41(5):1201-1210. [DOI] [PubMed] [Google Scholar]
- 38.Kelly LP, Carvey PM, Keshavarzian A, et al. Progression of intestinal permeability changes and alpha-synuclein expression in a mouse model of Parkinson's disease. Mov Disord. 2014;29(8):999-1009. [DOI] [PMC free article] [PubMed] [Google Scholar]
- 39.Müller M, Hernández MAG, Goossens GH, et al. Circulating but not faecal short-chain fatty acids are related to insulin sensitivity, lipolysis and GLP-1 concentrations in humans. Sci Rep. 2019;9(1):12515. [DOI] [PMC free article] [PubMed] [Google Scholar]
- 40.Marizzoni M, Cattaneo A, Mirabelli P, et al. Short-chain fatty acids and lipopolysaccharide as mediators between gut dysbiosis and amyloid pathology in Alzheimer's disease. J Alzheimers Dis. 2020;78(2):683-697. [DOI] [PubMed] [Google Scholar]
- 41.Kim CH, Park J, Kim M. Gut microbiota-derived short-chain fatty acids, T cells, and inflammation. Immune Netw. 2014;14(6):277-288. [DOI] [PMC free article] [PubMed] [Google Scholar]
- 42.Markowiak-Kopec P, Slizewska K. The effect of probiotics on the production of short-chain fatty acids by human intestinal microbiome. Nutrients. 2020;12(4):1107. [DOI] [PMC free article] [PubMed] [Google Scholar]
- 43.Muniz Pedrogo DA, Chen J, Hillmann B, et al. An increased abundance of Clostridiaceae characterizes arthritis in inflammatory bowel disease and rheumatoid arthritis: a cross-sectional study. Inflamm Bowel Dis. 2019;25(5):902-913. [DOI] [PMC free article] [PubMed] [Google Scholar]
- 44.Lindenberg F, Krych L, Fielden J, et al. Expression of immune regulatory genes correlate with the abundance of specific Clostridiales and Verrucomicrobia species in the equine ileum and cecum. Sci Rep. 2019;9(1):12674. [DOI] [PMC free article] [PubMed] [Google Scholar]
- 45.Arumugam M, Raes J, Pelletier E, et al. Enterotypes of the human gut microbiome. Nature. 2011;473(7346):174-180. [DOI] [PMC free article] [PubMed] [Google Scholar]
- 46.Lin HY, Tang CH, Chen YH, et al. Peptidoglycan enhances proinflammatory cytokine expression through the TLR2 receptor, MyD88, phosphatidylinositol 3-kinase/AKT and NF-kappaB pathways in BV-2 microglia. Int Immunopharmacol. 2010;10(8):883-891. [DOI] [PubMed] [Google Scholar]
- 47.Bell SM, Burgess T, Lee J, Blackburn DJ, Allen SP, Mortiboys H. Peripheral glycolysis in neurodegenerative diseases. Int J Mol Sci. 2020;21(23):8924. [DOI] [PMC free article] [PubMed] [Google Scholar]
- 48.López KLR, Simpson JE, Watson LC, et al. TIGAR inclusion pathology is specific for Lewy body diseases. Brain Res. 2019;1706:218-223. [DOI] [PubMed] [Google Scholar]
- 49.Cassani E, Barichella M, Ferri V, et al. Dietary habits in Parkinson's disease: adherence to Mediterranean diet. Parkinsonism Relat Disord. 2017;42:40-46. [DOI] [PubMed] [Google Scholar]
- 50.Barichella M, Cereda E, Cassani E, et al. Dietary habits and neurological features of Parkinson's disease patients: implications for practice. Clin Nutr. 2017;36(4):1054-1061. [DOI] [PubMed] [Google Scholar]
Associated Data
This section collects any data citations, data availability statements, or supplementary materials included in this article.
Data Availability Statement
The raw anonymized microbiome sequencing data were uploaded to the NCBI BioSample database (ncbi.nlm.nih.gov/biosample/) with the submission ID SUB10308106. Anonymized data not published within this article will be made available by request from any qualified investigator.