Abstract
Genome complexity has been associated with poor outcome in patients with chronic lymphocytic leukemia (CLL). Previous cooperative studies established five abnormalities as the cut-off that best predicts an adverse evolution by chromosome banding analysis (CBA) and genomic microarrays (GM). However, data comparing risk stratification by both methods are scarce. Herein, we assessed a cohort of 340 untreated CLL patients highly enriched in cases with complex karyotype (CK) (46.5%) with parallel CBA and GM studies. Abnormalities found by both techniques were compared. Prognostic stratification in three risk groups based on genomic complexity (0-2, 3-4 and ≥5 abnormalities) was also analyzed. No significant differences in the percentage of patients in each group were detected, but only a moderate agreement was observed between methods when focusing on individual cases (κ=0.507; P<0.001). Discordant classification was obtained in 100 patients (29.4%), including 3% classified in opposite risk groups. Most discrepancies were technique-dependent and no greater correlation in the number of abnormalities was achieved when different filtering strategies were applied for GM. Nonetheless, both methods showed a similar concordance index for prediction of time to first treatment (TTFT) (CBA: 0.67 vs. GM: 0.65) and overall survival (CBA: 0.55 vs. GM: 0.57). High complexity maintained its significance in the multivariate analysis for TTFT including TP53 and IGHV status when defined by CBA (hazard ratio [HR] 3.23; P<0.001) and GM (HR 2.74; P<0.001). Our findings suggest that both methods are useful but not equivalent for risk stratification of CLL patients. Validation studies are needed to establish the prognostic value of genome complexity based on GM data in future prospective studies.
Introduction
Deletions of 17p13 region and/or mutations in TP53 as well as the mutational status of the variable region of the immunoglobulin heavy chain (IGHV) gene constitute the most important prognostic and predictive factors in chronic lymphocytic leukemia (CLL) in the era of chemoimmunotherapy.1 However, several studies have highlighted the independent clinical significance of genomic complexity, mainly defined by the detection of complex karyotypes (CK) by chromosome banding analysis (CBA), due to its association with an unfavorable clinical outcome. This has been demonstrated in patients treated not only with standard chemoimmunotherapy regimes2-5 but also in the initial clinical trials with the novel mechanism-based therapeutic agents such as ibrutinib or venetoclax.6-8
Early studies in CLL defined CK as the presence of at least three numerical and/or structural chromosomal abnormalities in the same cell clone detected by CBA.9,10 Of note, the increasing number of chromosomal abnormalities in the karyotype has been correlated with the worsening of clinical evolution of CLL patients.11,12 In this context, a large retrospective study from the European Research Initiative on CLL (ERIC) has reported that patients with five or more abnormalities (the so-called high-CK) display an adverse outcome independently of other known biomarkers such as TP53 abnormalities or the IGHV mutational status.5 On the other hand, it has been demonstrated that CK might have a different clinical impact in CLL patients according to not only the number, but also the type of aberrations detected in the karyotype. In this regard, it has been described that patients with CK carrying +12, +19 display a particularly favorable outcome while the presence of unbalanced rearrangements define a subset with very aggressive disease.13-15
Even though CBA has been the gold standard method to identify CK, in the last decade genomic microarrays (GM) have emerged as a valuable tool for genome-wide screening in CLL.16-20 Indeed, some studies have correlated the genomic complexity detected by GM to progressive disease and poorer response rates to treatment.21-23 Nonetheless, although some European countries have replaced conventional techniques by GM, standard criteria to analyze and define genomic complexity by GM are still needed. According to the published guidelines for GM analysis in acquired hematologic neoplasms, recurrent aberrations with known clinical relevance in the disease irrespective of their size as well as other copy number abnormalities (CNA) ≥5 Mb should be considered in order to reduce the detection of benign constitutional variants and avoid the reporting of anomalies with uncertain clinical significance.24 However, it remains unclear whether this threshold is the optimal to analyze CLL patients or whether potentially relevant chromosomal imbalances are disregarded by applying this highly conservative size cut-off. Besides, another multicenter study conducted by ERIC suggested that CLL patients could be divided into three distinct prognostic subgroups based on the number of CNA.25 According to Leeksma et al., the socalled high genomic complexity (high-GC) subgroup, which is defined by carrying ≥5 CNA, emerged as prognostically adverse, independently of other biomarkers. Nevertheless, to the best of our knowledge, the comparison of genomic complexity for risk stratification using CBA and GM in parallel has not been performed in a large CLL cohort.
In the present multicenter retrospective study we aimed to compare the usefulness of CBA and GM techniques in a series of 340 CLL patients with and without CK to determine both their concordance and their equivalence in the prognostic stratification of CLL patients with CK. Moreover, we have analyzed the detected aberrations using different counting strategies to ascertain whether other parameters, such as the type of the aberrations or their size, might have an influence on the risk stratification of CLL patients.
Methods
Patient cohort
A total of 340 previously untreated CLL (n=327; 96.2%) and monoclonal B-cell lymphocytosis (n=13; 3.8%) patients from 18 European institutions were included. All had CBA results at diagnosis or before treatment. GM data were already available or obtained from DNA extracted within 1 year. Analyses were performed on peripheral blood (PB) (n=286) or bone marrow (BM) (n=54). Due to the purpose of the study, this cohort was enriched in patients with CK (n=158; 46.5%). Demographic, clinical and biological characteristics are summarized in Table 1. The study was carried out in accordance with national and international guidelines (Professional Code of Conduct, Declaration of Helsinki) and approved by the Hospital del Mar Ethics Committee (2017/7565/I).
Chromosome banding analyses
CBA was performed on G- or R-banded chromosomes. Karyotypes were described according to the International System for Human Cytogenetic Nomenclature (ISCN 2016).26 A complex karyotype was defined as the presence of three or more numerical and/or structural chromosomal abnormalities (abn.) detected in the same cell clone. Patients were stratified in three categories: non-CK (0-2 abn.), low/intermediate-CK (3-4 abn.) and high-CK (≥5 abn.)5
Genomic microarray analyses
Microarray platforms used are summarized in the Online Supplementary Table S1. All aberrations found irrespective of size were collected, although non-classical CLL abnormalities (other than gain of chromosome 12 and losses of 11q, 13q and 17p) were filtered in the CNA count for prognostic stratification following the 5 Mb cut-off size recommended.24 Three subgroups were defined according to genomic complexity (GC): low-GC (0-2 CNA), intermediate-GC (3-4 CNA) and high-GC (≥5 CNA).25 This strategy was compared with other CNA counting methodologies, such as the inclusion of smaller abnormalities (no size filter or 1 Mb as cut-off) or counting as a unique CNA small contiguous abnormalities (with a distance ≤1 Mb between them) or those included in a chromothripsis event.
Statistical analyses
Descriptive statistics were used to provide frequency distributions of discrete variables while statistical measures were used to provide median values and ranges for quantitative variables. Groups were compared using Chi-square or Fisher exact tests for discrete variables and Mann-Whitney U test for continuous variables. The Kappa coefficient was used for assessing the agreement in patients categorization among techniques. Survival analysis was restricted to 259 patients. A total of 81 non-CK cases from three institutions were excluded as CBA was performed at recruitment for clinical trials, introducing a bias in the results. Time to first treatment (TTFT), the end point of the study, was calculated from the date of cytogenetic study to the date of first treatment or last follow-up while overall survival (OS) was defined from date of cytogenetic study until last follow-up or death. Kaplan–Meier method was used to estimate the distribution of TTFT and OS. Comparisons among patient subgroups were performed with the log-rank test. The concordance statistic (C-index) was calculated to assess the accuracy of CBA and GM for predicting TTFT and OS. Multivariate analysis using Cox proportional hazards regression model was used to assess the maintenance of the independent prognostic impact on TTFT and OS. Statistical analyses were performed using SPSS v.23 software (SPSS Inc, Chicago, IL, USA) and R v3.5.2. P-values <0.05 were considered statistically significant.
Additional information regarding the methodology of the study is detailed in the Online Supplementary Appendix.
Results
Number and type of abnormalities detected by chromosome banding analysis and genomic microarrays
Regarding CBA, 270 of 340 (79.4%) patients showed an abnormal karyotype. Overall, 182 were considered non-CK (0-2 abn.) while 158 displayed a CK (≥3 abn.). The vast majority of non-CK aberrant cases carried only one aberration (75 of 112; 66.9%), while the median number of abnormalities among CK patients was four (range, 3-19). Abnormal karyotypes from the non-CK group mainly included known recurrent CLL aberrations, the most frequent being trisomy of chromosome 12 (15.4% patients). In contrast, the CK group showed a wide variety of abnormalities affecting all chromosomes and included unbalanced structural aberrations (552 of 823; 67.1%), complex abnormalities affecting material of unknown origin (179 of 823; 21.7%) and monosomies (155 of 823; 18.8%). In seven of these, a co-existence of +12 and +19, associated with more indolent course, was found (4.4%). Balanced translocations, potentially missed when studied by GM, were present in only 57 patients (11.5% non-CK; 22.8% CK). Even though they were detected in a minority of cases, 13q14 and 14q32 loci were recurrently involved (in 13 and seven patients, respectively).
GM had the highest detection rate of abnormalities, with 309 of 340 (90.9%) cases carrying at least one CNA when all the abnormalities, irrespective of their size, were considered. No significant differences were observed among the GM platforms used. Expectedly, the non-CK group showed a significantly lower median number of CNA compared with CK patients (2 CNA; range, 0-10 vs. 6 CNA; range, 0-51; P<0.001). Nearly half of the patients carried at least one small (<5 Mb) non-classical CLL CNA (median size 5.38 Mb; range, 0.019-198 Mb) that would not be taken into consideration following the current microarray recommendations (35.7% non-CK vs. 64.6% CK patients; P<0.001). Although they were less frequent, similar results were observed regarding the presence of non-classical CLL CNA below 1 Mb (26.9% vs. 44.9%; P<0.001). Patterns suggestive of chromothripsis or chromothripsis-like were identified in 30 patients (20 and ten cases, respectively).
Fluorescence in situ hybridization (FISH), the gold standard method for the detection of the four genetic abnormalities included in the Döhner et al. prognostic hierarchical model,27 confirmed the higher incidence of high-risk aberrations in the CK group. Specifically, del(11q) was found in 12.4% (22 of 177) of non-CK patients and 32.2% (49 of 152) of CK patients (P<0.001) while del(17p) was present in 4.5% (eight of 177) and 40.1% (61 of 152), respectively (P<0.001). Detection of del(13q), del(11q) and del(17p) was lower by CBA compared to FISH although these loci were involved in different type of abnormalities (Online Supplementary Table S2). GM showed a high concordance with FISH results (Online Supplementary Table S3).
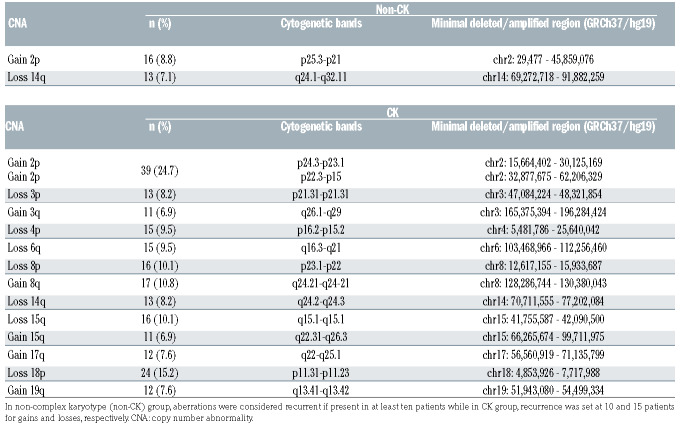
With regard to commonly detected non-classical CLL abnormalities, similar results were observed by both CBA and GM among non-CK and CK patients. The only recurrent aberrations detected by CBA within the non-CK group were deletions in the long arm of chromosome 14 (6.6%) and unbalanced translocations affecting 2p arm (5.5%), which were detected as losses at 14q and gains of 2p region by GM, respectively. Likewise, despite being distributed along the genome, gains of chromosome arms 2p, 3q, 8q, 15q, 17q and 19q and losses at 3p, 4p, 6q, 8p, 14q, 15q and 18p, usually involved in unbalanced translocations or simple deletions in the karyotype, were the most recurrent CNA detected in CK patients (Online Supplementary Figure S1). Detailed information regarding recurrent CNA found by GM is shown in Table 2.
Table 1.
Baseline characteristics of patients at diagnosis and last follow-up.
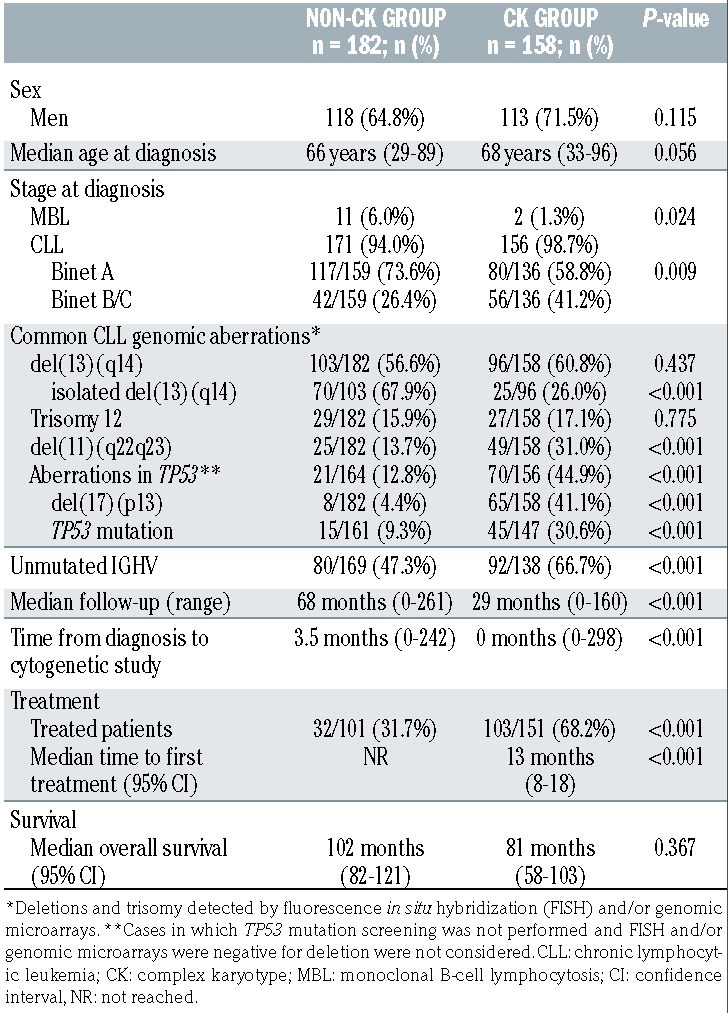
Table 2.
Recurrent copy number abnormalities found by genomic microarrays within the non-complex karyotype and complex karyotype subgroups and minimal common altered regions.
Table 3.
Classification of patients in the previously suggested risk categories according to the number of aberrations detected by chromosome banding analysis and genomic microarrays.
Risk stratification of the genomic complexity observed by chromosome banding analysis and genomic microarrays
In order to compare the concordance among risk stratification based on CBA and GM data, patients were classified into those categories suggested by previous large-scale studies.5,25 Notably, both techniques did not significantly differ in the percentage of patients classified into intermediate- risk categories (3-4 abnormalities; 23.8% by CBA vs. 24.4% by GM; P=0.923) or those showing the highest risk (≥5 abnormalities; 22.6% and 19.1%, respectively; P=0.299). However, when focusing in individual cases, only a moderate agreement was observed between methods (κ=0.507; P<0.001). Discordant classification was obtained in 100 patients (29.4%), including eight cases with ≥5 abnormalities in the karyotype which would not be considered complex by GM and two patients with high-GC who did not have CK (2.9%) (Table 3).
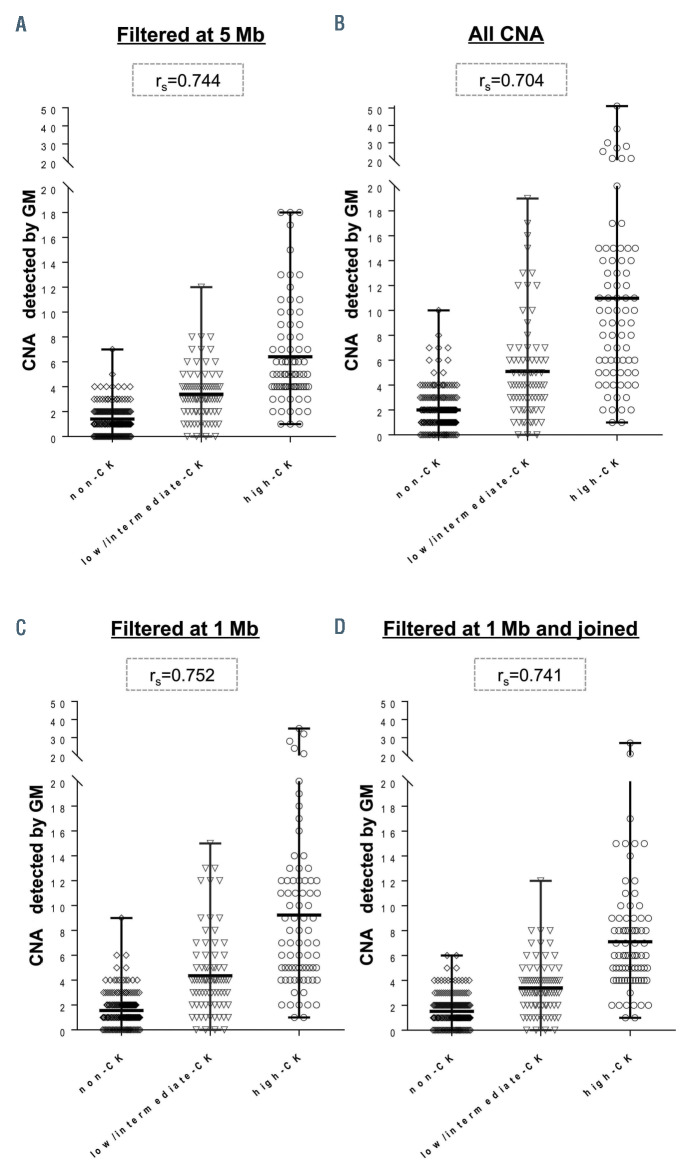
Next, we evaluated if the CNA filtering strategy used for GM results could underlie the differences observed in the assessment of the complexity. Regardless of the CNA filtering strategy, the proportion of patients with CNA <5 Mb was similarly represented among those patients with increased complexity scored by CBA (n=58) or by GM (n=42) (55.2% vs. 64.3%, respectively; P=0.413). When less strict filtering strategies were applied for GM, no greater correlation in the number of abnormalities counted by CBA and GM was achieved. Similar results were observed when including all the abnormalities irrespective of their size, using 1 Mb as a cut-off for non-classical CLL CNA, or if CNA separated by <1 Mb or chromothripsis patterns were counted as one event to evaluate the effect of joining consecutive aberrations (Figure 1).
Figure 1.
Distribution of the number of copy number abnormalities detected by genomic microarrays among the groups identified by chromosome banding analysis. Patients were divided according to the risk groups defined by chromosome banding analysis (CBA) in noncomplex karyotype (non-CK) (0-2 abnormalities [abn.]), low/intermediate-CK (3-4 abn.) or high- CK (≥5 abn.). Each plot represents copy number abnormality (CNA) counts found when non-classical chronic lymphocytic leukemia (CLL) abnormalities were filtered by different strategies: (A) Current recommended criteria for genomic microarrays (GM) analysis (cut-off size: ≥5 Mb); (B) considering all the CNA irrespectively of their size; (C) considering only those CNA ≥1 Mb; (D) filtering by 1 Mb cut-off and grouping small contiguous abnormalities or considering those CNA included in a chromothripsis event as a unique CNA. Spearman correlation coefficient between CBA and GM counts is shown for each GM analysis.
Parallel analyses of the abnormalities detected by CBA and GM were also performed to identify other potential causes of discrepancy. Among those abnormalities recorded only by CBA, differences were mainly due to the presence of balanced translocations (n=28 patients) or abnormalities represented in a minor proportion of tumor cells probably expanded during the cytogenetics culture which were missed by GM (n=40 patients). Moreover, FISH with chromosome painting probes performed in two high-CK cases by CBA, who showed low-GC, revealed that some apparently unbalanced abnormalities were complex balanced rearrangements that ultimately did not lead to loss of material (Online Supplementary Figure S2). On the other hand, when assessed by GM, most of the more complex cases showed aberrations <10 Mb, which is the resolution threshold of CBA, or multiple CNA that corresponded to complex rearrangements recorded as single abnormalities in the karyotype (73 and 19 cases, respectively). No division of the tumor clone during the cytogenetics culture is the most feasible explanation for 50 patients who carried CNA ≥10 Mb that should have been identified by CBA, of which 17 presented a normal karyotype. Detailed comparison for the ten patients who only displayed high complexity by one method is shown in the Online Supplementary Table S4.
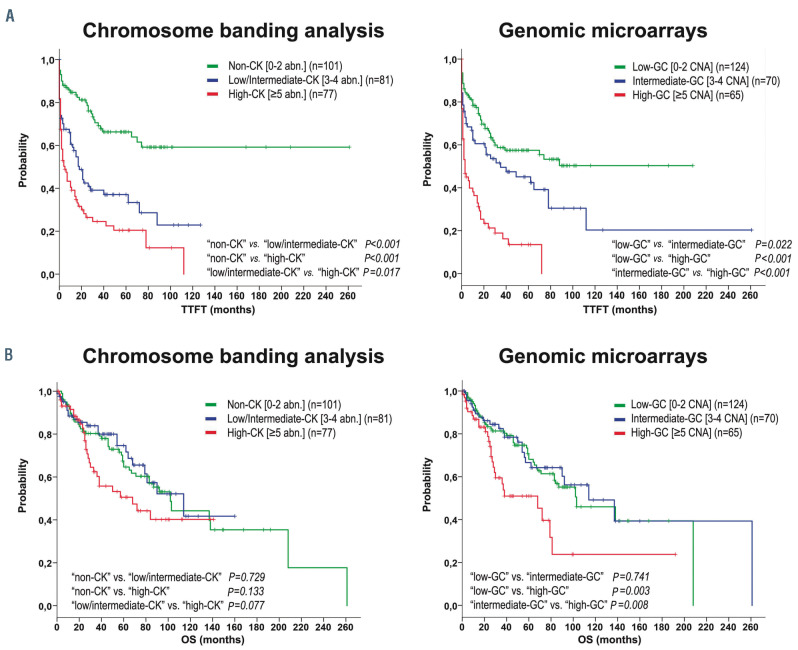
Figure 2.
Kaplan-Meier plots for time to first treatment and overall survival based on genomic complexity stratification assessed by chromosome banding analysis and genomic microarrays. Kaplan-Meier estimation for time to first treatment (TTFT) (A) and overall survival (OS) (B) in patients classified in each category based on total number of aberrations found by chromosome banding analysis (CBA): non-complex karyotype (non-CK) (0-2 abnormalities [abn.]), low/intermediate-CK (3-4 abn.) or high-CK (≥5 abn.) (plots on the left) and based on total number of copy number aberrations (CNA) detected by genomic microarrays (GM): low-genomic complexity (GC) (0-2 CNA), intermediate-GC (3-4 CNA) or high-GC (≥5 CNA)] (plots on the right).
The genetic analysis using both methods allowed the correction of the karyotype in six patients after GM interpretation (Online Supplementary Table S5). Although it resulted in a change of the number of abnormalities recorded by CBA for three of them, initial counts were considered for the present analysis.
Prognostic impact of complex karyotype stratification by chromosome banding analysis and genomic microarrays
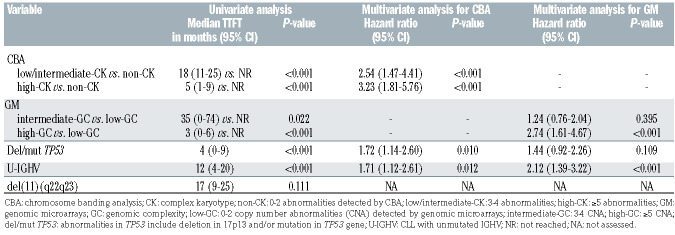
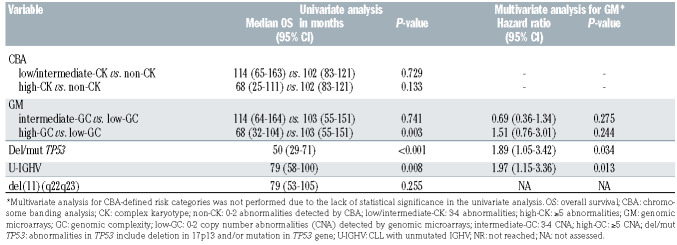
As previously stated in the ERIC studies, significant differences in terms of TTFT were observed within the three risk groups according to the number of aberrations found by CBA and GM.5,25 Whereas the highest risk group defined by both techniques displayed a similar short median TTFT (5 and 3 months by CBA and GM, respectively), TTFT was shorter for the intermediate risk group when defined by CBA (18 months vs. 35 months) (Figure 2A). Indeed, both methods showed a similar accuracy for predicting TTFT (Cindex: 0.67 by CBA vs. 0.65 by GM). With regard to OS, only the highest risk groups defined by each technique displayed a poorer outcome (68 months in both cases) (Figure 2B) although differences were only statistically significant in GM defined groups. Equivalent C-indexes were obtained for OS (0.55 by CBA vs. 0.57 by GM).
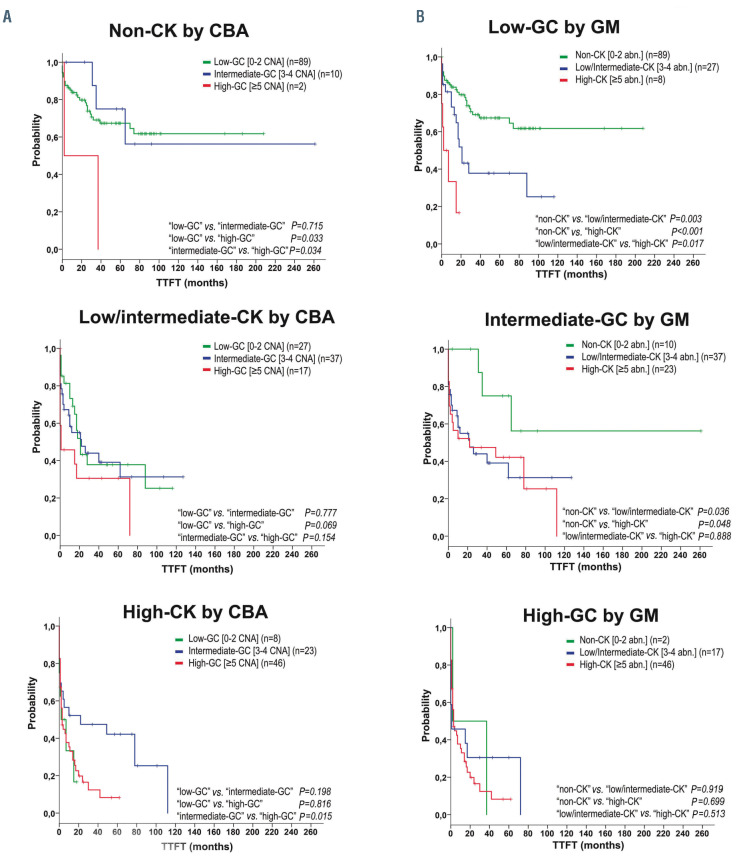
In order to compare the discriminatory power for outcome prediction of both techniques, patients were first classified according to CBA to assess TTFT of GM-defined groups within each category. Of note, those non-CK and low/intermediate-CK patients by CBA who carried ≥5 CNA (high-GC) showed a poor outcome equivalent to that observed in the high-CK by CBA (median TTFT: 2 and 1 months, respectively). However, within the high-CK group, low-GC patients did not show a better evolution (TTFT: 2 months) while cases with intermediate-GC displayed an unexpected median TTFT of 22 months (Figure 3A). When these analyses were performed in the reverse order, CBA reclassification within the low-GC patients allowed the distinction of three risk categories showing similar outcomes to those observed when applied to the global cohort (P<0.001). No significant differences were observed when the intermediate-GC and high-GC categories were reclassified (Figure 3B). It is noteworthy that the ten cases categorized in opposite risk groups displayed the poor prognosis predicted by the technique that classified them in the higher risk category.
Figure 3.
Kaplan-Meier plots for time to first treatment of the genomic risk stratification within each category defined by the alternative technique. (A) Patients classified in each category based on total number of aberrations found by chromosome banding analysis (CBA): non-complex Karyotype (CK) (0-2 abnormalities [abn.]), low/intermediate-CK (3-4 abn.) or high-CK (≥5 abn.) are represented in different plots. Time to first treatment (TTFT) of genomic microarrays (GM) defined groups was assessed. Within non-CK and low/intermediate-CK, cases classified as high-GC (≥5 copy number abnormalities [CNA] by GM) showed a poor outcome. In the high-CK group, those low-GC patients did not display a better evolution while intermediate-GC cases showed an unexpected median TTFT of 22 months. (B) Each plot represents patients classified in each category based on total number of CNA detected by GM: low-GC (0-2 CNA), intermediate-GC (3-4 CNA) or high-GC (≥5 CNA). Within each subgroup, TTFT of CBA defined groups was assessed. Low-GC patients could be stratified in three risk categories when reclassified by CBA, while no significant differences were observed when intermediate-GC and high-GC subsets were reclassified.
Expectedly, the frequency of TP53 abnormalities (deletions and/or mutations) increased together with the complexity by both methods. In contrast, intermediate and high risk categories showed a similar increased proportion of unmutated IGHV (U-IGHV) and del(11q) compared with non-CK/low-GC patients (Online Supplementary Table S6). Despite being highly associated with these known prognostic factors, three groups with significant differences on TTFT could be established by CBA and GM when patients were categorized depending on their TP53 status (Online Supplementary Figure S3). Regarding IGHV status, similar results were obtained within the mutated IGHV (M-IGHV) group while no clear discrimination was observed in the U-IGHV subset (Online Supplementary Figure S4). No prognostic impact was observed for del(11q) in the entire cohort (Table 4). High complexity defined by both CBA and GM maintained its significance when a multivariate analysis for TTFT including TP53 and IGHV status was performed. Conversely, genomic complexity by GM lost its significance in the multivariate analysis for OS (Table 5).
Table 4.
Univariate and multivariate analysis for time to first treatment.
Table 5.
Univariate and multivariate analysis for overall survival.
Finally, the impact of other genetic findings was also analyzed. In this regard, the presence of unbalanced rearrangements was associated with shorter TTFT in the entire cohort (11 months vs. NR; P<0.001) and within the non-CK subgroup (10 months vs. NR; P=0.001) (Online Supplementary Figure S5). A negative impact was also observed for chromothripsis (2 months vs. 37 months; P<0.001), which was mainly found among CK patients (29 of 30). Indeed, tendency to this worse evolution was maintained within this subset (5 months vs. 15 months; P=0.062) (Online Supplementary Figure S6). As expected, these cases showed a high frequency of abnormalities in TP53 (22 of 30; 73.3%) and U-IGHV (21 of 29; 72.4%). In the multivariate analysis including these features and genomic complexity, only the latter defined by both CBA and GM retained its negative impact (Online Supplementary Table S7).
Discussion
In recent years, there has been a rising interest in identifying CLL patients with CK since they may pursue a more aggressive clinical course and respond less well to treatment. 2,4,28 Large co-operative studies within ERIC have demonstrated that five abnormalities is the optimal cut-off which better predicts an impaired outcome by both CBA and GM.5,25 However, data comparing the risk stratification based on genomic complexity by both methods in the same patients are scarce. Indeed, a small cohort of 122 patients from the Leeksma et al. study was analyzed by GM and CBA, but the proportion of CK cases was very low, as expected in an unselected CLL population. To the best of our knowledge, the present study is the largest report conducted to date in which a cohort of CLL patients enriched in CK cases has been simultaneously analyzed by CBA and GM, comparing the usefulness of both methods in their prognostic stratification.
By clustering patients according to criteria previously defined by ERIC, we confirmed that both techniques did not differ in the proportion of patients classified into each risk category. Notwithstanding, it should be pointed out that only moderate agreement was observed between them. Discordances in the risk assigned to nearly one third of the patients were found, including around 3% of patients classified in either high or low risk groups depending on the methodology employed for their study. We have demonstrated that most of these discordances are the consequence of known limitations intrinsic to each technique. In this regard, the clonal architecture in the sample could mask some alterations by GM, if present in low percentages below their limited sensitivity (~20%), while the CBA result would rely on the in vitro proliferative capacity of the altered clones.29,30 In addition, balanced abnormalities are only detectable by CBA and, on the contrary to expectations, our FISH painting studies confirmed that not all the complex rearrangements described in the karyotype ultimately imply gain or loss of genomic material. On the contrary, some abnormalities recorded as a single monosomy or unbalanced translocation in the karyotype turned out to be multiple CNA or even chromothripsis events when assessed by GM. Thus, our results suggested that discrepancies were not predictable by the type of abnormalities detected by any of the methods. Conversely, we discarded a global underestimation of the genomic complexity associated with the application of the recommended filtering criteria for non-classical CLL CNA by GM.24 Small abnormalities (<5 Mb) were equally found by GM among concordant and discordant patients, and greater agreement in the number of abnormalities could not be achieved when smaller CNA were also considered. Thus, we have confirmed that the present recommendations for GM analysis are robust for complexity assessment.24 The observed differences did not represent a poorer performance for CBA or GM in patients risk stratification. In both cases, the established risk groups showed significant differences in terms of TTFT, which were independent of TP53 and IGHV mutational status. Concerning OS, only high complex groups displayed a dismal evolution. In addition, the heterogeneity regarding the GM platforms employed could be a limitation of this study. However, all GM results were reviewed and uniformly interpreted using the same criteria to filter CNA and similar findings were obtained among different GM companies.
Regarding CBA data, previous publications have investigated whether specific cytogenetic patterns not identifiable by GM (presence of balanced or unbalanced rearrangements) may correlate with dismal outcome. Initial studies suggested that carrying chromosomal translocations was associated with poorer clinical course.31 More recently, this negative impact has been attributed to the presence of unbalanced rearrangements and its association with CK.2,32 Indeed, Rigolin et al. proved that CK carrying unbalanced rearrangements constituted a very poor risk subset with particular features such as an increased proportion of TP53 aberrations and a lower frequency of 11q deletions. The presence of these aberrations has also been associated with a deregulated expression of genes involved in cell cycle control and DNA damage response.14 Visentin et al. showed that the combination of the presence of CK and/or unbalanced rearrangements by CBA and IGHV mutational status improved their risk stratification. 15 In our cohort, we observed a shorter TTFT for those patients with unbalanced rearrangements but the poor outcome was not confirmed within CK group. Unexpectedly, GM were unable to detect CNA related to all the apparently unbalanced rearrangements. Indeed, the eight patients with high-CK classified as low-GC by GM carried this type of abnormality and showed a dismal evolution. On the other hand, our GM analyses identified patients with patterns of chromothripsis who showed a short TTFT. As previously reported, there was a high association between chromothripsis and CK or TP53 aberrations. 19,33,34 Our study is based in a retrospective cohort highly enriched in patients carrying CK, which was necessary to extensively compare both genetic methodologies in the detection of these prognostically relevant highly complex cases. Therefore, as it is not representative of a real-life CLL cohort, it hinders the development of more accurate genetic prognostic scores. Additionally, potential confounding effects of different therapeutic agents could be attributed to the retrospective and multicenter nature of the cohort enriched in treated patients. These could underlie the lack of statistical significance of genome complexity in the analyses for OS.
To date, most of the survival analyses of genomic complexity included in clinical trials have been reported using CBA data. Even though the prognostic/predictive value of CK for TTFT and progression-free survival in patients treated with chemoimmunotherapy has been extensively demonstrated,2-5,10 its clinical relevance in patients receiving the new treatment modalities has not been fully established. Initial data from clinical trials with novel agents, mainly developed in older relapsed/refractory and/or in high risk patients (TP53 del/mut, U-IGHV) suggested an adverse significance of CK.6-8,35 In contrast, a number of recent studies including extended follow-ups of older trials, pooled analyses or new drug combinations have not confirmed its adverse significance.36-43 However, most of these studies have analyzed CK impact taking into account patients with ≥3 aberrations but not those with high complexity (≥5 aberrations), compared a low number of patients and showed relatively short follow-ups.44 Thus, additional analyses are needed to clarify the prognostic/predictive impact of genomic complexity.
One particular finding of this study is that, even though overall concordance between FISH and GM is high (90%), GM do not detect around 20% of cases with TP53 deletion due to their low sensitivity.23,29 The presence of 17p13 deletions and/or mutations in TP53 predicts the poorest outcome and its assessment is currently mandatory in CLL study. Our results confirm that FISH should be maintained for the study of CLL patients complemented with one genome-wide technique to assess genome complexity for risk stratification. The choice between CBA and GM will depend on each laboratory, which should take into account the methods and equipment availabilities, personnel expertise and the economic costs, among others.
In conclusion, we have confirmed that both CBA and GM are valuable tools to assess the prognosis of CLL patients based on genomic complexity. Nevertheless, a considerable proportion of cases are discordantly classified depending on the technique employed. Consequently, previous findings generated from CBA, currently the gold standard for cytogenetic assessment, are not directly applicable to GM or other promising cytogenomic methodologies such as optical genome mapping. Additional validation studies are needed to establish the prognostic value of genomic complexity by GM in future prospective studies and clinical trials.
Supplementary Material
Acknowledgements
The authors would like to thank Idoya Ancín, Andrea Campeny, María Dolores García-Malo, Alberto Valiente, Marco Moro, Gonzalo Blanco, Ferran Nadeu and Julio Delgado for their contribution to the study providing patients samples and data and the MARGenomics Platform from Institut Hospital del Mar d’Investigacions Mèdiques (Barcelona) for performing part of the genomic microarrays.
Funding Statement
Funding: This work was partly supported by grants from Generalitat de Catalunya (17SGR437), Gilead Sciences Fellowship (GLD17/00282), Ministerio de Educación, Cultura y Deporte of Spain (FPU17/00361), Fundación Española de Hematología y Hemoterapia (FEHH-Janssen), Instituto de Salud Carlos III/FEDER (PT17/0015/0011) and the “Xarxa de Bancs de tumors“ sponsored by Pla Director d’Oncologia de Catalunya (XBTC).
References
- 1.Hallek M, Cheson BD, Catovsky D, et al. iwCLL guidelines for diagnosis, indications for treatment, response assessment, and supportive management of CLL. Blood. 2018;131(25):2745-2760. [DOI] [PubMed] [Google Scholar]
- 2.Baliakas P, Iskas M, Gardiner A, et al. Chromosomal translocations and karyotype complexity in chronic lymphocytic leukemia: a systematic reappraisal of classic cytogenetic data. Am J Hematol. 2014;89(3): 249-255. [DOI] [PubMed] [Google Scholar]
- 3.Herling CD, Klaumünzer M, Rocha CK, et al. Complex karyotypes and KRAS and POT1 mutations impact outcome in CLL after chlorambucil-based chemotherapy or chemoimmunotherapy. Blood. 2016;128(3): 395-404. [DOI] [PubMed] [Google Scholar]
- 4.Puiggros A, Collado R, Calasanz MJ, et al. Patients with chronic lymphocytic leukemia and complex karyotype show an adverse outcome even in absence of TP53/ATM FISH deletions. Oncotarget. 2017;8(33): 54297-54303. [DOI] [PMC free article] [PubMed] [Google Scholar]
- 5.Baliakas P, Jeromin S, Iskas M, et al. Cytogenetic complexity in chronic lymphocytic leukemia: definitions, associations, and clinical impact. Blood. 2019;133(11):1205-1216. [DOI] [PMC free article] [PubMed] [Google Scholar]
- 6.Thompson PA, O'Brien SM, Wierda WG, et al. Complex karyotype is a stronger predictor than del(17p) for an inferior outcome in relapsed or refractory chronic lymphocytic leukemia patients treated with ibrutinibbased regimens. Cancer. 2015;121(20):3612-3621. [DOI] [PMC free article] [PubMed] [Google Scholar]
- 7.Chanan-Khan A, Cramer P, Demirkan F, et al. Ibrutinib combined with bendamustine and rituximab compared with placebo, bendamustine, and rituximab for previously treated chronic lymphocytic leukaemia or small lymphocytic lymphoma (HELIOS): a randomised, double-blind, phase 3 study. Lancet Oncol. 2016;17(2):200-211. [DOI] [PubMed] [Google Scholar]
- 8.Anderson MA, Tam C, Lew TE, et al. Clinicopathological features and outcomes of progression of CLL on the BCL2 inhibitor venetoclax. Blood. 2017;129(25):3362-3370. [DOI] [PubMed] [Google Scholar]
- 9.Haferlach C, Dicker F, Schnittger S, Kern W, Haferlach T. Comprehensive genetic characterization of CLL: a study on 506 cases analysed with chromosome banding analysis, interphase FISH, IgV(H) status and immunophenotyping. Leukemia. 2007;21(12):2442-2451. [DOI] [PubMed] [Google Scholar]
- 10.Badoux XC, Keating MJ, Wang X, et al. Cyclophosphamide, fludarabine, alemtuzumab, and rituximab as salvage therapy for heavily pretreated patients with chronic lymphocytic leukemia. Blood. 2011;118(8): 2085-2093. [DOI] [PMC free article] [PubMed] [Google Scholar]
- 11.Van Den Neste E, Robin V, Francart J, et al. Chromosomal translocations independently predict treatment failure, treatment-free survival and overall survival in B-cell chronic lymphocytic leukemia patients treated with cladribine. Leukemia. 2007;21(8):1715-1722. [DOI] [PubMed] [Google Scholar]
- 12.Jaglowski SM, Ruppert AS, Heerema NA, et al. Complex karyotype predicts for inferior outcomes following reduced-intensity conditioning allogeneic transplant for chronic lymphocytic leukaemia. Br J Haematol. 2012;159(1):82-87. [DOI] [PMC free article] [PubMed] [Google Scholar]
- 13.Baliakas P, Puiggros A, Xochelli A, et al. Additional trisomies amongst patients with chronic lymphocytic leukemia carrying trisomy 12: the accompanying chromosome makes a difference. Haematologica. 2016;101(7):e299-302. [DOI] [PMC free article] [PubMed] [Google Scholar]
- 14.Rigolin GM, Saccenti E, Guardalben E, et al. In chronic lymphocytic leukaemia with complex karyotype, major structural abnormalities identify a subset of patients with inferior outcome and distinct biological characteristics. Br J Haematol. 2018;181(2): 229-233. [DOI] [PubMed] [Google Scholar]
- 15.Visentin A, Bonaldi L, Rigolin GM, et al. The combination of complex karyotype subtypes and IGHV mutational status identifies new prognostic and predictive groups in chronic lymphocytic leukaemia. Br J Cancer. 2019;121(2):150-156. [DOI] [PMC free article] [PubMed] [Google Scholar]
- 16.Ouillette P, Erba H, Kujawski L, Kaminski M, Shedden K, Malek SN. Integrated genomic profiling of chronic lymphocytic leukemia identifies subtypes of deletion 13q14. Cancer Res. 2008;68(4):1012-1021. [DOI] [PubMed] [Google Scholar]
- 17.Gunn SR, Bolla AR, Barron LL, et al. Array CGH analysis of chronic lymphocytic leukemia reveals frequent cryptic monoallelic and biallelic deletions of chromosome 22q11 that include the PRAME gene. Leuk Res. 2009;33(9):1276-1281. [DOI] [PubMed] [Google Scholar]
- 18.Kolquist KA, Schultz RA, Slovak ML, et al. Evaluation of chronic lymphocytic leukemia by oligonucleotide-based microarray analysis uncovers novel aberrations not detected by FISH or cytogenetic analysis. Mol Cytogenet. 2011;4:25. [DOI] [PMC free article] [PubMed] [Google Scholar]
- 19.Edelmann J, Holzmann K, Miller F, et al. High-resolution genomic profiling of chronic lymphocytic leukemia reveals new recurrent genomic alterations. Blood. 2012;120(24):4783-4794. [DOI] [PubMed] [Google Scholar]
- 20.Chun K, Wenger GD, Chaubey A, et al. Assessing copy number aberrations and copy-neutral loss-of-heterozygosity across the genome as best practice: an evidencebased review from the Cancer Genomics Consortium (CGC) working group for chronic lymphocytic leukemia. Cancer Genet. 2018;228-229:236-250. [DOI] [PubMed] [Google Scholar]
- 21.Kujawski L, Ouillette P, Erba H, et al. Genomic complexity identifies patients with aggressive chronic lymphocytic leukemia. Blood. 2008;112(5):1993-2003. [DOI] [PMC free article] [PubMed] [Google Scholar]
- 22.Gunnarsson R, Mansouri L, Isaksson A, et al. Array-based genomic screening at diagnosis and during follow-up in chronic lymphocytic leukemia. Haematologica. 2011;96(8): 1161-1169. [DOI] [PMC free article] [PubMed] [Google Scholar]
- 23.Ouillette P, Collins R, Shakhan S, et al. Acquired genomic copy number aberrations and survival in chronic lymphocytic leukemia. Blood. 2011;118(11):3051-3061. [DOI] [PMC free article] [PubMed] [Google Scholar]
- 24.Schoumans J, Suela J, Hastings R, et al. Guidelines for genomic array analysis in acquired haematological neoplastic disorders. Genes Chromosomes Cancer. 2016;55(5):480-491. [DOI] [PubMed] [Google Scholar]
- 25.Leeksma AC, Baliakas P, Moysiadis T, et al. Genomic arrays identify high-risk chronic lymphocytic leukemia with genomic complexity: a multicenter study. Haematologica. 2020;106(1):87-97. [DOI] [PMC free article] [PubMed] [Google Scholar]
- 26.McGowan-Jordan J, Simons A, Schmid M. International Standing Committee on Human Cytogenetic Nomenclature. ISCN: An International System for Human Cytogenomic Nomenclature. Basel; New York: Karger; 2016. [Google Scholar]
- 27.Döhner H, Stilgenbauer S, Benner A, et al. Genomic aberrations and survival in chronic lymphocytic leukemia. N Engl J Med. 2000;343(26):1910-1916. [DOI] [PubMed] [Google Scholar]
- 28.Rigolin GM, Cavallari M, Quaglia FM, et al. In CLL, comorbidities and the complex karyotype are associated with an inferior outcome independently of CLL-IPI. Blood. 2017;129(26):3495-3498. [DOI] [PubMed] [Google Scholar]
- 29.Puiggros A, Puigdecanet E, Salido M, et al. Genomic arrays in chronic lymphocytic leukemia routine clinical practice: are we ready to substitute conventional cytogenetics and fluorescence in situ hybridization techniques? Leuk Lymphoma. 2013;54(5): 986-995. [DOI] [PubMed] [Google Scholar]
- 30.Urbankova H, Papajik T, Plachy R, et al. Array-based karyotyping in chronic lymphocytic leukemia (CLL) detects new unbalanced abnormalities that escape conventional cytogenetics and CLL FISH panel. Biomed Pap Med Fac Univ Palacky Olomouc Czech Repub. 2014;158(1):56-64. [DOI] [PubMed] [Google Scholar]
- 31.Mayr C, Speicher MR, Kofler DM, et al. Chromosomal translocations are associated with poor prognosis in chronic lymphocytic leukemia. Blood. 2006;107(2):742-751. [DOI] [PubMed] [Google Scholar]
- 32.Heerema NA, Muthusamy N, Zhao Q, et al. Prognostic significance of translocations in the presence of mutated IGHV and of cytogenetic complexity at diagnosis of chronic lymphocytic leukemia. Haematologica. 2021;106(6):1608-1615. [DOI] [PMC free article] [PubMed] [Google Scholar]
- 33.Puente XS, Beà S, Valdés-Mas R, et al. Noncoding recurrent mutations in chronic lymphocytic leukaemia. Nature. 2015;526(7574):519-524. [DOI] [PubMed] [Google Scholar]
- 34.Salaverria I, Martín-Garcia D, López C, et al. Detection of chromothripsis-like patterns with a custom array platform for chronic lymphocytic leukemia. Genes Chromosomes Cancer. 2015;54(11):668-680. [DOI] [PMC free article] [PubMed] [Google Scholar]
- 35.O’Brien S, Furman RR, Coutre S, et al. Single agent ibrutinib in treatment-naıve and relapsed/refractory chronic lymphocytic leukemia: a 5-year experience. Blood. 2018;131(17):1910-1919. [DOI] [PMC free article] [PubMed] [Google Scholar]
- 36.Kreuzer KA, Furman RR, Stilgenbauer S, et al. Outcome of patients with complex karyo type in a phase 3 randomized study of idelalisib plus rituximab for relapsed chronic Lymphocytic Leukemia. Blood. 2016;128(22):192. [Google Scholar]
- 37.Brown JR, Hillmen P, O'Brien S, et al. Extended follow-up and impact of high-risk prognostic factors from the phase 3 RESONATE study in patients with previously treated CLL/SLL. Leukemia. 2018;32(1):83-91. [DOI] [PMC free article] [PubMed] [Google Scholar]
- 38.Mato AR, Thompson M, Allan JN, et al. Real-world outcomes and management strategies for venetoclax-treated chronic lymphocytic leukemia patients in the United States. Haematologica. 2018;103(9):1511-1517. [DOI] [PMC free article] [PubMed] [Google Scholar]
- 39.Woyach JA, Ruppert AS, Heerema NA, et al. Ibrutinib regimens versus chemoimmunotherapy in older patients with untreated CLL. N Engl J Med. 2018;379(26):2517-2528. [DOI] [PMC free article] [PubMed] [Google Scholar]
- 40.Kipps TJ, Fraser G, Coutre SE, et al. Longterm studies assessing outcomes of ibrutinib therapy in patients with del(11q) chronic lymphocytic leukemia. Clin Lymphoma Myeloma Leuk. 2019;19(11): 715-722. [DOI] [PubMed] [Google Scholar]
- 41.Munir T, Brown JR, O'Brien S, et al. Final analysis from RESONATE: up to six years of follow-up on ibrutinib in patients with previously treated chronic lymphocytic leukemia or small lymphocytic lymphoma. Am J Hematol. 2019;94(12):1353-1363. [DOI] [PMC free article] [PubMed] [Google Scholar]
- 42.Al-Sawaf O, Lilienweiss E, Bahlo J, et al. High efficacy of venetoclax plus obinutuzumab in patients with complex karyotype and chronic lymphocytic leukemia. Blood. 2020;135(11):866-870. [DOI] [PubMed] [Google Scholar]
- 43.Kreuzer KA, Furman RR, Stilgenbauer S, et al. The impact of complex karyotype on the overall survival of patients with relapsed chronic lymphocytic leukemia treated with idelalisib plus rituximab. Leukemia. 2020;34(1):296-300. [DOI] [PMC free article] [PubMed] [Google Scholar]
- 44.Jondreville L, Krzisch D, Chapiro E, Nguyen- Khac F. The complex karyotype and chronic lymphocytic leukemia: prognostic value and diagnostic recommendations. Am J Hematol. 2020;95(11):1361-1367. [DOI] [PubMed] [Google Scholar]
Associated Data
This section collects any data citations, data availability statements, or supplementary materials included in this article.


