Abstract
Background
N6-methyladenosine (m6A) is the most prevalent modification in mRNA in biological processes and associated with various malignant tumor initiation and progression. The present study aimed to construct a prognostic risk model based on m6A-related genes (the downstream genes influenced by m6A modulators) for LUSC.
Methods
Based on TCGA, we stratified LUSC patients with and without genetic alteration of m6A modulators into altered and unaltered groups. Using univariate Cox and Lasso regression analyses, we identified prognostic m6A-related genes to construct a prognostic risk model. We then applied a multivariate Cox proportional regression model and the survival analysis to evaluate the risk model. Moreover, we performed the Receiver operating characteristic curve to assess the efficiency of the prognostic model based on TCGA and GSE43131. We analyzed the characteristics of tumor-associated immune cell infiltration in LUSC through the CIBERSORT method.
Results
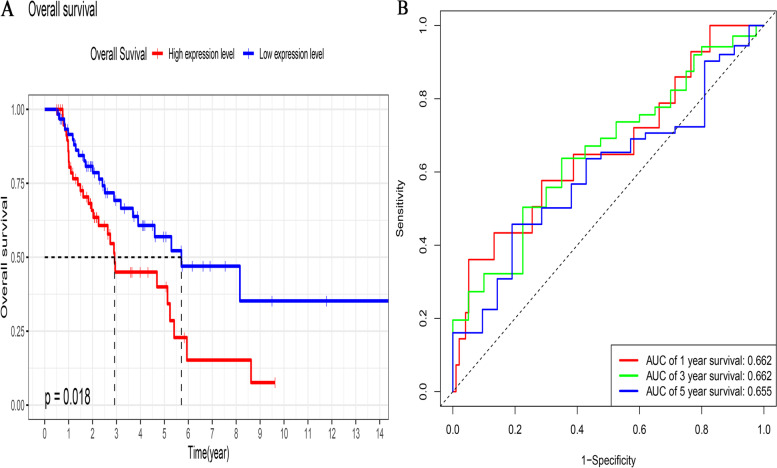
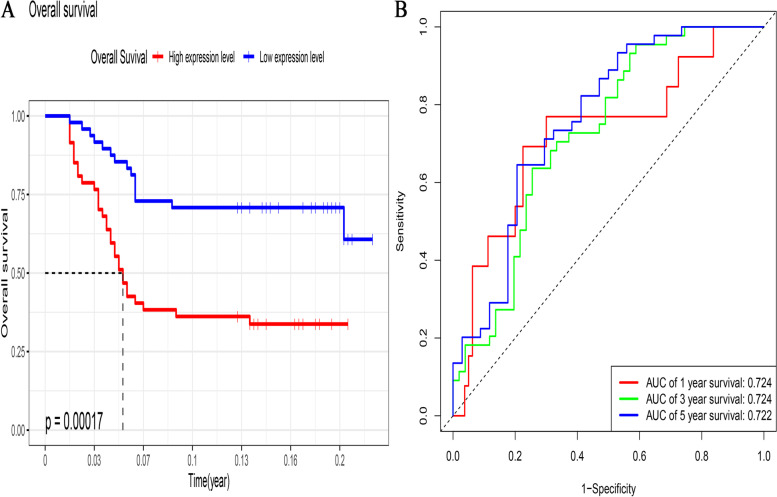
Three m6A-related genes (FAM71F1, MT1E, and MYEOV) were identified as prognostic genes for LUSC. A novel prognostic risk model based on the three m6A-related genes was constructed. The multivariate Cox analysis showed that the prognostic risk model was an independent risk factor (HR = 2.44, 95% CI = 1.21~3.56, p = 0.029). Patients with a high-risk group had worse overall survival both in TCGA (p = 0.018) and GSE43131 (p = 0.00017). The 1, 2, and 3-year AUC value in TCGA was 0.662, 0.662, and 0.655, respectively; The 1, 2, and 3-year AUC value in GSE43131 was 0.724, 0.724, and 0.722, respectively. The proportion of infiltrated neutrophils in the high-risk group was higher than that in the low-risk group (p = 0.028), whereas that of resting NK cells (p = 0.002) was lower.
Conclusion
A novel prognostic risk model based on three m6A-related genes for LUSC was generated in this study.
Supplementary Information
The online version contains supplementary material available at 10.1186/s12957-022-02509-1.
Keywords: m6A-related gene, Lung cancer, Prognosis, TCGA, GEO
Introduction
Non-small cell lung cancer (NSCLC) is the most common subtype (85%) of lung cancer, which is the most frequent and leading cause of cancer-related death worldwide [1]. Lung squamous cell cancer (LUSC), one of the predominant histological subtypes of NSCLC, accounts for 30% of NSCLC cases and 23% of all lung cancers in the United States of America [2]. Despite the demonstrated survival benefits of neo-adjuvant therapy, the 5-year survival rate of patients with LUSC remains dismal because the majority of such patients are diagnosed at an advanced stage with metastasis [3–5].. Although the clinical tumor-node-metastasis (TNM) stage is associated with the prognosis of LUSC, it cannot be used as an indicator to precisely estimate the overall survival [6, 7]. Developments in next-generation sequencing technology facilitate epigenetic markers to guide the evaluation of prognosis of malignant tumors [8, 9]. Therefore, integrating epigenetic-related genetic biomarkers to existing prognostic indicators would be beneficial to improving the accuracy of estimating the overall survival of patients with LUSC.
N6-Methyladenosine (m6A) is the most abundant internal modification on mRNAs in eukaryotic cells [10]. It participates in almost all steps of mRNA metabolism, such as translation, spicing, folding, degradation, and export. M6A modification is a complicated dynamic and reversible process, which has emerged as a vital regulator of gene expression influencing biological processes and pathological functions [11, 12]. M6A can be catalyzed by the methyltransferases (also termed writers: METTL3, METTL14, WTAP, etc.), recruited by m6A-binding proteins (also termed readers: FTO and ALKBH5 ), and removed by demethylases (also termed erasers: YTHDC1/2, YTHDF1/2/3, and IGF2BP1/2/3, etc.) [13]. Emerging evidence has demonstrated that dysregulation of M6A modulators, such as YTHDF1, METTL3, and FTO, plays an important role in the regulation of the occurrence, progression, and immune microenvironment of malignant tumors [14–19]. Although the underlying mechanisms of dysregulation m6A modulators in malignant tumors remain elusive, the relationship between m6A modulators and malignant tumors has been verified in many researches. However, few studies have investigated the association of malignant tumors with downstream genes influenced by m6A modulators, and the role of such genes in prognostic evaluation of LUSC is still unclear.
The present study aims to investigate the impact of genetic alteration of m6A modulators on the overall survival of LUSC patients, as well as the effect of downstream genes influenced by m6A modulators on prognosis of LUSC, using data from The Cancer Genome Atlas (TCGA) and Gene Expression Omnibus (GEO) databases, and to construct a prognostic risk model for LUSC based on differently expressed m6A-related genes.
Materials and methods
Data profiles
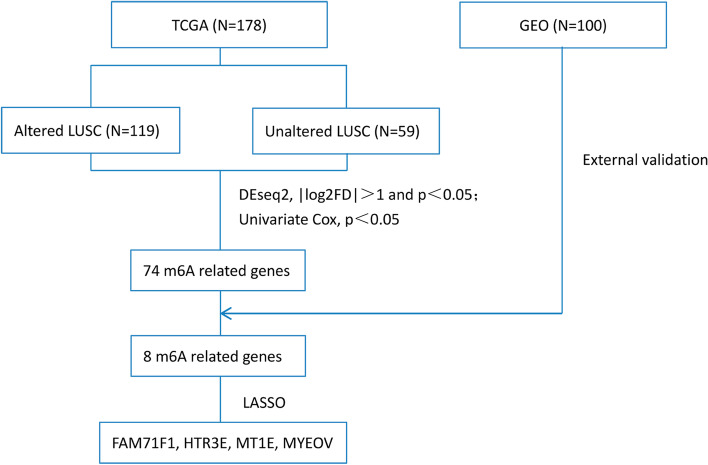
We downloaded raw RNA sequencing data (fragments per kilobase of exon model per million reads mapped [FPKM] and count data), copy number variation (CNV) and mutation data, and corresponding information on clinicopathological features (including sex, age, race, smoking history, cancer status, pathologic stage, T stage, N stage, M stage, survival time, and survival status) from TCGA (https://www.cancer.gov, LUSC project) and a GEO external validation dataset (https://www.ncbi.nlm.nih.gov/, GSE43131) on 5 Jan 2021. Finally, we obtained 178 and 100 LUSC samples, respectively. The study design is outlined in Fig. 1.
Fig. 1.
Flow chart of the study
Selection of m6A modulators and analysis of clinicopathological features
We selected 19 m6A modulators from published reports (i.e., METTL3, METTL14, METTL16, WTAP, RBM15, RBM15B, CBLL1, VIRMA, ZC3H13, FTO, ALKBH5, YTHDC1, YTHDC2, YTHDF1, YTHDF2, YTHDF3, IGF2BP1, IGF2BP2, and IGF2BP), which were included in our analysis. LUSC patients with and without genetic alterations (mutation and/or CNV) of m6A modulators from TCGA were stratified into the altered and unaltered groups, respectively. We analyzed the difference of the overall survival between the two groups through the log-rank test and survival curves were generated using the Kaplan–Meier method. Differences in clinicopathological features between the two groups were determined using the chi-squared or Fisher’s exact test. A p-value (two-sided) < 0.05 denoted statistically significant difference.
Construction of a prognostic risk score model and the ROC curves for LUSC prognosis
We normalized raw RNA sequencing count data obtained from TCGA LUSC and searched for the downstream genes influenced by m6A modulators (defined m6A-related genes) between altered and unaltered groups using the R “Deseq2” package; p < 0.05 and |log2 (false discovery rate)| > 1 denoted statistical significance. Univariate Cox regression analysis was conducted to identify prognostic m6A-related genes in TCGA LUSC; p<0.1 denoted statistical significance. We validated the prognostic m6A-related genes in GSE43131; genes with p<0.1 were considered candidate prognostic m6A-related genes. Furthermore, least absolute shrinkage and selection operator (LASSO) regression analysis was performed to select target prognostic m6A-related genes for the construction of a prognostic risk model for LUSC. Furthermore, we verified the selected target prognostic m6A-related genes which also differently expressed between LUSC and adjacent normal tissues in TCGA dataset using “limma” package by R software (adj. p. value < 0.05 and |log2 (fold change)| > 1 denoted statistical significance). The following calculation formula was used:
where coefi is the LASSO Cox regression coefficient and χi is the expression value of each selected m6A-related gene. We used “glmnet” and “survival” packages by R software to calculate the coefficients of the m6A-related genes involved in the risk score. Finally, we calculated a risk score for each patient with LUSC both in TCGA and GSE43131.
To test the prognostic significance of the risk model, we divided LUSC patients from TCGA into high- and low-risk groups based on the median risk score; those with survival time < 180 days were excluded. Using the R “survival” package, we compared the overall survival between the two groups through the Kaplan–Meier plotter with log-rank p-value. We also produced receiver operating characteristic (ROC) curves with area under the curve (AUC) values for 1-, 2-, and 3-year overall survival to evaluate the prognostic performance of the risk model for LUSC. Moreover, we validated the prognostic value of the risk model for LUSC in the GSE43131 using similar statistical analyses, in which we also excluded LUSC patients with survival time < 180 days (6 months).
To further address the prognosis association of the risk model, we conducted univariate and multivariate Cox proportional hazard analyses. These analyses were performed to verify independent risk factors for LUSC in TCGA, with covariates including the risk score, sex, age, race, smoking history, cancer status, pathologic stage, T stage, N stage, and M stage.
Estimation of differences in immune cell infiltration between the high- and low-risk score groups
The tumor immune microenvironment has been associated with overall survival in almost all types of cancer, with different proportions of immune cell infiltration indicating either poor or good prognostic performance. Herein, we converted the FPKM format of RNA sequencing data of LUSC from TCGA into the transcripts per million (TPM) format, uploaded the TPM data to the CIBERSORT (Cell-type Identification By Estimating Relative Subsets Of known RNA Transcripts) online tool, and investigated differences in the relative infiltration of 22 types of immune cells between the high- and low-risk groups. Subsequently, we inferred the relationships between the overall survival of LUSC patients and the immune cell infiltration. CIBERSORT is a novel classic bulk RNA deconvolution tool that is based on linear support vector regression to statistically estimate the relative infiltration of immune cell subsets from the expression profiles of bulk tumors [20]. This approach provides a gene signature matrix of 22 leukocyte subsets (LM22), and a total of 547 gene signature expression values are set as references.
Function enrichment analyses
To investigate the potential biological mechanisms of m6A-related genes involved in the occurrence, progression, and metastasis of LUSC, we conducted Gene Ontology (GO) enrichment and Kyoto Encyclopedia of Genes and Genomes (KEGG) pathway analyses using the R “clusterProfiler” package.
Statistical analyses
We used the R software (version 3.5.3 and 4.0.3; R Foundation, Vienna, Austria) to perform all statistical calculations and produce the corresponding figures.
Results
Alteration features of m6A modulators in LUSC from TCGA dataset
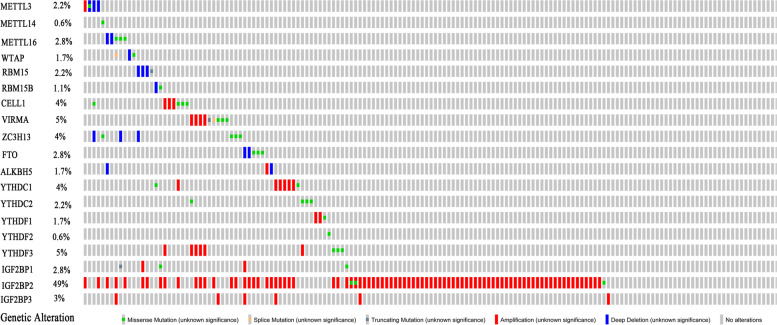
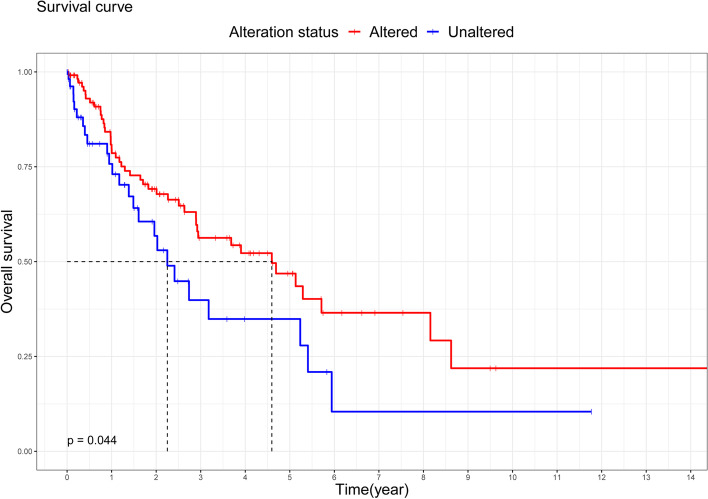
We investigated 119 and 59 samples of LUSC from TCGA with and without alterations of m6A modulators, respectively (altered and unaltered groups, respectively). Detailed information on these alterations was shown in Table 1 and Fig. 2. IGF2BP2 was the most frequently altered m6A modulator (50.56%), followed by YTHDF3 (5.06%), VIRMA (5.06%), YTHDC1 (4.49%), ZC3H13 (3.93%), and CBLL1 (3.93%). The most frequent form of alteration was amplification (Table 1 and Fig. 2). Interestingly, a tendency towards better overall survival was found in the altered group compared with the unaltered group (p = 0.044; Fig. 3). We also compared the two groups in terms of clinicopathological features (including sex, age, race, smoking history, cancer status, pathologic stage, T stage, N stage, and M stage); the results did not reveal statistically significant differences (Table 2).
Table 1.
Genetic alteration signatures of m6A modification genes in samples of lung squamous cell cancer from TCGA (n = 178)
| Genetic alteration | ||||||||
|---|---|---|---|---|---|---|---|---|
| Mutation | CNV | |||||||
| No alterations | Missense mutation | Splice | Truncating mutation | Amplification | Deep deletion | Altered/profiled | ||
| Writer | METTL3 | 173 | 1 | 0 | 0 | 1 | 3 | 2.81% |
| METTL14 | 177 | 1 | 0 | 0 | 0 | 0 | 0.56% | |
| METTL16 | 173 | 3 | 0 | 0 | 0 | 2 | 2.81% | |
| WTAP | 175 | 1 | 1 | 0 | 0 | 1 | 1.69% | |
| RBM15 | 174 | 0 | 0 | 1 | 0 | 3 | 2.25% | |
| RBM15B | 176 | 1 | 0 | 0 | 0 | 1 | 1.12% | |
| CBLL1 | 171 | 4 | 0 | 0 | 3 | 0 | 3.93% | |
| VIRMA | 169 | 3 | 1 | 1 | 4 | 0 | 5.06% | |
| ZC3H13 | 171 | 4 | 0 | 0 | 0 | 3 | 3.93% | |
| Eraser | FTO | 173 | 3 | 0 | 0 | 0 | 2 | 2.81% |
| ALKBH5 | 175 | 0 | 0 | 0 | 1 | 2 | 1.69% | |
| Reader | YTHDC1 | 170 | 2 | 0 | 0 | 6 | 0 | 4.49% |
| YTHDC2 | 174 | 4 | 0 | 0 | 0 | 0 | 2.25% | |
| YTHDF1 | 175 | 1 | 0 | 0 | 2 | 0 | 1.69% | |
| YTHDF2 | 177 | 1 | 0 | 0 | 0 | 0 | 0.56% | |
| YTHDF3 | 169 | 3 | 0 | 0 | 6 | 0 | 5.06% | |
| IGF2BP1 | 173 | 2 | 0 | 1 | 2 | 0 | 2.81% | |
| IGF2BP2 | 88 | 3 | 0 | 0 | 87 | 0 | 50.56% | |
| IGF2BP3 | 172 | 0 | 0 | 0 | 6 | 0 | 3.37% | |
Fig. 2.
Genetic alteration signatures of m6A modification genes in samples of lung squamous cell cancer from TCGA dataset. TCGA, The Cancer Genome Atlas
Fig. 3.
Kaplan–Meier overall survival analysis of 178 patients with lung squamous cell cancer from TCGA dataset. TCGA, The Cancer Genome Atlas
Table 2.
Clinicopathological features of altered and unaltered patients with LUSC from TCGA
| Unaltered(n = 59) | Altered(n = 119) | p-value | ||
|---|---|---|---|---|
| Sex | 0.278 | |||
| Female | 19 | 28 | ||
| Male | 40 | 91 | ||
| Age | 0.386 | |||
| < 65 | 15 | 40 | ||
| ≥ 65 | 42 | 78 | ||
| NA | 2 | 1 | ||
| Race | 0.769 | |||
| White | 41 | 72 | ||
| Non-white | 4 | 10 | ||
| NA | 14 | 37 | ||
| Smoking_history | 1.000 | |||
| Yes | 57 | 116 | ||
| No | 2 | 3 | ||
| Cancer_status | 0.658 | |||
| With cancer | 10 | 18 | ||
| Cancer free | 49 | 101 | ||
| Pathologic_stage | 0.978 | |||
| I | 34 | 65 | ||
| II | 12 | 27 | ||
| III | 12 | 23 | ||
| IV | 1 | 2 | ||
| NA | 0 | 2 | ||
| T stage | 0.539 | |||
| T1 | 16 | 21 | ||
| T2 | 35 | 80 | ||
| T3 | 4 | 10 | ||
| T4 | 4 | 8 | ||
| N stage | 0.521 | |||
| N0 | 40 | 76 | ||
| N1 | 10 | 29 | ||
| N2 | 6 | 11 | ||
| N3 | 2 | 3 | ||
| NX | 1 | 0 | ||
| M stage | 0.172 | |||
| M0 | 53 | 112 | ||
| M1 | 1 | 2 | ||
| MX | 4 | 2 | ||
| NA | 1 | 3 |
Altered, LUSC patients with mutation and/or copy number variation; Unaltered, LUSC patients without mutation and/or copy number variation; LUSC lung squamous cell cancer, TCGA The Cancer Genome Atlas
Identification of seven prognostic m6A-related genes and construction of a risk score model
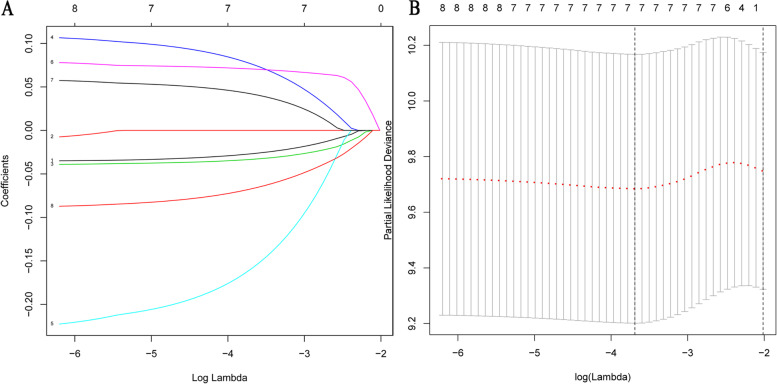
We screened 872 m6A-related genes (373 down-regulated, 499 up-regulated) by comparing the altered and unaltered groups of LUSC patients from TCGA (Supplementary Table 1). The univariate Cox regression analysis identified 74 m6A-related genes (p<0.1) associated with overall survival of LUSC patients (Supplementary Table 2). We validated eight of these 74 prognostic m6A-related genes in the external validation dataset GSE43131 for further analysis (p < 0.1, Table 3). To avoid overfitting, we conducted LASSO regression analysis to reduced dimension and selected seven genes as target prognostic m6A-related genes (CNTNAP2, FAM71F1, GRM4, HTR3E, MT1E, MYEOV, and POU3F2) based on the minimum criterion (Fig. 4 A and B). MT1E and MYEOV were identified as prognostic genes of risk in both TCGA and GSE43131 datasets (hazard ratio [21] >1; Table 3). In contrast, FAM71F1 and HTR3E were identified as prognostic genes of protection in both datasets (HR < 1; Table 3). Notably, CNTNAP2, GRM4, and POU3F2 exhibited opposite prognostic associations in the two datasets (Table 3). FAM71F1, MT1E, and MYEOV were also differently expressed between LUSC and normal tissues (Supplementary Table 3). Hence, we selected FAM71F1, MT1E, and MYEOV to generate a prognostic risk model: risk score = (− 0.03323723 × expression of FAM71F1) + (0.07068792 × expression of MT1E) + (0.04196110 × expression of MYEOV).
Table 3.
Prognostic m6A-related genes for LUSC in TCGA and GSE43131
| Gene symbol | TCGA-univariate Cox results | GEO-univariate Cox results | |||
|---|---|---|---|---|---|
| HR (95%CI) | p-value | HR (95%CI) | p-value | ||
| CNTNAP2 | 0.90(0.82~0.99) | 0.029 | 24.28(1.83~32.18) | 0.016 | |
| EREG | 1.12(1.00~1.27) | 0.064 | 0.14(0.02~0.84) | 0.033 | |
| FAM71F1 | 0.90(0.81~1.01) | 0.056 | 0.09(0.01~0.74) | 0.025 | |
| GRM4 | 1.11(0.99~1.25) | 0.066 | 0.13(0.01~1.27) | 0.085 | |
| HTR3E | 0.81(0.64~1.01) | 0.057 | 0.28(0.07~1.17) | 0.079 | |
| MT1E | 1.23(1.03~1.46) | 0.024 | 35.60(4.17~304.04) | 0.001 | |
| MYEOV | 1.11(0.99~1.25) | 0.072 | 5.87(1.59~21.70) | 0.012 | |
| POU3F2 | 0.90(0.80~1.00) | 0.046 | 79.27(3.19~1969.46) | 0.008 | |
CI confidence interval, GEO Gene Expression Omnibus, HR hazard ratio, LUSC lung squamous cell cancer, m6A N6-methyladenosine, TCGA The Cancer Genome Atlas
Fig. 4.
Distribution of Lasso coefficients for eight m6A-related genes. A Lasso coefficient spectrum of eight m6A-related genes in LUSC. B Cross-validation for tuning parameter selection in the proportional hazards model. Lasso, least absolute shrinkage and selection operator
The ROC curves of the risk score model for LUSC prognosis
Log-rank analysis revealed a significant difference in overall survival between the two groups; the high-risk group exhibited a stronger trend towards worse overall survival (p = 0.018; Fig. 5A). In addition, the results of the ROC curve analysis showed that the risk model had a good prognostic effect for LUSC; the AUC values for 1-, 2-, and 3-year overall survival were 0.662, 0.662, and 0.655, respectively (Fig. 5B). The results of the validation analysis verified that the survival trend of patients stratified according to the median risk score was consistent between the GSE43131 and TCGA. The LUSC patients in the high-risk group showed poor overall survival (p = 0.00017, Fig. 6A). The ROC curves showed considerable prognostic capacity; the AUC values for 1-, 2-, and 3-year overall survival were 0.724, 0.724, and 0.722, respectively (Fig. 6B).
Fig. 5.
Overall survival between the high- and low-risk score subgroups according to the median risk score and ROC curves predicting survival in patients with lung squamous cell cancer from TCGA dataset. A Difference in overall survival between the two subgroups. B ROC curve predicting survival at 1, 2, and 3 years. ROC, receiver operating characteristic; TCGA, The Cancer Genome Atlas
Fig. 6.
Overall survival between the high- and low-risk score subgroups according to the median risk score and ROC curves predicting survival in patients with lung squamous cell cancer from the GEO external validation dataset. A Difference in overall survival between the two subgroups. B ROC curve predicting survival at 1, 2, and 3 years. GEO, Gene Expression Omnibus; ROC, receiver operating characteristic
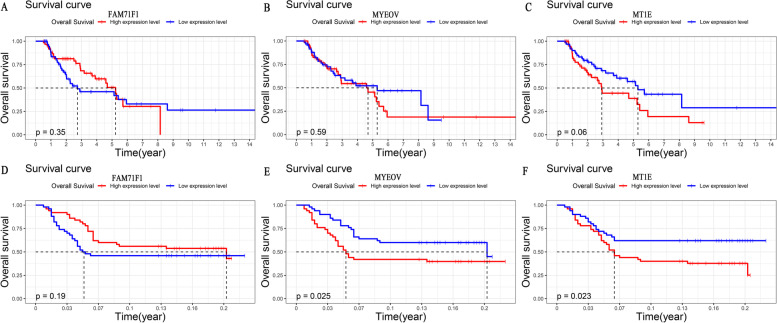
We also analyzed the prognostic performance of the three m6A-related genes included in the risk model. The results showed that the impact of individual genes on the survival of LUSC patients either in TCGA or external validation dataset varied (Fig. 7). The overall survival of LUSC patients showed a similar survival trend in the two datasets. Of note, LUSC patients with a high expression level of MT1E were associated with poorer overall survival, which reached statistical significance both in the two datasets (TCGA: p = 0.06; GSE43131: p = 0.023, Fig. 7).
Fig. 7.
Kaplan–Meier overall survival analyses for lung squamous cell cancer patients with high or low expression levels of FAM71F1, MT1E, and MYEOV from TCGA dataset and the GEO external validation dataset. A–C Kaplan–Meier overall survival analyses based on TCGA dataset. D–E Kaplan–Meier overall survival analyses based on the GEO external validation dataset. GEO, Gene Expression Omnibus; TCGA, The Cancer Genome Atlas
Lastly, we verified whether the risk model was an independent prognostic risk factor for LUSC patients using univariate and multivariate Cox proportional hazard analyses. The prognostic association of the risk model was maintained both in the univariate and multivariate analyses, indicating that the risk model was independently associated with the prognosis of LUSC patients, which was a risk factor for LUSC (univariate, HR: 1.90 95% confidence interval [CI]: 1.10–3.28, p = 0.020; multivariate, HR: 2.44, 95% CI: 1.21–3.56, p = 0.029) (Table 4). The results also demonstrated that cancer status (HR: 3.20, 95% CI: 1.65–6.21, p = 0.000) and T stage (HR: 1.95, 95% CI: 1.30–2.45, p = 0.017) were independent prognostic factors of risk while and sex was an independent prognostic factor of protection (HR: 0.18, 95% CI: 0.06–1.22, p = 0.000) in patients with LUSC (Table 4).
Table 4.
Cox regression analyses for overall survival in patients with LUSC from TCGA
| Univariate Cox | Multivariate Cox | |||
|---|---|---|---|---|
| HR(95%CI) | p-value | HR(95%CI) | p-value | |
| Risk score | 1.90(1.10~3.28) | 0.020* | 2.44(1.21~3.56) | 0.029* |
| Sex | 0.53(0.28~1.04) | 0.050* | 0.18(0.06~1.22) | 0.000* |
| Cancer status | 3.72(1.93~7.16) | 0.000* | 3.20(1.65~6.21) | 0.000* |
| T stage | 1.37(0.98~1.94) | 0.079 | 1.95(1.30~2.45) | 0.017* |
| Age | 1.05(0.59~1.87) | 0.878 | ||
| Race | 0.37(0.09~1.56) | 0.116 | ||
| Smoking history | 0.97(0.13~7.03) | 0.974 | ||
| Pathologic stage | 1.25(0.93~1.67) | 0.156 | ||
| N stage | 1.24(0.88~1.73) | 0.236 | ||
| M stage | 0.60(0.11~3.09) | 0.475 | ||
CI confidence interval, HR hazard ratio, LUSC lung squamous cell cancer, TCGA The Cancer Genome Atlas
*p < 0.05
Three types of immune cells with different degrees of infiltration between the high- and low-risk score groups
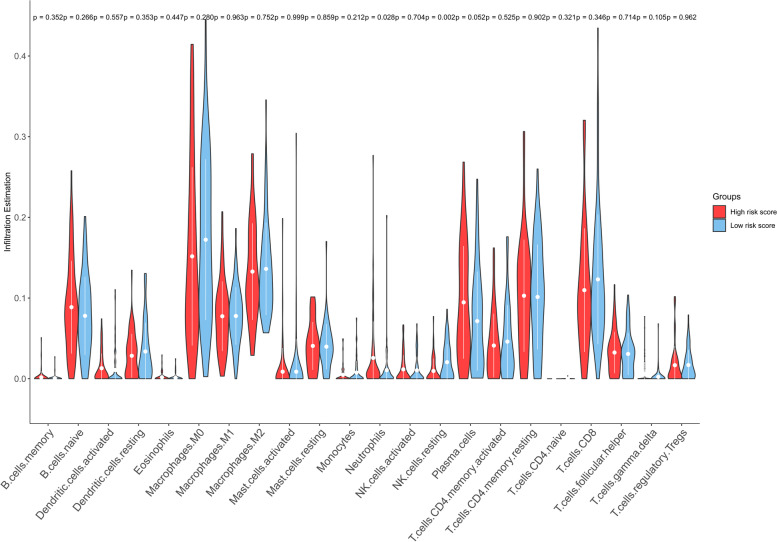
Using the TCGA data, the CIBERSORT method correctly inferred the relative infiltration signatures of LM22 in LUSC. We observed that the relative infiltration of two immune cell populations exhibited significant difference between the high- and low-risk groups. These two types of immune cells were neutrophils (p = 0.028) and resting NK cells (p = 0.002) (Fig. 8). Neutrophils showed significantly higher expression levels in the high-risk group than in the low-risk group, whereas resting NK cells exhibited significantly lower expression levels. Based on this finding, we concluded that neutrophils were negatively associated with the overall survival of LUSC patients. In contrast, resting NK cells were positively associated with the overall survival in this setting.
Fig. 8.
Violin plot for the differences in tumor-associated immune cell infiltrations between the high- and low-risk score subgroups
Function annotation of m6A-related genes
We conducted function enrichment analyses to better understand the potential biological functions of m6A-related genes in the pathogenesis of LUSC. Significant terms identified by the GO analysis were negative regulation of peptidase activity, negative regulation of endopeptidase activity, humoral immune response, antimicrobial humoral response, etc. (Fig. 9A). The KEGG enrichment analysis showed that the mainly enriched pathway included nicotine addiction, maturity-onset diabetes of the young, arachidonic acid metabolism, etc. (Fig. 9B).
Fig. 9.
Function annotation of m6A-related genes. A The most significant 20 items in the GO enrichment analysis. B The most significant 10 items in the KEGG pathway analysis. GO, Gene Ontology; KEGG, Kyoto Encyclopedia of Genes and Genomes
Discussion
The present study definitively clarified that m6A modulators with genetic alterations (mutation and/or CNV) were strongly related to the overall survival of LUSC patients; Patients with genetic alterations were linked to longer overall survival than those without genetic alterations. Using TCGA and GSE43131 external validation datasets, we positively trained and validated a powerful prognostic risk model for LUSC, which is based on three m6A-related genes (FAM71F1, MT1E, and MYEOV). The risk model was an independent risk prognostic factor for LUSC; LUSC patients in the high-risk group tended towards worse overall survival compared with those in the low-risk group. In addition, we discovered that neutrophils and resting NK cells were the most likely active immune cells to influence the overall survival of LUSC patients in the high- and low-risk groups.
In distinct malignant tumors, the forms of mutation and/or CNV of m6A modulators varied. Similar to head and neck squamous cell carcinoma [22], we found that “readers” exhibited a higher frequency of alterations than “writers” and “erasers” in LUSC. This result indicated that “readers” may play more important roles than “writers” and “erasers” in these two types cancer; “erasers” may play a more vital role than the other two types of modulators in acute myeloid leukemia, breast cancer, and glioblastoma [23–25]. In liver cancer, “writers” was the most common type of alteration of modulators [26]. This observation implied that the function of m6A modulators was tumor tissue-specific. Further investigation in rigorous clinical trials of various types of malignant tumors is warranted to confirm this conclusion.
Genetic alterations of m6A modulators alter their original biological function and subsequently promote or inhibit the occurrence, progression, and metastasis of malignant tumors. Accumulating research evidence suggests that genetic variants in m6A modulators are closely related to the clinical prognosis of patients with malignant tumors. In pancreatic cancer and acute myeloid leukemia, patients with alterations of m6A modulators were associated with markedly worse overall survival versus those without alterations [27, 28]. In head and neck squamous cell carcinoma and clear cell renal cell carcinoma, there was no significant difference in the overall survival of patients with and without alterations of m6A modulators. Notably, CNV of m6A modulators could indirectly influence the overall survival of these patients by affecting the expression of m6A modulators [22, 29]. Consistent with previous studies, we also demonstrated that genetic alterations of m6A modulators were significantly associated with survival in LUSC patients; the presence of altered m6A modulators in LUSC patients predicted superior overall survival.
In recent years, an increasing number of studies have been focused on the underlying correlation of genetic alterations of m6A modulators with the prognosis of malignant tumors. It has been verified that the single nucleotide polymorphism (SNP) of staphylococcal nuclease and tudor domain containing 1 (SND1) rs118049207 is significantly associated with the risk of colorectal cancer. The levels of SND1 mRNA were obviously elevated in colorectal tumor tissues. This increase led to the downregulation of the levels of m6A modification in colorectal cancer cells to promote the risk of colorectal cancer [30]. SNP rs2416282 was obviously associated with the susceptibility of esophageal cancer by affecting YTHDC2 expression. Deletion of YTHDC2 promoted the proliferation of esophageal cancer cells through various cancer-related signaling pathways [31]. The rs7495G allele increased the risk of pancreatic cancer by promoting the expression of heterogeneous nuclear ribonucleoprotein C (hnRNPC), which is a m6A reader [32]. SNP rs5746136 of superoxide dismutase 2 in m6A modulators was strongly associated with the risk of bladder cancer. rs5746136 regulated the expression levels of SOD2 by guiding the binding of hnRNPC to SOD2, which acted as a critical tumor suppressor by promoting apoptosis and inhibiting the proliferation, metastasis, and invasion of bladder cancer cells [33]. Thus, genetic alterations of m6A modulators provide novel biomarkers for predicting cancer prognosis. However, further investigation and clinical verification are warranted.
In this study, we selected three m6A-related genes (FAM71F1, MT1E, and MYEOV) to generate an effective prognostic risk model for predicting the overall survival of LUSC patients. Apart from sex, cancer status, and T stage, the risk model was consistently an independent prognostic risk factor for LUSC. MT1E is a function isoform of metallothionein (MT) 1. Powerful evidence has indicated that MTs play a pivotal role in malignant tumor formation, growth, migration, metastasis, and drug resistance, and can be utilized for tumor diagnosis and therapy [34, 35]. MTs control the cellular homeostasis of zinc/copper, which is essential for cell differentiation and proliferation and act as antioxidants to protect cells against free radical and oxidative stress generated by antitumor drugs and radiation [36–38]. MTs can bind to mercury, cadmium, platinum, or other similar heavy metals to protect cells against heavy metal toxicity [39]. They also play protective roles against DNA damage and apoptosis [40–42]. It has been shown that MYEOV contributes to tumorigenesis in several types of malignant tumors [43–45]. Research has shown that MYEOV was specifically expressed in NSCLC and represented poor prognosis in this disease. It functioned as an amplified competing endogenous RNA in promoting metastasis through activation of the TGF-β pathway [46]. We also found that LUSC patients with high expression of MYEOV in the GEO external validation dataset had inferior overall survival. Thus far, the relationships of FM71F1 with malignant tumors have only been reported in bioinformatics studies [47–49]. Hence, there is a lack of experimental investigations. Additional in vivo or in vitro research is necessary to examine the underlying association of these three m6A-related genes in LUSC.
A close connection between the immune microenvironment of tumors and overall survival has been established. Tumor-associated immune cell infiltrations represent great promising candidates for prognostic markers in malignant tumors [50, 51]. Tumor-associated neutrophils emerged as significant negative predictors of survival for breast and lung adenocarcinomas, while resting NK cells predicted adverse survival outcomes in lung cancer [52–54]. In concordance with these reports, we found that low infiltration of neutrophils can confer favorable overall survival in LUSC, where low infiltration of resting NK cells was linked to poor overall survival in LUSC. The present result contributes to the investigation of the multivariate relationships between the immune microenvironment of tumors and overall survival in patients with malignant tumors.
Conclusions
We investigated the genetic alterations of 19 m6A modulators in LUSC and found LUSC patients with genetic alterations of m6A modulators predicted superior overall survival. Consequently, we constructed an effective prognostic risk model based on three m6A-related genes (FAM71F1, MT1E, and MYEOV). However, the present study was limited to bioinformatics analyses; further studies on a large sample size will be needed to demonstrate this conclusion in a clinical experiment.
Supplementary Information
Additional file 1 : Supplement Table 1. 872 m6A related genes compared altered LUSC with unaltered LUSC in TCGA.
Additional file 2 : Supplement Table 2. Results of univariate Cox analysis in TCGA LUSC.
Additional file 3 : Supplementary Table 3. differently expressed genes between LUSC and normal tissues in TCGA dataset.
Acknowledgements
Not applicable.
Abbreviations
- m6A
N6-Methyladenosine
- NSCLC
Non-small-cell lung cancer
- LUSC
Lung squamous cell cancer
- TNM
Tumor-node-metastasis
- TCGA
The Cancer Genome Atlas
- GEO
Gene Expression Omnibus
- FPKM
Fragments per kilobase of exon model per million reads mapped
- CNV
Copy number variation
- LASSO
Least absolute shrinkage and selection operator
- ROC
Receiver operating characteristic
- AUC
Area under the curve
- HR
Hazard ratio
- CI
Confidence interval
- TPM
Transcripts per million
- CIBERSORT
Cell-type Identification By Estimating Relative Subsets Of known RNA Transcripts
- LM22
22 leukocyte subsets
- GO
Gene Ontology enrichment
- KEGG
Kyoto Encyclopedia of Genes and Genomes
Authors’ contributions
All authors read and approved the final manuscript. JX and ZB designed the study and acquired the data. EJ and NR analyzed the data and wrote the manuscript. BG and ZC contributed in reviewing the language and final version.
Funding
There was no funding received for this article.
Availability of data and materials
All data generated and/or analyzed during this study are available from TCGA (https://www.cancer.gov, LUSC project) and a GEO external validation dataset (https://www.ncbi.nlm.nih.gov/, GSE43131).
Declarations
Ethics approval and consent to participate
Not applicable.
Consent for publication
Not applicable.
Competing interests
The authors declare that they have no competing interests.
Footnotes
Publisher’s Note
Springer Nature remains neutral with regard to jurisdictional claims in published maps and institutional affiliations.
Erna Jia and Na Ren have contributed equally to this work and share first authorship.
Boyin Zhang and Jinru Xue have contributed equally to this work and share corresponding authorship.
Contributor Information
Boyin Zhang, Email: drboyin@jlu.edu.cn.
Jinru Xue, Email: jinruxue@jlu.edu.cn.
References
- 1.Bray F, Ferlay J, Soerjomataram I, et al. Global cancer statistics 2018: GLOBOCAN estimates of incidence and mortality worldwide for 36 cancers in 185 countries. CA Cancer J Clin. 2018;68(6):394–424. doi: 10.3322/caac.21492. [DOI] [PubMed] [Google Scholar]
- 2.Travis WD. Lung Cancer pathology: current concepts. Clin Chest Med. 2020;41(1):67–85. doi: 10.1016/j.ccm.2019.11.001. [DOI] [PubMed] [Google Scholar]
- 3.Allemani C, Weir HK, Carreira H, et al. Global surveillance of cancer survival 1995-2009: analysis of individual data for 25,676,887 patients from 279 population-based registries in 67 countries (CONCORD-2) Lancet. 2015;385(9972):977–1010. doi: 10.1016/S0140-6736(14)62038-9. [DOI] [PMC free article] [PubMed] [Google Scholar]
- 4.Shundo Y. T Takahashi, T Itaya, et al., [Clinical study of forty-two patients who underwent resection for pulmonary adenosquamous carcinoma] Kyobu geka Jpn J Thorac Surg. 2011;64(10):871–876. [PubMed] [Google Scholar]
- 5.Iijima Y, Seike M, Noro R, et al. Prognostic significance of PIK3CA and SOX2 in Asian patients with lung squamous cell carcinoma. Int J Oncol. 2015;46(2):505–512. doi: 10.3892/ijo.2014.2742. [DOI] [PMC free article] [PubMed] [Google Scholar]
- 6.Blaauwgeers H. R Damhuis, BI Lissenberg-Witte, et al., A population-based study of outcomes in surgically resected T3N0 non-small cell lung cancer in The Netherlands, defined using TNM-7 and TNM-8; justification of changes and an argument to incorporate histology in the staging algorithm. J Thorac Oncol. 2019;14(3):459–467. doi: 10.1016/j.jtho.2018.10.164. [DOI] [PubMed] [Google Scholar]
- 7.Goldstraw P, Chansky K, Crowley J, et al. The IASLC lung cancer staging project: proposals for revision of the TNM stage groupings in the forthcoming (Eighth) edition of the TNM classification for lung cancer. J Thorac Oncol. 2016;11(1):39–51. doi: 10.1016/j.jtho.2015.09.009. [DOI] [PubMed] [Google Scholar]
- 8.Sepulveda AR, Hamilton SR, Allegra CJ, et al. Molecular biomarkers for the evaluation of colorectal cancer: guideline from the American Society for Clinical Pathology, College of American Pathologists, Association for Molecular Pathology, and the American Society of Clinical Oncology. J Clin Oncol. 2017;35(13):1453–1486. doi: 10.1200/JCO.2016.71.9807. [DOI] [PubMed] [Google Scholar]
- 9.Punt CJ, Koopman M, Vermeulen L. From tumour heterogeneity to advances in precision treatment of colorectal cancer. Nat Rev Clin Oncol. 2017;14(4):235–246. doi: 10.1038/nrclinonc.2016.171. [DOI] [PubMed] [Google Scholar]
- 10.He L, Li H, Wu A, et al. Functions of N6-methyladenosine and its role in cancer. Mol Cancer. 2019;18(1):176. doi: 10.1186/s12943-019-1109-9. [DOI] [PMC free article] [PubMed] [Google Scholar]
- 11.Liu Q, Gregory RI. RNAmod: an integrated system for the annotation of mRNA modifications. Nucleic Acids Res. 2019;47(W1):W548–W555. doi: 10.1093/nar/gkz479. [DOI] [PMC free article] [PubMed] [Google Scholar]
- 12.Liu N, Zhou KI, Parisien M, et al. N6-methyladenosine alters RNA structure to regulate binding of a low-complexity protein. Nucleic Acids Res. 2017;45(10):6051–6063. doi: 10.1093/nar/gkx141. [DOI] [PMC free article] [PubMed] [Google Scholar]
- 13.Zaccara S, Ries RJ, Jaffrey SR. Reading, writing and erasing mRNA methylation. Nat Rev Mol Cell Biol. 2019;20(10):608–624. doi: 10.1038/s41580-019-0168-5. [DOI] [PubMed] [Google Scholar]
- 14.Bai Y, Yang C, Wu R, et al. YTHDF1 Regulates Tumorigenicity and Cancer Stem Cell-Like Activity in Human Colorectal Carcinoma. Front Oncol. 2019;9:332. doi: 10.3389/fonc.2019.00332. [DOI] [PMC free article] [PubMed] [Google Scholar]
- 15.Cheng M, Sheng L, Gao Q, et al. The m(6)A methyltransferase METTL3 promotes bladder cancer progression via AFF4/NF-kappaB/MYC signaling network. Oncogene. 2019;38(19):3667–3680. doi: 10.1038/s41388-019-0683-z. [DOI] [PubMed] [Google Scholar]
- 16.Shi Y, Fan S, Wu M, et al. YTHDF1 links hypoxia adaptation and non-small cell lung cancer progression. Nat Commun. 2019;10(1):4892. doi: 10.1038/s41467-019-12801-6. [DOI] [PMC free article] [PubMed] [Google Scholar]
- 17.Zhang B, Wu Q, Li B, et al. m(6)A regulator-mediated methylation modification patterns and tumor microenvironment infiltration characterization in gastric cancer. Mol Cancer. 2020;19(1):53. doi: 10.1186/s12943-020-01170-0. [DOI] [PMC free article] [PubMed] [Google Scholar]
- 18.Liu J, Ren D, Du Z, et al. m(6)A Demethylase FTO facilitates tumor progression in lung squamous cell carcinoma by regulating MZF1 expression. Biochem Biophys Res Commun. 2018;502(4):456–464. doi: 10.1016/j.bbrc.2018.05.175. [DOI] [PubMed] [Google Scholar]
- 19.Lin S, Choe J, Du P, et al. The m(6)A Methyltransferase METTL3 promotes translation in human cancer cells. Mol Cell. 2016;62(3):335–345. doi: 10.1016/j.molcel.2016.03.021. [DOI] [PMC free article] [PubMed] [Google Scholar]
- 20.Newman AM, Liu CL, Green MR, et al. Robust enumeration of cell subsets from tissue expression profiles. Nat Methods. 2015;12(5):453–457. doi: 10.1038/nmeth.3337. [DOI] [PMC free article] [PubMed] [Google Scholar]
- 21.Liu J, Eckert MA, Harada BT, et al. m(6)A mRNA methylation regulates AKT activity to promote the proliferation and tumorigenicity of endometrial cancer. Nat Cell Biol. 2018;20(9):1074–1083. doi: 10.1038/s41556-018-0174-4. [DOI] [PMC free article] [PubMed] [Google Scholar]
- 22.Zhou X, Han J, Zhen X, et al. Analysis of genetic alteration signatures and prognostic values of m6A regulatory genes in head and neck squamous cell carcinoma. Front Oncol. 2020;10:718. doi: 10.3389/fonc.2020.00718. [DOI] [PMC free article] [PubMed] [Google Scholar]
- 23.Li Z, Weng H, Su R, et al. FTO plays an oncogenic role in acute myeloid leukemia as a N(6)-methyladenosine RNA demethylase. Cancer Cell. 2017;31(1):127–141. doi: 10.1016/j.ccell.2016.11.017. [DOI] [PMC free article] [PubMed] [Google Scholar]
- 24.Zhang C, Zhi WI, Lu H, et al. Hypoxia-inducible factors regulate pluripotency factor expression by ZNF217- and ALKBH5-mediated modulation of RNA methylation in breast cancer cells. Oncotarget. 2016;7(40):64527–64542. doi: 10.18632/oncotarget.11743. [DOI] [PMC free article] [PubMed] [Google Scholar]
- 25.Zhang S, Zhao BS, Zhou A, et al. m(6)A Demethylase ALKBH5 maintains tumorigenicity of glioblastoma stem-like cells by sustaining FOXM1 expression and cell proliferation program. Cancer Cell. 2017;31(4):591–606 e6. doi: 10.1016/j.ccell.2017.02.013. [DOI] [PMC free article] [PubMed] [Google Scholar]
- 26.Wang P, Wang X, Zheng L, et al. Gene signatures and prognostic values of m6A regulators in hepatocellular carcinoma. Front Genet. 2020;11:540186. doi: 10.3389/fgene.2020.540186. [DOI] [PMC free article] [PubMed] [Google Scholar]
- 27.Meng Z, Yuan Q, Zhao J, et al. The m(6)A-related mRNA signature predicts the prognosis of pancreatic cancer patients. Mol Ther Oncolytics. 2020;17:460–470. doi: 10.1016/j.omto.2020.04.011. [DOI] [PMC free article] [PubMed] [Google Scholar]
- 28.Kwok CT, Marshall AD, Rasko JE, et al. Genetic alterations of m(6)A regulators predict poorer survival in acute myeloid leukemia. J Hematol Oncol. 2017;10(1):39. doi: 10.1186/s13045-017-0410-6. [DOI] [PMC free article] [PubMed] [Google Scholar]
- 29.Zhou J, Wang J, Hong B, et al. Gene signatures and prognostic values of m6A regulators in clear cell renal cell carcinoma - a retrospective study using TCGA database. Aging. 2019;11(6):1633–1647. doi: 10.18632/aging.101856. [DOI] [PMC free article] [PubMed] [Google Scholar]
- 30.Meng Y, Li S, Gu D, et al. Genetic variants in m6A modification genes are associated with colorectal cancer risk. Carcinogenesis. 2020;41(1):8–17. doi: 10.1093/carcin/bgz165. [DOI] [PubMed] [Google Scholar]
- 31.Yang N, Ying P, Tian J, et al. Genetic variants in m6A modification genes are associated with esophageal squamous-cell carcinoma in the Chinese population. Carcinogenesis. 2020;41(6):761–768. doi: 10.1093/carcin/bgaa012. [DOI] [PubMed] [Google Scholar]
- 32.Ying P, Li Y, Yang N, et al. Identification of genetic variants in m(6)A modification genes associated with pancreatic cancer risk in the Chinese population. Arch Toxicol. 2021;95(3):1117–1128. doi: 10.1007/s00204-021-02978-5. [DOI] [PubMed] [Google Scholar]
- 33.Liu H, Gu J, Jin Y, et al. Genetic variants in N6-methyladenosine are associated with bladder cancer risk in the Chinese population. Arch Toxicol. 2021;95(1):299–309. doi: 10.1007/s00204-020-02911-2. [DOI] [PubMed] [Google Scholar]
- 34.Si M, Lang J. The roles of metallothioneins in carcinogenesis. J Hematol Oncol. 2018;11(1):107. doi: 10.1186/s13045-018-0645-x. [DOI] [PMC free article] [PubMed] [Google Scholar]
- 35.Takahashi S. Molecular functions of metallothionein and its role in hematological malignancies. J Hematol Oncol. 2012;5:41. doi: 10.1186/1756-8722-5-41. [DOI] [PMC free article] [PubMed] [Google Scholar]
- 36.Ruttkay-Nedecky B, Nejdl L, Gumulec J, et al. The role of metallothionein in oxidative stress. Int J Mol Sci. 2013;14(3):6044–6066. doi: 10.3390/ijms14036044. [DOI] [PMC free article] [PubMed] [Google Scholar]
- 37.Yang X, Doser TA, Fang CX, et al. Metallothionein prolongs survival and antagonizes senescence-associated cardiomyocyte diastolic dysfunction: role of oxidative stress. FASEB J. 2006;20(7):1024–1026. doi: 10.1096/fj.05-5288fje. [DOI] [PubMed] [Google Scholar]
- 38.Krezel A, Maret W. The functions of metamorphic metallothioneins in zinc and copper metabolism. Int J Mol Sci. 2017;18(6). [DOI] [PMC free article] [PubMed]
- 39.Klaassen CD, Liu J, Diwan BA. Metallothionein protection of cadmium toxicity. Toxicol Appl Pharmacol. 2009;238(3):215–220. doi: 10.1016/j.taap.2009.03.026. [DOI] [PMC free article] [PubMed] [Google Scholar]
- 40.Cherian MG, Jayasurya A, Bay BH. Metallothioneins in human tumors and potential roles in carcinogenesis. Mutat Res. 2003;533(1-2):201–209. doi: 10.1016/j.mrfmmm.2003.07.013. [DOI] [PubMed] [Google Scholar]
- 41.Shimoda R, Achanzar WE, Qu W, et al. Metallothionein is a potential negative regulator of apoptosis. Toxicol Sci. 2003;73(2):294–300. doi: 10.1093/toxsci/kfg095. [DOI] [PubMed] [Google Scholar]
- 42.Dutsch-Wicherek M, Sikora J, Tomaszewska R. The possible biological role of metallothionein in apoptosis. Front Biosci. 2008;13:4029–4038. doi: 10.2741/2991. [DOI] [PubMed] [Google Scholar]
- 43.Janssen JW, Imoto I, Inoue J, et al. MYEOV, a gene at 11q13, is coamplified with CCND1, but epigenetically inactivated in a subset of esophageal squamous cell carcinomas. J Hum Genet. 2002;47(9):460–464. doi: 10.1007/s100380200065. [DOI] [PubMed] [Google Scholar]
- 44.Janssen JW, Cuny M, Orsetti B, et al. MYEOV: a candidate gene for DNA amplification events occurring centromeric to CCND1 in breast cancer. Int J Cancer. 2002;102(6):608–614. doi: 10.1002/ijc.10765. [DOI] [PubMed] [Google Scholar]
- 45.Leyden J, Murray D, Moss A, et al. Net1 and Myeov: computationally identified mediators of gastric cancer. Br J Cancer. 2006;94(8):1204–1212. doi: 10.1038/sj.bjc.6603054. [DOI] [PMC free article] [PubMed] [Google Scholar]
- 46.Horie M, Kaczkowski B, Ohshima M, et al. Integrative CAGE and DNA Methylation Profiling Identify Epigenetically Regulated Genes in NSCLC. Mol Cancer Res. 2017;15(10):1354–1365. doi: 10.1158/1541-7786.MCR-17-0191. [DOI] [PubMed] [Google Scholar]
- 47.Ding H, Fan GL, Yi YX, et al. Prognostic implications of immune-related genesʼ (IRGs) signature models in cervical cancer and endometrial cancer. Front Genet. 2020;11:725. doi: 10.3389/fgene.2020.00725. [DOI] [PMC free article] [PubMed] [Google Scholar]
- 48.Zhou H, Zhang C, Li H, et al. A novel risk score system of immune genes associated with prognosis in endometrial cancer. Cancer Cell Int. 2020;20:240. doi: 10.1186/s12935-020-01317-5. [DOI] [PMC free article] [PubMed] [Google Scholar]
- 49.Liu J, Chen X, Jiang Y, et al. Development of an immune gene prognostic classifier for survival prediction and respond to immunocheckpoint inhibitor therapy/chemotherapy in endometrial cancer. Int Immunopharmacol. 2020;86:106735. doi: 10.1016/j.intimp.2020.106735. [DOI] [PubMed] [Google Scholar]
- 50.Coussens LM, Werb Z. Inflammation and cancer. Nature. 2002;420(6917):860–867. doi: 10.1038/nature01322. [DOI] [PMC free article] [PubMed] [Google Scholar]
- 51.Zhang L, Conejo-Garcia JR, Katsaros D, et al. Intratumoral T cells, recurrence, and survival in epithelial ovarian cancer. N Engl J Med. 2003;348(3):203–213. doi: 10.1056/NEJMoa020177. [DOI] [PubMed] [Google Scholar]
- 52.Gentles AJ, Newman AM, Liu CL, et al. The prognostic landscape of genes and infiltrating immune cells across human cancers. Nat Med. 2015;21(8):938–945. doi: 10.1038/nm.3909. [DOI] [PMC free article] [PubMed] [Google Scholar]
- 53.Teramukai S, Kitano T, Kishida Y, et al. Pretreatment neutrophil count as an independent prognostic factor in advanced non-small-cell lung cancer: an analysis of Japan Multinational Trial Organisation LC00-03. Eur J Cancer. 2009;45(11):1950–1958. doi: 10.1016/j.ejca.2009.01.023. [DOI] [PubMed] [Google Scholar]
- 54.Sarraf KM, Belcher E, Raevsky E, et al. Neutrophil/lymphocyte ratio and its association with survival after complete resection in non-small cell lung cancer. J Thorac Cardiovasc Surg. 2009;137(2):425–428. doi: 10.1016/j.jtcvs.2008.05.046. [DOI] [PubMed] [Google Scholar]
Associated Data
This section collects any data citations, data availability statements, or supplementary materials included in this article.
Supplementary Materials
Additional file 1 : Supplement Table 1. 872 m6A related genes compared altered LUSC with unaltered LUSC in TCGA.
Additional file 2 : Supplement Table 2. Results of univariate Cox analysis in TCGA LUSC.
Additional file 3 : Supplementary Table 3. differently expressed genes between LUSC and normal tissues in TCGA dataset.
Data Availability Statement
All data generated and/or analyzed during this study are available from TCGA (https://www.cancer.gov, LUSC project) and a GEO external validation dataset (https://www.ncbi.nlm.nih.gov/, GSE43131).


