Abstract
MFSD2A is a sodium-dependent lysophosphatidylcholine (LPC) symporter responsible for docosahexaenoic acid (DHA) uptake into the brain1,2, which is crucial for brain development and performance3. Its mutations cause microcephaly syndromes4,5. MFSD2A’s ability to transport lipid is also a key mechanism underlying its function as a transcytosis inhibitor to regulate the blood-brain barrier (BBB)6,7. Thus, MFSD2A represents an attractive target for modulating BBB permeability for drug delivery. Herein, we report the cryo-electron microscopy structure of MFSD2A. Our structure defines this important transporter's architecture, reveals its unique extracellular domain, and uncovers the substrate-binding cavity. The structure, together with our functional studies and molecular dynamics simulations, identifies a conserved sodium-binding site, reveals a potential lipid entry pathway, and helps rationalize MFSD2A mutations that underlie microcephaly syndromes. These results shed light on MFSD2A's critical lipid transport function and lay a framework to aid the design of specific modulators for therapeutic purposes.
The blood-brain barrier is indispensable for normal brain function8. Historically, the restricted permeability of the brain vasculature has been attributed to specialized tight junctions between endothelial cells that prohibit passage of water-soluble molecules9,10. Recent evidence shows central nervous system (CNS) endothelial cells also actively inhibit transcytosis to ensure BBB integrity, and full barrier integrity requires restriction of both paracellular and transcellular leakage. A BBB-specific lipid transporter, MFSD2A, is a key inhibitor of transcytosis6,7,11. Mice lacking MFSD2A’s lipid transport function have BBB leakage due to upregulated transcytosis without apparent tight junction disruption6,7,11. Mechanistically, MFSD2A-translocated phospholipids inhibit caveolae vesicle formation, suppressing transcytosis7,12. Thus, MFSD2A is a promising target for manipulating BBB permeability to facilitate CNS drug delivery7.
As a lipid transporter1,2, MFSD2A is unique among mammalian major facilitator superfamily (MFS) members, which typically transport soluble substrates13. Moreover, MFSD2A shares limited sequence similarity to MFS transporters with known structures. The lack of a reliable structural model impedes mechanistic understanding of MFSD2A. For example, it is unclear how MFSD2A mediates lipid transport and how the transport is coupled to sodium.
Here, we report the structure of mouse MFSD2A by single-particle cryo-electron microscopy (cryo-EM). The structure, together with functional characterizations and molecular dynamics (MD) simulations, reveals the transporter’s architecture and provides a blueprint to understand lipid translocation and sodium-dependent transport.
Structural determination.
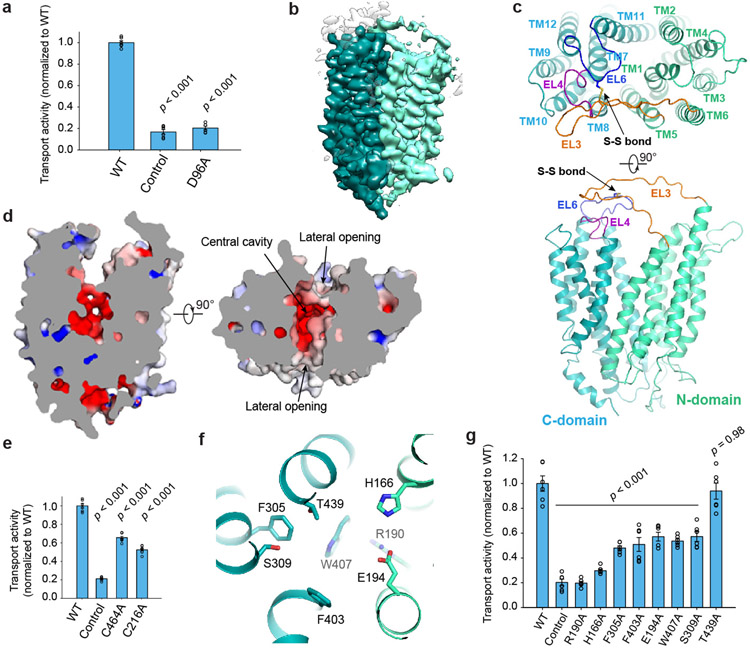
To elucidate the structure and transport mechanism of MFSD2A, we utilized the extensively characterized mouse ortholog6,7,12, which has optimal biochemical properties and shares 84% sequence identity and 90% similarity with human MFSD2A (Extended Data Fig. 1). Cells that overexpress wild-type mouse MFSD2A showed robust TopFluor LPC (known MFSD2A substrate1,2) uptake compared to control cells (Fig. 1a). Substituting D96, a residue critical for transport1, substantially reduced uptake. These results confirm that mouse MFSD2A is an LPC transporter with properties comparable to human MFSD2A.
Figure 1. Overall structure and substrate translocation pathway.
a. Uptake activities of mouse MFSD2A. b. Cryo-EM map of MFSD2A, colored by N- and C-domains. c. MFSD2A architecture. Ribbon representations are viewed from extracellular side (top) and membrane (bottom). N- and C-domains are colored in cyan and green, respectively. d. Slab view of MFSD2A showing partially outward-open conformation, viewed from membrane (left) or extracellular side (right). Surface is colored by electrostatic potential (red, −5 kT e−1; blue, +5 kT e−1). e. Uptake activities for disulfide-breaking mutations. f. Residues lining cavity bottom. Residues are shown as sticks. g. Uptake activity of MFSD2A variants with point mutations at cavity-lining residues. Uptake activities are normalized to that of the WT (mean ± s.e.m., n = 6 biologically independent experiments for MFSD2A variants in a, e, and g). p-values from one-way ANOVA followed by Tukey’s post hoc multiple comparison test are indicated in a, e, and g.
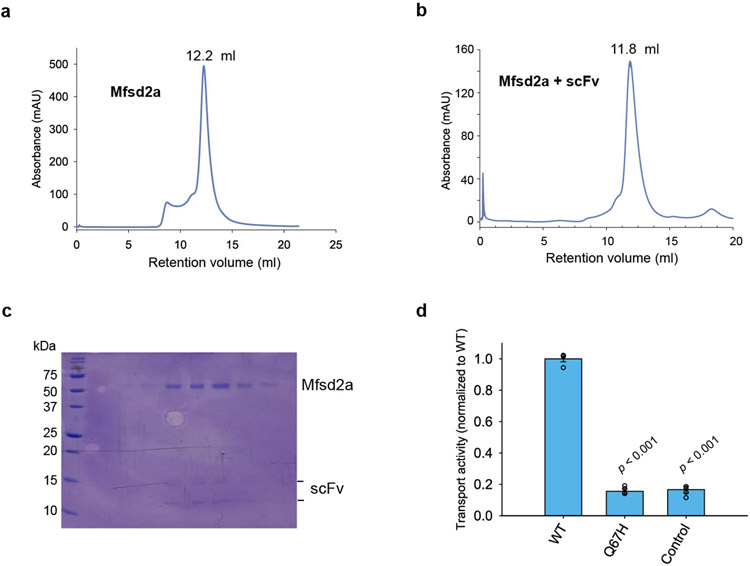
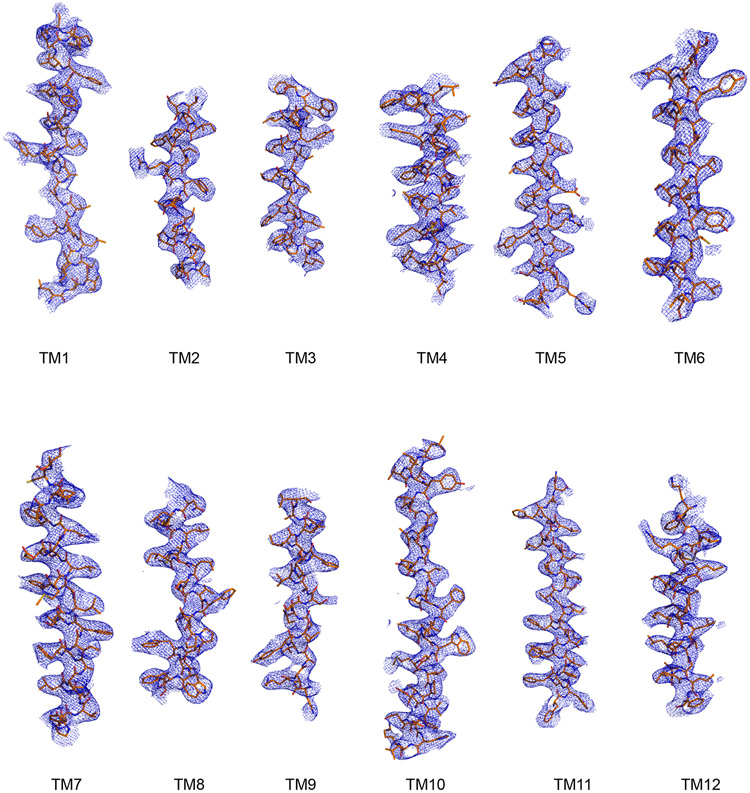
We identified a fortuitous loss-of-function point mutation, Q67H (Extended Data Fig. 2), that presumably arrests the transporter in an outward-facing conformation based on its location near the typical extracellular gate area in MFS. We reasoned this might reduce conformational heterogeneity and selected this variant for structural studies. Since MFSD2A is small (59 kDa) with few features outside the micelle, we used a single-chain variable fragment that binds MFSD2A as a fiducial marker to aid particle alignment. This strategy resulted in a 3.5 Å-resolution map (Fig. 1b; Extended Data Fig. 3), showing clear side-chain densities (Extended Data Fig. 4).
Overall structure.
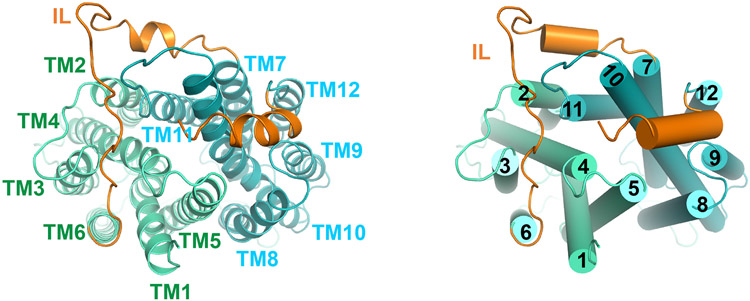
MFSD2A adopts a canonical MFS fold with structurally related N-domain (TM1-6) and C-domain (TM7-12) (Fig. 1c; Extended Data Fig. 5). Our structure captures MFSD2A in an outward-facing conformation with a cavity at the N- and C-domain interface (Fig. 1d). One unique feature of MFSD2A is its extracellular domain, primarily formed by an elongated, ordered loop between TM5 and TM6 (EL3) and a loop between TM11 and TM12 (EL6) (Fig. 1c). EL3 reaches across the N- and C-domain interface and interacts with EL6 and EL4 (between TM7 and TM8). A conserved disulfide bridge forms between C216 on EL3 and C464 on EL6, providing covalent linkage (Fig. 1c). The extracellular domain may potentially constrain relative movement between N- and C-domains. Mutating C216 or C464 to alanine substantially reduced transport (Fig. 1e), suggesting an important role of the extracellular domain stabilized by the disulfide bridge. Intracellularly, the N- and C-domains are connected by a long linker between TM6 and TM7 (Extended Data Fig. 6) that interacts with both domains and might stabilize the outward-open conformation. After the last TM helix, a short helix reaches from the C-domain to the domain interface on the intracellular surface, perhaps stabilizing the intracellular closed conformation. Unlike sugar transporters within the MFS superfamily14, no helical bundle domain forms on MFSD2A's intracellular side.
Translocation pathway.
In the outward-facing conformation, the solvent-accessible cavity, traversing around half of the membrane, is surrounded mainly by TM1, TM2, TM4, TM5, TM7, TM8, TM10, and TM11 (Fig. 1c), which likely form a substrate translocation pathway. The cavity’s bottom half has an overall negative electrostatic surface that becomes more neutral near the cavity’s mouth (Fig. 1d). This electrostatic distribution can accommodate the amphipathic nature of LPC such that its positively charged headgroup settles in the cavity’s base and its hydrophobic tail points to the extracellular side. To assess the functional roles of the residues near the bottom of the cavity, we performed mutagenesis studies (Fig. 1f, g). Majority alanine substitutions either abolished (R190A or H166A) or substantially reduced transport activity (S309A, F403A, W407A, E194A, or F305A) except T439A with little apparent effect. These results indicate important roles of the central pocket residues on both N- and C-domains. Potentially, highly conserved charged residues near the bottom of the cavity, such as H166, might directly interact with LPC’s zwitterionic phosphatidylcholine headgroups.
Lateral entry and lipid-binding site.
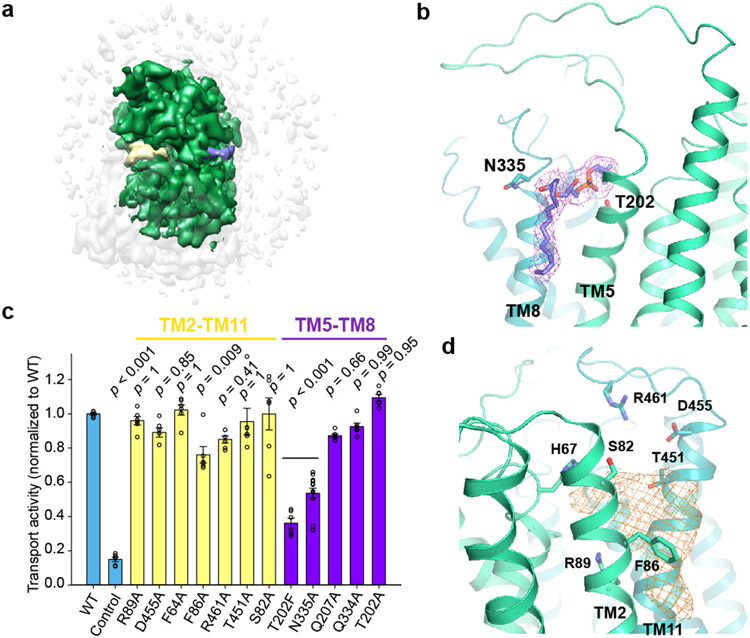
In the extracellular half of the membrane, MFSD2A’s N- and C-domains only loosely interact, leaving lateral “V”-shaped openings to the membrane between TM5 and TM8 on one side and between TM2 and TM11 on the other (Fig. 1d). Extra lipid-like density is wedged in both openings (Fig. 2a, b, d) with the stronger density between TM5 and TM8 (TM5/TM8), indicating more stable interactions. Although the local resolution is insufficient to unambiguously resolve the lipid identity, LPC or LPC-like or -containing molecule can be reasonably placed into the density between TM5 and TM8 (Fig. 2b). In this case, the LPC headgroup points to the cavity's center, and its C-terminal acyl chain extends out, parallel to the TM helices, matching the lipid bilayer environment. The density between TM2 and TM11 (TM2/TM11) shows some flatness features (Fig. 2d); its identity is less clear. We probed the importance of residues constituting the potential lipid-binding sites through mutagenesis (Fig. 2c). N335 on TM8 lies at the entrance of the lateral opening near the kink of the tentatively modelled LPC. Mutating N335 substantially reduced transport, consistent with its potential role in lipid docking. The T202 sidechain on TM5 points towards the lipid density. Mutation to a bulky residue (T202F; but not an alanine) substantially impaired transport, perhaps by sterically hindering lipid binding. In contrast, mutating Q334 on TM8 or Q207 on TM5, whose sidechains point away from the lipid density, only modestly impacted transport. Likewise, mutating residues near the TM2/TM11 lipid density (F64A, S82A, R89A, T451A, F86A, D455A, R461A) had modest or negligible impacts. Thus, the TM5/TM8 lateral opening is likely more functionally important than the TM2/TM11 opening. We propose the TM5/TM8 lateral opening constitutes an LPC binding site en route to the central cavity, facilitating LPC diffusion into/from the membrane. It remains unclear whether the TM2/TM11 lateral opening might also be involved in lipid entry or exit.
Figure 2. Lateral side openings.
a. MFSD2A cryo-EM map. Densities attributed to lipids at lateral openings are colored in yellow and purple, respectively. b. Zoomed-in view of lipid density between TM5 and TM8. Densities attributed to lipid are shown as purple mesh. LPC is tentatively modeled in the density. c. Uptake activities of MFSD2A variants with point mutations in lateral opening regions surrounding lipid density. Uptake activities are normalized to that of the WT (mean ± s.e.m., n = 6 biologically independent experiments except N335A, n = 15 biologically independent experiments). p-values from one-way ANOVA followed by Tukey’s post hoc multiple comparison test are indicated on bar chart. d. Zoomed-in view of lipid density between TM2 and TM11. Densities attributed to lipid are shown as gold mesh.
Sodium-binding site.
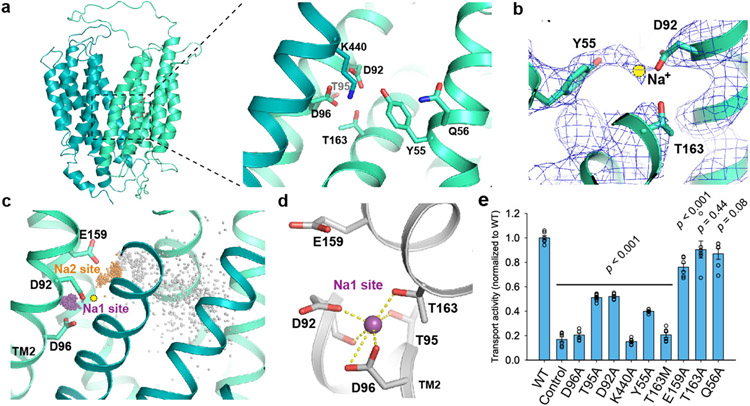
MFSD2A's LPC transport activity depends on sodium1,2. Within the MFS superfamily, the bacterial melibiose transporter MelB is a well-characterized Na+-coupled symporter15,16. Several key residues in MelB’s Na+-binding site are conserved in MFSD2A, whose equivalent region likely also forms a sodium-binding site (Fig. 3a). In particular, side-chain oxygens of D92, D96, T95, and T163 form a pocket well-positioned to coordinate sodium at the center. In this region of the cryo-EM map, extra density above background levels (Fig. 3b) might be compatible with Na+ given 150 mM NaCl in the sample. The resolution is insufficient to assign or place the ion unambiguously, however.
Figure 3. Na+-binding site.
a. Proposed Na+-binding site. Residues in binding site are shown as sticks. b. Density map around proposed Na+-binding site, shown as blue mesh. Proposed position of Na+ is represented as a yellow circle. c. Sodium positions from MD simulations superimposed with the MFSD2A cryo-EM structure. Na+ ions bound at the Na1 site are shown as purple spheres, Na+ bound at the Na2 site as orange spheres (see Methods), and all other Na+ as gray spheres. The initial Na+ position proposed based on the cryo-EM data is shown as a yellow circle. d. Coordination of sodium bound at the Na1 site (purple sphere) in a representative simulation frame. e. Uptake activities of MFSD2A variants with point mutations in Na+-binding sites. Uptake activities are normalized to that of the WT (mean ± s.e.m., n = 6 biologically independent experiments except for T95A, n = 9 biologically independent experiments; WT, D96A and control are the same as in Fig. 1a.). p-values from one-way ANOVA followed by Tukey’s post hoc multiple comparison test are indicated on bar chart.
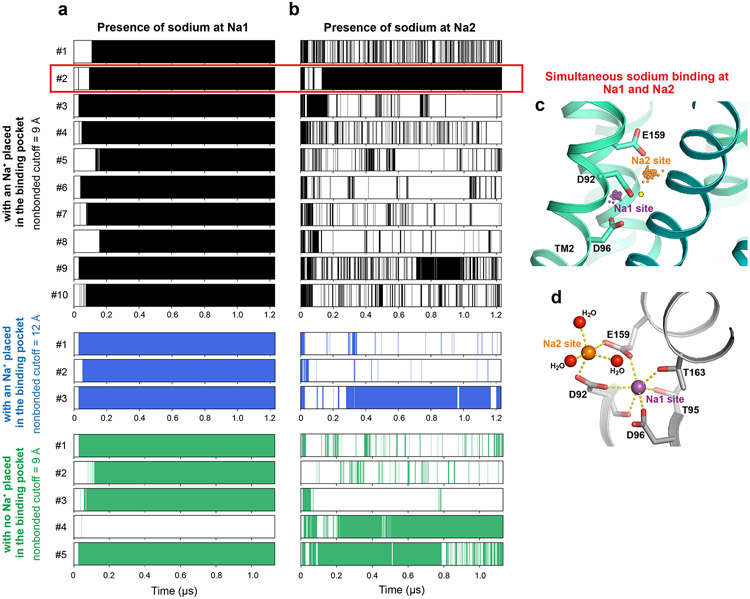
To validate the proposed sodium-binding site and elucidate sodium coordination, we performed all-atom MD simulations of MFSD2A. In all 13 independent simulations (1.2 μs each) with a sodium ion placed in the putative binding pocket, the sodium quickly shifted ~2 Å towards TM2, forming polar interactions with D92, D96, T95, and T163. The sodium remained bound at this location (“Na1”) for the remainder of each simulation (Fig. 3c, d; Extended Data Fig. 7a). In four of five simulations initiated with no sodium present in the proposed binding pocket, a sodium ion from the extracellular solution diffused through the central cavity to spontaneously and stably bind at Na1, with coordination distances and geometry typical of sodium binding17.
In many simulations, a sodium ion also bound at a second site (“Na2”), ~4 Å from Na1, further from TM2 and closer to the extracellular solvent (Fig. 3c; Extended Data Fig. 7b, c, and d). The sodium at Na2 forms salt bridges with D92 and E159, with water molecules providing additional coordination. Sodium ions often bind simultaneously at Na1 and Na2. Because both sites are located beside a large, solvent-exposed cavity, sodium follows various pathways to reach them. After entering the cavity, sodium typically interacts briefly with Y55, Q56, E194, T198, and/or E316—in no particular order—before binding to Na1 or Na2. At Na2, sodium forms only two direct polar interactions with the protein, compared to six at Na1, resulting in weak and transient binding. Thus, we propose that Na1, which shows stable sodium binding, is the key sodium-binding site for the transport cycle.
To probe the functional significance of the Na+-binding sites, we performed mutagenesis studies (Fig. 3e). For Na1, substituting alanine at D96 abolished transport, corroborating previous findings1 and consistent with strong coordination by both oxygens of D96’s carboxylate group for Na+ at Na1. Mutating D92 or T95 also substantially impaired uptake, consistent with roles in coordinating Na+. Substituting alanine for T163 had little effect, while substituting a longer side chain (methionine) that potentially interferes with Na+ binding abolished uptake. In control experiments, mutating Q56 (central-cavity facing) had little effect. Together, these results suggest Na1 is functionally important and corroborate several critical residues found in human MFSD2A2. For Na2, mutating E159 only modestly affected activity. Thus, Na2 likely is not involved directly in coupled transport of Na+ and lipid. Sequence conservation analysis of MFSD2A and its close relative MFSD2B—a Na+-independent sphingosine 1-phosphate transporter18,19—revealed D92 is conserved in MFSD2A but is substituted by glycine in MFSD2B, consistent with the differing Na+ requirements. Notably, K440 is next to Na1, where it forms electrostatic interactions with D96 and D92, stabilizing closely spaced carboxylate groups and thus helping to uphold Na1. Mutating K440 abolished transport (Fig. 3e). Likewise, mutating Y55 substantially reduced uptake. Y55 is within distance to interact with K440, which might further stabilize Na1. Importantly, in a previous knock-in mouse study, D96A mutation abolished MFSD2A’s lipid transport and caused BBB leakage7, recapitulating the MFSD2A knockout phenotype. This highlights the functional importance of the sodium-binding site and corroborates the link between MFSD2A transport and BBB permeability.
Disease-causing mutations.
Multiple loss-of-function mutations of MFSD2A underlie lethal or progressive microcephaly syndromes4,5,20-23. For instance, T159M or S166L mutations (T163M and S170L in mouse) underlie a lethal microcephaly syndrome4,20. Our structure reveals that T163 is part of Na1. Its mutation to methionine thus likely disrupts Na+ binding and impedes transport (Figure 3d, e). S170 is below the cavity’s base at the N- and C- domain interface (Extended Data Fig. 8a), forms a hydrogen bond with R190, and closely contacts W407. S170 contributes to formation of the central binding pocket and possibly intracellular gate closing. As expected, S170L mutation reduced uptake close to background levels (Extended Data Fig. 8c). A third mutation, S339L (S343L in mouse)5, may affect TM8’s helical bend (Extended Data Fig. 8b), thereby affecting conformational transitions. The S343L mutation substantially reduced activity (Extended Data Fig. 8c), consistent with decreased LPC uptake in patients5. A fourth mutation, T198M (T202M in mouse)20,21 may interfere with substrate entry, as T202 lines the TM5/TM8 lateral opening (Fig. 2b). The T202M mutation indeed impaired transport. Several mutations likely affect protein structure or folding. Three proline point mutations (P402H, P493L, P164T, i.e., mouse P406H, P497L, P168T) are linked to microcephaly20,22,23. Given proline’s unique properties, these mutations likely cause conformational changes or destabilize the structure. Additionally, an R326H/V250F double-mutation (R330H/A254F in mouse) underlies microcephaly20. Given A254F but not R330H affected uptake (Extended Data Fig. 8c), the A254F mutation is likely responsible. Mutating A254 to a bulky residue presumably interferes with the packing interaction between TM3 and TM6, affecting structural stability or folding. These results corroborate that our mouse MFSD2A structure provides a faithful model for interpreting function and disease-causing mutations of human MFSD2A.
Discussion.
MFS transporters are thought to operate by a rocker-switch model24. Following a similar mechanism, opening or closing of MFSD2A’s lateral openings is expected to accompany opening or closing of the central cavity to the solution as the N- and C-domains rock during the transport cycle. For a Na+-coupled transporter, a central question is how Na+ is coupled to transport. Our structural analyses, MD simulations, and functional studies revealed a stable and functionally important Na+-binding site (Na1) at a strategic position right around TM2’s helical kink, which is encompassed by Na+-binding residues D92 and D96. As TM2's kink gives rise to the “V”-shaped lateral opening between TM2 and TM11, Na+ binding might be linked directly to its opening or closing, thus coupling Na+ to the state transition between outward- and inward-open conformations. Additionally, the interaction between C-domain K440 and the N-domain D92 and D96 stabilizes the Na+-binding site. This also potentially links Na+ binding and conformational state transition that involves relative rocking between N- and C-domains. Moreover, the Na+-binding sites are near the central cavity’s base, where the LPC headgroup presumably binds. Thus, binding of LPC or sodium might induce local conformational changes, impacting binding of the other substrate and yielding transport coupling.
The structure of MFSD2A represents the first for a eukaryotic lipid transporter within the MFS superfamily13. Compared with most known MFS transporters, whose soluble substrates diffuse directly into the cavity, it remained unknown how lipids enter and leave MFSD2A. Our structure suggests a possible two-step mechanism: After the lipid diffuses laterally from the membrane to MFSD2A, it docks onto the lipid-binding site at the lateral entry and then moves into the central cavity. We observed lateral openings on both sides of MFSD2A, at the N- and C-domain interface. The TM5/TM8 opening is more likely the LPC entrance in an outward-facing conformation: lipid density there matches reasonably with an LPC-like molecule, the density is relatively strong, and the surrounding residues are functionally important. In an inward-facing conformation, a simple scenario would be that the lateral opening on the same side also serves as the LPC entrance. This would potentially allow the LPC tail to remain in the lipid bilayer without being fully buried in the pocket during transport, helping explain how LPCs with relatively long tails can be transported1,2. The detailed mechanisms await future investigation. Interestingly, many other MFS transporters, such as GLUT3 (also in an outward-facing conformation)25, have central cavities that are better shielded from the membrane. This might reflect their different needs for substrate entry. The proposed lateral entry of lipids in MFSD2A shows interesting parallels to other lipid transporters, such as ABC lipid transporters26, P4 ATPase27, and RND transporters28. This shared feature across structurally unrelated lipid transporter families may represent an optimal solution to overcome the high energy cost associated with moving lipids out of the membrane.
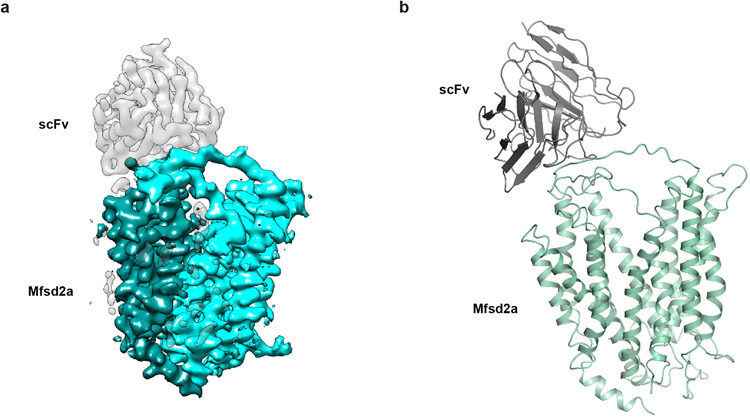
A major hurdle in developing therapeutics for CNS disorders is the limited permeability of most drug molecules across the BBB29,30. Given the critical role of MFSD2A’s lipid transport function in suppressing transcytosis thus ensuring the BBB’s restrictive permeability, inhibiting MFSD2A represents an attractive strategy for CNS drug delivery. In fact, mice lacking MFSD2A activity exhibit leakage of diverse molecules, including IgG6,7,11. Our structure of MFSD2A in an outward-facing conformation provides a blueprint for structure-based discovery of MFSD2A inhibitors. In addition, biologics, such as an extracellular surface binder against MFSD2A (Extended Data Fig. 9), have the potential to inhibit transport by impeding conformational transitions during the transport cycle.
METHODS
Protein expression, purification and sample preparation.
Mus musculus MFSD2A with a point mutation (Q67H) was cloned into a modified BacMam expression vector31 with an N-terminal GFP-his tag and a 3C protease cleavage site. The baculovirus was generated using sf9 insect cells (Expression Systems #94-001S; no further authentications or mycoplasma contamination tests were performed for this study) following the published protocol (Invitrogen LifeTechnologies). Recombinant protein was expressed in HEK293S cells (ATCC #CRL-3022; no further authentications or mycoplasma contamination tests were performed for this study) grown in 293 Freestyle medium (LifeTechnologies) supplemented with 2% FBS. Cells were infected with baculovirus at a density of 2.5 * 106 cells per ml. After 12 hours’ incubation at 37°C, 10 mM sodium butyrate was added to the culture, and the cells were moved to 30°C for an additional 48 hours before harvesting. All protein purification steps were carried out at 4°C unless specifically noted otherwise. Initially, the cell pellet was re-suspended in buffer containing 20 mM Tris-HCl pH 8.0 with the addition of a cocktail of protease inhibitors and DNase I, followed by a 30-minute incubation. The sample was then centrifuged at 18,000g for 20 minutes. The crude membrane was homogenized by using either a glass Dounce tissue homogenizer or brief sonication in buffer A (20 mM Tris-HCl pH 8.0, 150 mM NaCl) supplemented with 2 mg/mL iodoacetamide, a cocktail of protease inhibitors and DNase I. The sample was incubated for 30 minutes prior to adding 1% lauryl maltose neopentyl glycol (LMNG, Anatrace) and 0.1% cholesteryl hemisuccinate (CHS, Anatrace). After an additional 2-hour incubation, the sample was centrifuged at 18,000g for 45 minutes. The supernatant was incubated with cobalt resin for 1 hour. The resin was washed with buffer A + 0.01%LMNG-0.001%CHS. The GFP-his tag was removed from MFSD2A by overnight digestion with 3C protease. The sample was further purified by gel filtration (Superdex 200 increase, GE Healthcare) in buffer A plus 0.001% (w/v) LMNG-0.00033% (w/v) glyco-diosgenin (GDN, Anatrace)-0.00013% (w/v) CHS. The peak fraction was pooled and concentrated.
Anti-MFSD2A scFv was generated as extracellular binders for MFSD2A. ScFv was isolated by phage display from chickens immunized with virus-like particles (Lipoparticles)32 that contain mouse MFSD2A (Integral Molecular Inc). The animal work was approved by Harvard University and followed the relevant ethical regulations. ScFv was recombinantly expressed as a scFv-Fc fusion protein with a human Fc and purified by protein-A chromatography. The scFv fragment was generated by papain cleavage and the scFv fragment was purified by ion-exchange chromatography using a HiTrap Q HP anion exchange column (GE Healthcare). Purified mouse MFSD2A was mixed with the scFv at a 1:1 (w/w) ratio and incubated for 4 hours at 4°C. The complex was further purified by gel filtration (Superdex 200 increase, GE Healthcare) equilibrated in buffer A plus 0.001% (w/v) LMNG-0.00033% (w/v) GDN-0.00013% (w/v) CHS. The peak fraction was concentrated to 4 mg/ml for cryoEM studies.
Electron microscopy sample preparation and data collection.
For cryo-EM, 3 μl of the purified complex was applied to glow discharged 300 mesh Quantifoil R2/1 holey carbon grids and blotted for 2.0 s at 96% humidity on a Leica EM GP2 before being plunge frozen in liquid ethane cooled by liquid nitrogen. Grids were imaged on a Titan Krios operated at 300 kV using a slit width of 20 eV on a GIF-Quantum Energy Filter. Images were collected on a K3 Summit detector (Gatan) in super-resolution counting mode at a magnification of 105,000×, corresponding to a physical pixel size of 0.86 Å. Serial EM33 was used for data collection with a set of customized scripts enabling automated low-dose image acquisition. Data were collected using image shift to collect one image per hole by Multiple Record method (3 x 3 set of holes/stage movement).
Cryo-EM data processing
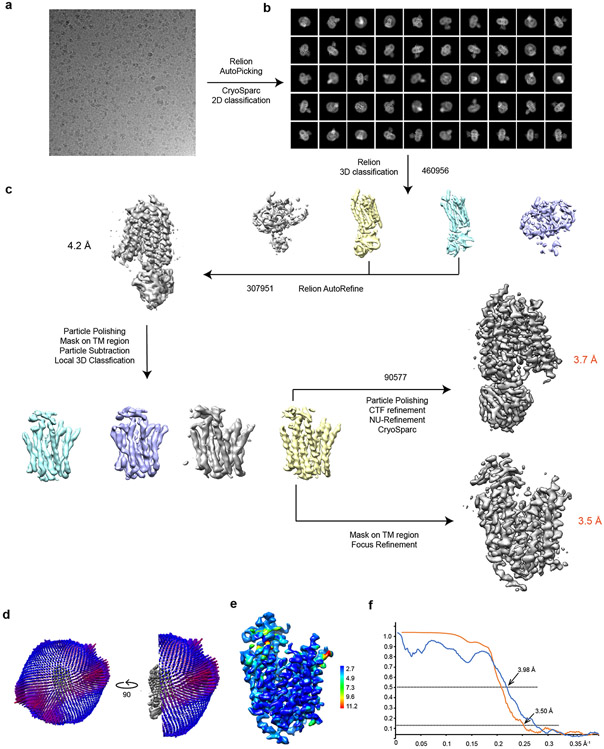
A total 8,669 movies were collected and subjected to beam-induced motion correction using the program MotionCor234. A dose-weighted sum of all frames from each movie was used for all image processing steps. Contrast transfer function (CTF) parameters were estimated by Gctf35. Automated particle picking was first performed using cisTEM 1.0.0 Beta36 using 500 images; the picked particles were extracted with box size of 232 pixels and subjected to 2D classification in cisTEM. The good classes, representing projections in different orientations, were selected and imported to Relion3.0-Beta-237 as templates for auto picking. All the picked particles were extracted with box size 232 pixels with original pixel size 0.86 Å in Relion and imported to CryoSparc (v2.13.2)38 for further 2D classification. Rounds of 2D classifications yielded 460,956 particle images with clear features. With these particles, an initial 3D model was built by CryoSparc ab initio reconstruction without symmetry. The particles along with the initial model, which is imported as 3D template, were transferred back to Relion and subjected to 3D classification using k=4 and tau fudge (T) value 4. The two most populated classes with good features for the MFSD2A region contained 307,951 particles after two rounds of classifications, with T=20 in the second round. The Relion Auto-Refine of these particles resulted in a 4.2 Å map without symmetry. To improve the map quality, local 3D classification focused on the MFSD2A region was performed. The signal of multiple domains—except MFSD2A—was subtracted from the particles with a mask covering the whole complex. The modified particle set was subjected to further local 3D classification without alignment using a mask around MFSD2A and k=4, T=40. After classification, the class with the best features of MFSD2A was selected. The corresponding 90,577 particles were subjected to Bayesian Polishing and per particle CTF refinement, then imported back to CryoSparc for final Refinement. NU-Refinement of CryoSparc yielded an improved map for the whole complex with nominal resolution of 3.7 Å. By applying a mask on the transporter only, the MFSD2A domain was further refined to 3.5 Å in Relion, local resolution estimated by SAMUEL39. All refinements followed the gold-standard procedure, in which two half-datasets are refined independently. The overall resolutions were estimated based on the gold-standard Fourier shell correlation (FSC) = 0.143 criterion. The number of particles in each dataset and other details related to data processing are summarized in Extended Data Table 1.
Model building and refinement
The model was built into a 3.5 Å cryo-EM map using the Na+/melibiose symporter MelB (PDB 4M64) as template. Local parts were manually built in Coot40. The models were refined using Phenix real space refine41 and the geometry of the models was evaluated by Molprobity42. All the figures were prepared in PyMol (Schrödinger)43 or UCSF Chimera44.
Lysophosphotidylcholine uptake assays.
MFSD2A WT and variants were cloned into pmCherry-N1 vector (ClonTech) with an mCherry fused at the C-terminus. Plasmids were transfected into HEK293S cells (ATCC, CRL-3022) (seeded from the suspension culture) using Lipofectamine 3000 (Invitrogen) according to the manufacturer’s directions. Cells grown in 12-well plates were maintained in 293 Freestyle medium (LifeTechnologies) supplemented with 10% FBS in an incubator at 37°C and 8% CO2. The medium was replaced 24 hours post-transfection with 293 Freestyle Medium supplemented with 10% FBS and 10 mM sodium butyrate, and cells were incubated for an additional 24 hours. MFSD2A transport activity was assayed by measuring TopFluor LPC (Avanti) uptake in HEK293S cells. The cells were washed first with serum-free 293 Freestyle Medium and incubated in 293 Freestyle Medium supplemented with 10% FBS, 150 mM NaCl, and 1 μM TopFluor LPC at 37°C for 30 minutes. The cells were washed twice with ice-cold PBS, resuspended in ice-cold PBS, and passed through a 35 μm cell strainer. The cells expressing MFSD2A WT or variants in a set of experiments were gated in the same range based on the mCherry level using the FL-3 channel of a BD Accuri C6 flow cytometer (Supplementary Fig. 1). The mean fluorescence of cells corresponding to TopFluor LPC level was quantified using the FL-1 channel. A one-way analysis of variance (ANOVA) test followed by Tukey’s post hoc multiple comparison test was used to calculate statistical differences using Minitab Statistical Software45 between wild-type MFSD2A and mutant transport activities. p-values are indicated in the bar charts.
Conservation analysis of mouse MFSD2A structure.
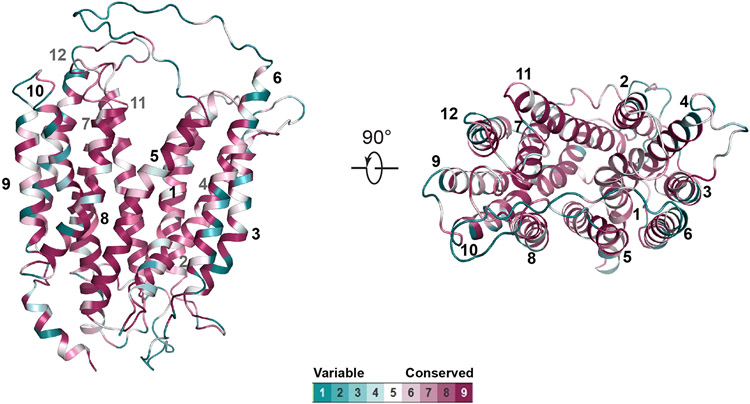
A multiple sequence alignment was performed with a cut-off of minimally 50% identity and maximally 90% identity to mouse MFSD2A using the UniRef database on the ConSurf web server46,47. The conservation scores were generated and colored using a PyMOL script generated by the ConSurf web server.
System setup for molecular dynamics simulations
We performed simulations of MFSD2A without scFv in a hydrated lipid bilayer. We performed simulations under three conditions: (1) simulations with a sodium ion initially placed in the binding pocket at a position proposed on the basis of the potential coordination environment and the cryo-EM density map, with a nonbonded interaction cutoff of 9 Å (10 independent simulations, 1.2 μs each), (2) simulations with a sodium ion initially placed in the binding pocket at a position proposed on the basis of the potential coordination environment and the cryo-EM density map, with a nonbonded interaction cutoff of 12 Å (3 independent simulations, 1.2 μs each), (3) simulations with no sodium ions initially placed in the binding pocket, with a nonbonded interaction cutoff of 9 Å (5 independent simulations, 1.1 μs each). We observed no substantial differences in simulation behavior between the first two conditions. For all simulation conditions, the protein structure was aligned on the Orientations of Proteins in Membranes48 entry for 6S7V49 (MFS superfamily member LtaA) using PyMOL (Schrödinger)43. Prime (Schrödinger)50 was used to model missing side chains, and to add capping groups to protein chain termini. Protonation states of all titratable residues were assigned at pH 7. Histidine residues were modeled as neutral, with a hydrogen atom bound to either the delta or epsilon nitrogen depending on which tautomeric state optimized the local hydrogen-bonding network. Dowser51 was used to add water molecules to protein cavities. Using Dabble52, the prepared protein structures were inserted into a pre-equilibrated palmitoyl-oleoyl-phosphatidylcholine (POPC) bilayer, the system was solvated, and sodium and chloride ions were added to neutralize the system and to obtain a final concentration of 150 mM. Final systems comprised approximately 90,000 atoms and system dimensions were approximately 120 x 120 x 100 Å. For each simulation, initial atom velocities were assigned randomly and independently.
Molecular dynamics simulation and analysis protocols
We used the CHARMM36m force field for proteins, the CHARMM36 force field for lipids and ions, and the TIP3P model for water53-55. All simulations were performed using the Compute Unified Device Architecture (CUDA) version of particle-mesh Ewald molecular dynamics (PMEMD) in AMBER1856 on graphics processing units (GPUs).
Systems were first minimized using three rounds of minimization, each consisting of 500 cycles of steepest descent followed by 500 cycles of conjugate gradient optimization. Harmonic restraints of 10.0 and 5.0 kcal·mol−1·Å−2 were applied to protein and lipids for the first and second rounds of minimization, respectively. Harmonic restraints of 1.0 kcal·mol−1·Å−2 were applied to protein for the third round of minimization. Systems were then heated from 0 K to 100 K in the NVT ensemble over 12.5 ps and then from 100 K to 310 K in the NPT ensemble over 125 ps, using 10.0 kcal·mol−1·Å−2 harmonic restraints applied to protein heavy atoms. Subsequently, systems were equilibrated at 310 K and 1.0 bar in the NPT ensemble, with harmonic restraints on the protein non-hydrogen atoms tapered off by 1.0 kcal·mol−1·Å−2 starting at 5.0 kcal·mol−1·Å−2 in a stepwise fashion every 2.0 ns for 10.0 ns, and then by 0.1 kcal·mol−1·Å−2 every 2.0 ns for 20.0 ns. Production simulations were performed without restraints at 310 K and 1.0 bar in the NPT ensemble using the Monte Carlo barostat, the Langevin thermostat with a collision frequency of 1.0 ps−1, and a timestep of 4.0 fs with hydrogen mass repartitioning57. Bond lengths to hydrogen were constrained using the SHAKE algorithm58. Non-bonded interactions were cut off at either 9.0 or 12.0 Å (see “System setup for molecular dynamics simulations” section), and long-range electrostatic interactions were calculated using the particle-mesh Ewald (PME) method with an Ewald coefficient of approximately 0.31 Å, and 4th order B-splines. The PME grid size was chosen such that the width of a grid cell was approximately 1 Å. Trajectory frames were saved every 200 ps during the production simulations.
The AmberTools17 CPPTRAJ package was used to reimage trajectories59. Simulations were visualized and analyzed using Visual Molecular Dynamics (VMD)60 and PyMOL (Schrödinger)43. In Fig. 3c, the first 0.1 μs of the production phase of each simulation of condition (1) was discarded (as well as the equilibration phase), and trajectories were aligned on the backbone atoms of the MFSD2A cryo-EM structure Na+-binding site residues D92, T95, D96, E159, T163, and K440. The positions of Na+ ions were recorded every 10 ns for each of the 10 simulations. Each Na+ ion position was then drawn as a point superimposed on the starting MFSD2A structure. A sodium ion at a distance of 2–5 Å from the T95 side chain oxygen forming a salt bridge with D92 and/or D96 was considered to be present at the Na1 site. A sodium ion at a distance of 5–8 Å from the T95 side chain oxygen forming a salt bridge with D92 and/or E159 was considered to be present at the Na2 site. A salt bridge was considered to be formed if the sodium ion was within 3.5 Å of either side-chain oxygen atoms of an aspartate or glutamate residue. In Extended Data Fig. 7c, the same analysis was repeated taking into consideration only simulation #2 of condition (1), where both sodium ions were bound simultaneously. In Extended Data Fig. 7a and 7b, the equilibration and the production phases are both plotted for each simulation. The same criteria as explained above for Fig. 3c are used to identify sodium ions present at the Na1 and Na2 sites.
Extended Data
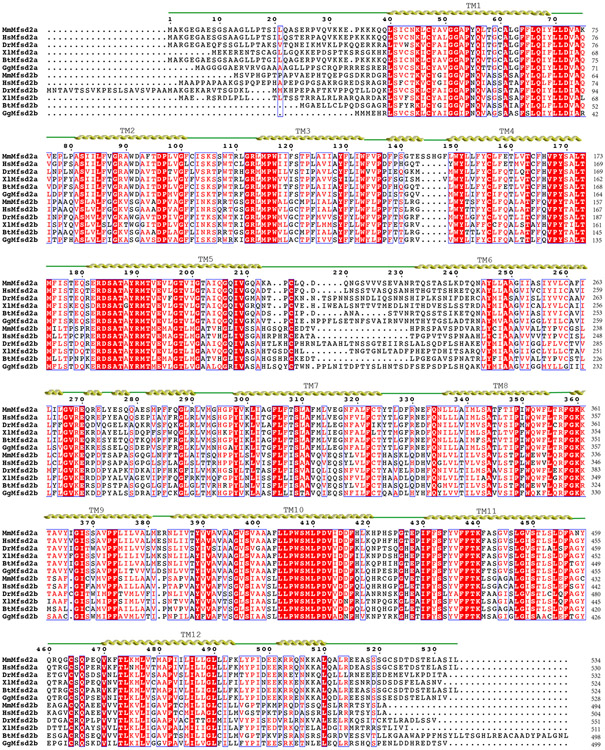
Extended Data Figure 1. Sequence alignment of MFSD2A and MFSD2B homologs.
Sequence alignment of MFSD2A and MFSD2B from Mus musculus (Mm), Homo sapiens (Hs), Danio rerio (Dr), Xenopus laevis (Xl), Bos taurus (Bt), and Gallus gallus (Gg) are shown.
Extended Data Figure 2. Biochemical and functional characterizations of MFSD2A.
a. Size-exclusion chromatography profile of MFSD2A. b. Size-exclusion chromatography profile of MFSD2A in complex with scFv. c. Representative SDS-PAGE gel of purified MFSD2A-scFv complex. This was carried out four times in independent experiments. d. Uptake activity of Q67H used for structural studies. Uptake activity was normalized to that of the WT (mean ± s.e.m., n = 4 biologically independent experiments). p-values from one-way ANOVA followed by Tukey’s post hoc multiple comparison test are indicated on bar chart.
Extended Data Figure 3. Single-particle cryo-EM analysis of MFSD2A.
a. Representative cryo-EM image of MFSD2A. b. 2D class averages of MFSD2A in CryoSparc c. The workflow of classification and refinement. d. Angle distributions of the particles for the final reconstruction. e. Local resolution of the MFSD2A map calculated by MonoRes61. f. Fourier shell correlation (FSC) of the final reconstruction as a function of resolution. Orange: gold-standard FSC curve between two half maps from masked MFSD2A, with indicated resolution at FSC=0.143; Blue: FSC curve between the final atomic model and the local map masked on MFSD2A only, with indicated resolution FSC=0.5. FSC calculation performed by SAMUEL (SAM script)39.
Extended Data Figure 4. Representative cryo-EM density maps of MFSD2A transmembrane-helices.
EM map density for 12 transmembrane helices of MFSD2A.
Extended Data Figure 5. Conservation analysis of mouse MFSD2A structure.
Residues are colored from variable to conserved according to the palette below the structure.
Extended Data Figure 6. Intracellular elements of MFSD2A.
Ribbon representation (left) and cylindrical representation (right) of MFSD2A viewed from the intracellular side. N- and C-domains are colored cyan and green, respectively. IL = intracellular linker, orange. The helix after the last transmembrane helix is also colored in orange.
Extended Data Figure 7. Sodium binding sites in molecular dynamics simulations.
a. Shaded regions (black, blue, and green) indicate points in time during each simulation when a sodium ion was present at the Na1 site—in particular, points at which a sodium ion at a distance of 2–5 Å from the T95 side chain oxygen formed a salt bridge with D92 and/or D96. b. Shaded regions indicate points in time during each simulation when a sodium ion was present at the Na2 site—in particular, points at which a sodium ion at a distance of 5–8 Å from the T95 side chain oxygen formed a salt bridge with D92 and/or E159. Both panels a and b show data for simulations under three conditions. In the first two conditions (black and blue), a sodium ion is initially placed in the binding pocket at a position suggested by the potential coordination environment and the cryo-EM density, whereas in the third (black), no sodium ions are initially placed in the binding pocket. The first and third conditions (black and green) used a 9 Å nonbonded interaction cutoff, whereas the second (blue) used a 12 Å cutoff. Plots include equilibration as well as production phases of each simulation. c. Sodium positions from simulation #2 of the first condition (highlighted by red box), where sodium ions bind simultaneously at the Na1 and Na2 sites. Positions of sodium bound at the Na1 site are shown as purple spheres, and positions of sodium bound at the Na2 site are shown as orange spheres (see Methods). In this simulation, a Na+ ion was initially placed at a position proposed on the basis of the potential coordination environment and the cryo-EM density map, shown as a yellow circle. d. Sodium binding sites in a representative frame from the same simulation. Sodium-coordinating residues are shown as sticks. Sodium bound at the Na1 site is shown as a purple sphere and sodium bound at the Na2 site is shown as an orange sphere. Oxygen atoms of water molecules are shown as red spheres.
Extended Data Figure 8. Structural mapping of disease-causing mutations.
a. Close-up view of S170. S170 and R190 (sticks) are within hydrogen-bond distance. b. Zoomed-in view of S343, near the helical bend of TM8 that gives rise to lateral opening. c. Uptake activities of mouse MFSD2A variants with equivalent point mutations to human microcephaly-associated mutations. Uptake activities are normalized to that of the WT (mean ± s.e.m., n = 6 biologically independent experiments). p-values from one-way ANOVA followed by Tukey’s post hoc multiple comparison test are indicated on bar chart.
Extended Data Figure 9. Structure of MFSD2A in complex with scFv.
a. The cryo-EM map of the MFSD2A-scFv complex. b. The ribbon representations of the MFSD2A-scFv complex. A model scFv was docked into the density.
Extended Data Table 1.
Cryo-EM data collection, refinement and validation statistics.
| MFSd2a (EMDB-24252) (PDB 7N98) |
|
|---|---|
| Data collection and processing | |
| Magnification | 105,000 |
| Voltage (kV) | 300 |
| Electron exposure (e-/Å2) | 53 |
| Defocus range (μm) | 1.2-2.5 |
| Pixel size (Å) | 0.86 |
| Symmetry imposed | CI |
| Initial particle images (no.) | 2,471,140 |
| Final particle images (no.) | 90,577 |
| Map resolution (Å) | 3.50 |
| FSC threshold | 0.143 |
| Map resolution range (Å) | 11.0-2.7 |
| Refinement | |
| Initial model used (PDB code) | 4M64 |
| Model resolution (Å) | 3.98 |
| FSC threshold | 0.5 |
| Model resolution range (Å) | 200-3.35 |
| Map sharpening B factor (Å2) | −184 |
| Model composition | |
| Non-hydrogen atoms | 3626 |
| Protein residues | 473 |
| Ligands | 0 |
| B factors (Å2) | |
| Protein | 139.58 |
| Ligand | - |
| R.m.s. deviations | |
| Bond lengths (Å) | 0.004 |
| Bond angles (°) | 0.716 |
| Validation | |
| MolProbity score | 2.08 |
| Clashscore | 11.62 |
| Poor rotamcrs (%) | 0.27 |
| Ramachandran plot | |
| Favored (%) | 91.5 |
| Allowed (%) | 8.5 |
| Disallowed (%) | 0 |
Supplementary Material
Acknowledgements.
We thank L. Montabana and D-H. Chen at Stanford-SLAC Cryo-EM facilities for help with EM data collection. This work was made possible by support from Stanford University, the Harold and Leila Y. Mathers Charitable Foundation and NIA DP2AG052940 to L.F., a Dean’s fellowship to J.Z., the EMBO Long-Term Fellowship ALTF 544-2019 to D.A., an EMBO long-term fellowship to U.H.L., the NIH DP1 NS092473 Pioneer Award, the NIH/NINDS R35NS116820 grant, the Blavatnik Biomedical Accelerator grant and the QFASTR grant from Harvard Medical School to C.G.. The research of C.G. was also supported in part by a Faculty Scholar grant from the Howard Hughes Medical Institute.
Footnotes
Competing interests: The authors declare no competing interests.
Supplementary information is available for this paper.
Data availability
The cryoEM map has been deposited into the Electron Microscopy Data Bank (accession number EMD-24252). The coordinates have been deposited into the Protein Data Bank (accession number 7N98). Any other relevant data are available from the corresponding author upon reasonable request.
REFERENCES
- 1.Nguyen LN et al. Mfsd2a is a transporter for the essential omega-3 fatty acid docosahexaenoic acid. Nature 509, 503–506 (2014). [DOI] [PubMed] [Google Scholar]
- 2.Quek DQ, Nguyen LN, Fan H & Silver DL Structural Insights into the Transport Mechanism of the Human Sodium-dependent Lysophosphatidylcholine Transporter MFSD2A. J. Biol. Chem 291, 9383–9394 (2016). [DOI] [PMC free article] [PubMed] [Google Scholar]
- 3.Yeo L. A. H. a. Y. K. Health beneficts of docosahexaenoic acid (DHA). Pharmacol. Res 40, 211–225 (1999). [DOI] [PubMed] [Google Scholar]
- 4.Guemez-Gamboa A et al. Inactivating mutations in MFSD2A, required for omega-3 fatty acid transport in brain, cause a lethal microcephaly syndrome. Nat. Genet 47, 809–813 (2015). [DOI] [PMC free article] [PubMed] [Google Scholar]
- 5.Alakbarzade V et al. A partially inactivating mutation in the sodium-dependent lysophosphatidylcholine transporter MFSD2A causes a non-lethal microcephaly syndrome. Nat. Genet 47, 814–817 (2015). [DOI] [PubMed] [Google Scholar]
- 6.Ben-Zvi A et al. Mfsd2a is critical for the formation and function of the blood-brain barrier. Nature 509, 507–511 (2014). [DOI] [PMC free article] [PubMed] [Google Scholar]
- 7.Andreone BJ et al. Blood-Brain Barrier Permeability Is Regulated by Lipid Transport-Dependent Suppression of Caveolae-Mediated Transcytosis. Neuron 94, 581–594 e585 (2017). [DOI] [PMC free article] [PubMed] [Google Scholar]
- 8.Andreone BJ, Lacoste B & Gu C Neuronal and vascular interactions. Annu. Rev. Neurosci 38, 25–46 (2015). [DOI] [PMC free article] [PubMed] [Google Scholar]
- 9.Reese TS & Karnovsky MJ Fine structural localization of a blood-brain barrier to exogenous peroxidase. J. Cell. Biol 34, 207–217 (1967). [DOI] [PMC free article] [PubMed] [Google Scholar]
- 10.Brightman MW & Reese TS Junctions between intimately apposed cell membranes in the vertebrate brain. J. Cell Biol 40, 648–677 (1969). [DOI] [PMC free article] [PubMed] [Google Scholar]
- 11.Chow BW & Gu C Gradual Suppression of Transcytosis Governs Functional Blood-Retinal Barrier Formation. Neuron 93, 1325–1333 e1323 (2017). [DOI] [PMC free article] [PubMed] [Google Scholar]
- 12.Yang YR et al. Mfsd2a (Major Facilitator Superfamily Domain Containing 2a) Attenuates Intracerebral Hemorrhage-Induced Blood-Brain Barrier Disruption by Inhibiting Vesicular Transcytosis. J. Am. Heart Assoc 6, e005811 (2017). [DOI] [PMC free article] [PubMed] [Google Scholar]
- 13.Yan N Structural Biology of the Major Facilitator Superfamily Transporters. Annu. Rev. Biophys 44, 257–283 (2015). [DOI] [PubMed] [Google Scholar]
- 14.Deng D et al. Crystal structure of the human glucose transporter GLUT1. Nature 510, 121–125 (2014). [DOI] [PubMed] [Google Scholar]
- 15.Ethayathulla AS et al. Structure-based mechanism for Na(+)/melibiose symport by MelB. Nat. Commun 5, 3009 (2014). [DOI] [PMC free article] [PubMed] [Google Scholar]
- 16.Granell M, Leon X, Leblanc G, Padros E & Lorenz-Fonfria VA Structural insights into the activation mechanism of melibiose permease by sodium binding. Proc. Natl. Acad. Sci. USA 107, 22078–22083 (2010). [DOI] [PMC free article] [PubMed] [Google Scholar]
- 17.Harding MM Metal-ligand geometry relevant to proteins and in proteins: sodium and potassium. Acta Crystallogr. D Biol. Crystallogr 58, 872–874 (2002). [DOI] [PubMed] [Google Scholar]
- 18.Vu TM et al. Mfsd2b is essential for the sphingosine-1-phosphate export in erythrocytes and platelets. Nature 550, 524–528 (2017). [DOI] [PubMed] [Google Scholar]
- 19.Kobayashi N et al. MFSD2B is a sphingosine 1-phosphate transporter in erythroid cells. Sci. Rep 8, 4969 (2018). [DOI] [PMC free article] [PubMed] [Google Scholar]
- 20.Scala M et al. Biallelic MFSD2A variants associated with congenital microcephaly, developmental delay, and recognizable neuroimaging features. Eur. J. Hum. Genet 28, 1509–1519 (2020). [DOI] [PMC free article] [PubMed] [Google Scholar]
- 21.Riazuddin S et al. Exome sequencing of Pakistani consanguineous families identifies 30 novel candidate genes for recessive intellectual disability. Mol. Psychiatry 22, 1604–1614 (2017). [DOI] [PMC free article] [PubMed] [Google Scholar]
- 22.Hu H et al. Genetics of intellectual disability in consanguineous families. Mol. Psychiatry 24, 1027–1039 (2019). [DOI] [PubMed] [Google Scholar]
- 23.Harel T et al. Homozygous mutation in MFSD2A, encoding a lysolipid transporter for docosahexanoic acid, is associated with microcephaly and hypomyelination. Neurogenetics 19, 227–235 (2018). [DOI] [PubMed] [Google Scholar]
- 24.Drew D & Boudker O Shared Molecular Mechanisms of Membrane Transporters. Annu. Rev. Biochem 85, 543–572 (2016). [DOI] [PubMed] [Google Scholar]
- 25.Deng D et al. Molecular basis of ligand recognition and transport by glucose transporters. Nature 526, 391–396 (2015). [DOI] [PubMed] [Google Scholar]
- 26.Plummer AM, Culbertson AT & Liao M The ABCs of Sterol Transport. Annu. Rev. Physiol 83, 153–181 (2021). [DOI] [PubMed] [Google Scholar]
- 27.Andersen JP et al. P4-ATPases as Phospholipid Flippases-Structure, Function, and Enigmas. Front. Physiol 7, 275 (2016). [DOI] [PMC free article] [PubMed] [Google Scholar]
- 28.Nikaido H Structure and mechanism of RND-type multidrug efflux pumps. Adv. Enzymol. Relat. Areas Mol. Biol 77, 1–60 (2011). [DOI] [PMC free article] [PubMed] [Google Scholar]
- 29.Pardridge WM The blood-brain barrier: bottleneck in brain drug development. NeuroRx 2, 3–14 (2005). [DOI] [PMC free article] [PubMed] [Google Scholar]
- 30.Banks WA From blood-brain barrier to blood-brain interface: new opportunities for CNS drug delivery. Nat. Rev. Drug Discov 15, 275–292 (2016). [DOI] [PubMed] [Google Scholar]
- 31.Goehring A et al. Screening and large-scale expression of membrane proteins in mammalian cells for structural studies. Nat. Protoc 9, 2574–2585 (2014). [DOI] [PMC free article] [PubMed] [Google Scholar]
- 32.Tucker DF et al. Isolation of state-dependent monoclonal antibodies against the 12-transmembrane domain glucose transporter 4 using virus-like particles. Proc. Natl. Acad. Sci. USA 115, E4990–E4999 (2018). [DOI] [PMC free article] [PubMed] [Google Scholar]
- 33.Mastronarde DN Automated electron microscope tomography using robust prediction of specimen movements. J. Struct. Biol 152, 36–51 (2005). [DOI] [PubMed] [Google Scholar]
- 34.Zheng SQ et al. MotionCor2: anisotropic correction of beam-induced motion for improved cryo-electron microscopy. Nat. Methods 14, 331–332 (2017). [DOI] [PMC free article] [PubMed] [Google Scholar]
- 35.Zhang K Gctf: Real-time CTF determination and correction. J. Struct. Biol 193, 1–12 (2016). [DOI] [PMC free article] [PubMed] [Google Scholar]
- 36.Grant T, Rohou A & Grigorieff N cisTEM, user-friendly software for single-particle image processing. Elife 7, e35383 (2018). [DOI] [PMC free article] [PubMed] [Google Scholar]
- 37.Scheres SH A Bayesian view on cryo-EM structure determination. J. Mol. Biol 415, 406–418 (2012). [DOI] [PMC free article] [PubMed] [Google Scholar]
- 38.Punjani A, Rubinstein JL, Fleet DJ & Brubaker MA cryoSPARC: algorithms for rapid unsupervised cryo-EM structure determination. Nat. Methods 14, 290–296 (2017). [DOI] [PubMed] [Google Scholar]
- 39.Ru H et al. Molecular Mechanism of V(D)J Recombination from Synaptic RAG1-RAG2 Complex Structures. Cell 163, 1138–1152 (2015). [DOI] [PMC free article] [PubMed] [Google Scholar]
- 40.Emsley P, Lohkamp B, Scott WG & Cowtan K Features and development of Coot. Acta Crystallogr. D Biol. Crystallogr 66, 486–501 (2010). [DOI] [PMC free article] [PubMed] [Google Scholar]
- 41.Adams PD et al. PHENIX: a comprehensive Python-based system for macromolecular structure solution. Acta Crystallogr. D Biol. Crystallogr 66, 213–221 (2010). [DOI] [PMC free article] [PubMed] [Google Scholar]
- 42.Chen VB et al. MolProbity: all-atom structure validation for macromolecular crystallography. Acta Crystallogr. D Biol. Crystallogr 66, 12–21 (2010). [DOI] [PMC free article] [PubMed] [Google Scholar]
- 43.The PyMOL Molecular Graphics System v.2.0. (Schrödinger, 2017). [Google Scholar]
- 44.Pettersen EF et al. UCSF Chimera--a visualization system for exploratory research and analysis. J. Comput. Chem 25, 1605–1612 (2004). [DOI] [PubMed] [Google Scholar]
- 45.Minitab 17 Statistical Software (Minitab, 2010). [Google Scholar]
- 46.Ashkenazy H et al. ConSurf 2016: an improved methodology to estimate and visualize evolutionary conservation in macromolecules. Nucleic Acids Res. 44, W344–350 (2016). [DOI] [PMC free article] [PubMed] [Google Scholar]
- 47.Landau M et al. ConSurf 2005: the projection of evolutionary conservation scores of residues on protein structures. Nucleic Acids Res. 33, W299–302 (2005). [DOI] [PMC free article] [PubMed] [Google Scholar]
- 48.Lomize MA, Lomize AL, Pogozheva ID & Mosberg HI OPM: orientations of proteins in membranes database. Bioinformatics 22, 623–625 (2006). [DOI] [PubMed] [Google Scholar]
- 49.Zhang B et al. Structure of a proton-dependent lipid transporter involved in lipoteichoic acids biosynthesis. Nat. Struct. Mol. Biol 27, 561–569 (2020). [DOI] [PMC free article] [PubMed] [Google Scholar]
- 50.Jacobson MP, Friesner RA, Xiang Z & Honig B On the role of the crystal environment in determining protein side-chain conformations. J. Mol. Biol 320, 597–608 (2002). [DOI] [PubMed] [Google Scholar]
- 51.Zhang L & Hermans J Hydrophilicity of cavities in proteins. Proteins 24, 433–438 (1996). [DOI] [PubMed] [Google Scholar]
- 52.Betz R Dabble (v2.6.3), 10.5281/zenodo.836914 (2017). [DOI] [Google Scholar]
- 53.Huang J et al. CHARMM36m: an improved force field for folded and intrinsically disordered proteins. Nat. Methods 14, 71–73 (2017). [DOI] [PMC free article] [PubMed] [Google Scholar]
- 54.Klauda JB et al. Update of the CHARMM all-atom additive force field for lipids: validation on six lipid types. J. Phys. Chem. B 114, 7830–7843 (2010). [DOI] [PMC free article] [PubMed] [Google Scholar]
- 55.Guvench O, Hatcher E, Venable RM, Pastor RW & MacKerell AD CHARMM Additive All-Atom Force Field for Glycosidic Linkages between Hexopyranoses. J. Chem. Theory Comput 5, 2353–2370 (2009). [DOI] [PMC free article] [PubMed] [Google Scholar]
- 56.Case DA et al. AMBER 2018. (University of California, San Francisco: ). [Google Scholar]
- 57.Hopkins CW, Le Grand S, Walker RC & Roitberg AE Long-Time-Step Molecular Dynamics through Hydrogen Mass Repartitioning. J. Chem. Theory Comput 11, 1864–1874 (2015). [DOI] [PubMed] [Google Scholar]
- 58.Ryckaert J, Ciccotti G, Berendsen HJ Numerical integration of the cartesian equations of motion of a system with constraints: molecular dynamics of n-alkanes. J. Comput. Phys 23, 327–341 (1977). [Google Scholar]
- 59.Roe DR & Cheatham TE 3rd. PTRAJ and CPPTRAJ: Software for Processing and Analysis of Molecular Dynamics Trajectory Data. J. Chem. Theory Comput 9, 3084–3095 (2013). [DOI] [PubMed] [Google Scholar]
- 60.Humphrey W, Dalke A & Schulten K VMD: Visual molecular dynamics. J. Mol. Graph. Model 14, 33–38 (1996). [DOI] [PubMed] [Google Scholar]
- 61.Vilas JL et al. MonoRes: Automatic and Accurate Estimation of Local Resolution for Electron Microscopy Maps. Structure 26, 337–344 e334 (2018). [DOI] [PubMed] [Google Scholar]
Associated Data
This section collects any data citations, data availability statements, or supplementary materials included in this article.
Supplementary Materials
Data Availability Statement
The cryoEM map has been deposited into the Electron Microscopy Data Bank (accession number EMD-24252). The coordinates have been deposited into the Protein Data Bank (accession number 7N98). Any other relevant data are available from the corresponding author upon reasonable request.


