

Abstract
Background
Osteoarthritis (OA) is the most prevalent chronic joint disorder worldwide and is associated with significant pain and disability.
Objectives
To assess the effects of viscosupplementation in the treatment of OA of the knee. The products were hyaluronan and hylan derivatives (Adant, Arthrum H, Artz (Artzal, Supartz), BioHy (Arthrease, Euflexxa, Nuflexxa), Durolane, Fermathron, Go‐On, Hyalgan, Hylan G‐F 20 (Synvisc Hylan G‐F 20), Hyruan, NRD‐101 (Suvenyl), Orthovisc, Ostenil, Replasyn, SLM‐10, Suplasyn, Synject and Zeel compositum).
Search methods
MEDLINE (up to January (week 1) 2006 for update), EMBASE, PREMEDLINE, Current Contents up to July 2003, and the Cochrane Central Register of Controlled Trials (CENTRAL) were searched. Specialised journals and reference lists of identified randomised controlled trials (RCTs) and pertinent review articles up to December 2005 were handsearched.
Selection criteria
RCTs of viscosupplementation for the treatment of people with a diagnosis of OA of the knee were eligible. Single and double‐blinded studies, placebo‐based and comparative studies were eligible. At least one of the four OMERACT III core set outcome measures had to be reported (Bellamy 1997).
Data collection and analysis
Each trial was assessed independently by two reviewers for its methodological quality using a validated tool. All data were extracted by one reviewer and verified by a second reviewer . Continuous outcome measures were analysed as weighted mean differences (WMD) with 95% confidence intervals (CI). However, where different scales were used to measure the same outcome, standardized mean differences (SMD) were used. Dichotomous outcomes were analyzed by relative risk (RR).
Main results
Seventy‐six trials with a median quality score of 3 (range 1 to 5) were identified. Follow‐up periods varied between day of last injection and eighteen months. Forty trials included comparisons of hyaluronan/hylan and placebo (saline or arthrocentesis), ten trials included comparisons of intra‐articular (IA) corticosteroids, six trials included comparisons of nonsteroidal anti‐inflammatory drugs (NSAIDs), three trials included comparisons of physical therapy, two trials included comparisons of exercise, two trials included comparisons of arthroscopy, two trials included comparisons of conventional treatment, and fifteen trials included comparisons of other hyaluronans/hylan. The pooled analyses of the effects of viscosupplements against 'placebo' controls generally supported the efficacy of this class of intervention. In these same analyses, differential efficacy effects were observed for different products on different variables and at different timepoints. Of note is the 5 to 13 week post injection period which showed a percent improvement from baseline of 28 to 54% for pain and 9 to 32% for function. In general, comparable efficacy was noted against NSAIDs and longer‐term benefits were noted in comparisons against IA corticosteroids. In general, few adverse events were reported in the hyaluronan/hylan trials included in these analyses.
Authors' conclusions
Based on the aforementioned analyses, viscosupplementation is an effective treatment for OA of the knee with beneficial effects: on pain, function and patient global assessment; and at different post injection periods but especially at the 5 to 13 week post injection period. It is of note that the magnitude of the clinical effect, as expressed by the WMD and standardised mean difference (SMD) from the RevMan 4.2 output, is different for different products, comparisons, timepoints, variables and trial designs. However, there are few randomised head‐to‐head comparisons of different viscosupplements and readers should be cautious, therefore, in drawing conclusions regarding the relative value of different products. The clinical effect for some products, against placebo, on some variables at some timepoints is in the moderate to large effect‐size range. Readers should refer to relevant tables to review specific detail given the heterogeneity in effects across the product class and some discrepancies observed between the RevMan 4.2 analyses and the original publications. Overall, the analyses performed are positive for the HA class and particularly positive for some products with respect to certain variables and timepoints, such as pain on weight bearing at 5 to 13 weeks postinjection.
In general, sample‐size restrictions preclude any definitive comment on the safety of the HA class of products; however, within the constraints of the trial designs employed no major safety issues were detected. In some analyses viscosupplements were comparable in efficacy to systemic forms of active intervention, with more local reactions but fewer systemic adverse events.
In other analyses HA products had more prolonged effects than IA corticosteroids. Overall, the aforementioned analyses support the use of the HA class of products in the treatment of knee OA.
Keywords: Humans; Hyaluronic Acid; Hyaluronic Acid/administration & dosage; Hyaluronic Acid/analogs & derivatives; Hyaluronic Acid/therapeutic use; Injections, Intra‐Articular; Osteoarthritis, Knee; Osteoarthritis, Knee/drug therapy; Randomized Controlled Trials as Topic
Plain language summary
Viscosupplementation for the treatment of osteoarthritis of the knee
Osteoarthritis (OA) is the most common form of chronic arthritis worldwide. Hyaluronan and hylan (HA) products provide opportunity to treat OA in individual knee joints. To evaluate the efficacy, effectiveness and safety of HA products, in knee OA, we have conducted a systematic review using Cochrane methodology. The analyses support the contention that the HA class of products is superior to placebo. There is considerable between‐product, between‐variable and time‐dependent variability in the clinical response. The clinical effect for some products against placebo on some variables at some time points is in the moderate to large effect size range. In general, sample size restrictions preclude any definitive comment on the safety of the HA class of products, however, within the constraints of the trial designs employed, no major safety issues were detected. The analyses suggest that viscosupplements are comparable in efficacy to systemic forms of active intervention, with more local reactions but fewer systemic adverse events, and that HA products have more prolonged effects than IA corticosteroids. Overall, the aforementioned analyses support the use of the HA class of products in the treatment of knee OA.
Background
Of all of the specific joint diseases osteoarthritis (OA) is the most frequent cause of rheumatic complaints. OA of the knee is a major cause of pain and disability. Guidelines for the management of knee OA have been reported in four publications (ACR Guidelines 2000; Jordan 2003; Pendleton 2000; Walker‐Bone 2000).
Viscosupplementation is an intra‐articular (IA) therapeutic modality for the treatment of knee OA based on the physiologic importance of hyaluronan in synovial joints. Its therapeutic goal is to restore the viscoelasticity of synovial hyaluronan, decrease pain, improve mobility and restore the natural protective functions of hyaluronan in the joint. The short‐term mode of action of viscosupplementation is believed to be based on the pain‐relieving effect of the elastoviscous fluid in the affected joint. In the long term, the restoration of joint mobility due to relief of pain is thought to trigger a sequence of events which restores the trans‐synovial flow and subsequently the metabolic and rheological homeostases of the joint.
The principle of viscosupplementation was pioneered by Balazs and coworkers (Balazs 1982; Denlinger 1998; Peyron 1974; Weiss 1999). There are now several different formulations of viscosupplements (hyaluronan and hylan) produced by different manufacturers and of widely different molecular weights. This difference in molecular weight (MW) is thought to be of importance with respect to the volume/amount and number of injections, the residue time in the joint and biologic effects. Aviad and Houpt found no correlation between MW and efficacy (Aviad 1994). Lo et al. reported that at a higher MW HA may have greater effects, but the heterogeneity of the trials used in this meta‐analysis limited this conclusion (Lo 2003). Based on results observed in vitro, Maneiro et al. concluded that HA products were different due to differences in biological activity that resulted from the difference in MW (Maneiro 2004).
Viscosupplementation as treatment for knee OA has been the focus of several review publications (Aggarwal 2004; Altman 2003; Altman 2000; Ayral 2001; Brandt 2000; Collange 1999; Dougados 2000; Espallargues 2003; Gossec 2006; Haraoui 2002; Hochberg 2000; Kelly 2003; Khanuja 2003; Kirwan 1997; Kirwan 2001; Lussier 1996; Maheu 1994; Maheu 1995; Maheu 2003; Marshall 2000; MSAC 2003; Moreland 2003; Moskowitz 2000; Peyron 1993; Tehranzadeh 2005; Uebelhart 1999; Watterson 2000). Four meta‐analyses have been reported (Arrich 2005; Lo 2003; Modawal 2005; Wang 2004). A fifth meta‐analysis has been reported only as an abstract (Choi 1999). These publications employ different methodologies and have shown conflicting results. The review by Espallargues and Pons concluded that a hylan (Hylan G‐F 20) was a safe and well‐tolerated therapy in the short term, but they recommended further work on the effect of multiple courses of hylan (Espallargues 2003). The Medical Services Advisory Committee (Australia) recommended that public funding should not support viscosupplementation for the treatment of knee OA, in March 2003 (MSAC 2003). Choi et al. concluded from their meta‐analysis of seven placebo‐controlled trials that viscosupplementation significantly reduced pain in patients with knee OA, for a period of 5 to 10 weeks after the last injection (Choi 1999). Lo et al.'s meta‐analysis of 18 trials of HA against IA placebo, using a hierarchical algorithm to select variables and timepoints from different trials to charcterise the clinical response across variables, timepoints, and studies to the HA class as a whole, indicated that HA had a small effect when compared to placebo (Lo 2003; Bernstein 2004; Hou 2004). The evidence from Arrich et al.'s systematic review and meta‐analysis of 22 trials of HA against placebo suggested that HA was not clinically effective and that it could be associated with an increased risk of adverse events. The most recent meta‐analysis by Modawal 2005, based on nine randomised, double‐blind, placebo‐controlled trials, reported that viscosupplementation was moderately effective in relieving OA knee pain at five to seven and eight to ten weeks after the last injection but not at 15 to 22 weeks.
Given this diversity of opinion there is, therefore, a rational basis for performing a Cochrane review of viscosupplementation in knee OA.
Objectives
To assess the effects of viscosupplementation in the treatment of OA of the knee. The products were hyaluronan and hylan derivatives of widely different molecular weights and formulation (Adant, Arthrum H, Artz (Artzal, Supartz), BioHy (Arthrease, Euflexxa, Nuflexxa), Durolane, Fermathron, Go‐On, Hyalgan, Hylan G‐F 20 (Synvisc Hylan G‐F 20), Hyruan, NRD‐101, Orthovisc, Ostenil, Replasyn, SLM‐10, Suplasyn, Synject and Zeel compositum).
Methods
Criteria for considering studies for this review
Types of studies
All randomised controlled clinical trials using one or more viscosupplements.
Types of participants
Participants were males and/or females with a diagnosis of OA of the knee. Diagnosis was classified as one of the following (any one of the diagnostic criteria below):
a) diagnosis according to published ACR classification criteria (Altman 1986); b) diagnosis according to the algorithm developed by Altman (Altman 1991); c) diagnosis on the basis of detailed clinical and/or radiographic information.
Types of interventions
All viscosupplements used for the treatment of OA of the knee in humans. Control treatments included: placebo (saline, arthrocentesis) and active treatment.
Types of outcome measures
The OMERACT III core set of outcome measures was considered for analysis (Bellamy 1997):
a) pain; b) physical function; c) patient global assessment; d) joint imaging (for studies of one year or longer).
The minimum criterion for inclusion of the trial in the systematic review was the adequate reporting of at least one of the outcome variables a) or b) or c). Information regarding other outcome measures was extracted and analysed when feasible.
The following variables were included for assessment of adverse reactions to IA injection:
1) by procedure; a) infection; b) needle breakage or separation; c) hypersensitivity to local anaesthetic or preservative; d) discomfort at site of injection; 2) by viscosupplement; a) swelling; b) pain; 3) by toxicity‐related withdrawals; 4) by total number of withdrawals and dropouts.
Search methods for identification of studies
MEDLINE and EMBASE were used initially to identify all clinical trials relating to the use of viscosupplementation therapy in OA. MEDLINE searches for clinical trials were based on the Cochrane search strategy (Dickerson 1994; Haynes 1994). The MeSH heading osteoarthritis (degenerative arthritis, gonoarthrosis) (all subheadings) was added to the search. Similar searches were prepared for the other databases. The lists of references of retrieved publications were also manually checked to add any citations missed by the electronic searches. Abstracts from scientific meetings were included if enough information was available in the abstract.
MEDLINE (1966 to week 2 July 2003 (n = 156 identified)(for update to January (week 1) 2006 (n=92)), EMBASE (1988 to week 29 2003 (n = 255)), PREMEDLINE (to 21 July 2003 (n = 8)), Current Contents (to 17 September 2000 (n = 36)), and the Cochrane Central Register of Controlled Trials (CENTRAL) (to the second quarter 2003 (n = 52)) were searched. The electronic search was supplemented by handsearches of bibliographic references and abstracts published in conference proceedings or in special issues of specialized journals, up to the end of December 2005. One reviewer (JC) handsearched all relevant journals at The University of Western Ontario, London, Canada. The journals that were handsearched were: Acta Orthopedica Scandinavica, Acta Rheumatologica Scandinavica, American Journal of Orthopedics, American Journal of Sports Medicine, Annals of the Rheumatic Diseases, Arthritis Care & Research, Arthritis & Rheumatism, Arthroscopy, Bailliere's Clinical Rheumatology, British Journal of Clinical Practice, British Journal of Rheumatology (now Rheumatology), British Journal of Sports Medicine, British Medical Journal (now BMJ), Bulletin ‐ Hospital for Joint Diseases, Bulletin on the Rheumatic Diseases, Clinical and Experimental Rheumatology, Clinical Therapeutics, Current Medical Research and Opinion, Current Orthopaedics, Current Therapeutic Research Clinical and Experimental, Drugs, Drug and Therapeutics Bulletin, JAMA, The Journal of Bone and Joint Surgery (American and British), Journal of Bone and Mineral Research, Journal of Orthopaedic and Sports Physical Therapy, Journal of Orthopaedic Research, Journal of Orthopedic Rheumatology, Netherlands Journal of Medicine, New England Journal of Medicine, Orthopedics, Orthopaedic Review, Physiotherapy Practice, Physiotherapy Theory and Practice, Rheumatology and Physical Medicine, Rheumatology and Rehabilitation, Rheumatology International, Scandinavian Journal of Rheumatology, Seminars in Arthritis and Rheumatism, The Journal of Musculoskeletal Medicine, The Journal of Rheumatology and the Lancet. Reference lists were handsearched for further identification of published work and presentations at scientific meetings (e.g. American College of Rheumatology (ACR), The Asia Pacific League of Associations for Rheumatology (APLAR), European League Against Rheumatism (EULAR), International League of Associations for Rheumatology (ILAR), Pan‐American League of Associations for Rheumatology (PANLAR), OsteoArthritis Research Society International (OARSI), American Academy of Orthopaedic Surgeons (AAOS)). There were no language restrictions.
Industry representatives were contacted requesting reports on additional studies of their products that might meet eligibility criteria.
The search strategy used is in Appendix 1.
Data collection and analysis
Selection of trials
Inclusion criteria were based on the characteristics of interest. The inclusion criteria were: a) diagnosis of OA of the knee in participants as specified earlier; b) randomised controlled trial design; c) specification of comparative treatment; d) published data on relevant outcome measures; e) statistical analysis including intention‐to‐treat approach.
Data collection
Data from the trials were extracted by one reviewer (JC) and verified by a second reviewer (VR). For the update one reviewer (JC) extracted the data and a second reviewer (NB) verified the data extraction. Trials were not blinded as to authors or institutions. Every effort was made to obtain translations.
A data collection form was developed to use for data collection and subsequent entry into Review Manager (RevMan) 4.2.8.
Data synthesis
Quantitative data were analysed as unadjusted post‐test scores (Lund 1988). Selected timepoints defined a priori and reflecting short‐term, intermediate‐term and long‐term follow‐up were: 1 to 4 weeks postinjection (with respect to the last injection), 5 to 13 weeks postinjection, 14 to 26 weeks postinjection and 45 to 52 weeks postinjection. If two follow‐up assessments were completed within one of the defined timepoints the results of the later of the two assessments were selected for inclusion. For continuous outcome data measured on the same scale weighted mean differences (WMD) were calculated. When pain and function were measured on different scales we defined a hierarchy of pain and function measures then used standardized mean differences (SMD) to pool across RCTs (Hedges 1985; Petitti 1994). In the event, a variable‐by‐variable approach to data extraction was pursued in order to avoid any potential bias resulting from the hierarchical approach, which might have excluded more or less responsive variables from consideration. The SMD controls for different units by calculating an effect size by dividing the mean difference between treatment and control by the standard deviation. For all pooled outcomes, heterogeneity was tested with a chi square test. A fixed‐effect model was used unless heterogeneity was significant (P value < 0.10), in which case a random‐effects (RE) model was used. Since the RevMan Analyses window in RevMan 4.2.8 only permits one model to be set for an outcome, the text results present the correct model. If there is only one trial in a comparison the default is a fixed‐effect model. Only P values less than 0.05 are reported in the text of the Results section.
For categorical outcome data with two categories, relative risk (RR) was calculated (Petitti 1994).
In the Additional Tables section, clinical relevance tables are provided. For dichotomous outcome measures, the number needed to treat (NNT) has been provided. The NNT was calculated as one divided by the risk difference. For continuous outcome measures, the absolute benefit and the relative difference in the change from baseline are presented. The absolute benefit was calculated as the improvement in the treatment group (followup mean minus baseline line) less the improvement in the control group (followup mean minus baseline mean). The relative difference in the change from baseline was calculated as the absolute benefit divided by the baseline mean of the control group. Improvement is indicated by (I) while worsening is indicated by (W). Only if a comparison resulted in a statistically significant difference and baseline values were reported was the clinical relevance (i.e. NNT or benefit) reported in the text.
In other additional tables the results of analyses for continuous outcome measures based on effect size (SMD) are presented to allow reviewers an alternate appreciation of the magnitude of the effect (compared with WMD).
If the change of the standard deviation (SD) was reported in the publication the quadratic formula was used to convert the change SD to the raw SD; ρ was set at 0.4, a conservative estimate of the correlation between baseline and post‐test scores. This value for ρ closely approximates values for ρ generated from analyses based on PMA data of Hylan G‐F 20 trials reporting both interval and change scores. If median rather than mean values were reported the median was extracted. If the range was reported the SD was calculated as range divided by 4.
In comparisons of two hyaluronans the 'new' hyaluronan was considered the treatment and the 'old' marketed hyaluronan was considered the control.
Cochrane policy is, where possible, to avoid the use of proprietary names of products under review. In the case of this viscosupplementation review, an exception has been made, for purposes of clarity, and to permit consumers to more easily identify the products being reviewed. HA products are normally identified by their proprietary names since this is the only exclusive label that allows readers/consumers a common language to understand which product is being described. We consider this preferable to circuitous descriptions based on method of manufacture and molecular weight. In this particular review, we have described the products according to the names commonly used by manufacturers, providers and consumers.
Evaluation of the data was by meta‐analysis using RevMan 4.2.8). Readers should note that the analyses that follow were based on secondary, not primary, data and only use statistical methods contained within RevMan 4.2.8 software. As a result, some analyses may differ in level of significance (in either direction) from that reported in the original publication, based on primary data and other analytic techniques. These differences are apparent in some comparisons based on only a single study but may not be evident to the reader in comparisons based on meta‐analyses where data from multiple studies were combined. Results and interpretations may need to take into account these analytic differences, which are summarised in Additional Table 1. This is potentially a generic issue and not necessarily limited to this particular review.
1. Discrepancies between RevMan analysis and published reports.
| Product | Study ID | Outcome measure | p value | Analysis population | Statistical test | Description |
| Adant | Roman 2000 | Patient global assessment | P (paper): <0.05, R (report):0.07 | ITT | chi‐square of 95% CI | At three months P reports significance, 50% versus 21.1% |
| Painful injection | P:<0.001, R:0.4 | ITT | chi‐square of 95% CI | 8 of 49=16.3% Total population, 6 of 30=20% Adant, and 2 of 19=10.5% Hyalgan. Appears an error in P as they report 8 of 49=20% Total population and 16.3% Adant. | ||
| BioHy (Euflexxa) | Thompson 2002 | Patient global (subjective) assessment | P:0.03, R:0.5 | ITT | Wilcoxon's two‐sample test | P reports significance comparing number of patients very satisfied between groups. R compares very satisfied and satisfied versus slightly satisfied and dissatisfied. |
| Euflexxa | Kirchner 2005 | WOMAC OA Index physical function subscale | P: ns, R: 0.02 | ITT | one‐way ANOVA (GLM) | P reports no statistically significant between group difference whereas RevMan detected a statistically significant between group difference both at 1 to 4 and 5 to 13 weeks postinjection |
| Euflexxa | Kirchner 2005 | Number of patients symptom‐free (WOMAC pain) | P: 0.038, R: 0.05 | ITT | Cochran‐Mantel‐Haenszel test | P reports significance. R no statistically significant difference. |
| Euflexxa | Kirchner 2005 | Number of patients assessing the treatment as 'very satisfied' (P) or 'very satisfied or satisfied' (R) | P: 0.03, R: 0.23 | ITT | Wilcoxon's two‐sample test | P reports significance whereas R detects no difference but this may be attributable to the categories which were compared. |
| Euflexxa | Kirchner 2005 | Number of patients requiring rescue medication during trial | P: 0.013, R: 0.02 | ITT | Cochran‐Mantel‐Haenszel test | Both P and R report significance, but P values differ. |
| Durolane | Altman 2004 | WOMAC OA Index pain subscale | P: ns; R:0.04 | ITT | Wilcoxon rank sum test for change from baseline | P reports no statistically significant between‐group difference while R detected a statistically significant difference at week 2 in favour of saline |
| Altman 2004 | WOMAC OA Index stiffness subscale | P:s; R: ns | ITT | Wilcoxon rank sum test for change from baseline | P reports a statistically significant between‐group difference at week 26 while R detected no statistically significant between‐group difference | |
| Altman 2004 | WOMAC OA Index physical function subscale | P:s; R:ns | ITT | Wilcoxon rank sum test for change from baseline | P reports a statistically significant between‐group difference at week 2 while R detected no statistically significant between‐group difference | |
| Suplasyn | Petrella 2002 | Pain relief | P:HA=NSAID | ITT | within‐group repeated ANOVA | P concludes HA=NSAID for resting pain relief. R finds no difference. |
| Pain with physical activity | HA>PL | ITT | within‐group repeated ANOVA | P concludes HA may be superior to PL alone/NSAID alone. R no difference. | ||
| Pain at rest | PL>HA P value 0.04 | ITT | within‐group repeated ANOVA | P does not report between‐group comparisons. R found difference in favour of PL. | ||
| Functional performance | HA>PL | ITT | within‐group repeated ANOVA | P concludes HA may be superior to PL alone/NSAID alone. R finds no difference. | ||
| Orthovisc | Brandt 2001 | WOMAC pain categoric improvement | P:0.04, R:0.05 | Effectiveness | Wilcoxon rank sum tests | P concludes HA>PL. R RR of 58% versus 40% no significant difference. |
| Six month pain on walking | P:ns, R:0.008 | ITT | one‐way ANOVA | P: no significant difference, R: significant difference in favour of Orthovisc | ||
| Six month Lequesne Index | P:ns, R:0.03 | ITT | one‐way ANOVA | P: no significant difference, R: significant difference in favour of Orthovisc | ||
| Six month flexion | P:ns, R:0.04 | ITT | one‐way ANOVA | P: no significant difference, R: significant difference in favour of Orthovisc | ||
| Kalay 1997 | Activity pain 21st day (1 to 4 weeks) | P:0.0303, R:0.5 | ITT | Mann‐Whitney U test | P: significant difference in favour of OR+PT, R: no significant difference | |
| Night pain 56th day (5 to 13 weeks) | P:0.0284, R:0.07 | ITT | Mann‐Whitney U test | P: significant difference in favour of OR+PT, R: no significant difference | ||
| Walk time 21st day (1 to 4weeks) | P:0.0049, R: 0.4 | ITT | Mann‐Whitney U test | P: significant difference in favour of OR+PT, R: no significant difference | ||
| Walk time 56th day (5 to 13 weeks) | P:0.0001, R:0.2 | ITT | Mann‐Whitney U test | P: significant difference in favour of OR+PT, R: no significant difference | ||
| Hylan G‐F 20 | Dickson 2001 | WOMAC pain (5 to 13 weeks) | P:0.04, R:0.11 | ITT | repeated measures ANOVA corrected for statistically significant covariates | P: significant difference in favour of Hylan G‐F 20 compared to PL, R: no significant difference |
| WOMAC function (5 to 13 weeks) | P:0.05, R:0.01 | ITT | repeated measures ANOVA | P: 0.05 which we would classify as not significant; Hylan G‐F 20 > PL | ||
| Lequesne Index (5 to 13 weeks) | P:0.17, R:0.02 | ITT | repeated measures ANOVA | P: no significnt difference, R: significant difference in favour of Hylan G‐F 20 compared to PL | ||
| Adams 1995 | Pain at rest (5 to 13 weeks) | P:0.05, R:0.6 | ITT | ANOVA | P: Hylan G‐F 20 > NSAID, R: no significant difference | |
| Hyalgan | Dougados 1993 | Lequesne Index (45 to 52 weeks) | P:0.046,R:0.17 | One‐sided Student's t‐test | P: Hyalgectin > PL, R: no significant difference | |
| Hyalgan | Tsai 2003 | WOMAC function (14 to 26 weeks) | P:0.0038, R:0.07 | ITT | ANOVA | P: Hyalgan > PL, R: no significant difference |
| Hyalgan | Jubb 2003 | Joint space width (week 52) | P:ns,R:0.03 | ITT | t‐test | P: No significant difference in total population, but significant difference in >=4.6 mm subgroup; R: difference in total population but not in the 2 subgroups |
| Hylan G‐F 20 | Auerbach 2002 | Pain under load (45 to 52 weeks) | P:0.001, R:0.2 | ITT | Wilcoxon test | P: Hylan G‐F 20 > O2; R: no significant difference |
| WOMAC pain (45 to 52 weeks) | P:0.003, R:0.3 | ITT | Wilcoxon test | P: Hylan G‐F 20 > O2; R: no significant difference | ||
| WOMAC function (45 to 52 weeks) | P:0.001, R:0.16 | ITT | Wilcoxon test | P: Hylan G‐F 20 > O2; R: no significant difference | ||
| Artz | Day 2004 | WOMAC pain (5 to 13 weeks) | P:0.045, R:0.07 | ITT | Repeated measures ANCOVA | P: Artz > PL; R: no significant difference |
| WOMAC stiffness (5 to 13 weeks) | P:0.024, R:0.07 | ITT | Repeated measures ANCOVA | P: Artz > PL; R: no significant difference | ||
| Artz | Puhl 1993 | Lequesne Index (1 to 4 weeks) [t6] | P:0.043, R:0.7 | ITT | Simultaneous t‐tests, MANOVA | P: Artz > PL; R: no significant difference |
| Lequesne Index (5 to 13 weeks) [t14] | P:0.0053, R: 0.5 | ITT | Simultaneous t‐tests, MANOVA | P: Artz > PL; R: no significant difference | ||
| Hyalgan | Jubb 2003 | Pain (number of patients improved)(5‐13 wk) | P:0.04, R:0.16 | ITT | Chi‐square | P: HA > PL; R: no significant difference |
| Hyalgan | Forster 2003 | Knee Society Score (six months) | P: ns, R:0.03 | ITT | Mann‐Whitney | P: no significant difference; R: HA>Arthroscopy |
| Hyalgan | Jones 1995 | Pain at rest (week 29) | P:significant; R:0.09 | Not reported in publication. | P: significant difference in favour of HA versus TH (Table III) but with ITT, LOCF no statistically significant difference. R: based on Table III, no significant difference. | |
| Pain on nominated activity (week 29) | P:significant, R: 0.4 | Not reported in publication. | P: significant difference in favour of HA versus TH (Table III) but with ITT, LOCF no statistically significant difference. R: based on Table III, no significant difference. | |||
| Hyalgan | Listrat 1997 | AIMS (45 to 52 weeks) | P:0.047, R:0.6 | ITT | ANCOVA | P: HA > conventional care; R: no significant difference |
Results
Description of studies
The following information was systematically extracted.
Trial methodology: randomisation; controlled; blinding: single, double, masked observer; design: parallel‐group, cross‐over; number of centres; stratification variables; washout utilization; type of analysis: per protocol, intent to treat.
Characteristics of the study population: country where trial was completed; mean age; percentage of female patients; mean disease duration; number randomised; inclusion/exclusion criteria; baseline values of outcomes.
Interventions: description of experimental and control treatments; concurrent therapy usage. Outcomes: primary (when reported, a dash line followed); secondary outcomes.
In notes: Jadad score: randomisation (R), blinding (B), description of withdrawals/dropouts (W) (Jadad 1996); presence/absence of effusion; if bilateral disease, selection criteria for injected joint(s); trial affiliation with industry (e.g. sponsorship, authorship, statistical analysis).
Allocation concealment was evaluated using the following criteria: 1) adequately concealed trials (i.e. central randomisation; numbered or coded bottles or containers; drugs prepared by the pharmacy; serially numbered, opaque sealed envelopes; or other description that contained elements convincing of concealment), 2) inadequate (i.e. alternation or reference to case record numbers or to dates of birth), and 3) unclear (i.e. authors either did not report an allocation concealment approach at all or reported an approach that did not fall into one of the above two categories) (Schulz 1995).
Risk of bias in included studies
Methodological quality was assessed by two reviewers (NB and JC). A third reviewer (GW) re‐evaluated these assessments and acted as adjudicator in cases of disagreement. The quality of the methodology of the trials was rated by the criteria recommended by Jadad et al. (Jadad 1996). Briefly, this instrument has a maximum score of 5 points. A score of one point is given for each of the following: if the study was described as randomised (1 point), if the study was described as double blind (1 point), and if there was a description of withdrawals or dropouts (1 point). Two additional points are given if the method of randomisation was described and it was appropriate (e.g. computer generated) (1 point), and if the method of double blinding was described and it was appropriate (e.g. identical placebo) (1 point). Two points can be deducted if the method of randomisation was inappropriate (e.g. patients randomised according to date of birth) (‐1 point), or if the method of blinding was inappropriate (e.g. comparison of an oral tablet versus IA injection with no double dummy) (‐1 point).
Effects of interventions
Results are presented by product. An independent evaluation by product is recommended rather than a by‐class meta‐analysis since these products differ in their MW, concentration, treatment schedules, and mode of production (Altman 2003; Blue Cross 1998). Furthermore, since the response is time‐dependent, and may differ between outcome variables, the response has been presented on a by‐product, by‐variable and by‐time basis for each individual product. At the end of the product‐by‐product evaluation there is a section based on the by‐class (pooled) results. Readers are cautioned to note the many differences in study design while reading the results of this analysis. The Discussion section addresses some of these issues.
Product ‐ Adant
Description of studies
One RCT was included: a comparison of Adant and another hyaluronan (Roman 2000).
Roman et al. reported a six‐month, parallel‐group, blind RCT performed at a single centre comparing five weekly injections of Adant (Treatment: MW 900,000 D biotechnically obtained) to five weekly injections of Hyalgan (Control: MW 800,000 D obtained from rooster crest) in 49 patients with OA of the knee (Roman 2000). The authors concluded that the efficacy of Adant was greater than with Hyalgan at three months after treatment. They reported that maximum improvement was seen at five weeks with response decreasing over time resulting in almost 75% of patients reporting only 'fair' or 'no' clinical response at six months postinjection. Pain at the injection site was almost twice as great with Adant. The Jadad score for this study was 3 out of a maximum of 5; specific details of blinding and randomisation were not reported in the publication. The randomisation allocation was 1.6:1 (e.g. n = 30:19) in favour of the Adant group. Allocation concealment was unclear (i.e. not reported).
In this RCT several design issues were noted: 1) one and a half times as many patients were randomised to the Adant group compared to the Hyalgan group; 2) eighty‐four percent of the patients were female; 3) no exclusion criteria were reported in the Materials and Methods section of the publication; 4) details regarding presence or absence of effusion, uni‐ or bilateral disease, OA diagnosis criteria and disease duration were not published; 5) efficacy was assessed only by the patient subjective assessment, the details of which were not published. However, injection technique was standardised and the effect of concomitant analgesic and/or anti‐inflammatory drugs was considered. Although the authors attributed the 'greater efficacy' with Adant at three months and the higher incidence of pain at the injection site to its greater viscosity and volume, there were no statistically significant differences between the products in either the efficacy or safety profiles.
Four trials were excluded: Couceiro 2003; Guerrero 1999; Guerrero 1999a; Novaes 2005. One trial is awaiting assessment: Blanco Garcia 2004.
Adant versus placebo: no trials included.
Adant versus corticosteroid: no trials included.
Adant versus NSAID: no trials included.
Adant versus other hyaluronan
Efficacy
The only efficacy outcome measure extracted from this trial (Roman 2000) was patient global assessment (e.g. number of patients excellent or good) (Table 2). At each of the three timepoints there were no statistically significant differences between the two groups: at 1 to 4 weeks postinjection, 43% of the Adant patients and 37% of the Hyalgan patients were excellent or good; at 5 to 13 weeks postinjection, 50% of the Adant patients and 21% of the Hyalgan patients were excellent or good; and at 14 to 26 weeks postinjection, 33% of the Adant patients and 16% of the Hyalgan patients were excellent or good.
2. Clinical benefit table: Adant. Patient global assessment.
| Study | Time | Treatment | Outcome | No. of pts improved | No. of pts | Risk (%) | Risk difference | NNT |
| Roman 2000 | 1‐4 wk | E: Adant | Number of patients excellent/good | 13 | 30 | 43 | 6 | 16.7 |
| C: Hyalgan | 7 | 19 | 37 | |||||
| 5‐13 wk | E: Adant | Number of patients excellent/good | 15 | 30 | 50 | 29 | 3.5 | |
| C: Hyalgan | 4 | 19 | 21 | |||||
| 14‐26 wk | E: Adant | Number of patients excellent/good | 10 | 30 | 33 | 17 | 5.9 | |
| C: Hyalgan | 3 | 19 | 16 |
The RevMan analysis differed from the publication analysis. The publication reported a significant difference in favour of Adant compared to Hyalgan at three months in the number of patients rating the improvement as excellent or good (P value < 0.05) whereas RevMan reported a P value of 0.07.
Safety
The number of patients reporting painful injections was almost twice as high in the Adant group (6/30, 20%) versus Hyalgan (2/19, 11%). This difference was not statistically significant (Table 3).
3. Clinical benefit table: Adant. Safety.
| Outcome | Event rate Hyalgan | Event rate Adant | Relative risk 95%CI | Abs risk diff 95% CI | NNH (95% CI) | #/100 Adant with AE | #/100 Hyalgan withAE |
| Painful injection | 10.5% 2/19 | 20% 6/30 | 190% (43 to 846%) | 9% (‐10% to 29%) | 11 | 20 | 11 |
The RevMan analysis differed from the publication analysis. The publication reported a significant difference in favour of Hyalgan compared to Adant in the number of patients with painful infiltrations (P value < 0.001) whereas RevMan detected a P value of 0.4.
Product ‐ Arthrum H
Description of studies
One trial was excluded: Bardin 2004.
Product ‐ Artz (Artzal,Supartz)
Description of studies
Nine trials of Artz (Seikagaku Corporation) have been included. Seven included comparisons of Artz against placebo (Day 2004; Karlsson 2002; Lohmander 1996; Puhl 1993; Shichikawa 1983a; Shichikawa 1983b; Wu 1997) and three included comparisons of Artz against three other hyaluronan/hylan products: Hylan G‐F 20 (Karlsson 2002), NRD‐101 (Tsukamoto 1995 (abstract); Yamamoto 1994) and SLM‐10 (Kawabata 1993). Readers are directed to the Hylan G‐F 20, NRD‐101 and SLM‐10 sections for results based on these products. With respect to methodological quality, the average Jadad score was 4.3 out of 5 with three trials scoring 5 (Day 2004; Karlsson 2002; Puhl 1993), three trials scoring 4 (Lohmander 1996; Shichikawa 1983a; Shichikawa 1983b) and one trial scoring 3 (Wu 1997). Allocation concealment was adequate in three trials (Puhl 1993; Shichikawa 1983a; Shichikawa 1983b) and unclear (not reported) in four trials (Day 2004; Karlsson 2002; Lohmander 1996; Wu 1997). Two randomised, double‐blind, placebo‐controlled, multicentre trials have been completed: one in France (Bourgeois (Artz)) and one in the United Kingdom (Byrd (Artz)) but have only been published as part of the Food and Drug Administration Pre‐Market Approval Package (Number P980044, Docket #01M‐0342). Seventeen studies, reported between 1982 and 2005, were excluded (Arizono 1997; Dahlberg 1994; Fuji 1994; Hashimoto 1992; Honma 1989; Igarashi 1983; Iseki 1983; Iwasaki 1993; Kawakami 1993; Namiki 1982; Oshima 1983; Shibata 1993; Suzu 1990; Takeuchi 1993; Tang 2004; Tang 2005; Yoh 1989).
Day et al. reported an 18‐week, placebo‐controlled, double‐blind RCT performed at 17 centres in Australia comparing five weekly injections of Artz to five weekly injections of saline in 240 patients with OA of the knee (Day 2001; Day 2004). A significant difference between the two comparison groups for each outcome measure evaluated was reported. A total of 482 adverse events were reported but only 81 were possibly, probably or definitely related to study medication (Artz n = 50, saline n = 31). Tolerability was reported as being excellent since approximately 95% of patients completed the full treatment schedule. Injection site pain and inflammation, that was mild and of short duration, was the most frequent adverse event and occurred in approximately 10% of patients.
In the Discussion of the Day RCT (Day 2004) the authors suggested that their positive result, in comparison to the Lohmander RCT (Lohmander 1996), may have been due to the inclusion criteria. Specifically, only patients with unilateral, mild‐to‐moderate disease, with no patellofemoral OA or clinically large effusions, and who were not morbidly obese were entered into the trial. Both lateral and medial approaches were utilised for IA injections in this trial. However, the same approach was used for all injections in one patient.
Karlsson et al. reported a one‐year, placebo‐controlled, parallel‐group, double‐blind RCT performed at 19 centres in Sweden comparing three weekly injections of Artzal (Astra Lakemedel) to three weekly injections of Hylan G‐F 20 (Roche) and three weekly injections of placebo (phosphate‐buffered saline solution) in 210 patients with OA of the knee (Karlsson 2002). All patients, regardless of treatment, showed clinical improvement during the first 26 weeks of the treatment. Neither hyaluronan/hylan product produced a longer duration of clinical benefit than placebo. However, a significantly longer duration of clinical benefit was achieved when data from the two hyaluronan products were pooled. No serious adverse events due to the treatments were reported. Treatment was discontinued due to adverse events in similar numbers of patients in each of the treatment groups. In this review the Karlsson 2002a reference refers to the Artzal versus placebo comparison (Karlsson 2002a (AvP), the Karlsson 2002b reference refers to the Hylan G‐F 20 versus placebo comparison (Karlsson 2002b (SvP)) and the Karlsson 2002c reference refers to the Artzal versus Hylan G‐F 20 comparison (Karlsson 2002c (AvS)).
The Karlsson RCT (Karlsson 2002) inclusion criteria were based on the Lohmander RCT (Lohmander 1996): patients aged 60 years or above, with a baseline Lequesne Index above 10, and radiographically verified OA as Ahlback grade I‐II. A Lequesne score of 8 to 10 points represents severe handicap. Surgery is indicated for scores of 10 to 12 points and higher. An Ahlback Stage I is classified as narrowing of the joint space (with or without subchondral sclerosis); joint space narrowing is defined by a space inferior to 3 mm or inferior to the half of the space in the other compartment (or in the homologous compartment of the other knee). An Ahlback Stage II is classified as "obliteration of the joint space" (Karlsson 2003d, Magilavy 2003).
Lohmander et al. reported a 20‐week, placebo‐controlled, double‐blind RCT performed at eight centres in Denmark, Finland, Norway and Sweden comparing five weekly injections of Artzal to five weekly injections of saline in 240 patients with OA of the knee (Lohmander 1996). Prior to code break, patient data were stratified by age (40 to 60 y, 61 to 75 y) and Lequesne algofunctional index score (4 to 10, greater than 10). Although both groups improved from baseline at the end of the study there was no difference between the two groups. However, when the two stratification variables were utilised in the analyses Artzal was found to be more effective than saline in older (greater than 60 y) patients with more severe symptoms (Lequesne greater or equal to 10). Although no serious adverse events were reported seven patients (Artz n = 2, saline n = 5) withdrew from the trial due to adverse events. Severity of injection‐site swelling was significantly greater in the Artz group. Dr. S. Lohmander kindly provided unpublished data from the trial for this review.
The well‐designed Lohmander RCT (Lohmander 1996) had a pretrial meeting to standardize the injection procedure and assessment procedures. The discussion of this report summarises some of the difficulties in interpreting trials of HA. This is one of the few trials which stratified patients based on baseline age and Lequesne Index scores.
Puhl et al. reported an 18‐week, parallel‐group, double‐blind RCT performed at 25 centres in Germany comparing five weekly injections of Artz to five weekly injections of suspending vehicle (0.25 mg of sodium hyaluronate per 2.5 ml) in 209 patients with OA of the knee (Puhl 1993). A statistically significant difference was reported in the Lequesne Index (the primary outcome measure) in favour of the Artz group from the third injection to the end of the trial. In a subsequent publication (Puhl 1997) a subgroup analysis confirmed the findings of the Lohmander et al. trial (Lohmander 1996) in that patients older than 60 y with a Lequesne score greater than 10 were the most likely to benefit from treatment. Local reactions at the injection site were reported in similar numbers in both groups (Artz n = 4, vehicle n = 5) and all were of short duration and minor severity.
This well‐designed trial excluded patients with excessive (greater than 100 ml) joint effusion (Puhl 1993).
Shichikawa et al. reported a five‐week, parallel‐group, double‐blind RCT performed at 38 centres in Japan comparing five weekly injections of Artz (1.0% sodium hyaluronate) plus one placebo tablet (lactose coated) administered three times daily after every meal to five weekly injections of suspending vehicle (0.25 mg, 0.01% sodium hyaluronate) plus one placebo tablet (lactose coated) administered three times daily after every meal in 228 patients with OA of the knee (Shichikawa 1983a). Statistically significant differences in favour of Artz compared to control were reported for final effectiveness and usefulness. No systemic adverse events were reported. Local reactions were reported by four patients in the control group and one patient in the Artz group. One patient in the control group had treatment discontinued due to side effects.
The following design issues were noted: 1) follow‐up was limited to one week after final injection; 2) patients with severe joint space narrowing and marked retention of synovial effusion were excluded; 3) patients recorded in symptom diaries at 10:00 daily; 4) authors attributed some of the local pain to injection procedure (Shichikawa 1983a).
Shichikawa et al. reported a five‐week, parallel‐group, double‐blind RCT performed at 16 centres in Japan comparing five weekly injections of Artz (0.5% sodium hyaluronate) plus two placebo tablets (sugar coated lactose) administered three times daily to five weekly injections of suspending vehicle (0.01% sodium hyaluronate solution) plus two placebo tablets (sugar coated lactose) administered three times daily in 107 patients with OA of the knee (Shichikawa 1983b). Statistically significant differences in favour of Artz compared to control were reported for final effectiveness, pain in motion and usefulness. Treatment was discontinued in three patients (Artz n = 1, control n = 2) due to adverse events.
The following design issues were noted: 1) follow‐up was limited to one week after final injection; 2) patients with moderate‐to‐severe joint space narrowing and synovial effusion were excluded (Shichikawa 1983b).
Wu et al. reported a 26‐week, placebo‐controlled, double‐blind RCT performed at a single centre in China comparing five weekly injections of Artz to five weekly injections of the solvent for Artz in 90 patients with OA of the knee (Wu 1997). Statistically significant efficacy was reported for Artz compared to placebo beginning one week after the fifth injection and lasting up to three months. During the six‐month trial no adverse events were reported.
The following design issue was noted: 1) patients with marked joint space narrowing and large amounts of synovial effusion were excluded (Wu 1997).
Artz versus placebo
Efficacy
With respect to the placebo comparisons at 1 to 4 weeks postinjection, there were no statistically significant differences between Artz and placebo for the following outcome measures: pain (0 to 3 scale) (Shichikawa 1983b); pain (0 to 100 mm VAS) (Karlsson 2002a (AvP); Lohmander 1996; Puhl 1993); Lequesne Index (0 to 24) (Puhl 1993); and range of motion (degrees) (Shichikawa 1983b). There was a statistically significant difference in favour of Artz for patient global assessment (RR 1.17; 95% CI 1.04 to 1.32, P value 0.008) (Lohmander 1996; Shichikawa 1983a; Shichikawa 1983b). With the exception of the Lohmander trial (Lohmander 1996), the NNT for patient global assessment was between 5 and 11 patients.(Table 4;Table 5)
4. Clinical benefit table: Artz versus placebo. Dichotomous outcome measures.
| Study | Time | Treatment | Outcome | No. improved | No. of pts | Risk (%) | Risk difference | NNT |
| Lohmander 1996 | 1‐4 wk | E: Artzal | Number of patients improved | 59 | 96 | 61 | 1 | 100 |
| C: Saline | 56 | 93 | 60 | |||||
| Shichikawa 1983a | 1‐4 wk | E: Artz | Number of patients improved | 87 | 103 | 84 | 20 | 5 |
| C: Vehicle | 67 | 105 | 64 | |||||
| Shichikawa 1983b | 1‐4 wk | E: Artz | Number of patients improved | 38 | 48 | 79 | 9 | 11 |
| C: Vehicle | 35 | 50 | 70 | |||||
| Lohmander 1996 | 5‐13 wk | E: Artzal | Number of patients improved | 53 | 96 | 55 | 0 | 0 |
| C: Saline | 51 | 93 | 55 | |||||
| Puhl 1993 | 5‐13 wk | E: Artz | Number of patients improved | 86 | 95 | 91 | 10 | 10 |
| C: Vehicle | 81 | 100 | 81 | |||||
| Lohmander 1996 | 14‐26 wk | E: Artzal | Number of patients improved | 58 | 96 | 60 | 14 | 7.1 |
| C: Saline | 43 | 93 | 46 | |||||
| Karlsson 2002a | 14‐26 wk | E: Artzal | Number of clinical failures | 2 | 90 | 2 | ‐9 | 11 |
| C: Saline | 7 | 66 | 11 | |||||
| Karlsson 2002a | 45‐52 wk | E: Artzal | Number of clinical failures | 26 | 66 | 39 | ‐15 | 6.7 |
| C: Saline | 26 | 48 | 54 | |||||
| Karlsson 2002a | 14‐26 wk | E: Artzal | Number of survivors | 39 | 90 | 43 | 10 | 10 |
| C: Saline | 22 | 66 | 33 |
5. Clinical benefit table: Artz versus placebo. Continuous outcome measures.
| Study | Time | Treatment | Outcome | N of Pts | Baseline Mean | End of Study Mean | Absolute Benefit | Relative Difference |
| Lohmander 1996 | 1‐4 wk | E: Artzal | Pain (0‐100 mm VAS) | 96 | 49.76 | 36.64 | 2.48 (W) | 5.2% (W) |
| C: Saline | 93 | 47.84 | 32.24 | |||||
| Lohmander 1996 | 5‐13 wk | E: Artzal | Pain (0‐100 mm VAS) | 96 | 49.76 | 34.69 | ‐2.46 (I) | ‐5.1% (I) |
| C: Saline | 93 | 47.84 | 35.23 | |||||
| Lohmander 1996 | 14‐26 wk | E: Artzal | Pain (0‐100 mm VAS) | 96 | 49.76 | 33.65 | ‐3.67 (I) | ‐7.7% (I) |
| C: Saline | 93 | 47.84 | 35.40 | |||||
| Lohmander 1996 | 1‐4 wk | E: Artzal | Activity level (0‐100 mm VAS) | 96 | 62.98 | 43.69 | 4.77 (W) | 7.4% (W) |
| C: Saline | 93 | 64.71 | 40.65 | |||||
| Lohmander 1996 | 5‐13 wk | E: Artzal | Activity level (0‐100 mm VAS) | 96 | 62.98 | 45.17 | 4.71 (W) | 7.3% (W) |
| C: Saline | 93 | 64.71 | 42.19 | |||||
| Lohmander 1996 | 14‐26 wk | E: Artzal | Activity level (0‐100 mm VAS) | 96 | 62.98 | 41.67 | ‐0.68 (I) | ‐1.1% (I) |
| C: Saline | 93 | 64.71 | 44.08 | |||||
| Lohmander 1996 | 14‐26 wk | E: Artzal | Lequesne (0‐24) | 120 | 9.89 | 7.98 | ‐0.17 (I) | ‐1.8% (I) |
| C: Saline | 120 | 9.56 | 7.82 | |||||
| Lohmander 1996 | 1‐4 wk | E: Artzal | Knee function (0‐100 mm VAS) | 96 | 53.76 | 38.00 | 2.17 (W) | 4.1% (W) |
| C: Saline | 93 | 53.02 | 35.09 | |||||
| Lohmander 1996 | 5‐13 wk | E: Artzal | Knee function (0‐100 mm VAS) | 96 | 53.76 | 42.34 | 4.09 (W) | 7.7% (W) |
| C: Saline | 93 | 53.02 | 37.51 | |||||
| Lohmander 1996 | 14‐26 wk | E: Artzal | Knee function (0‐100 mm VAS) | 96 | 53.76 | 38.27 | ‐2.3 (I) | ‐4.3% (I) |
| C: Saline | 93 | 53.02 | 39.83 | |||||
| Karlsson 2002a | 1‐4 wk | E: Artzal | Pain on weight bearing (0‐100 mm VAS) | 92 | 64 | 44 | 1.0 (W) | 1.5% (W) |
| C: Saline | 66 | 65 | 44 | |||||
| Karlsson 2002a | 5‐13 wk | E: Artzal | Pain on weight bearing (0‐100 mm VAS) | 92 | 64 | 42 | ‐3 (I) | ‐4.6% (I) |
| C: Saline | 66 | 65 | 46 | |||||
| Karlsson 2002a | 14‐26 wk | E: Artzal | Pain on weight bearing (0‐100 mm VAS) | 92 | 64 | 48 | 5 (W) | 7.7% (W) |
| C: Saline | 66 | 65 | 44 | |||||
| Karlsson 2002a | 5‐13 wk | E: Artzal | WOMAC (0‐100 mm VAS) | 92 | 48.7 | 34.7 | 4.2 (W) | 8.6% (W) |
| C: Saline | 66 | 48.9 | 30.7 | |||||
| Karlsson 2002a | 14‐26 wk | E: Artzal | WOMAC (0‐100 mm VAS) | 92 | 48.7 | 37.4 | 5.5 (W) | 11.2% (W) |
| C: Saline | 66 | 48.9 | 32.1 | |||||
| Karlsson 2002a | 14‐26 wk | E: Artzal | Lequesne Index (0‐24) | 92 | 13.9 | 10.0 | 0.8 (W) | 5.9% (W) |
| C: Saline | 66 | 13.6 | 8.9 | |||||
| Puhl 1993 | 1‐4 wk | E: Artz | Pain (0‐100 mm VAS) | 95 | 54.10 | 29.14 | ‐4.96 (I) | ‐9.6% (I) |
| C: Vehicle | 100 | 51.40 | 31.40 | |||||
| Puhl 1993 | 5‐13 wk | E: Artz | Pain (0‐100 mm VAS) | 95 | 54.10 | 26.50 | ‐10.2 (I) | ‐19.8 (I) |
| C: Vehicle | 100 | 51.40 | 34.00 | |||||
| Puhl 1993 | 1‐4 wk | E: Artz | Lequesne Index (0‐24) | 95 | 10.4 | 7.19 | ‐0.81 (I) | ‐8.6% (I) |
| C: Vehicle | 100 | 9.4 | 7.00 | |||||
| Puhl 1993 | 5‐13 wk | E: Artz | Lequesne Index (0‐24) | 95 | 10.4 | 6.43 | ‐1.36 (I) | ‐14.5% (I) |
| C: Vehicle | 100 | 9.4 | 6.79 | |||||
| Shichikawa 1983b | 1‐4 wk | E: Artz | Pain (0‐3) | 52 | 1.03 | 0.66 | 0.02 (W) | 1.8% (W) |
| C: Vehicle | 55 | 1.12 | 0.73 | |||||
| Shichikawa 1983b | 1‐4 wk | E: Artz | Range of motion (flexion degrees) | 52 | 133.4 | 135.65 | ‐1.75 (W) | ‐1.4% (W) |
| C: Vehicle | 55 | 128.6 | 132.60 | |||||
| Day 2004 | 5‐13 wk | E: Artz | WOMAC pain (0‐20 Likert) | 116 | 7.96 | 3.84 | ‐0.05 (I) | ‐0.6% (I) |
| C: Saline | 124 | 8.68 | 4.61 | |||||
| Day 2004 | E: Artz | WOMAC function (0‐68 Likert) | 116 | 28.07 | 11.41 | 4.06 (W) | 13% (W) | |
| C: Saline | 124 | 31.25 | 10.53 | |||||
| Day 2004 | E: Artz | WOMAC stiffness (0‐8) | 116 | 3.70 | 1.42 | 0.07 (W) | 1.8% (W) | |
| C: Saline | 124 | 3.79 | 1.44 |
The RevMan analysis differed from the Puhl et al. publication analysis (Puhl 1993). The publication reported a statistically significant difference in favour of Artz compared to placebo for the Lequesne Index at 1 to 4 weeks postinjection (P value 0.043) compared to the RevMan analysis (P value 0.7).
At 5 to 13 weeks postinjection, there were no statistically significant differences between Artz and placebo for: WOMAC OA Index pain (0 to 20) (Day 2004); WOMAC OA Index physical function (0 to 68) (Day 2004); Lequesne Index (Puhl 1993); and patient global assessment (Lohmander 1996; Puhl 1993). However, Artz was better than placebo for pain (100 mm VAS) (WMD ‐4.55; 95% CI ‐9.09 to 0.00, P value 0.05) (Karlsson 2002a (AvP); Lohmander 1996; Puhl 1993). Artz was between 5 and 20% more effective than saline in relieving pain at 5 to 13 weeks postinjection.
The RevMan analysis differed from the Day et al. publication analysis (Day 2004). The publication reported statistically significant between‐group differences in WOMAC pain (P value 0.045) and WOMAC stiffness (P value 0.024) in favour of the Artz group compared to the placebo group, whereas the RevMan analysis did not detect a significant difference (WOMAC pain P value 0.07, WOMAC stiffness P value 0.07). The RevMan analysis differed from the Puhl et al. publication analysis (Puhl 1993). The publication reported a statistically significant difference in favour of Artz compared to placebo for the Lequesne Index at 5 to 13 weeks post injection (P value 0.0053) compared to the RevMan analysis which did not (P value 0.5).
At 14 to 26 weeks postinjection, no statistically significant differences were found between Artz and placebo for the Lequesne Index or pain (100 mm VAS) (Karlsson 2002a (AvP); Lohmander 1996). However, more patients improved in the Artz than placebo group for patient global assessment (Lohmander 1996). The number of clinical failures was higher in the saline group (11%) versus Artzal (2%) (Karlsson 2002a (AvP)).
At 45 to 52 weeks postinjection there was no statistically significant difference in the number of clinical failures or in the number of survivors (i.e. patients not requiring additional treatment for study knee) (Karlsson 2002a (AvP)).
Safety
There was no statistically significant difference in the number of withdrawals, overall, at 1 to 4 weeks postinjection (Shichikawa 1983a; Shichikawa 1983b); at 5 to 13 weeks postinjection (Day 2004; Puhl 1993); or at 14 to 26 weeks postinjection (Lohmander 1996). There was no statistically significant difference in the number of withdrawals due to adverse events at 1 to 4 weeks postinjection (Shichikawa 1983a; Shichikawa 1983b); at 5 to 13 weeks postinjection (Day 2004); at 14 to 26 weeks postinjection (Lohmander 1996); or at 45 to 52 weeks postinjection (Karlsson 2002a (AvP)). There were no statistically significant differences in the number of participants withdrawn overall at 5 to 13 or at 14 to 26 weeks postinjection. The number of adverse events probably or possibly related to treatment was statistically greater in the Artz group compared to the saline group at 5 to 13 weeks postinjection (RR 1.59; 95% CI 1.12 to 2.26, P value 0.009) (Day 2004; Puhl 1993), but there was no difference at 45 to 52 weeks postinjection (Karlsson 2002a (AvP)). There was no statistically significant difference in the number of patients with local adverse events in whom the study treatment was continued at 1 to 4 weeks postinjection (Shichikawa 1983a). In Karlsson's trial (Karlsson 2002a (AvP)) at 45 to 52 weeks postinjection there was no statistically significant difference in the number of patients reporting adverse events or in the number of serious adverse events. In Wu's study (Wu 1997), no side effects developed over a six‐month period.
Artz versus corticosteroid: No trials included.
Artz versus NSAID: No trials included.
Artz versus other hyaluronan
One RCT included was a comparison of Artzal and Hylan G‐F 20 (Karlsson 2002c (AvS)). Readers are directed to the NRD‐101 and SLM‐10 sections for results based on comparisons of Artz and these products.
Efficacy
With respect to the Artzal comparison against Hylan G‐F 20 (Karlsson 2002c (AvS)), there were no statistically significant differences between the two products in pain on weight bearing (0 to 100 mm VAS) at the three assessment times: 1 to 4, 5 to 13, or 14 to 26 weeks postinjection. There was no statistically significant difference between the two products in the Lequesne Index at 14 to 26 weeks postinjection. There were no statistically significant differences between the two products in the number of clinical failures either at 14 to 26 or 45 to 52 weeks postinjection, or in the number of survivors (i.e. patients not requiring additional treatment to study knee) at 45 to 52 weeks postinjection.(Table 6; Table 7)
6. Clinical benefit table. Artz versus Hylan G‐F 20. Dichotomous outcome measure.
| Study | Time | Treatment | Outcome | No. improved | No. of pts | Risk (%) | Risk difference | NNT |
| Karlsson 2002c | 14‐26 wk | E: Artzal | Number of clinical failures | 2 | 90 | 2 | ‐5 | 20 |
| C: Hylan G‐F 20 | 6 | 86 | 7 | |||||
| Karlsson 2002c | 14‐26 wk | E: Artzal | Number of survivors | 39 | 90 | 43 | ‐1 | 100 |
| C: Hylan G‐F 20 | 38 | 86 | 44 | |||||
| Karlsson 2002c | 45‐52 wk | E: Artzal | Number of clinical failures | 26 | 66 | 39 | ‐7 | 14.3 |
| C: Hylan G‐F 20 | 32 | 70 | 46 |
7. Clinical benefit table: Artz versus Hylan G‐F 20. Continuous outcome measure.
| Study | Time | Treatment | Outcome | N of Pts | Baseline Mean | End of Study Mean | Absolute Benefit | Relative Difference |
| Karlsson 2002c | 1‐4 wk | E: Artzal | Pain on weight bearing (0‐100 mm VAS) | 92 | 64 | 44 | ‐2 (I) | ‐3.2% (I) |
| C: Hylan G‐F 20 | 88 | 63 | 45 | |||||
| Karlsson 2002c | 5‐13 wk | E: Artzal | Pain on weight bearing (0‐100 mm VAS) | 92 | 64 | 42 | 0 | 0% |
| C: Hylan G‐F 20 | 88 | 63 | 41 | |||||
| Karlsson 2002c | 14‐26 wk | E: Artzal | Pain on weight bearing (0‐100 mm VAS) | 92 | 64 | 48 | 4 (W) | 6.3% (W) |
| C: Hylan G‐F 20 | 88 | 63 | 43 | |||||
| Karlsson 2002c | 5‐13 wk | E: Artzal | WOMAC (0‐100 mm VAS) | 92 | 48.7 | 34.7 | 3.0 (W) | 6.2% (W) |
| C: Hylan G‐F 20 | 88 | 48.7 | 31.7 | |||||
| Karlsson 2002c | 14‐26 wk | E: Artzal | WOMAC (0‐100 mm VAS) | 92 | 48.7 | 37.4 | 5.5 (W) | 11.3% (W) |
| C: Hylan G‐F 20 | 88 | 48.7 | 31.9 | |||||
| Karlsson 2002c | 14‐26 wk | E: Artzal | Lequesne Index (0‐24) | 92 | 13.9 | 10.0 | 0.5 (W) | 3.7% (W) |
| C: Hylan G‐F 20 | 88 | 13.4 | 9.0 |
Safety There were no statistically significant differences between Artzal and Hylan G‐F 20 at 45 to 52 weeks postinjection in the number of patients withdrawn due to adverse events, the number of adverse events related to treatment, or the number of patients reporting adverse events.
Product ‐ Biohy (Arthrease, Euflexxa, Nuflexxa)
Description of studies
Two trials of BioHy have been included. One trial included a comparison against placebo (Tamir 2001) and the other trial included a comparison against Hylan G‐F 20 (Kirchner 2006; Thompson 2002 (abstract)).
Tamir et al. reported a 20‐week, placebo‐controlled, single‐blind, open‐label RCT performed at a single orthopaedic clinic in Turkey comparing three weekly injections of BioHy (Bio‐Technology General, manufactured by bacterial fermentation of the non‐hemolytic strain of Streptococcus zooepidemicus) to three weekly injections of phosphate‐buffered saline in 49 patients with OA of the knee (Tamir 2001). The authors reported that this feasibility study was not sufficiently powered to detect between‐group differences. However, they found a 'favourable trend' for BioHy in decreasing pain. With respect to safety, they reported that BioHy was well tolerated and no HA‐related adverse events were found. With respect to methodological quality, it scored 3 out of 5 on the Jadad scale; specific details of randomisation were not reported in the publication. Allocation concealment was unclear.
In this RCT, several design issues were noted: 1) patients with more than 15 ml of aspirated synovial fluid (SF) were excluded; 2) concurrent and escape medication such as paracetamol and NSAIDs were permitted throughout the trial; 3) although the AAOS MODEMS arthritic module was utilised for assessing pain, stiffness and physical function, all the pain variables were assessed and scored by the investigator and not by the patient; 4) in reporting the results the authors did not provide baseline means, rather they reported change in mean categorical scores without any measure of dispersion excluding this trial from the analysis; 5) the trial was found to be under powered.
The Thompson et al. trial, first published as an abstract (Thompson 2002), has now been reported as a full‐length article by Kirchner and Marshall (Kirchner 2006). Kirchner and Marshall reported a 12‐week, parallel‐group, double‐blind, multicentre RCT performed at 10 centres in Germany comparing three weekly injections of Euflexxa (Arthrease) to three weekly injections of Hylan G‐F 20 in 321 patients with OA of the knee. For the primary outcome measure, the WOMAC OA Index pain subscale, both groups reported statistically significant improvements from baseline. In addition, the criteria for non‐inferiority were met. With regards to secondary outcome measures, statistically significant differences favoured Euflexxa for patient global satisfaction and the number of patients requiring acetaminophen for rescue analgesia. With respect to safety, a statistically significant difference was detected in the number of joint effusions; 0.6% in the Euflexxa group compared to 8.1% in the Synvisc group. The authors concluded that the effectiveness of Euflexxa was not inferior to that of Synvisc, but due to the higher incidence of effusions that Euflexxa had a safety advantage.
This trial scored 5 out of 5 on the Jadad scale; specific details of randomisation and blinding both were reported in the publication. Allocation concealment was adequate. One should note that this trial was designed and powered to test for non‐inferiority. Ferring Pharmaceuticals Inc. kindly provided the means and standard errors for the WOMAC OA Index stiffness and physical function subscales for the ITT population. Biotechnology General (Israel) Ltd. kindly provided the poster of this trial that was presented at the OARSI 2002 Congress as well as an Excel file of the WOMAC OA Index pain subscale data.
BioHy versus placebo
Efficacy
No efficacy results have been extracted from this trial (Tamir 2001). Pain and stiffness results were reported as change but neither baseline values nor measures of dispersion were reported. Safety
There were no statistically significant differences in the safety profile of BioHy and placebo. There were a similar number of withdrawals overall in both groups: BioHy 12% and placebo 17%. The difference in the percentage of patients in the BioHy group (72%) who reported knee pain immediately after the injection, which was related to the injection procedure, was not significantly different from that in the placebo group (46%). No systemic adverse events were reported in either group.
BioHy versus corticosteroid: no trials included.
BioHy versus NSAID: no trials included.
BioHy versus other hyaluronan
One RCT was included comparing Euflexxa (syn: Arthrease, BioHy) and Hylan G‐F 20 (Kirchner 2006; Thompson 2002 (abstract)).
Efficacy
There were no statistically significant differences in the WOMAC OA Index pain subscale either at 1 to 4 or 5 to 13 weeks postinjection. There were statistically significant differences in the WOMAC OA Index physical function subscale in favour of Euflexxa compared to Hylan G‐F 20 both at 1 to 4 weeks postinjection (WMD ‐5.10; 95% CI ‐9.54 to ‐0.66, P value 0.02), and at 5 to 13 weeks postinjection (WMD ‐5.40; 95% CI,‐9.83 to ‐0.97, P value 0.02). Euflexxa was 3% more effective than Hylan G‐F 20 in improving WOMAC physical function. There were no statistically significant differences in the WOMAC stiffness subscale either at 1 to 4 or at 5 to 13 weeks postinjection. There was no statistically significant difference in the number of patients symptom‐free (VAS score for the average of the five WOMAC pain questions less than 20 mm) in the WOMAC OA Index pain subscale at 5 to 13 weeks postinjection (Euflexxa 63%, Hylan G‐F 20 52%). There was a statistically significant difference in favour of Euflexxa compared to Hylan G‐F 20 for the number of patients who were symptom‐free based on the WOMAC OA Index physical function subscale at 5 to 13 weeks postinjection (Euflexxa 64%, Hylan G‐F 20 47%) (RR 1.36; 95% CI 1.11 to 1.66, P value 0.003). There was no statistically significant difference in the number of patients that assessed the treatment as 'very satisfied or satisfied' (Euflexxa 81%, Hylan G‐F 20 75%). There were statistically significant differences in favour of Euflexxa compared to Hylan G‐F 20 for the number of patients using acetaminophen (rescue medication) both at 1 to 4 weeks postinjection (RR 0.72, 95% CI 0.57 to 0.91, P value 0.006), and at 5 to 13 weeks postinjection (RR 0.71; 95% CI 0.56 to 0.89, P value 0.003), and also during the trial (RR 0.83; 95% CI 0.71 to 0.97, P value 0.02).
The RevMan analysis differed from the publication analysis for several analyses. The publication reported no statistically significant difference between groups in the WOMAC OA Index physical function subscale. RevMan detected a statistically significant difference both at 1 to 4 and 5 to 13 weeks postinjection (P value 0.02). The publication reported a statistically significant difference in the number of patients that were symptom‐free with respect to the WOMAC OA Index pain subscale (95% CI 0.3 to 21.7, P value 0.038) whereas RevMan did not detect a statistically significant difference (RR 1.21; 95% CI 1.00 to 1.46, P value 0.05). The P value for the number of patients who required rescue medication during the study was smaller in the publication (0.013) compared to RevMan (0.02). The publication reported a statistically significant difference in favour of Euflexxa compared to Hylan G‐F 20 for the number of patients that assessed the treatment as 'very satisfied' (P value 0.03) whereas RevMan detected no difference in the number 'very satisfied or satisfied' (P value 0.23). Table 8; Table 9
8. Clinical benefit table: Euflexxa (Arthrease, BioHy, Nuflexxa) versus placebo.
| Outcome | Event rate PL group | Event rate TR group | RR (95% CI) | AR difference (95%CI | NNH (95% CI) | No. pt taking BioHy | No. pt taking PL |
| Painful injection | 11/24 (45.8 %) | 18/25 (72.0%) | 157% (95% to 259%) | ‐26% (0% to53%) | 4 | 72 | 46 |
9. Clinical benefit table: Euflexxa (Arthrease, BioHy) versus Hylan G‐F 20.
| Study | Time | Treatment | Outcome | N of Pts | Baseline Mean | End of Study Mean | Absolute Benefit | Relative Difference |
| Thompson 2002 | 1‐4 wk | E: BioHy (Arthrease) | WOMAC pain (0‐100 mm VAS) | 160 | 49.20 | 21.70 | ‐1.00 (I) | ‐1.9% (I) |
| C: Hylan G‐F 20 | 161 | 51.90 | 25.40 | |||||
| Thompson 2002 | 5‐13 wk | E: BioHy (Arthrease) | WOMAC pain (0‐100 mm VAS) | 160 | 49.20 | 19.20 | ‐1.10 (I) | ‐2.1% (I) |
| C: Hylan G‐F 20 | 161 | 51.90 | 23.00 | |||||
| Kirchner 2005 | 1‐4 wk | E: Euflexxa | WOMAC physical function (0‐100 mm VAS) | 160 | 47.0 | 22.3 | ‐1.30 (I) | ‐2.6% (I) |
| C: Hylan G‐F 20 | 161 | 50.8 | 27.4 | |||||
| Kirchner 2005 | 5‐13 wk | E: Euflexxa | WOMAC physical function (0‐100 mm VAS) | 157 | 47.0 | 20.0 | ‐1.60 (I) | ‐3.1% (I) |
| C: Hylan G‐F 20 | 158 | 50.8 | 25.4 | |||||
| Kirchner 2005 | 1‐4 wk | E: Euflexxa | WOMAC stiffness (0‐100 mm VAS) | 160 | 43.2 | 21.2 | 1.6 (W) | 3.3% (W) |
| C: Hylan G‐F 20 | 161 | 47.8 | 24.2 | |||||
| Kirchner 2005 | 5‐13 wk | E: Euflexxa | WOMAC stiffness (0‐100 mm VAS) | 157 | 43.2 | 18.2 | 0.8 (W) | 1.7% (W) |
| C: Hylan G‐F 20 | 158 | 47.8 | 22.0 |
Safety
There was no statistically significant difference between the two groups for the following safety outcomes: total withdrawals overall, withdrawals due to adverse events, withdrawals due to lack of efficacy (none in either group), number of patients with serious adverse events, number of patients reporting adverse events (Euflexxa 34%, Hylan G‐F 20 40%). There was a statistically significant difference in the number of patients with joint effusion (Euflexxa 0.6%, Hylan G‐F 20 8%) (RR 0.08; 95% CI 0.01 to 0.58, P value 0.01). The RevMan P value for this last comparison differed from the publication P value of 0.0015.Table 10
10. Clinical benefit table: Euflexxa (BioHy, Arthrease) versus Hylan G‐F 20. Safety.
| Outcome | Event rate in BioHy | Event rate in Hylan | RR (95% CI) | AR difference (95%CI | NNH (95%CI) | No. pts taking BioHy | No. pts taking Hylan |
| Total withdrawals overall | 2.5% 4/160 | 1.9% 3/161 | 134% (31 to 590%) | 1% (‐3% to 4%) | 3 | 2 | |
| Withdrawals due to adverse events | 0% 0/160 | 0.6% 1/161 | 34% (1 to 817%) | ‐1% (‐2% to 1%) | 0 | 1 | |
| Withdrawals due to lack of efficacy | 0% 0/160 | 0% 0/161 | 0% | 0% (‐1% to 1%) | 0 | 0 | 0 |
| Number of patients with serious adverse events | 1.9% 3/160 | 1.2% 2/161 | 151% (26 to 891%) | 1% (‐2% to 3%) | 2 | 1 | |
| Joint effusion | 0.6% 1/160 | 8% 13/161 | 8% (1 to 58%) | ‐7% (‐12% to ‐3%) | 14 (13‐30) | 8 | 8 |
| Number of pts reporting adverse events | 34% 54/160 | 40% 65/161 | 84% (63 to 111%) | ‐7% (‐17% to 4%) | 16 (ns) | 40 | 40 |
Product ‐ Durolane (NASHA ‐ non‐animal stabilized hyaluronic acid)
Description of studies
One RCT was included comparing Durolane to placebo (Altman 2004).
Altman et al. reported a 26‐week, placebo‐controlled, double‐blind RCT performed at 18 centres in Canada (6 centres), Sweden (5 centres), and the United States (7 centres) comparing a single injection of Durolane (synthesized by Streptococci, 60 mg) to a single injection of saline (identical buffered sodium chloride vehicle) in 347 patients with OA of the knee (Altman 2004). The authors reported that although WOMAC scores and quality of life improved in both groups, there were no between‐group differences. There were few treatment‐related adverse events. The authors proposed that the efficacy data may have been confounded by the inclusion of patients with OA at other sites since an analysis based only on patients with knee OA showed a greater response to Durolane than placebo. With respect to methodological quality, the trial scored 5 out of 5 on the Jadad scale achieving points for both randomisation and blinding details. Allocation concealment was adequate.
The statistical analyses were performed using the change from baseline since raw means and standard deviations for unadjusted post‐test scores were not available.
One trial is awaiting assessment: Sinha 2003.
One trial was excluded: Akermark 2004.
Durolane versus placebo
Efficacy
The primary outcome measure for this trial was a positive response to treatment where a responder was defined "as a reduction in the WOMAC pain score of at least 40% with an absolute improvement of at least 5 points compared with baseline for the study knee at the final visit". There were no statistically significant differences between Durolane and saline at any of the follow‐up assessments: at week 2; week 6; week 13 or week 26. However, when the analysis was based only on patients with knee OA, a statistically significant difference in favour of Durolane was found at week 6 (RR 1.53; 95% CI 1.05 to 2.23, P value 0.03) (NNT was 7); but not at any of the other follow‐up assessments: at week 2, week 13 or week 26.
Readers should note that the following efficacy results are based on change from baseline scores not unadjusted post‐test scores. A statistically significant difference was detected in favour of saline for WOMAC OA Index pain subscale at week 2 (WMD 0.74; 95% CI 0.02 to 1.46, P value 0.04). Saline was 2% more effective than Durolane in improving pain. This differed from the publication which reported no significant between‐group difference. A statistically significant difference was detected in favour of saline for WOMAC OA Index stiffness subscale at week 2 (WMD 0.51; 95% CI 0.16 to 0.86, P value 0.005). Saline was 4% better than Durolane in improving stiffness. The original publicaton reported statistically significant between‐group differences both at 2 and 6 months. No statistically significant difference was detected for the WOMAC OA Index physical function subscale at any of the timepoints. This RevMan analysis differed from the publication in which a statistically significant between‐group difference was reported at 2 weeks.(Table 11; Table 12)
11. Clinical benefit table: Durolane. Continuous outcome measures.
| Study | Time | Treatment | Outcome | N of Pts | Baseline Mean | End of Study Mean | Absolute Benefit | Relative Difference |
| Altman 2004 | 1‐4 wk | E: Durolane | WOMAC pain (0‐20) | 172 | 9.90 | 6.75 | 0.24 (W) | 2.3% (W) |
| C: Saline | 174 | 10.42 | 7.03 | |||||
| Altman 2004 | 1‐4 wk | E: Durolane | WOMAC function (0‐68) | 172 | 30.70 | 23.18 | 1.00 (W) | 3.1% (W) |
| C: Saline | 174 | 32.16 | 23.64 | |||||
| Altman 2004 | 1‐4 wk | E: Durolane | WOMAC stiffness (0‐8) | 172 | 3.91 | 3.04 | 0.16 (W) | 3.7% (W) |
| C: Saline | 174 | 4.30 | 3.27 | |||||
| Altman 2004 | 5‐13 wk | E: Durolane | WOMAC pain (0‐20) | 172 | 9.90 | 7.03 | 0.55 (W) | 5.3% (W) |
| C: Saline | 174 | 10.42 | 7.00 | |||||
| Altman 2004 | 5‐13 wk | E: Durolane | WOMAC function (0‐68) | 172 | 30.70 | 23.72 | 1.74 (W) | 5.4% (W) |
| C: Saline | 174 | 32.16 | 23.44 | |||||
| Altman 2004 | 5‐13 wk | E: Durolane | WOMAC stiffness (0‐8) | 172 | 3.91 | 3.20 | 0.34 (W) | 7.9% (W) |
| C: Saline | 174 | 4.30 | 3.25 | |||||
| Altman 2004 | 14‐26 wk | E: Durolane | WOMAC pain (0‐20) | 172 | 9.90 | 7.40 | 0.39 (W) | 3.7% (W) |
| C: Saline | 174 | 10.42 | 7.53 | |||||
| Altman 2004 | 14‐26 wk | E: Durolane | WOMAC function (0‐68) | 172 | 30.70 | 24.88 | 1.60 (W) | 5.0% (W) |
| C: Saline | 174 | 32.16 | 24.74 | |||||
| Altman 2004 | 14‐26 wk | E: Durolane | WOMAC stiffness (0‐8) | 172 | 3.91 | 3.44 | 0.35 (W) | 8.1% (W) |
| C: Saline | 174 | 4.30 | 3.48 |
12. Clinical benefit table. Durolane. Dichotomous outcome measures.
| Study | Time | Treatment | Outcome | No. improved | No. of pts | Risk (%) | Risk difference | NNT |
| Altman 2004 | 1‐4 wk | E: Durolane | Responder: reduction in WOMAC pain score of at least 40% with an absolute improvement of at least 5 points | 63 | 172 | 37 | 7 | 14 |
| C: Saline | 52 | 174 | 30 | |||||
| Altman 2004 | 5‐13 wk | E: Durolane | Responder: reduction in WOMAC pain score of at least 40% with an absolute improvement of at least 5 points | 55 | 172 | 32 | 3 | 33 |
| C: Saline | 61 | 174 | 35 | |||||
| Altman 2004 | 14‐26 wk | E: Durolane | Responder: reduction in WOMAC pain score of at least 40% with an absolute improvement of at least 5 points | 50 | 172 | 29 | 3 | 33 |
| C: Saline | 56 | 174 | 32 | |||||
| Altman 2004 | 1‐4 wk | E: Durolane | Responder: patients only with knee OA, reduction in WOMAC pain score of at least 40% with an absolute improvement of at least 5 points | 45 | 107 | 42 | 14 | 7 |
| C: Saline | 30 | 109 | 28 | |||||
| Altman 2004 | 5‐13 wk | E: Durolane | Responder: patients only with knee OA, reduction in WOMAC pain score of at least 40% with an absolute improvement of at least 5 points | 38 | 107 | 36 | 3 | 33 |
| C: Saline | 36 | 109 | 33 | |||||
| Altman 2004 | 14‐26 wk | E: Durolane | Responder: patients only with knee OA, reduction in WOMAC pain score of at least 40% with an absolute improvement of at least 5 points | 33 | 107 | 31 | 1 | 100 |
| C: Saline | 35 | 109 | 32 |
Safety There were no statistically significant differences in the safety outcomes reported: total withdrawals overall; withdrawals due to inefficacy; withdrawals due to adverse events; number of patients affected by device‐related adverse events; number of patients with adverse events related to injection only; number of patients with non‐serious treatment‐related adverse events; number of patients with non‐serious adverse events; number of patients with treated unrelated adverse events, and number of patients with serious treatment‐unrelated adverse events.(Table 13)
13. Clinical benefit table. Durolane. Safety.
| Outcome | Event rate Durolane | Event rate Saline | RR (95% CI) | AR diff (95% CI) | NNH (95% CI) | No. pts taking Durol | No. pts taking Salin |
| Total withdrawals overall | 39 | 35 | 1.12 (0.75,1.68) | 0.02 (‐0.06,0.11) | 173 | 174 | |
| Withdrawals due to inefficacy | 10 | 6 | 1.68 (0.62,4.51) | 0.02 (‐0.02,0.07) | 173 | 174 | |
| Withdrawals due to adverse events | 13 | 6 | 2.18 (0.85,5.60) | 0.04 (‐0.01,0.09) | 173 | 174 | |
| Number of patients affected by device‐related adverse events | 3 | 2 | 1.51 (0.26,8.92) | 0.01 (‐0.02,0.03) | 173 | 174 | |
| Number of patients with injection only adverse events | 1 | 2 | 0.50 (0.05,5.49) | ‐0.01 (‐0.03,0.01) | 173 | 174 | |
| Number of patients with non‐serious treatment‐related adverse events | 22 | 15 | 1.48 (0.79,2.75) | 0.04 (‐0.02,0.11) | 173 | 174 | |
| Number of patients with non‐serious adverse events | 112 | 114 | 0.99 (0.85,1.15) | ‐0.01 (‐0.11,0.09) | 173 | 174 | |
| Number of patients with treated unrelated adverse events | 101 | 109 | 0.93 (0.79,1.10) | ‐0.04 (‐0.15,0.06) | 173 | 174 | |
| Number of patientts with serious treatment‐unrelated adverse events | 7 | 3 | 2.35(0.62,8.93) | 0.02 (‐0.01,0.06) | 173 | 174 |
Product ‐ Fermathron Description of studies
One RCT was included comparing Fermathron to another hyaluronan (McDonald 2000).
McDonald et al. reported a six‐month, parallel‐group, double‐blind RCT performed at 12 centres in Germany comparing five weekly injections of Fermathron (Fermentech Medical Ltd., manufactured by bacterial fermentation) to five weekly injections of Hyalart (Fidia SpA, obtained from rooster combs) in 256 patients with OA of the knee (McDonald 2000). The authors reported that the products were similar in efficacy and that both were well tolerated. With respect to methodological quality, the trial scored 5 out of 5 on the Jadad scale achieving points for both randomisation and blinding details. Allocation concealment was adequate.
This was a well‐designed and reported 'non‐inferiority' study of two HA products. The importance of escape medication was addressed in the study design. Patients kept a daily diary which was declared as the secondary performance variable. Moreover, the authors investigated the correlation between the route of injection (knee straight or bent, medial or lateral approach) with the local adverse event incident rate. They found that the lowest risk was associated with a lateral approach to a straight knee (Jones 1993). Source of HA (i.e. bacterial fermentation versus rooster combs) did not affect the results.
One trial is awaiting assessment: Sinha 2003.
Fermathron versus placebo: no trials included.
Fermathron versus corticosteroid: no trials included.
Fermathron versus NSAID: no trials included.
Fermathron versus other hyaluronan Efficacy The three efficacy outcome measures extracted from this trial were pain (0 to 100 mm VAS), the Lequesne Index (0 to 24), and patient global assessment (very good, good, average, poor, very poor). No statistically significant differences were found between the two products for pain or the Lequesne Index at 1 to 4 or 5 to 13 weeks postinjection. No statistically significant difference was found in the number of responders at 5 to 13 weeks postinjection with 72.4% in the Hyalart group and 69.6% in the Fermathron group that reported feeling better or much better.(Table 14; Table 15) Safety There was no statistically significant difference in the number of related adverse events (Fermathron 21% versus Hyalart 14%). . These results confirmed the results of the publication indicating that the two products were similar in performance and well tolerated. Product ‐ Go‐On There were no RCTs of Go‐On available (correspondence from Rotta Research Laboratorium July 1, 2004). Product ‐ Hyalgan Description of studies Twenty‐nine randomised controlled trials have been included with Hyalgan (marketed also as Hyalart and Polyreumin) (Fidia Pharmaceutical Corporation, Italy, derived from rooster combs): 14 included comparisons against placebo (Altman 1998; Bragantini 1987; Bunyaratavej 2001; Carrabba 1995; Corrado 1995; Creamer 1994; Dougados 1993; Formiguera Sala 1995; Grecomoro 1987; Henderson 1994; Huskisson 1999; Jubb 2003; St. J. Dixon 1988; Tsai 2003), one was a comparison against no treatment (Miltner 2002; Schneider 1997), one was a comparison against arthroscopic washout (Forster 2003), one was a comparison against exercise, exercise and ultrasound, and no treatment with only warmup exercises (Huang 2005), three were comparisons against other hyaluronan products (McDonald 2000; Roman 2000; Brown 2003), five were comparisons against corticosteroids (Frizziero 2002; Leardini 1987; Leardini 1991; Pietrogrande 1991, against methylprednisolone acetate; Jones 1995, against triamcinolone acetate), one was a comparison against NSAID (Altman 1998), one was a comparison against a homeopathic preparation (Zeel Compositum) (Nahler 1998) (readers are directed to the Zeel product section), one was a comparison against mucopolysaccaride polysulfuric acid ester (Graf 1993), one was a comparison against conventional therapy (Listrat 1997) and one was a comparison of treatment regimens (Karras 2001). Except for three trials (Brown 2003; Karras 2001; Tsai 2003) which have been published as abstracts the remaining trials have been published as journal articles. In three trials, Hyalgan was the control intervention (McDonald 2000; Nahler 1998; Roman 2000). The frequency of injection varied between studies (3, 4 and 5 weekly injections). Considering only the 26 trials in which Hyalgan was designated the experimental intervention (i.e. excluding McDonald 2000; Nahler 1998; Roman 2000), with respect to methodological quality the average Jadad score was 2.81 out of 5 with one trial scoring 5 (Henderson 1994), 7 trials scoring 4 (Altman 1998; Bunyaratavej 2001; Frizziero 2002; Huskisson 1999; Jones 1995; Jubb 2003; St. J. Dixon 1988), 6 trials scoring 3 (Carrabba 1995; Corrado 1995; Formiguera Sala 1995; Forster 2003; Grecomoro 1987; Huang 2005), 10 trials scoring 2 (Bragantini 1987; Creamer 1994; Dougados 1993; Graf 1993; Karras 2001; Leardini 1987; Leardini 1991; Listrat 1997; Pietrogrande 1991; Tsai 2003) and 2 trials scoring 1 (Brown 2003; Miltner 2002). Again, considering only the 26 trials in which Hyalgan was designated the experimental intervention allocation concealment was adequate in three trials (Forster 2003; Frizziero 2002; Huang 2005) and unclear (not reported) in 23 trials.
14. Clinical benefit table: Fermathron. Continuous outcome measures.
| Study | Time | Treatment | Outcome | N of Pts | Baseline Mean | End of Study Mean | Absolute Benefit | Relative Difference |
| McDonald 2000 | 1‐4 wk | E: Fermathron | Lequesne Index (0‐24) | 114 | 11.21 | 7.92 | 0.37 (W) | 3.3% (W) |
| C: Hyalart | 119 | 11.12 | 7.46 | |||||
| McDonald 2000 | 5‐13 wk | E: Fermathron | Lequesne Index (0‐24) | 114 | 11.21 | 6.91 | 0.46 (W) | 4.1% (W) |
| C: Hyalart | 119 | 11.12 | 6.36 | |||||
| McDonald 2000 | 1‐4 wk | E: Fermathron | Pain (0‐100 mm VAS) | 114 | 56.2 | 31.3 | 3.3 (W) | 5.8% (W) |
| C: Hyalart | 119 | 57.2 | 29.0 | |||||
| McDonald 2000 | 5‐13 wk | E: Fermathron | Pain (0‐100 mm VAS) | 114 | 56.2 | 25.4 | 1.8 (W) | 3.1% (W) |
| C: Hyalart | 119 | 57.2 | 24.6 |
15. Clinical benefit table: Fermathron. Dichotomous outcome measures.
| Study | Time | Treatment | Outcome | No. improved | No. of pts | Risk (%) | Risk difference | NNT |
| McDonald 2000 | 5‐13 wk | E: Fermathron | Number of patients much better/better | 87 | 125 | 70 | 2 | 50 |
| C: Hyalart | 92 | 127 | 72 |
Twenty‐three studies were excluded (Aglas 1997; Carrabba 1992; D'Agnolo 1988; Dahlberg 1994; Frizziero 1993; Frizziero 1997; Frizziero 1998; Grecomoro 1992; Hamburger 2004; Kotz 1999; Mazzocato 1987; Mensitieri 1995; Milini 1989; Pasquali Ronchetti 2001; Pavelka 2002; Pipino 1990; Punzi 1988; Rao 2001; Scali 1995; Sieliwonczyk 1997; Turajane 2005; Turajane 2005a; Zamora‐Quezada 2004). Four trials are awaiting assessment (Garcia 2004; Joergensen 2005; Stitik 2004; NCT00130468).
Altman et al. reported a 26‐week, placebo‐ and naproxen‐controlled, double‐blind, double‐dummy, stratified, parallel‐group RCT performed at 15 centres in the United States comparing five weekly injections of Hyalgan plus oral placebo twice daily to five weekly injection of saline plus oral placebo or naproxen 500 mg twice daily in 495 patients with OA of the knee (Altman 1998). Only 67% of the patients completed the trial. Hyalgan was more efficacious (pain relief and improved function) than placebo and as effective as naproxen with fewer side effects. Injection site pain was more common in the Hyalgan group while gastrointestinal adverse events were more common in the naproxen group.
Several design issues are noted: 1) the placebo group received active treatment in the form of 4 g of acetaminophen and arthrocentesis with synovial fluid aspiration if necessary; 2) the naproxen group did not receive arthrocentesis, they received a subcutaneous injection; 3) a training video was provided to all sites; 4) one criterion of success was defined as an effect size of 0.25 of the standard deviation or 6 mm; 5) the data for all secondary outcome measures was analysed only for those patients who completed the 26 weeks of follow‐up since the intent‐to‐treat analysis detected only a 1.5 mm difference between the Hyalgan and placebo groups in the primary outcome measure (pain during the 50‐foot walk test); and 6) escape analgesia, as 500 mg acetaminophen up to 4000 mg/day, was permitted. Analyses showed no statistically significant differences between the three arms of the trial. Bragantini et al. reported a 60‐day, placebo‐controlled, single‐blind, parallel‐group RCT performed at a single centre in Italy comparing three weekly injections of Hyalgan (both 20 mg and 40 mg) to three weekly injections of saline in 55 patients with OA of the knee (Bragantini 1987). Both dosage levels of Hyalgan were significantly superior to placebo. Four patients experienced local pain and burning after injection with Hyalgan but these reactions resolved within a short time. In this review, we have only used the Hyalgan 20 mg arm for comparison against saline.
Brown and Beinat reported a six‐week, parallel‐group, RCT performed at a single centre in England comparing five weekly injections of Hyalgan to three weekly injections of Hylan G‐F 20 in 54 patients with OA of the knee (Brown 2003). This trial was discontinued, with about 50% of enrolment completed, due to a high frequency of acute inflammatory reactions with Hylan G‐F 20. The protocol called for a sample size of 100 patients with 50 to be randomised to each group. The trial was designed to last six months. The number of patients that developed an acutely inflamed painful knee was 6 out of 29 in the Hylan G‐F 20 group compared to 0 of 25 in the Hyalgan group. Statistically significant improvement in WOMAC pain and function was found for Hyalgan while a trend of improvement was found for Hylan G‐F 20.
Two study design points were noted: 1) this RCT was conducted in a clinical practice setting; 2) randomisation was based on the consultant to whom the patient was referred.
Bunyaratavej et al. reported a six‐month, placebo‐controlled, double‐blind RCT performed at three centres in Asia (China, Malaysia, Thailand) comparing four weekly injections of Hyalgan to four weekly injections of saline in 49 patents with OA of the knee (Bunyaratavej 2001). Statistically significant differences in favour of Hyalgan were reported one month after treatment as reflected by decreased pain and increased joint mobility. No local or systemic adverse events related to treatment were observed. No measure of dispersion was reported for the saline group for pain on active movement nor for either treatment group for day pain at baseline. Consequently, this review includes safety but not efficacy data.
This was one of two RCT where a four‐injection schedule of Hyalgan was followed. In addition, acetaminophen (paracetamol) up to 3000 mg daily was permitted.
Carrabba et al. reported a six‐month, placebo‐ and arthrocentesis‐controlled, double‐blind, parallel‐group RCT performed at a single centre in Italy comparing three dose schedules of Hyalgan (one, three and five weekly injections) to five weekly arthrocentesis or five weekly injections of saline in 100 patients with OA of the knee (Carrabba 1995). All five groups received arthrocentesis at the baseline visit. A significantly superior effect of five and three injections of Hyalgan was shown in comparison with placebo, arthrocentesis and one injection of Hyalgan. Four patients reported minor local reactions after injection (one patient each in the arthrocentesis group, the one, three and five injection Hyalgan groups). This review does not report results based on the one injection Hyalgan arm. The 1995 reference refers to the five injection Hyalgan versus saline comparison (Carrabba 1995); the 1995a reference refers to the three injection Hyalgan versus saline comparison (Carrabba 1995a); the 1995b reference refers to the five injection Hyalgan versus arthrocentesis comparison (Carrabba 1995b); and the 1995c reference refers to the three injection Hyalgan versus arthrocentesis comparison (Carrabba 1995c).
In this RCT paracetamol (acetaminophen) was permitted. However, only 15% of the patients used it at baseline, and there was no change in usage over the duration of the trial.
Corrado et al. reported a two‐month, placebo‐controlled, double‐blind RCT performed at a single centre in Italy comparing five weekly injections of Hyalgan to five weekly injections of placebo (water, sodium chloride, sodium phosphate) in 40 patients with OA of the knee (Corrado 1995). A significant difference in favour of Hyalgan was reported for pain and range of motion. Two patients experienced 'accidental trauma' to the knee during treatment.
In order to study the possible anti‐inflammatory activity of Hyalgan, Corrado et al. completed a biochemical assessment of synovial fluid and plasma.
Creamer et al. reported a nine‐week, placebo‐controlled, single‐blind, blind‐observer RCT performed at a single centre in England comparing five weekly injections of Hyalgan to five weekly injections of saline in 12 patients with bilateral OA of the knee (Creamer 1994). This study investigated the mode of action of HA. It was not designed to assess clinical efficacy. No beneficial clinical effect was found for Hyalgan as compared to placebo. Twelve adverse events were reported by seven patients. Five local reactions (pain and swelling), graded as severe, occurred in three Hyalgan‐treated knees and two placebo‐treated knees.
Several design issues were noted: 1) each patient acted as his/her own control; 2) paracetamol up to 4 g daily was permitted; 3) imaging assessments, both MRI and 99m Tc scintigraphic bone scans, were performed; and 4) four of the treated knees and six of the placebo knees had only patellofemoral disease.
Dougados et al. reported a one‐year, placebo‐controlled, single‐blind RCT performed at a single centre in France comparing four weekly injections of Hyalectin to four weekly injections of the vehicle in 110 patients with OA of the knee (Dougados 1993). Greater improvement was found in the Hyalectin group compared to the placebo group for pain and function (Lequesne) in the early assessment and for physician's overall assessment of efficacy and the Lequesne Index in the long term. Nine patients did not receive all four injections: four in the Hyalectin group (two due to painful injection, one lack of efficacy, and one improved) and five in the placebo group (one due to painful injection, one lack of efficacy, three due to reasons unrelated to treatment (traumatic hemarthrosis in one, refusal to continue in two).
Several design issues were noted: 1) this RCT followed a four injection schedule of Hyalgan; 2) one‐sided tests were used in the statistical analysis; and 3) the physician that administered the injection also completed the clinical assessment. Fidia Spa kindly provided an in‐house report of this trial.
Formiguera Sala and Esteve de Miguel reported a 90‐day, placebo‐controlled, double‐blind RCT performed at a single centre in Spain comparing five weekly injections of Hyalgan to five weekly injections of saline in 36 patients with OA of the knee (Formiguera Sala 1995). There were no significant differences between the groups at day 35. However, at day 90, statistically significant differences in favour of Hyalgan were reported for pain outcome measures. Three patients in each group reported pain that "could be attributed to the route of administration and the individual idiosyncrasies of the patients".
Several design issues were noted: 1) the supero‐external approach with the patient in a supine position was followed for injections; 2) study population consisted of 36 patients, but 40 joints; 3) four patients were recruited twice: two receiving placebo in one knee and Hyalgan in the other, one patient receiving Hyalgan in separate knees at both times, one patient receiving placebo in the same knee on two occasions; and 4) the treatment in the second knee took place some time after the first knee was treated.
Forster and Straw reported a one‐year, parallel‐group RCT performed at a single centre in England comparing five weekly injections of Hyalgan to arthroscopic washout (two litres 0.9% saline at least) with either general or spinal anaesthesia in 38 patients with OA of the knee (Forster 2003; Forster 2003a). No significant differences between the two groups were found in any of the clinical outcome measures at any assessment point. Two patients in the Hyalgan group reported pain at the injection site following one injection.
Dr. Forster kindly provided an Excel data file from which we calculated means and standard deviations.
Frizziero and Pasquali Ronchetti reported a six‐month, parallel‐group, single‐blind RCT performed at a single centre in Italy comparing five weekly injections of Hyalgan to three weekly injections of methylprednisolone acetate in 99 patients with primary or secondary OA of the knee (Frizziero 2002). The authors found an initial statistically significant difference in favour of methylprednisolone acetate at day 35 but not at day 180. The clinical effect with Hyalgan appeared more gradually but lasted longer than that of methylprednisolone acetate. Arthroscopic evaluations showed that Hyalgan was superior to methylprednisolone acetate in reducing the extent and grade of cartilage damage. No adverse events were reported in the Hyalgan group compared to two patients in the methylprednisolone acetate group, one resulting in withdrawal from the trial.
This RCT was one of the trials which examined the structural effects of Hyalgan using both arthroscopic and microarthroscopic examinations.
Graf et al. reported a six‐month, verum‐controlled, single‐blind RCT performed at a single centre in Germany comparing Hyalgan once per week (seven injections) to mucopolysaccharide polysulfuric acid (MPA) ester twice per week (13 injections) in 60 patients with OA of the knee (Graf 1993). At the end of the treatment phase the improvement in the modified total Larson rating score was significantly better in the Hyalgan group. The authors reported a more rapid onset of pain relief with Hyalgan. At the end of the trial significantly more patients in the Hyalgan group were symptom free or markedly improved. There was a causal relationship with study medication for six adverse events in the Hyalgan group and for two adverse events in the MPA group.
This RCT was the only trial where a seven injection schedule of Hyalgan was followed.
Grecomoro et al. reported a 60‐day, placebo‐controlled, double‐blind RCT performed at a single centre in Italy comparing three weekly injections of Hyalgan to three weekly injections of phosphate buffer in 34 patients with OA of the knee (Grecomoro 1987). A significant difference between treatments was reported for all the clinical variables assessed. In the Hyalgan group, pain relief was both rapid and long lasting. No 'untoward signs or symptoms' were reported. Two patients withdrew early in the placebo group for reasons unrelated to treatment.
In this RCT results were based on 40 joints of 34 patients.
Henderson et al. reported a five‐month, placebo‐controlled, double‐blind RCT performed at a single centre in England comparing five weekly injections of Hyalgan to five weekly injections of vehicle in 91 patients with OA of the knee (Henderson 1994). Patients were stratified into two groups based on radiological severity. In this review, the reference to Henderson 1994 refers to the milder severity group; while Henderson 1994a refers to the more severe group. No significant differences were found between the two groups. The rate of return to previously prescribed or other NSAIDs or analgesia was significantly slower in the Hyalgan treated group in the subgroup of patients with mild disease. Local reactions (pain and swelling) were observed in 47% of the patients in the Hyalgan group compared to 22% in the placebo group.
Several design issues were noted: 1) all but one patient had bilateral disease; 2) a clinical metrologist was used; 3) injections were into the patello‐femoral space with a medial approach; and 4) there was a high percentage of withdrawals (38%).
Huang et al. reported a one‐year, single‐blind RCT performed at a single centre in Taiwan comparing isokinetic muscular strengthening exercises alone to: 1) isokinetic exercise and pulse ultrasound treatment for painful periarticular soft tissue, 2) isokinetic exercise, pulse ultrasound treatment for painful periarticular soft tissue and intraarticular Hyalgan 5 weekly injections, and 3) no treatment other than warmup exercises (Huang 2005). All three active treatment groups showed significantly reduced pain and disability and increased muscle peak torques after treatment and at the end of the study. The active treatment group including Hyalgan showed the greatest increase in walking speed and decrease in disability after treatment and at the one‐year follow‐up. The authors concluded that an "integrated therapy including ultrasound, isokinetic strengthening exercise, and intraarticular hyaluronan therapy is suggested for the management of knee OA". During the treatment phase, nine patients withdrew from the study due to intolerable pain induced to the prescribed exercise, while three patients withdrew because of muscle weakness. During the one‐year follow‐up period, 13 patients were lost to follow‐up.
This trial used the same physiatrists (who were blinded to treatment) to perform all the evaluations. Measurement of knee range of motion was standardised. All patients received warmup exercises with 20 minutes of hot packs application followed by passive range of motion exercises on an electric stationary bicycle for 5 minutes to both knees before commencing the muscle strengthening exercises. Fidia Spa kindly provided page proofs of a manuscript which was in press.
Huskisson and Donnelly reported a six‐month, placebo‐controlled, blind‐observer, parallel‐group RCT performed at a single centre in England comparing five weekly injections of Hyalgan to five weekly injections of saline in 100 patients with OA of the knee (Huskisson 1999). Superiority of Hyalgan over placebo was demonstrated. Local reactions occurred in similar numbers in each group: seven patients in each group reported flare at the joint while effusion was present in three patients in the placebo group and one patient in the Hyalgan group.
This trial was conducted in England to readdress the efficacy of Hyalgan over placebo (see: Henderson 1994). Fidia Spa kindly provided an in‐house statistical report providing means and standard deviations for pain on walking for all randomised patients for this trial.
Jones et al. reported a six‐month, double‐blind, parallel‐group RCT performed at a single centre in England comparing five weekly injections of Hyalgan to one injection of triamcinolone hexacetonide followed by four injections of saline in 63 patients with bilateral OA of the knee (Jones 1995). Active treatment, which was randomised, was always given to the worst knee. The placebo therapy was not randomised, and, therefore, no data were extracted for comparisons between Hyalgan and saline. No statistically significant differences were found between the groups in the intention‐to‐treat analysis. However, in the completer analysis significantly less pain was seen in the Hyalgan group with other parameters showing a similar trend in favour of Hyalgan. Sixty‐eight percent of the patients dropped out of the study, the majority due to lack of efficacy. By week 29 only 26% of the triamcinolone hexacetonide patients and 38% of the Hyalgan patients remained in the trial.
Jubb et al. reported a one‐year, placebo‐controlled, double‐blind RCT performed at 17 centres in the United Kingdom comparing three weekly injections of Hyalgan to three weekly injections of saline (vehicle placebo) in 408 patients with OA of the knee (Jubb 2001a; Jubb 2001b; Jubb 2001c; Jubb 2001d; Jubb 2003). The treatment schedule was repeated twice more at four‐monthly intervals. The aim of the study was to investigate structural changes as measured by joint space narrowing (the primary outcome). Statistically significant differences in favour of Hyalgan were found for the pain outcome measures. Since the primary analysis did not show any differences between the two groups with respect to joint space narrowing, the authors performed a subgroup analysis based on baseline joint space width. Those patients with radiologically milder disease (less than 4.6 mm) had less progression of joint space narrowing when treated with Hyalgan. A total of 7.2% of the Hyalgan patients and 3% of the saline patients withdrew prematurely due to adverse events; 2.4% and 1.5%, respectively, due to local adverse events. Local effects were reported by 36.1% of the Hyalgan patients and 27.5% of the saline patients. Serious adverse events, all due to concomitant disease, were reported by 13% of the Hyalgan patients and 7% of the saline patients.
In the Tables of Comparisons and data Jubb 2003 entries refer to the full journal publication; Jubb 2001a entries refer to the primary analysis population; Jubb 2001b entries refer to the subgroup with joint space width equal or greater than 4.6 mm; Jubb 2001c entries refer to the subgroup with joint space width less than 4.6 mm.
Since reduction of joint space width was the primary efficacy outcome measure in this trial evaluation was based on computerised digital image analysis of anteroposterior weight‐bearing radiographs. The trial also addressed the safety of repeated cycles of Hyalgan. Fidia Spa kindly provided an in‐house statistical report for pain on walking.
Karras et al. reported a one‐year, parallel‐group RCT performed at a single centre in Greece comparing five weekly injections every six months of Hyalgan to three weekly injections every three months of Hyalgan in 200 patients with OA of the knee (Karras 2001). The objective was to compare the effectiveness of the two regimens. The authors reported that the three‐injection regimen was more effective than the five‐injection regimen. Except for three cases of local pain there were no side effects reported.
Leardini et al. reported a one‐year, single‐blind, parallel‐group RCT performed at a single centre in Italy comparing three weekly injections of Hyalgan to three weekly injections of methylprednisolone acetate (MPA) in 36 patients with OA of the knee (Leardini 1987). No statistically significant differences were found between the two groups in the clinical assessments. Local reactions were reported in three patients in the MPA group compared to four patients in the Hyalgan group.
This trial reported results on 40 joints of 36 patients (four with bilateral disease).
Leardini et al. reported a 60‐day, open, parallel‐group RCT performed at a single centre in Italy comparing three weekly injections of Hyalgan to three weekly injections of 6‐methylprednisolone acetate (6‐MPA) in 40 patients with OA of the knee (Leardini 1991). Assessments, completed one week after the end of treatment, showed that Hyalgan was comparable to 6‐MPA. In the longer term significant differences were found in favour of Hyalgan for the pain outcomes. All patients completed the treatment schedule. No local or systemic reactions were reported.
In this trial, all patients were kept 'at rest' for two days after injection.
Listrat et al. reported a one‐year, open, parallel‐group RCT performed at a single centre in France comparing three weekly injections of Hyalgan every three months for a total of nine injections to conventional therapy in 39 patients with OA of the knee (Listrat 1997). All patients underwent knee arthroscopy before randomisation. A statistically significant difference in favour of Hyalgan was found for the quality of life index. A statistically significant difference for two of three structural parameters was found in favour of Hyalgan. Forty percent of the Hyalgan patients reported transient local reactions (pain) associated with the injection.
This study evaluated the potential structure‐modifying effects of Hyalgan. The arthroscopy was videotaped and assessed by a blinded assessor. The primary efficacy outcomes were the arthroscopic parameters.
Miltner et al. reported a seven‐week, right to left comparison RCT performed at a single centre in Germany comparing five weekly injections of Hyalart in the impaired knee to no treatment in the contralateral, untreated knee in 43 patients with OA of the knee (Miltner 2002; Schneider 1997). The objective of this trial was to assess the effect of Hyalart on total work and isokinetic muscle strength. This pilot study showed that Hyalart was effective with regard to both clinical outcomes (e.g. relieving pain and improving function) as well as to functional outcomes (e.g. peak torque and total work). Schneider et al. published a preliminary evaluation of this trial in German based on 18 patients (Schneider 1997).
Several design issues were noted: 1) all patients had bilateral disease; 2) the control group received no treatment; and 3) follow‐up was limited to one week after the final injection.
Pietrogrande et al. reported a 60‐day, open, parallel‐group RCT performed at three centres in Italy comparing five weekly injections of Hyalgan to three weekly injections of 6‐methylprednisolone acetate in 90 patients with OA of the knee (Pietrogrande 1991). Although both treatments reduced the disease symptoms 6‐MPA had a more rapid action that did not last as long as that of Hyalgan. At the final assessment significant differences were found between the treatments for most outcome measures. One patient in the Hyalgan group had a local reaction which resolved spontaneously but the patient was withdrawn due to lack of efficacy. No systemic adverse reactions were reported in either group.
St. J. Dixon et al. reported a 48‐week, placebo‐controlled, double‐blind, parallel‐group RCT performed at three centres in England comparing Hyalgan (up to eleven injections over 23 weeks) to vehicle (0.2 mg sodium hyaluronate) in 63 patients with OA of the knee (St. J. Dixon 1988). Knee pain was significantly reduced in the Hyalgan group compared to the placebo group. No between‐group difference was found for function as measured by activities of daily living. Possible treatment‐related (Hyalgan) adverse events occurred in three patients: hemarthrosis developed in one patient, effusion volume increased in one patient, and phlebitis developed in one patient. Ten patients did not complete the trial. Five patients in the placebo group withdrew early because of increased pain; while five patients withdrew early in the Hyalgan group: one because of a torn meniscus, one because knee was painless, one had increased pain, one defaulted and one had a hemarthrosis. No measure of dispersion was reported for pain on movement, pain at rest, or activities of daily living and, consequently, efficacy data are not included in this review. Only safety data are included in this review.
This is the only RCT where up to 11 injections of Hyalgan were used. Fidia Spa kindly provided an in‐house clinical report for pain on movement and rest pain.
Tsai et al. reported a 25‐week, placebo‐controlled, multicentre, double‐blind RCT performed in Taiwan comparing five weekly injections of Hyalgan to five weekly injections of saline in 200 patients with OA of the knee (Tsai 2003). Statistically significant differences were found in favour of Hyalgan for pain on 50‐foot walk, WOMAC OA Index pain and physical function. No differences between treatments were reported in adverse event occurrence.
Fidia Spa kindly provided an in‐house report (Lin 2004) as only an abstract, based on this trial, had been published in 2003 (Tsai 2003).
Hyalgan versus placebo Efficacy Table 16; Table 17; Table 18 Based on 14 comparisons, there was a statistically significant difference in pain on weight bearing, measured on a 0 to 100 mm VAS, in favour of Hyalgan compared to placebo at 1 to 4 weeks postinjection (WMD (random‐effects model) ‐6.20; 95% CI ‐11.02 to ‐1.38, P value 0.009). Hyalgan was 2 to 31% more effective than placebo in improving pain. Based on 10 comparisons, there was a statistically significant difference in favour of Hyalgan compared to placebo at 5 to 13 weeks postinjection (WMD (random‐effects model) ‐9.04; 95% CI ‐14.10 to ‐3.98; P value 0.0005). Hyalgan was 18 to 44% more effective than placebo in improving pain. There was a statistically significant difference in favour of Hyalgan compared to placebo at 14 to 26 weeks postinjection (WMD ‐4.12; 95% CI ‐6.97 to ‐1.27, P value 0.005) (Altman 1998; Huskisson 1999; Jubb 2003; Tsai 2003). Hyalgan was 3 to 26% more effective than placebo in improving pain. There was no statistically significant difference at 45 to 52 weeks postinjection (Dougados 1993; Jubb 2003; St. J. Dixon 1988).
16. Clinical benefit table: Hyalgan versus placebo. Continuous outcome measures (1).
| Study | Time | Treatment | Outcome (scale) | N of Pts | Baseline Mean | End of Study Mean | Absolute Benefit | Relative Difference |
| Carrabba 1995 | 1‐4 wk | E: Hyalgan (5) | Pain on movement (0‐100 mm VAS) | 20 | 63.3 | 41.8 | ‐13.5 (I) | ‐21% (I) |
| C: Saline | 20 | 64.4 | 56.4 | |||||
| Carrabba 1995a | 1‐4 wk | E: Hyalgan (3) | Pain on movement (0‐100 mm VAS) | 20 | 64.2 | 46.0 | ‐10.2 (I) | ‐15.8% (I) |
| C: Saline | 20 | 64.4 | 56.4 | |||||
| Carrabba 1995b | 1‐4 wk | E: Hyalgan (5) | Pain on movement (0‐100 mm VAS) | 20 | 63.3 | 41.8 | ‐16.7 (I) | ‐25.9% (I) |
| C: Arthrocentesis | 20 | 64.5 | 59.7 | |||||
| Carrabba 1995c | 1‐4 wk | E: Hyalgan (3) | Pain on movement (0‐100 mm VAS) | 20 | 64.2 | 46.0 | ‐13.4 (I) | ‐20.8% (I) |
| C: Arthrocentesis | 20 | 64.5 | 59.7 | |||||
| Corrado 1995 | 1‐4 wk | E: Hyalgan | Pain on movement (0‐100 mm VAS) | 19 | 71.2 | 35.4 | ‐18.5 (I) | ‐31.4% (I) |
| C: Saline | 16 | 58.9 | 41.6 | |||||
| Creamer 1994 | 1‐4 wk | E: Hyalgan | Pain use related (0‐100 mm VAS) | 12 | 52.58 | 41.12 | 8.99 (W) | 16.5% (W) |
| C: Saline | 12 | 54.38 | 33.93 | |||||
| Henderson 1994 | 1‐4 wk | E: Hyalgan | Pain active movement (0‐100 mm VAS) | 18 | 43.7 | 28.1 | ‐1.4 (I) | ‐2.3% (I) |
| C: Saline | 19 | 53.0 | 38.8 | |||||
| Henderson 1994a | 1‐4 wk | E: Hyalgan | Pain active movement (0‐100 mm VAS) | 22 | 48.5 | 39.8 | 9.3 (W) | 18.9% (W) |
| C: Saline | 25 | 49.3 | 31.3 | |||||
| Huskisson 1999 | 1‐4 wk | E: Hyalgan | Pain walking (0‐100 mm VAS) | 45 | 67.20 | 35.29 | ‐15.41 (I) | ‐23.88% (I) |
| C: Saline | 48 | 64.52 | 48.02 | |||||
| Jubb 2003 | 1‐4 wk | E: Hyalgan | Pain on walking (0‐100 mm VAS) | 208 | 56.95 | 43.87 | ‐1.8 (I) | ‐3.3% (I) |
| C: Saline | 200 | 55.15 | 43.88 | |||||
| Tsai 2003 | 1‐4 wk | E: Hyalgan | Pain on 50 foot walk (0‐100 mm VAS) | 100 | 47.85 | 22.60 | ‐4.0 (I) | ‐8.9% (I) |
| C: Saline | 98 | 45.15 | 23.92 | |||||
| Carrabba 1995 | 5‐13 wk | E: Hyalgan (5) | Pain on movement (0‐100 mm VAS) | 20 | 63.3 | 42.10 | ‐16.6 (I) | ‐25.8% (I) |
| C: Saline | 20 | 64.4 | 59.80 | |||||
| Carrabba 1995a | 5‐13 wk | E: Hyalgan (3) | Pain on movement (0‐100 mm VAS) | 20 | 64.2 | 47.80 | ‐11.8 (I) | ‐18.3% (I) |
| C: Saline | 20 | 64.4 | 59.80 | |||||
| Carrabba 1995b | 5‐13 wk | E: Hyalgan (5) | Pain on movement (0‐100 mm VAS) | 20 | 63.3 | 42.10 | ‐19.9 (I) | ‐30.9% (I) |
| C: Arthrocentesis | 20 | 64.5 | 63.20 | |||||
| Carrabba 1995c | 5‐13 wk | E: Hyalgan (3) | Pain on movement (0‐100 mm VAS) | 20 | 64.2 | 47.80 | ‐15.1 (I) | ‐23.4% (I) |
| C: Arthrocentesis | 20 | 64.5 | 63.20 | |||||
| Corrado 1995 | 5‐13 wk | E: Hyalgan | Pain on movement (0‐100 mm VAS) | 19 | 71.2 | 29.70 | ‐25.8 (I) | ‐43.8% (I) |
| C: Saline | 16 | 58.9 | 43.20 | |||||
| Creamer 1994 | 5‐13 wk | E: Hyalgan | Pain use related (0‐100 mm VAS) | 12 | 52.58 | 41.80 | 1.80 (W) | 3.3% (W) |
| C: Saline | 12 | 54.38 | 41.80 | |||||
| Huskisson 1999 | 5‐13 wk | E: Hyalgan | Pain walking (0‐100 mm VAS) | 43 | 67.20 | 37.40 | ‐15.46 (I) | ‐23.96% (I) |
| C: Saline | 45 | 64.52 | 50.18 | |||||
| Jubb 2003 | 5‐13 wk | E: Hyalgan | Pain on walking (0‐100 mm VAS) | 208 | 56.95 | 46.51 | ‐4.89 (I) | ‐8.9% (I) |
| C: Saline | 200 | 55.15 | 50.20 | |||||
| Tsai 2003 | 5‐13 wk | E: Hyalgan | Pain on 50 foot walk (0‐100 mm VAS) | 100 | 47.85 | 19.32 | ‐3.16 (I) | ‐7.0% (I) |
| C: Saline | 98 | 45.15 | 19.78 | |||||
| Huskisson 1999 | 14‐26 wk | E: Hyalgan | Pain walking (0‐100 mm VAS) | 39 | 67.20 | 39.44 | ‐16.92 (I) | ‐26.22% (I) |
| C: Saline | 40 | 64.52 | 53.68 | |||||
| Jubb 2003 | 14‐26 wk | E: Hyalgan | Pain on walking (0‐100 mm VAS) | 208 | 56.95 | 50.06 | ‐1.88 (I) | ‐3.4% (I) |
| C: Saline | 200 | 55.15 | 50.14 | |||||
| Tsai 2003 | 14‐26 wk | E: Hyalgan | Pain on 50 foot walk (0‐100 mm VAS) | 100 | 47.85 | 15.57 | ‐7.8 (I) | ‐17.3% (I) |
| C: Saline | 98 | 45.15 | 20.68 | |||||
| Jubb 2003 | 45‐52 wk (RC) | E: Hyalgan | Pain on walking (0‐100 mm VAS) | 208 | 56.95 | 47.59 | ‐4.7 (I) | ‐8.4% (I) |
| C: Saline | 200 | 55.15 | 50.45 | |||||
| Bragantini 1987 | 1‐4 wk | E: Hyalgan | Pain spontaneous (0‐100 mm VAS) | 19 | 47.74 | 17.12 | ‐29.5 (I) | ‐62.5% (I) |
| C: Saline | 18 | 47.29 | 46.21 | |||||
| Grecomoro 1987 | 1‐4 wk | E: Hyalgan | Pain intensity (0‐100 mm VAS) | 20 | 50.71 | 14.55 | ‐22.9 (I) | ‐48.3% (I) |
| C: Phosphate buffer | 18 | 47.32 | 34.02 | |||||
| Bragantini 1987 | 5‐13 wk | E: Hyalgan | Pain spontaneous (0‐100 mm VAS) | 19 | 47.74 | 15.59 | ‐31.8 (I) | ‐67.3% (I) |
| C: Saline | 18 | 47.29 | 46.95 | |||||
| Grecomoro 1987 | 5‐13 wk | E: Hyalgan | Pain intensity (0‐100 mm VAS) | 20 | 50.71 | 20.80 | ‐17.8 (I) | ‐37.6% (I) |
| C: Phosphate buffer | 18 | 47.32 | 35.18 | |||||
| Tsai 2003 | 1‐4 wk | E: Hyalgan | WOMAC pain (0‐100 mm VAS) | 100 | 45.73 | 23.21 | ‐3.31 (I) | ‐7.3% (I) |
| C: Saline | 98 | 45.09 | 25.88 | |||||
| Tsai 2003 | 5‐13 wk | E: Hyalgan | WOMAC pain (0‐100 mm VAS) | 100 | 45.73 | 21.48 | ‐2.13 (I) | ‐4.7% (I) |
| C: Saline | 98 | 45.09 | 22.97 | |||||
| Tsai 2003 | 14‐26 wk | E: Hyalgan | WOMAC pain (0‐100 mm VAS) | 100 | 45.73 | 16.48 | ‐6.30 (I) | ‐14.0% (I) |
| C: Saline | 98 | 45.09 | 22.14 | |||||
| Tsai 2003 | 1‐4 wk | E: Hyalgan | WOMAC function (0‐100 mm VAS) | 100 | 46.54 | 26.91 | ‐2.83 (I) | ‐6.3% (I) |
| C: Saline | 98 | 45.01 | 28.21 | |||||
| Tsai 2003 | 5‐13 wk | E: Hyalgan | WOMAC function (0‐100 mm VAS) | 100 | 46.54 | 24.25 | ‐2.59 (I) | ‐5.8% (I) |
| C: Saline | 98 | 45.01 | 25.31 | |||||
| Tsai 2003 | 14‐26 wk | E: Hyalgan | WOMAC function (0‐100 mm VAS) | 100 | 46.54 | 20.85 | ‐5.58 (I) | ‐12.4% (I) |
| C: Saline | 98 | 45.01 | 24.90 | |||||
| Carrabba 1995 | 1‐4 wk | E: Hyalgan (5) | Lequesne Index (0‐24) | 20 | 15.1 | 11.5 | ‐2.5 (I) | ‐17.2% (I) |
| C: Saline | 20 | 14.5 | 13.4 | |||||
| Carrabba 1995a | 1‐4 wk | E: Hyalgan (3) | Lequesne Index (0‐24) | 20 | 14.9 | 11.6 | ‐2.2 (I) | ‐15.2% (I) |
| C: Saline | 20 | 14.5 | 13.4 | |||||
| Carrabba 1995b | 1‐4 wk | E: Hyalgan (5) | Lequesne Index (0‐24) | 20 | 15.1 | 11.5 | ‐3.4 (I) | ‐23.8% (I) |
| C: Arthrocentesis | 20 | 14.3 | 14.1 | |||||
| Carrabba 1995c | 1‐4 wk | E: Hyalgan (3) | Lequesne Index (0‐24) | 20 | 14.9 | 11.6 | ‐3.1 (I) | ‐21.7% (I) |
| C: Arthrocentesis | 20 | 14.3 | 14.1 | |||||
| Dougados 1993 | 1‐4 wk | E: Hyalectin | Lequesne Index (0‐24) | 49 | 11.71 | 8.53 | ‐1.02 (I) | ‐9.32% (I) |
| C: Saline | 50 | 10.94 | 8.78 | |||||
| Huskisson 1999 | 1‐4 wk | E: Hyalgan | Lequesne Index (0‐24) | 40 | 13.4 | 10.0 | ‐1.5 (I) | ‐10.7% (I) |
| C: Saline | 41 | 14.0 | 12.1 | |||||
| Carrabba 1995 | 5‐13 wk | E: Hyalgan (5) | Lequesne Index (0‐24) | 20 | 15.1 | 11.6 | ‐2.9 (I) | ‐20% (I) |
| C: Saline | 20 | 14.5 | 13.9 | |||||
| Carrabba 1995a | 5‐13 wk | E: Hyalgan (3) | Lequesne Index (0‐24) | 20 | 14.9 | 12.0 | ‐2.3 (I) | ‐15.9% (I) |
| C: Saline | 20 | 14.5 | 13.9 | |||||
| Carrabba 1995b | 5‐13 wk | E: Hyalgan (5) | Lequesne Index (0‐24) | 20 | 15.1 | 11.6 | ‐3.6 (I) | ‐25.2% (I) |
| C: Arthrocentesis | 20 | 14.3 | 14.4 | |||||
| Carrabba 1995c | 5‐13 wk | E: Hyalgan (3) | Lequesne Index (0‐24) | 20 | 14.9 | 12.0 | ‐3.0 (I) | ‐21% (I) |
| C: Arthrocentesis | 20 | 14.3 | 14.4 | |||||
| Huskisson 1999 | 5‐13 wk | E: Hyalgan | Lequesne Index (0‐24) | 40 | 13.4 | 10.2 | ‐1.6 (I) | ‐11.4% (I) |
| C: Saline | 41 | 14.0 | 12.4 | |||||
| Huskisson 1999 | 14‐26 wk | E: Hyalgan | Lequesne Index (0‐24) | 40 | 13.4 | 11.2 | ‐0.8 (I) | ‐5.7% (I) |
| C: Saline | 41 | 14.0 | 12.6 | |||||
| Dougados 1993 | 45‐52 wk | E: Hyalectin | Lequesne Index (0‐24) | 47 | 11.71 | 7.06 | ‐1.88 (I) | ‐17.18% (I) |
| C: Saline | 47 | 10.94 | 8.17 |
17. Clinical benefit table: Hyalgan versus placebo. Continuous outcome measures (2).
| Study | Time | Treatment | Outcome (scale) | N of Pts | Baseline Mean | End of Study Mean | Absolute Benefit | Relative Difference |
| Altman 1998 | 1‐4 wk | E: Hyalgan | Pain after walking 50 feet (0‐100 mm VAS) | 163 | 54 | 25 | 1 (W) | 1.8% (W) |
| C: Saline | 167 | 55 | 25 | |||||
| Altman 1998 | 5‐13 wk | E: Hyalgan | Pain after walking 50 feet (0‐100 mm VAS) | 163 | 54 | 23 | 0 | 0 |
| C: Saline | 167 | 55 | 24 | |||||
| Altman 1998 | 14‐26 wk | E: Hyalgan | Pain after walking 50 feet (0‐100 mm VAS) | 163 | 54 | 18 | ‐2 (I) | ‐3.6% (I) |
| C: Saline | 167 | 55 | 21 | |||||
| Dougados 1993 | 1‐4 wk | E: Hyalectin | Pain on movement (0‐100 mm VAS) | 52 | 67.85 | 34.13 | ‐7.52 (I) | ‐12.16% (I) |
| C: Saline | 50 | 61.82 | 35.62 | |||||
| Dougados 1993 | 45‐52 wk | E: Hyalectin | Pain on movement (0‐100 mm VAS) | 47 | 67.85 | 28.51 | ‐6.87(I) | ‐11.11% (I) |
| C: Saline | 48 | 61.82 | 29.35 | |||||
| Carrabba 1995 | 1‐4 wk | E: Hyalgan (5) | Pain at rest (0‐100 mm VAS) | 20 | 43.6 | 28.3 | ‐7.1 (I) | ‐15.6% (I) |
| C: Saline | 20 | 45.6 | 37.4 | |||||
| Carrabba 1995a | 1‐4 wk | E: Hyalgan (3) | Pain at rest (0‐100 mm VAS) | 20 | 44.7 | 30.3 | ‐6.2 (I) | ‐13.6% (I) |
| C: Saline | 20 | 45.6 | 37.4 | |||||
| Carrabba 1995b | 1‐4 wk | E: Hyalgan (5) | Pain at rest (0‐100 mm VAS) | 20 | 43.6 | 28.3 | ‐12.4 (I) | ‐28.6% (I) |
| C: Arthrocentesis | 20 | 43.3 | 40.4 | |||||
| Carrabba 1995c | 1‐4 wk | E: Hyalgan (3) | Pain at rest (0‐100 mm VAS) | 20 | 44.7 | 30.3 | ‐11.5 (I) | ‐26.6% (I) |
| C: Arthrocentesis | 20 | 43.3 | 40.4 | |||||
| Corrado 1995 | 1‐4 wk | E: Hyalgan | Pain at rest (0‐100 mm VAS) | 19 | 22.5 | 9.4 | ‐8.5 (I) | ‐62% (I) |
| C: Saline | 16 | 13.7 | 9.1 | |||||
| Dougados 1993 | 1‐4 wk | E: Hyalectin | Pain at rest (0‐100 mm VAS) | 52 | 31.44 | 10.87 | ‐7.72 (I) | ‐28.03% (I) |
| C: Saline | 48 | 27.54 | 14.69 | |||||
| Henderson 1994 | 1‐4 wk | E: Hyalgan | Pain at rest (0‐100 mm VAS) | 18 | 20.8 | 17.7 | ‐4.1 (I) | ‐13.5% (I) |
| C: Saline | 19 | 30.3 | 31.3 | |||||
| Henderson 1994a | 1‐4 wk | E: Hyalgan | Pain at rest (0‐100 mm VAS) | 22 | 25.2 | 25.3 | 15 (W) | 38.5% (W) |
| C: Saline | 25 | 38.9 | 24.0 | |||||
| Carrabba 1995 | 5‐13 wk | E: Hyalgan (5) | Pain at rest (0‐100 mm VAS) | 20 | 43.6 | 29.3 | ‐8.6 (I) | ‐18.9% (I) |
| C: Saline | 20 | 45.6 | 39.9 | |||||
| Carrabba 1995a | 5‐13 wk | E: Hyalgan (3) | Pain at rest (0‐100 mm VAS) | 20 | 44.7 | 33.0 | ‐6 (I) | ‐13.2% (I) |
| C: Saline | 20 | 45.6 | 39.9 | |||||
| Carrabba 1995b | 5‐13 wk | E: Hyalgan (5) | Pain at rest (0‐100 mm VAS) | 20 | 43.6 | 29.3 | ‐14.2 (I) | ‐32.8% (I) |
| C: Arthrocentesis | 20 | 43.3 | 43.2 | |||||
| Carrabba 1995c | 5‐13 wk | E: Hyalgan (3) | Pain at rest (0‐100 mm VAS) | 20 | 44.7 | 33.0 | ‐11.6 (I) | ‐26.8% (I) |
| C: Arthrocentesis | 20 | 43.3 | 43.2 | |||||
| Corrado 1995 | 5‐13 wk | E: Hyalgan | Pain at rest (0‐100 mm VAS) | 19 | 22.5 | 5.1 | ‐15.9 (I) | ‐116.1% (I) |
| C: Saline | 16 | 13.7 | 12.2 | |||||
| Dougados 1993 | 45‐52 wk | E: Hyalectin | Pain at rest (0‐100 mm VAS) | 47 | 31.44 | 11.87 | ‐1.68 (I) | ‐6.10% (I) |
| C: Saline | 48 | 27.54 | 9.65 | |||||
| Henderson 1994 | 1‐4 wk | E: Hyalgan | Pain at night (0‐100 mm VAS) | 18 | 69.6 | 45.50 | ‐10.3 (I) | ‐15.1% (I) |
| C: Saline | 19 | 68.0 | 54.20 | |||||
| Henderson 1994a | 1‐4 wk | E: Hyalgan | Pain at night (0‐100 mm VAS) | 22 | 68.3 | 60.20 | 4.4 (W) | 6% (W) |
| C: Saline | 25 | 73.3 | 60.80 | |||||
| Corrado 1995 | 1‐4 wk | E: Hyalgan | Flexion (degrees) | 19 | 114.7 | 123.5 | 2.1 (I) | 1.9% (I) |
| C: Saline | 16 | 113.3 | 120.0 | |||||
| Corrado 1995 | 5‐13 wk | E: Hyalgan | Flexion (degrees) | 19 | 114.7 | 125.5 | 6.2 (I) | 5.5% (I) |
| C: Saline | 16 | 113.3 | 117.9 | |||||
| Corrado 1995 | 1‐4 wk | E: Hyalgan | Synovial fluid volume (ml) | 21 | 20.3 | 14.10 | ‐2.3 (I) | ‐15% (I) |
| C: Saline | 19 | 15.3 | 11.40 | |||||
| Dougados 1993 | 1‐4 wk | E: Hyalectin | Synovial fluid volume (ml) | 55 | 18.5 | 6.10 | ‐6.4 (I) | ‐46% (I) |
| C: Saline | 55 | 13.9 | 7.90 | |||||
| Corrado 1995 | 5‐13 wk | E: Hyalgan | Synovial fluid volume (ml) | 21 | 20.3 | 2.30 | ‐13.1 (I) | ‐85.6% (I) |
| C: Saline | 19 | 15.3 | 10.40 | |||||
| Jubb 2001a | 45‐52 wk | E: Hyalgan | Joint space width (mm) | 136 | 4.9 | 4.80 | 0 | 0 |
| C: Saline | 137 | 4.5 | 4.40 | |||||
| Jubb 2001b | 45‐52 wk | E: Hyalgan | Joint space width (mm) | 76 | 5.9 | 5.80 | 0.4 (I) | 6.8% (I) |
| C: Saline | 63 | 5.9 | 5.40 | |||||
| Jubb 2001c | 45‐52 wk | E: Hyalgan | Joint space width (mm) | 60 | 3.5 | 3.50 | ‐0.2 (W) | ‐5.9% (W) |
| C: Saline | 74 | 3.4 | 3.60 | |||||
| St. J. Dixon 1988 | 1‐4 wk | E: Hyalgan | Pain on movement (0‐100 mm VAS) | 28 | 66.52 | 50.54 | ‐14.13 (I) | ‐21.17% (I) |
| C: Vehicle | 33 | 66.76 | 64.91 | |||||
| St. J. Dixon 1988 | 45‐52 wk (repeat) | E: Hyalgan | Pain on movement (0‐100 mm VAS) | 11 | 66.52 | 48.45 | ‐8.31(I) | ‐12.45% (I) |
| C: Vehicle | 13 | 66.76 | 57.00 | |||||
| St. J. Dixon 1988 | 1‐4 wk | E: Hyalgan | Pain at rest (0‐100 mm VAS) | 29 | 30.86 | 20.50 | ‐11.61 (I) | ‐54.28% (I) |
| C: Vehicle | 33 | 21.39 | 22.64 | |||||
| St. J. Dixon 1988 | 45‐52 wk (repeat) | E: Hyalgan | Pain at rest (0‐100 mm VAS) | 11 | 30.86 | 25.36 | ‐4.97 (I) | ‐23.24% (I) |
| C: Vehicle | 14 | 21.39 | 20.86 |
18. Clinical benefit table: Hyalgan versus placebo. Dichotomous outcome measures.
| Study | Time | Treatment group | Outcome | No. improved | No. of pts | Risk (%) | Risk Difference | NNT |
| Creamer 1994 | 1‐4 wk | T: Hyalgan | Number of joints without night pain | 7 | 12 | 58 | 16 | 6.3 |
| C: Saline | 5 | 12 | 42 | |||||
| Creamer 1994 | 5‐13 wk | T: Hyalgan | Number of joints without night pain | 7 | 12 | 58 | 16 | 6.3 |
| C: Saline | 5 | 12 | 42 | |||||
| Creamer 1994 | 1‐4 wk | T: Hyalgan | Number of joints without rest pain | 6 | 12 | 50 | 8 | 12.5 |
| C: Saline | 5 | 12 | 42 | |||||
| Creamer 1994 | 5‐13 wk | T: Hyalgan | Number of joints without rest pain | 5 | 12 | 42 | 25 | 4 |
| C: Saline | 2 | 12 | 17 | |||||
| Grecomoro 1987 | 1 wk | T: Hyalgan | Number of joints with improvement in pain under load/walking | 16 | 20 | 80 | 58 | 1.7 |
| C: Phosphate buffer | 4 | 18 | 22 | |||||
| Grecomoro 1987 | 1 wk | T: Hyalgan | Number of joints with improvement on pain on touch | 15 | 20 | 75 | 42 | 2.4 |
| C: Phosphate buffer | 6 | 18 | 33 | |||||
| Altman 1998 | 14‐26 wk | T: Hyalgan | Number of patients with moderate/marked pain | 36 | 105 | 34 | ‐12 | ‐8.3 |
| C: Saline | 53 | 115 | 46 | |||||
| Corrado 1995 | 1‐4 wk | T: Hyalgan | Patient global assessment (number of patients improved) | 6 | 19 | 32 | ‐43 | ‐2.3 |
| C: Saline | 12 | 16 | 75 | |||||
| Creamer 1994 | 1‐4 wk | T: Hyalgan | Patient global assessment (number of patients improved) | 5 | 12 | 42 | 9 | 11.1 |
| C: Saline | 4 | 12 | 33 | |||||
| Formiguera Sala 1995 | 1‐4 wk | T: Hyalgan | Patient global assessment (number of patients improved) | 8 | 20 | 40 | ‐15 | ‐6.7 |
| C: Saline | 11 | 20 | 55 | |||||
| Corrado 1995 | 5‐13 wk | T: Hyalgan | Patient global assessment (number of patients improved) | 14 | 19 | 74 | ‐1 | ‐10 |
| C: Saline | 12 | 16 | 75 | |||||
| Formiguera Sala 1995 | 5‐13 wk | T: Hyalgan | Patient global assessment (number of patients improved) | 6 | 20 | 30 | ‐35 | ‐2.9 |
| C: Saline | 13 | 20 | 65 | |||||
| Henderson 1994 | 14‐26 wk | T: Hyalgan | Patient global assessment (number of patients improved) | 17 | 40 | 43 | 4 | 25 |
| C: Saline | 17 | 44 | 39 | |||||
| Huskisson 1999 | 14‐26 wk | T: Hyalgan | Patient global assessment (number of patients improved) | 10 | 40 | 25 | ‐32 | ‐3.1 |
| C: Saline | 22 | 41 | 57 | |||||
| Dougados 1993 | 45‐52 wk | T: Hyalectin | Number of patients rating treatment effective | 31 | 47 | 66 | ‐10 | ‐10 |
| C: Saline | 27 | 48 | 56 | |||||
| Bragantini 1987 | 5‐13 wk | T: Hyalgan | Number of joints fairly good, good, very good | 2 | 19 | 11 | ‐56 | ‐1.8 |
| C: Saline | 12 | 18 | 67 | |||||
| Creamer 1994 | 5‐13 wk | T: Hyalgan | Number of joints fairly good, good, very good | 5 | 12 | 42 | 9 | 11.1 |
| C: Saline | 4 | 12 | 33 | |||||
| Jubb 2003 | 5‐13 wk | T: Hyalgan | Pain (number of patients improved) | 88 | 208 | 42 | 6 | 16.7 |
| C: Saline | 71 | 200 | 36 | |||||
| Jubb 2003 | 32 wk | T: Hyalgan | Pain (number of patients improved) | 92 | 208 | 44 | 11 | 9.1 |
| C: Saline | 65 | 200 | 33 | |||||
| Bragantini 1987 | End of treatment | T: Hyalgan | Number of joints improved in walking pain | 16 | 19 | 84 | 34 | 2.9 |
| C: Saline | 9 | 18 | 50 | |||||
| Bragantini 1987 | 5‐13 wk | T: Hyalgan | Number of joints improved in walking pain | 17 | 19 | 89 | 50 | 2 |
| C: Saline | 7 | 18 | 39 | |||||
| Grecomoro 1987 | 1 wk | T: Hyalgan | Number of joints improved in walking pain | 16 | 20 | 80 | 58 | 1.7 |
| C: Phosphate buffer | 4 | 18 | 22 | |||||
| Bragantini 1987 | End of treatment | T: Hyalgan | Number of joints with improvement in pain under load | 6 | 18 | 33 | ‐56 | ‐1.8 |
| C: Saline | 17 | 19 | 89 | |||||
| Bragantini 1987 | 5‐13 wk | T: Hyalgan | Number of joints with improvement in pain under load | 4 | 18 | 22 | ‐67 | ‐1.5 |
| C: Saline | 17 | 19 | 89 |
There was a statistically significant difference in spontaneous pain, measured on a 0 to 100 mm VAS, in favour of Hyalgan compared to placebo at 1 to 4 weeks postinjection (WMD ‐23.88; 95% CI ‐33.50 to ‐14.25, P value < 0.00001), and at 5 to 13 weeks postinjection (WMD (random‐effects model) ‐22.28; 95% CI ‐38.88 to ‐5.68, P value 0.009) (Bragantini 1987; Grecomoro 1987). Hyalgan was 38 to 67% more effective than placebo in improving pain.
There was a statistically significant difference in pain at rest, measured on a 0 to 100 mm VAS, in favour of Hyalgan compared to placebo at 1 to 4 weeks postinjection (WMD (random‐effects model) ‐6.37; 95% CI ‐11.57 to ‐1.18, P value 0.02) (Carrabba 1995; Carrabba 1995a; Carrabba 1995b; Carrabba 1995c; Corrado 1995; Dougados 1993; Henderson 1994; Henderson 1994a; St. J. Dixon 1988), and at 5 to 13 weeks postinjection (WMD ‐9.65; 95% CI ‐14.18 to ‐5.13, P value 0.00003) (Carrabba 1995; Carrabba 1995a; Carrabba 1995b; Carrabba 1995c; Corrado 1995). Hyalgan was 13 to 116% more effective than placebo in improving pain. There was no statistically significant difference at 45 to 52 weeks postinjection (Dougados 1993; St. J. Dixon 1988).
There was no statistically significant difference in pain at night, measured on a 0 to 100 mm VAS, between Hyalgan and placebo at 5 to 13 weeks post injection (Henderson 1994; Henderson 1994a).
There were no statistically significant differences in WOMAC OA Index pain, measured on a 0 to 100 mm VAS, between Hyalgan and placebo at 1 to 4 weeks or at 5 to 13 weeks postinjection. There was a statistically significant difference in favour of Hyalgan compared to saline at 14 to 26 weeks postinjection (WMD ‐5.66; 95% CI ‐10.06 to ‐1.26, P value 0.01) (Lin 2004, Tsai 2003) with Hyalgan being 14% more effective than saline.
Pain was measured using several dichotomous outcome measures.
There were statistically significant differences in favour of Hyalgan compared to placebo for the number of joints improved for walking pain at the end of treatment (RR 1.68; 95% CI 1.02 to 2.78, P value 0.04) (Bragantini 1987); at 1 week postinjection (RR 3.60; 95% CI 1.48 to 8.78, P value 0.005) (Grecomoro 1987); and at 5 to 13 weeks postinjection (RR 2.30; 95% CI 1.26 to 4.19, P value 0.006) (Bragantini 1987). The NNT for walking pain was 2 to 3. Similarly, statistically significant differences in favour of Hyalgan compared to placebo were found for the number of joints improved for pain under load at the end of treatment (RR 0.37; 95% CI 0.19 to 0.73, P value 0.004) (Bragantini 1987); at 1 week postinjection (RR 3.60; 95% CI 1.48 to 8.78, P value 0.005) (Grecomoro 1987); and at 5 to 13 weeks postinjection (RR 0.25; 95% CI 0.10 to 0.60, P value 0.002) (Bragantini 1987). The NNT for pain under load was 2.
There was no statistically significant difference in pain, expressed as the number of patients improved, at 5 to 13 weeks postinjection. The RevMan analysis differed from the publication analysis where the P value was 0.04 (chi square test). A significant difference in favour of Hyalgan compared to placebo was found at 32 weeks postinjection (RR 1.36; 95% CI 1.06 to 1.75, P value 0.02) (Jubb 2003). The NNT for patient global assessment was 9.
There was no statistically significant difference in the number of patients who had moderate to marked pain or in those who had none to slight to mild pain at 14 to 26 weeks postinjection (Altman 1998).
There were no statistically significant differences in the number of knee joints without night pain at 1 to 4 or at 5 to 13 weeks postinjection (Creamer 1994). There were no statistically significant differences in the number of participants without rest pain at 1 to 4 or at 5 to 13 weeks postinjection (Creamer 1994).
There was a statistically significant difference in the number of joints with improvement in pain on touch in favour of Hyalgan compared to placebo (RR 2.25; 95% CI 1.12 to 4.53, P value 0.02) (Grecomoro 1987). The NNT for pain on touch was 2.
There were no statistically significant differences in WOMAC OA Index physical function, measured on a 0 to 100 mm VAS, between Hyalgan and saline at 1 to 4, 5 to 13, or 14 to 26 weeks postinjection (Lin 2004; Tsai 2003). The RevMan analysis (WMD ‐4.05; 95% CI ‐8.38 to 0.28, P value 0.07) differed from the publication analysis where a statistically significant difference was found in favour of Hyalgan in WOMAC physical function from baseline to week 25 (P value 0.0038 (ANOVA)).
Statistically significant differences in the Lequesne Index, measured on a 0 to 24 scale, in favour of Hyalgan compared to placebo were found at 1 to 4 weeks postinjection (WMD ‐1.50; 95% CI ‐2.36 to ‐0.65, P value 0.0006) (Carrabba 1995; Carrabba 1995a; Carrabba 1995b; Carrabba 1995c; Dougados 1993; Huskisson 1999), and at 5 to 13 weeks postinjection (WMD ‐2.34; 95% CI ‐3.41 to ‐1.27, P value 0.00002) (Carrabba 1995; Carrabba 1995a; Carrabba 1995b; Carrabba 1995c; Huskisson 1999). Hyalgan was 11 to 25% more effective than placebo. No statistically significant difference was found at 14 to 26 weeks postinjection (Huskisson 1999) or at 45 to 52 weeks postinjection (Dougados 1993). The RevMan analysis (WMD ‐1.11; 95% CI ‐2.70 to 0.48, P value 0.17) differed from the Dougados publication (Dougados 1993) which reported a statistically significant difference (P value 0.046) in the Lequesne Index at week 52.
Although not recommended as core‐set outcome measures, data were extracted on range of motion, synovial fluid volume, and joint space width. There was no statistically significant difference in flexion, measured in degrees, between Hyalgan and placebo at 1 to 4 weeks postinjection, but Hyalgan was significantly better than placebo at 5 to 13 weeks postinjection (WMD 7.60; 95% CI 0.46 to 14.74, P value 0.04) (Corrado 1995). Hyalgan was 6% more effective in improving flexion than placebo. There were no statistically significant differences in synovial fluid volume, measured in ml, between Hyalgan and placebo at 1 to 4 weeks postinjection (Corrado 1995; Creamer 1994; Dougados 1993), or at 5 to 13 weeks postinjection (Corrado 1995; Creamer 1994). There was a statistically significant difference in joint space width, measured in mm, in favour of Hyalgan compared to placebo at 45 to 52 weeks postinjection (WMD 0.40; 95% CI 0.03 to 0.77, P value 0.03) (Jubb 2003). However, when the treatment groups were stratified by baseline joint space width, there was no statistically significant difference (Jubb 2003). These RevMan analyses differed from the Jubb publication (Jubb 2003) analysis where no difference was found in the total population but a difference in favour of the subgroup with joint space width equal to or greater than 4.6 mm at baseline was reported.
There was no statistically significant difference between Hyalgan and placebo in patient global assessment, measured as number of patients improved, at 1 to 4 weeks postinjection (Corrado 1995; Creamer 1994; Formiguera Sala 1995). A statistically significant difference was found in favour of Hyalgan compared to placebo at 5 to 13 weeks postinjection (RR 2.44; 95% CI 1.43 to 4.16, P value 0.0010) (Corrado 1995; Formiguera Sala 1995). The NNT for patient global assessment was 10. A statistically significant difference was found in favour of Hyalgan compared to placebo at 14 to 26 weeks postinjection (RR 1.24; 95% CI 1.03 to 1.50, P value 0.02) (Henderson 1994; Huskisson 1999; Lin 2004). No statistically significant difference was found at 45 to 52 weeks postinjection in the number of patients rating treatment effective (Dougados 1993). When patient global assessment was measured by the number of joints that were fairly good to very good, a statistically significant difference in favour of Hyalgan compared to placebo was found at 5 to 13 weeks postinjection (RR 2.12; 95% CI 1.22 to 3.70, P value 0.008) (Bragantini 1987; Creamer 1994). The NNT for patient global assessment was 11. Safety There were no statistically significant differences in the total number of withdrawals overall at 5 to 13 weeks postinjection (Carrabba 1995; Corrado 1995); at 14 to 26 weeks postinjection (Altman 1998; Henderson 1994; Huskisson 1999; Lin 2004); or at 45 at 52 weeks postinjection (Dougados 1993; Jubb 2003; St. J. Dixon 1988). There were no statistically significant differences in the number of withdrawals due to lack of efficacy during the treatment phase (Dougados 1993) or 14 to 26 weeks postinjection (Altman 1998; Huskisson 1999; Lin 2004). A statistically significant difference in favour of placebo compared to Hyalgan was found in the number of patients with local adverse events that caused discontinuation of study drug (RR 3.34; 95% CI 1.31 to 8.56, P value 0.01) (Altman 1998; Dougados 1993; Henderson 1994; Jubb 2003). Similarly, there was a statistically significant difference in favour of placebo compared to Hyalgan found in the number of patients with local adverse events but the study drug was continued (RR 1.42; 95% CI 1.10 to 1.84, P value 0.007). There was no statistically significant difference in the number of patients with serious adverse events at 14 to 26 weeks postinjection (Huskisson 1999; Lin 2004). There was a trend of more serious adverse events in the Hyalgan group compared to the placebo group at 45 to 52 weeks postinjection (RR 1.85; 95% CI 1.00 to 34.3, P value 0.05) (Dougados 1993, Jubb 2003). There was a trend of more patients withdrawing due to adverse events in the Hyalgan group compared to the placebo group (RR 2.35; 95% CI 0.99 to 5.56, P value 0.05) (Huskisson 1999, Jubb 2003). There was no statistically significant difference in the number of knee joints with local adverse events (Bragantini 1987; Creamer 1994). There was no statistically significant difference in the number of patients with injection site pain (Altman 1998; Dougados 1993; Formiguera Sala 1995). There was no statistically significant difference in the number of patients with treatment‐related adverse events at 5 to 13 weeks postinjection, 0% in both the Hyalgan and control groups (Formiguera Sala 1995). There was a statistically significant difference in the number of patients with treatment‐related adverse events at 14 to 26 weeks postinjection (RR 2.19; 95% CI 1.18 to 4.07, P value 0.01) (Bunyaratavej 2001; Henderson 1994; Huskisson 1999) but not at 45 to 52 weeks postinjection. In the Altman trial (Altman 1998) at 14 to 26 week postinjection, there was a statistically significant difference in the number of patients with gastrointestinal complaints in favour of placebo compared to Hyalgan (RR 1.89; 95% CI 1.24 to 2.90, P value 0.003). There was no statistically significant difference in the number of patients with local skin rash at 14 to 26 weeks postinjection (Altman 1998).
Hyalgan versus arthroscopy
19. Clinical benefit table: Hyalgan versus arthroscopy. Continuous outcome measures.
| Study | TIme | Treatment | Outcome (scale) | N of Pts | Baseline Mean | End of Study Mean | Absolute Benefit | Relative Difference |
| Forster 2003 | 1 wk | T: Hyalgan | Pain (0‐10 cm VAS) | 18 | 7.6 | 6.6 | 1.0 (W) | 13.4% (W) |
| C: Arthroscopy | 15 | 7.5 | 5.4 | |||||
| Forster 2003 | 5‐13 wk | T: Hyalgan | Pain (0‐10 cm VAS) | 18 | 7.6 | 6.0 | ‐0.1 (I) | ‐1.5% (I) |
| C: Arthroscopy | 15 | 7.5 | 6.0 | |||||
| Forster 2003 | 14‐26 wk | T: Hyalgan | Pain (0‐10 cm VAS) | 18 | 7.6 | 5.3 | ‐1.1 (I) | ‐14.1% (I) |
| C: Arthroscopy | 15 | 7.5 | 6.2 | |||||
| Forster 2003 | 45‐52 wk | T: Hyalgan | Pain (0‐10 cm VAS) | 18 | 7.6 | 5.7 | ‐0.2 (I) | ‐2.3% (I) |
| C: Arthroscopy | 15 | 7.5 | 5.7 | |||||
| Forster 2003 | 1 wk | T: Hyalgan | Knee Society Function Scale | 18 | 64.4 | 66.5 | ‐5.6 (W) | ‐13.3% (W) |
| C: Arthroscopy | 15 | 42.0 | 49.6 | |||||
| Forster 2003 | 5‐13 wk | T: Hyalgan | Knee Society Function Scale | 18 | 64.4 | 67.5 | 6.3 (W) | 14.9% (W) |
| C: Arthroscopy | 15 | 42.0 | 51.3 | |||||
| Forster 2003 | 14‐26 wk | T: Hyalgan | Knee Society Function Scale | 18 | 64.4 | 73.5 | 1.0 (I) | 2.4% (I) |
| C: Arthroscopy | 15 | 42.0 | 50.0 | |||||
| Forster 2003 | 45‐52 wk | T: Hyalgan | Knee Society Function Scale | 18 | 64.4 | 75.0 | 1.5 (I) | 3.5% (I) |
| C: Arthroscopy | 15 | 42.0 | 51.1 | |||||
| Forster 2003 | 1 wk | T: Hyalgan | Lequesne Index (0‐24) | 18 | 11.4 | 11.1 | 2.4 (W) | 18.1% (W) |
| C: Arthroscopy | 15 | 13.3 | 10.5 | |||||
| Forster 2003 | 5‐13 wk | T: Hyalgan | Lequesne Index (0‐24) | 18 | 11.4 | 10.9 | 1.3 (W) | 9.8% (W) |
| C: Arthroscopy | 15 | 13.3 | 11.5 | |||||
| Forster 2003 | 14‐26 wk | T: Hyalgan | Lequesne Index (0‐24) | 18 | 11.4 | 8.7 | ‐1.2 (I) | ‐8.6% (I) |
| C: Arthroscopy | 15 | 13.3 | 11.7 | |||||
| Forster 2003 | 45‐52 wk | T: Hyalgan | Lequesne Index (0‐24) | 18 | 11.4 | 8.3 | ‐1.1 (I) | ‐7.9% (I) |
| C: Arthroscopy | 15 | 13.3 | 11.2 |
One trial was included which was a comparison of Hyalgan and arthroscopy (Forster 2003; Forster 2003a). Efficacy In the comparison against arthroscopy, there was no statistically significant difference between Hyalgan and arthroscopy in pain (0 to 10 cm VAS) or in the Lequesne Index (0 to 24) at any of the four assessments: 1 to 4, 5 to 13, 14 to 26 or 45 to 52 weeks postinjection. Although there was a statistically significant difference between groups pre‐trial for the Knee Society Function scale score (i.e. Hyalgan group better score), except for the 14 to 26 week assessment (WMD 23.50; 95% CI 1.68 to 45.32, P value 0.03) (i.e. Hyalgan was 2% more effective than arthroscopy), there was no statistically significant difference between Hyalgan and arthroscopy at 1 to 4, 5 to 13 or 45 to 52 weeks postinjection. There was no statistically significant difference between the number of patients requiring further intervention.
The RevMan analysis differed from the Forster publication (Forster 2003) analysis. The publication reported no difference in the Knee Society Function scale at six months whereas the RevMan analysis detected a statistically significant difference (P value 0.03) in favour of Hyalgan over arthroscopy. Safety There was no statistically significant difference in the number of withdrawals overall: Hyalgan 2 out of 19 versus arthroscopy 4 of 19. There was no statistically significant difference in the number of patients with pain at the injection site: Hyalgan 2 out of 19 versus arthroscopy 0 out of 19.
Hyalgan versus corticosteroid
Five RCTs that were included were comparisons of Hyalgan and IA corticosteroid.
Four RCT were comparisons of Hyalgan and methylprednisolone acetate (Depomedrol, MPA) (Frizziero 2002; Leardini 1987; Leardini 1991; Pietrogrande 1991) and one RCT was a comparison of Hyalgan and triamcinolone hexacetonide (Jones 1995). Efficacy
20. Clinical benefit table: Hyalgan versus corticosteroids and other IA therapy. Dic.
| Study | Time | Treatment group | Outcome | No. improved | No. of pts | Risk (%) | Risk Difference | NNT |
| Leardini 1987 | 1‐4 wk | T: Hyalgan | Number of joints with moderate/severe pain under load | 8 | 20 | 40 | 0 | |
| C: MPA | 8 | 20 | 40 | |||||
| Leardini 1991 | 1‐4 wk | T: Hyalgan | Number of patients with moderate/severe pain under load | 14 | 20 | 70 | 25 | 4 |
| C: MPA | 19 | 20 | 95 | |||||
| Pietrogrande 1991 | 1‐4 wk | T: Hyalgan | Number of patients with moderate/severe pain under load | 21 | 45 | 47 | 7 | 14.3 |
| C: MPA | 18 | 45 | 40 | |||||
| Leardini 1987 | 5‐13 wk | T: Hyalgan | Number of joints with moderate/severe pain under load | 6 | 20 | 30 | 5 | 20 |
| C: MPA | 7 | 20 | 35 | |||||
| Leardini 1991 | 5‐13 wk | T: Hyalgan | Number of patients with moderate/severe pain under load | 13 | 20 | 65 | 35 | 2.9 |
| C: MPA | 20 | 20 | 100 | |||||
| Pietrogrande 1991 | 5‐13 wk | T: Hyalgan | Number of patients with moderate/severe pain under load | 13 | 44 | 30 | 21 | 4.8 |
| C: MPA | 23 | 45 | 51 | |||||
| Leardini 1987 | 45‐52 wk | T: Hyalgan | Number of joints with moderate/severe pain under load | 8 | 15 | 53 | 12 | 8.3 |
| C: MPA | 11 | 17 | 65 | |||||
| Leardini 1987 | 1‐4 wk | T: Hyalgan | Number of joints with moderate/severe walking pain | 11 | 20 | 55 | 10 | 10 |
| C: MPA | 9 | 20 | 45 | |||||
| Leardini 1987 | 5‐13 wk | T: Hyalgan | Number of joints with moderate/severe walking pain | 8 | 20 | 40 | 10 | 10 |
| C: MPA | 10 | 20 | 50 | |||||
| Leardini 1987 | 45‐52 wk | T: Hyalgan | Number of joints with moderate/severe walking pain | 11 | 15 | 73 | 2 | 50 |
| C: MPA | 12 | 17 | 71 | |||||
| Leardini 1991 | 1‐4 wk | T: Hyalgan | Number of patients with at least moderate or greater night pain | 1 | 20 | 5 | 15 | 6.7 |
| C: MPA | 4 | 20 | 20 | |||||
| Pietrogrande 1991 | 1‐4 wk | T: Hyalgan | Number of patients with at least moderate or greater night pain | 5 | 45 | 11 | 9 | 11.1 |
| C: MPA | 1 | 45 | 2 | |||||
| Leardini 1991 | 5‐13 wk | T: Hyalgan | Number of patients with at least moderate or greater night pain | 0 | 20 | 0 | 20 | 5 |
| C: MPA | 4 | 20 | 20 | |||||
| Pietrogrande 1991 | 5‐13 wk | T: Hyalgan | Number of patients with at least moderate or greater night pain | 0 | 44 | 0 | ||
| C: MPA | 2 | 45 | 4 | 4 | 25 | |||
| Leardini 1991 | 1‐4 wk | T: Hyalgan | Number of patients with moderate or greater rest pain | 6 | 20 | 30 | 30 | 3.3 |
| C: MPA | 12 | 20 | 60 | |||||
| Pietrogrande 1991 | 1‐4 wk | T: Hyalgan | Number of patients with moderate or greater rest pain | 7 | 45 | 16 | 0 | 0 |
| C: MPA | 7 | 45 | 16 | |||||
| Leardini 1991 | 5‐13 wk | T: Hyalgan | Number of patients with moderate or greater rest pain | 6 | 20 | 30 | 45 | 2.2 |
| C: MPA | 15 | 20 | 75 | |||||
| Pietrogrande 1991 | 5‐13 wk | T: Hyalgan | Number of patients with moderate or greater rest pain | 1 | 44 | 2 | 5 | 20 |
| C: MPA | 3 | 45 | 7 | |||||
| Frizziero 2002 | 1‐4 wk | T: Hyalgan | Patient global (number of patients very good/good) | 21 | 46 | 46 | ‐40 | 2.5 |
| C: MPA | 32 | 37 | 86 | |||||
| Leardini 1991 | 1‐4 wk | T: Hyalgan | Patient global (number of patients very good/good) | 11 | 20 | 55 | 10 | 10 |
| C: MPA | 9 | 20 | 45 | |||||
| Pietrogrande 1991 | 1‐4 wk | T: Hyalgan | Patient global (number of patients very good/good) | 32 | 45 | 71 | 24 | 4.2 |
| C:MPA | 21 | 45 | 47 | |||||
| Leardini 1991 | 5‐13 wk | T: Hyalgan | Patient global (number of patients very good/good) | 10 | 20 | 50 | 15 | 6.7 |
| C: MPA | 7 | 20 | 35 | |||||
| Pietrogrande 1991 | 5‐13 wk | T: Hyalgan | Patient global (numbe of patients very good/good) | 31 | 45 | 69 | 36 | 2.8 |
| C: MPA | 15 | 45 | 33 | |||||
| Frizziero 2002 | 14‐26 wk | T: Hyalgan | Patient global (number of patients very good/good) | 30 | 38 | 79 | 4 | 25 |
| C: MPA | 24 | 32 | 75 | |||||
| Graf 1993 (other ia therapy) | 14‐26 wk | T: Hyalgan | Patient global (number of patients symptom free/markedly improved) | 25 | 33 | 76 | 30 | 3.3 |
| C: Mucopolysaccharide polysulfuric acid ester | 11 | 24 | 46 |
21. Clinical benefit table: Hyalgan vs corticosteroids and other IA therapy. Continu.
| Study | Time | Treatment | Outcome (scale) | N of Pts | Baseline Mean | End of Study Mean | Absolute Benefit | Relative Difference |
| Leardini 1987 | 1‐4 wk | T: Hyalgan | Pain intensity (0‐100 mm VAS) | 20 | 41.30 | 13.00 | ‐4.5 (I) | ‐13.5% (I) |
| C: MPA | 20 | 33.40 | 9.60 | |||||
| Leardini 1991 | 1‐4 wk | T: Hyalgan | Pain intensity (0‐100 mm VAS) | 20 | 47.40 | 10.73 | ‐14.0 (I) | ‐32.1% (I) |
| C: MPA | 20 | 43.54 | 20.83 | |||||
| Pietrogrande 1991 | 1‐4 wk | T: Hyalgan | Pain intensity (0‐100 mm VAS) | 45 | 64.89 | 20.00 | ‐5.3 (I) | ‐8.2% (I) |
| C: MPA | 45 | 64.89 | 25.32 | |||||
| Leardini 1987 | 5‐13 wk | T: Hyalgan | Pain intensity (0‐100 mm VAS) | 20 | 41.30 | 11.20 | ‐5.8 (I) | ‐17.4% (I) |
| C: MPA | 20 | 33.40 | 9.10 | |||||
| Leardini 1991 | 5‐13 wk | T: Hyalgan | Pain intensity (0‐100 mm VAS) | 20 | 47.40 | 9.48 | ‐17.7 (I) | ‐40.7% (I) |
| C: MPA | 20 | 43.54 | 23.33 | |||||
| Pietrogrande 1991 | 5‐13 wk | T: Hyalgan | Pain intensity (0‐100 mm VAS) | 45 | 64.89 | 19.71 | ‐7.3 (I) | ‐11.3% (I) |
| C: MPA | 45 | 64.89 | 27.05 | |||||
| Leardini 1987 | 45‐52 wk | T: Hyalgan | Pain intensity (0‐100 mm VAS) | 15 | 41.30 | 20.30 | ‐5.4 (I) | ‐16.2% (I) |
| C: MPA | 17 | 33.40 | 17.80 | |||||
| Leardini 1987 | 1‐4 wk | T: Hyalgan | Range of motion (flexion in degrees) | 20 | 108.40 | 113.40 | ‐3.2 (W) | ‐3.1% (W) |
| C: MPA | 20 | 104.20 | 112.40 | |||||
| Pietrogrande 1991 | 1‐4 wk | T: Hyalgan | Range of motion (flexion in degrees) | 45 | 114.13 | 121.38 | 3.3 (I) | 3% (I) |
| C: MPA | 45 | 108.81 | 112.75 | |||||
| Leardini 1987 | 5‐13 wk | T: Hyalgan | Range of motion (flexion in degrees) | 20 | 108.40 | 116.70 | ‐1.8 (W) | ‐1.7% (W) |
| C: MPA | 20 | 104.20 | 114.30 | |||||
| Pietrogrande 1991 | 5‐13 wk | T: Hyalgan | Range of motion (flexion in degrees) | 45 | 114.13 | 121.10 | 2.4 (I) | 2.2% (I) |
| C: MPA | 45 | 108.81 | 113.35 | |||||
| Leardini 1987 | 45‐52 wk | T: Hyalgan | Range of motion (flexion in degrees) | 15 | 108.40 | 109.60 | ‐2.7 (W) | ‐2.6% (W) |
| C: MPA | 17 | 104.20 | 108.10 | |||||
| Jones 1995 | End of treatment | T: Hyalgan | Pain on nominated activity (0‐100 mm VAS) | 32 | 77.2 | 56.5 | ‐1.6 (I) | ‐2.1% (I) |
| C: Triamcinolone hexacetonide | 31 | 75.8 | 56.7 | |||||
| Jones 1995 | End of treatment | T: Hyalgan | Pain at rest (0‐100 mm VAS) | 32 | 53.2 | 39.9 | 1.4 (W) | 2.5% (W) |
| C: Triamcinolone hexacetonide | 31 | 55.3 | 40.6 | |||||
| Jones 1995 | End of treatment | T: Hyalgan | Pain at night (0‐100 mm VAS) | 32 | 57.8 | 35.9 | ‐2.7 (I) | ‐4.3% (I) |
| C: Triamcinolone hexacetonide | 31 | 62.2 | 43.0 | |||||
| Jones 1995 | 14‐26 wk | T: Hyalgan | Pain on nominated activity (0‐100 mm VAS) | 12 | 77.2 | 44.3 | ‐11.4 (I) | ‐15.0% (I) |
| C: Triamcinolone hexacetonide | 8 | 75.8 | 54.3 | |||||
| Jones 1995 | 14‐26 wk | T: Hyalgan | Pain at rest (0‐100 mm VAS) | 12 | 53.2 | 28.2 | ‐18.3 (I) | ‐33.1% (I) |
| C: Triamcinolone hexacetonide | 8 | 55.3 | 48.6 | |||||
| Jones 1995 | 14‐26 wk | T: Hyalgan | Pain at night (0‐100 mm VAS) | 12 | 57.8 | 15.4 | ‐16.3 (I) | ‐26.2% (I) |
| C: Triamcinolone hexacetonide | 8 | 62.2 | 36.1 | |||||
| Graf 1993 (other ia therapy) | End of treatment | T: Hyalgan | Pain (0‐30) | 33 | 14.1 | 19.6 | 4 (I) | 24.7% (I) |
| C: MPAE | 27 | 16.2 | 17.7 | |||||
| Graf 1993 (other ia therapy) | End of treatment | T: Hyalgan | Larson function (0‐30) | 33 | 18.0 | 19.1 | 0.6 (I) | 3.6% (I) |
| C: MPAE | 27 | 16.9 | 17.4 | |||||
| Graf 1993 (other ia therapy) | End of treatment | T: Hyalgan | Larson total (0‐77) | 33 | 45.7 | 54.1 | 5.9 (I) | 12.7% (I) |
| C: MPAE | 27 | 46.6 | 49.1 | |||||
| Graf 1993 (other ia therapy) | End of treatment | T: Hyalgan | Range of motion (0‐10) | 33 | 8.8 | 9.1 | 0.3 (I) | 3.5% (I) |
| C: MPAE | 27 | 8.7 | 8.7 |
There was no statistically significant difference in spontaneous pain intensity (0 to 100 mm VAS) at 1 to 4 weeks postinjection (Leardini 1987; Leardini 1991; Pietrogrande 1991). There was a statistically significant difference in favour of Hyalgan at 5 to 13 weeks postinjection (WMD ‐7.73; 95% CI ‐12.81 to ‐2.64, P value 0.003) (Leardini 1987; Leardini 1991; Pietrogrande 1991). Hyalgan was 11 to 41% more effective than MPA. At 45 to 52 weeks postinjection, there was no statistically significant difference (Leardini 1987). For pain expressed as the number of joints with moderate or severe pain under load (Leardini 1987), there was no statistically significant difference at 1 to 4, 5 to 13, or 45 to 52 weeks postinjection. For pain expressed as the number of patients with moderate or severe pain under load (Leardini 1991; Pietrogrande 1991), there was no statistically significant difference at 1 to 4 weeks postinjection. There was a statistically significant difference in favour of Hyalgan at 5 to 13 weeks postinjection (RR 0.61; 95% CI 0.44 to 0.84, P value 0.003). The NNT for moderate to severe pain under load was 10. For the number of joints with moderate or severe walking pain, no statistically significant differences were detected at three timepoints: 1 to 4, 5 to 13, or 45 to 52 weeks postinjection (Leardini 1987). For the number of patients with moderate or greater night pain, there was no statistically significant difference at 1 to 4 or 5 to 13 weeks postinjection (Leardini 1991; Pietrogrande 1991). For the number of patients with moderate or greater rest pain, there was no statistically significant difference at 1 to 4 weeks postinjection, but a statistically significant difference in favour of Hyalgan at 5 to 13 weeks postinjection (RR 0.39; 95% CI 0.19 to 0.78, P value 0.008) (Leardini 1991; Pietrogrande 1991). The NNT for rest pain was 20.
Statistically significant differences in range of motion (flexion) in favour of Hyalgan were found at 1 to 4 weeks postinjection (WMD 5.93; 95% CI 0.71 to 11.14, P value 0.03), and at 5 to 13 weeks post injection (WMD 5.41; 95% CI 0.54 to 10.28, P value 0.03) (Leardini 1987; Pietrogrande 1991) (i.e. Hyalgan was 2% more effective than MPA), but no statistically significant difference was detected at 45 to 52 weeks postinjection (Leardini 1987).
The global assessment, expressed by number of patients good or very good, was not significantly different between groups at 1 to 4 weeks postinjection (Frizziero 2002; Leardini 1991; Pietrogrande 1991). There was a statistically significant difference in favour of Hyalgan at 5 to 13 weeks postinjection (WMD 1.86; 95% CI 1.26 to 2.75, P value 0.002) (Leardini 1991; Pietrogrande 1991). The NNT for patient global assessment was 7. At 45 to 52 weeks postinjection, there was no statistically significant difference (Frizziero 2002).
One RCT was a comparison of Hyalgan and triamcinolone hexacetonide (Jones 1995). Except for pain at night at 14 to 26 weeks postinjection (WMD ‐20.70; 95% CI ‐37.74 to ‐3.66, P value 0.02), there were no statistically significant differences between treatment detected by the three pain measures: pain on nominated activity, pain at rest, and pain at night (all measured on a 100 mm VAS) at the end of treatment or at 14 to 26 weeks postinjection. Hyalgan was 26% more effective than triamcinolone hexacetonide in relieving pain at night at 14 to 26 weeks postinjection. The RevMan analysis differed from the Jones publication (Jones 1995) analysis. The publication reported significant differences in favour of Hyalgan in pain on nominated activity and pain at rest at 14 to 26 weeks postinjection. Safety
There were no statistically significant differences in any of the extracted safety outcomes. There was no difference in the total number of withdrawals overall at 1 to 4 weeks postinjection (Frizziero 2002); at 5 to 13 weeks postinjection (Leardini 1991; Pietrogrande 1991); at 14 to 26 weeks postinjection (Frizziero 2002); or at 45 to 52 weeks postinjection (Leardini 1987). There was no difference in the number of patients withdrawn due to lack of efficacy at 5 to 13 weeks postinjection (Pietrogrande 1991). There was no difference in the number of joints with local reactions at 1 to 4 weeks postinjection (Leardini 1987). There was no difference in the number of patients with local or systemic reactions at 5 to 13 weeks postinjection (Leardini 1991, Pietrogrande 1991). There was no difference in the number of patients withdrawn due to adverse events after the first injection in the Frizziero trial (Frizziero 2002).
There were no statistically significant differences between Hyalgan and triamcinolone hexacetonide (Jones 1995) in the total number of withdrawals overall, in the number of withdrawals due to lack of efficacy, or in the number of withdrawals due to adverse events at the end of treatment or at 14 to 26 weeks postinjection.
Hyalgan versus other IA therapy
One RCT included was a comparison of Hyalgan and mucopolysaccharide polysulfuric acid ester (Graf 1993). Efficacy The results were presented as change scores. The six‐month data reported in the publication were not used since it was presented as the change from end of treatment not the change from baseline. For the Larson rating scale, a higher score indicated improvement. At the end of treatment (week 6), there was a statistically significant difference in favour of Hyalgan compared to mucopolysaccharide polysulfuric acid ester for pain (0 to 30) (WMD 4.00; 95% CI 0.98 to 7.02, P value 0.009), and for the total Larson rating score (0 to 77) (WMD 5.90; 95% CI1.31 to 10.49, P value 0.01). This means that Hyalgan was 25% more effective than mucopolysaccharide polysulfuric acid ester in relieving pain and 13% more effective in improving 'overall' function. There was no statistically significant difference for function (0‐30) or for range of motion (0 to 10). The global assessment, expressed by the number of patients symptom free or markedly improved, was significantly better in the Hyalgan group (76%) compared to the mucopolysaccharide polysulfuric acid ester group (46%) (RR 1.65; 95% CI 1.03 to 2.66, P value 0.04) at 14 to 26 weeks postinjection. The NNT for patient global assessment was 3. Safety There were no statistically significant differences between Hyalgan and mucopolysaccharide polysulfuric acid ester at 14 to 26 weeks postinjection either in the total number of withdrawals overall or in the number of adverse events due to study medication.
Hyalgan versus NSAID
22. Clinical benefit table: Hyalgan versus NSAID. Dichotomous outcome measures.
| Study | Time | Treatment group | Outcome | No. improved | No. of pts | Risk (%) | Risk Difference | NNT |
| Altman 1998 | 14‐26 wk | T: Hyalgan | Number of patients with moderate/marked pain | 69 | 105 | 66 | 4% | 25 |
| C: Naproxen | 70 | 113 | 62 |
23. Clinical benefit table: Hyalgan versus NSAID. Continuous outcome measures.
| Study | Time | Treatment | Outcome (scale) | N of Pts | Baseline Mean | End of Study Mean | Absolute Benefit | Relative Difference |
| Altman 1998 | 1‐4 wk | E: Hyalgan | Pain after 50 foot walk (0‐100 mm VAS) | 163 | 54 | 25 | 0 | 0 |
| C: Naproxen | 162 | 54 | 25 | |||||
| Altman 1998 | 5‐13 wk | E: Hyalgan | Pain after 50 foot walk (0‐100 mm VAS) | 115 | 54 | 23 | 2 (W) | 3.7% (W) |
| C: Naproxen | 125 | 54 | 21 | |||||
| Altman 1998 | 14‐26 wk | E: Hyalgan | Pain after 50 foot walk (0‐100 mm VAS) | 105 | 54 | 18 | ‐3 (I) | ‐5.6% (I) |
| C: Naproxen | 111 | 54 | 21 |
One RCT included was a comparison of Hyalgan and naproxen (Altman 1998). Efficacy No statistically significant difference was found between Hyalgan and naproxen for pain after a 50 foot walk measured on a 100 mm VAS at any of the three assessment times: 1 to 4, 5 to 13, or 14 to 26 weeks postinjection. There was no statistically significant difference in the number of patients with moderate to marked pain at 14 to 26 weeks postinjection or in those with none to slight to mild pain. Safety There was a statistically significant difference in the number of patients with gastrointestinal complaints reported in the Hyalgan group (29%) compared to the naproxen group (42%) (RR 0.70; 95% CI 0.52 to 0.95, P value 0.02). There was a statistically significant difference in the number of adverse events for injection site pain reported in the naproxen group (9%) compared to Hyalgan (23%) (RR 2.70; 95% CI 1.52 to 4.79, P value 0.0007). There were more adverse events due to local joint pain and swelling reported in the Hyalgan group (13%) than the naproxen group (6%) (RR 2.09; 95% CI 1.01 to 4.29, P value 0.05).
There were no statistically significant differences for the other safety outcome measures: total withdrawals overall, withdrawals due to lack of efficacy, number of adverse events of local skin rash, or pruritis.
Hyalgan versus conventional therapy Table 24
24. Clinical benefit table: Hyalgan versus conventional care. Continuous outcome mea.
| Study | Time | Treatment | Outcome (scale) | N of Pts | Baseline Mean | End of Study Mean | Absolute Benefit | Relative Difference |
| Listrat 1997 | 45‐52 wk | E: Hyalgan | Pain overall (0‐100 mm VAS) | 19 | 49.2 | 32.4 | ‐11.5 (I) | ‐22.1% (I) |
| C: Conventional therapy | 17 | 52.1 | 46.8 | |||||
| Listrat 1997 | 45‐52 wk | E: Hyalgan | Lequesne Index (0‐24) | 19 | 8.9 | 7.2 | ‐0.4 (I) | ‐4.3% (I) |
| C: Conventional therapy | 17 | 9.4 | 8.1 | |||||
| Listrat 1997 | 45‐52 wk | E: Hyalgan | Joint space width (mm) | 19 | 4.5 | 4.0 | 0.1 (I) | 2.9% (I) |
| C: Conventional therapy | 17 | 3.5 | 2.9 | |||||
| Listrat 1997 | 45‐52 wk | E: Hyalgan | Arthroscopy assessment (0‐100 mm VAS) | 19 | 41.8 | 47.0 | ‐11.5 (I) | ‐21.9% (I) |
| C: Conventional therapy | 17 | 52.6 | 69.3 | |||||
| Listrat 1997 | 45‐52 wk | E: Hyalgan | SFA scoring system (0‐100 mm VAS) | 19 | 26.1 | 29.8 | ‐5.3 (I) | ‐13.6% (I) |
| C: Conventional therapy | 17 | 39.0 | 48.0 | |||||
| Listrat 1997 | 45‐52 wk | E: Hyalgan | Quality of life (AIMS: 12 item total) | 19 | 2.6 | 2.2 | ‐0.6 (I) | ‐27.3% (I) |
| C: Conventional therapy | 17 | 2.2 | 2.4 |
One RCT included was a comparison of Hyalgan and conventional therapy (Listrat 1997). Efficacy There were no statistically significant differences between Hyalgan and conventional care at 45 to 52 weeks postinjection in overall pain (measured on 0 to 100 mm VAS) or in function (assessed by the Lequesne Index). Since the arthroscopic outcome measures were chosen a priori as the primary efficacy variables in this trial, their results are also reported. Joint space width, measured in mm, was greater at 45 to 52 weeks postinjection, in the Hyalgan group (WMD 1.10; 95% CI ‐0.01 to 2.21, P value 0.05). A statistically significant difference in favour of Hyalgan, at 45 to 52 weeks postinjection, was found for both the arthroscopy overall assessment (0 to 100 mm VAS) (WMD ‐22.30; 95% CI ‐40.52 to ‐4.08, P value 0.02) and the SFA system score (0 to 100 mm VAS) (WMD ‐18.20; 95% CI ‐31.27 to ‐5.13, P value 0.006). Therefore, Hyalgan was 14 to 22% more effective than conventional therapy in improving these arthroscopy parameters at 45 to 52 weeks postinjection. This trial also utilised a quality of life outcome measure, the Arthritis Impact Measurement Scales (AIMS), based on the total of 12 items. There was no statistically significant difference between groups.
The RevMan analysis differed from the Listrat publication (Listrat 1997) analysis. The publication reported a statistically significant difference in favour of Hyalgan for AIMS (P value 0.047) at 45 to 52 weeks postinjection whereas the RevMan analysis detected no difference (P value 0.6). Safety Safety, as assessed by total withdrawals overall, was similar in the two groups. One patient in the Hyalgan group withdrew because of lack of pain while two patients in the conventional therapy group withdrew: one because of osteotomy performed on the study knee and one because of relocation.
Hyalgan versus homeopathic treatment
Readers are directed to the Zeel section for results based on a comparison of Zeel compositum and Hyalart (Nahler 1998). Hyalgan plus exercise plus ultrasound versus exercise plus ultrasound
25. Clinical benefit table: Hyalgan+exercise+ultrasound versus exercise+ultrasound.
| Study | Time | Treatment | Outcome | N of Pts | Baseline Mean | End of Study Mean | Absolute Benefit | Relative Difference |
| Huang 2005 | End of treatment | E: Hyalgan+exercise+ultrasound | Pain (0‐10 cm VAS) | 34 | 5.6 | 2.5 | ‐2.5 (I) | ‐45.5% (I) |
| C: Exercise+ultrasound | 32 | 5.5 | 4.9 | |||||
| Huang 2005 | 52 wk | E: Hyalgan+exercise+ultrasound | Pain (0‐10 cm VAS) | 32 | 5.6 | 2.0 | ‐4.7 (I) | ‐85.5% (I) |
| C: Exercise+ultrasound | 28 | 5.5 | 6.6 | |||||
| Huang 2005 | End of treatment | E: Hyalgan+exercise+ultrasound | Lequesne Index (0‐26) | 34 | 7.5 | 4.0 | ‐3.0 (I) | ‐40.5% (I) |
| C: Exercise+ultrasound | 32 | 7.4 | 6.9 | |||||
| Huang 2005 | 52 wk | E: Hyalgan+Exercise+ultrasound | Lequesne Index (0‐26) | 32 | 7.5 | 2.5 | ‐5.7 (I) | ‐77.0% (I) |
| C: Exercise+ultrasound | 28 | 7.4 | 8.1 | |||||
| Huang 2005 | End of treatment | E: Hyalgan+exercise+ultrasound | Range of motion (degrees) | 34 | 103 | 120 | 23 (I) | 22.1% (I) |
| C: Exercise+ultrasound | 32 | 104 | 98 | |||||
| Huang 2005 | 52 wk | E: Hyalgan+exercise+ultrasound | Range of motion (degrees) | 32 | 103 | 124 | 27 (I) | 26.0% (I) |
| C: Exercise+ultrasound | 28 | 104 | 98 | |||||
| Huang 2005 | End of treatment | E: Hyalgan+exercise+ultrasound | Ambulation speed (metres per minute) | 34 | 72.4 | 95.6 | 27.7 (I) | 38.8% (I) |
| C: Exercise+ultrasound | 32 | 71.3 | 75.8 | |||||
| Huang 2005 | 52 wk | E: Hyalgan+exercise+ultrasound | Ambulation speed (metres per minute) | 32 | 72.4 | 99.3 | 28.1 (I) | 39.4 (I) |
| C: Exercise+ultrasound | 28 | 71.3 | 70.1 |
Efficacy
One RCT included was a comparison of Hyalgan plus exercise plus ultrasound and exercise plus ultrasound (Huang 2005). There were no statistically significant differences between the two groups either at the end of the treatment or at the one‐year follow‐up for the following outcome measures: pain (0 to 10 cm VAS); range of motion (degrees); and the Lequesne Index at the end of treatment. Statistically significant differences were detected for the following outcome measures in favour of the Hyalgan plus exercise plus ultrasound group: Lequesne Index at one‐year follow‐up (WMD ‐0.80; 95% CI ‐1.58 to ‐0.02, P value 0.04) (Hyalgan plus exercise plus ultrasound was 77% more effective than exercise plus ultrasound); and ambulation speed (metres per minute) both at the end of treatment and at one‐year follow‐up (WMD 5.40; 95% CI 3.99 to 6.81, P < 0.00001 and WMD 5.00; 95% CI 1.58 to 8.42, P value 0.004) (Hyalgan plus exercise plus ultrasound was 39% more effective than exercise plus ultrasound).
Safety
There were no statistically significant differences in the total number of withdrawals either during treatment or overall.
Hyalgan plus exercise plus ultrasound versus exercise
26. Clinical benefit table: Hyalgan plus exercise plus ultrasound versus exercise.
| Study | Time | Treatment | Outcome | N of Pts | Baseline Mean | End of Study Mean | Absolute Benefit | Relative Difference |
| Huang 2005 | End of treatment | E: Hyalgan+exercise+ultrasound | Pain (0‐10 cm VAS) | 34 | 5.6 | 2.5 | ‐1.9 (I) | ‐35.8% (I) |
| C: Exercise | 30 | 5.3 | 4.1 | |||||
| Huang 2005 | 52 wk | E: Hyalgan+exercise+ultrasound | Pain (0‐10 cm VAS) | 32 | 5.6 | 2.0 | ‐2.2 (I) | ‐41.5% (I) |
| C: Exercise | 26 | 5.3 | 3.9 | |||||
| Huang 2005 | End of treatment | E: Hyalgan+exercise+ultrasound | Lequesne Index (0‐26) | 34 | 7.5 | 4.0 | ‐5.0 (I) | ‐65.8% (I) |
| C: Exercise | 30 | 7.6 | 6.1 | |||||
| Huang 2005 | 52 wk | E: Hyalgan+exercise+ultrasound | Lequesne Index (0‐26) | 32 | 7.5 | 2.5 | ‐3.2 (I) | ‐42.1% (I) |
| C: Exercise | 26 | 7.6 | 5.8 | |||||
| Huang 2005 | End of treatment | E: Hyalgan+exercise+ultrasound | Range of motion (degrees) | 34 | 103 | 120 | 22 (I) | 21.4% (I) |
| C: Exercise | 30 | 103 | 108 | |||||
| Huang 2005 | 52 wk | E: Hyalgan+exercise+ultrasound | Range of motion (degrees) | 32 | 103 | 124 | 28 (I) | 27.2% (I) |
| C: Exercise | 26 | 103 | 110 | |||||
| Huang 2005 | End of treatment | E: Hyalgan+exercise+ultrasound | Ambulation speed (metres per minute) | 34 | 72.4 | 95.6 | 12.9 (I) | 17.8% (I) |
| C: Exercise | 30 | 72.6 | 82.9 | |||||
| Huang 2005 | 52 wk | E: Hyalgan+exercise+ultrasound | Ambulation speed (metres per minute) | 32 | 72.4 | 99.3 | 14.2 (I) | 19.6% (I) |
| C: Exercise | 26 | 72.6 | 85.3 |
Efficacy
One RCT included was a comparison of Hyalgan plus exercise plus ultrasound and exercise alone (Huang 2005). There were statistically significant differences between the two groups both at the end of treatment and at the one‐year follow‐up in favour of the Hyalgan plus exercise plus ultrasound group for the following outcome measures: pain (0 to 10 cm VAS) (WMD ‐1.60; 95% CI ‐2.18 to ‐1.02, P < 0.00001 and WMD ‐1.90; 95% CI ‐2.60 to ‐1.20, P < 0.00001) (Hyalgan plus exercise plus ultrasound was 36 to 42% more effective than exercise); Lequesne Index (0 to 26) (WMD ‐2.10; 95% CI ‐2.50 to ‐1.70, P < 0.00001 and WMD ‐3.30; 95% CI ‐4.19 to ‐2.41, P < 0.00001) (Hyalgan plus exercise plus ultrasound was 42 to 66% more effective than exercise); range of motion (degrees) (WMD 12.00; 95% CI 4.51 to 19.49, P value 0.002 and WMD 14.00; 95% CI 5.76 to 22.24, P value 0.0009) (Hyalgan plus exercise plus ultrasound was 21 to 27% more effective than exercise); and ambulation speed (metres per minute) (WMD 12.70; 95% CI 10.60 to 14.80, P < 0.00001 and WMD 14.00; 95% CI 10.57 to 17.43, P < 0.00001) (Hyalgan plus exercise plus ultrasound was 18 to 20% more effective than exercise).
Safety
There were no statistically significant differences in the total number of withdrawals either during treatment or overall.
Hyalgan plus exercise plus ultrasound versus control warmup exercises
27. Clinical benefit table: Hyalgan plus exercise plus ultrasound versus control exe.
| Study | Time | Treatment | Outcome | N of Pts | Baseline Mean | End of Study Mean | Absolute Benefit | Relative Difference |
| Huang 2005 | End of treatment | E: Hyalgan+exercise+ultrasound | Pain (0‐10 cm VAS) | 34 | 5.6 | 2.5 | ‐2.5 (I) | ‐46.3% (I) |
| C: Warmup exercises | 32 | 5.4 | 4.9 | |||||
| Huang 2005 | 52 wk | E: Hyalgan+exercise+ultrasound | Pain (0‐10 cm VAS) | 32 | 5.6 | 2.0 | ‐4.8 (I) | ‐88.9% (I) |
| C: Warmup exercises | 28 | 5.4 | 6.6 | |||||
| Huang 2005 | End of treatment | E: Hyalgan+exercise+ultrasound | Lequesne Index (0‐26) | 34 | 7.5 | 4.0 | ‐2.5 (I) | ‐33.8% (I) |
| C: Warmup exercises | 32 | 7.4 | 6.9 | |||||
| Huang 2005 | 52 wk | E: Hyalgan+exercise+ultrasound | Lequesne Index (0‐26) | 32 | 7.5 | 2.5 | ‐5.7 (I) | ‐77.0% (I) |
| C: Warmup exercises | 28 | 7.4 | 8.1 | |||||
| Huang 2005 | End of treatment | E: Hyalgan+exercise+ultrasound | Range of motion (degrees) | 34 | 103 | 120 | 20 (I) | 19.8% (I) |
| C: Warmup exercises | 32 | 101 | 98 | |||||
| Huang 2005 | 52 wk | E: Hyalgan+exercise+ultrasound | Range of motion (degrees) | 32 | 103 | 124 | 24 (I) | 23.8% (I) |
| C: Warmup exercises | 28 | 101 | 98 | |||||
| Huang 2005 | End of treatment | E: Hyalgan+exercise+ultrasound | Ambulation speed (metres per minute) | 34 | 72.4 | 95.6 | 21.3 (I) | 28.8% (I) |
| C: Warmup exercises | 32 | 73.9 | 75.8 | |||||
| Huang 2005 | 52 wk | E: Hyalgan+exercise+ultrasound | Ambulation speed (metres per minute) | 32 | 72.4 | 99.3 | 30.7 (I) | 41.5% (I) |
| C: Warmup exercises | 28 | 73.9 | 70.1 |
Efficacy
One RCT included was a comparison of Hyalgan plus exercise plus ultrasound and control warmup exercises (Huang 2005). There were statistically significant differences between the two groups both at the end of treatment and at the one‐year follow‐up in favour of the Hyalgan plus exercise plus ultrasound group for the following outcome measures: pain (0 to 10 cm VAS) (WMD ‐2.40; 95% CI ‐3.08 to ‐1.72, P < 0.00001 and WMD ‐4.60; 95% CI ‐5.32 to ‐3.88, P < 0.00001) (Hyalgan plus exercise plus ultrasound was 46 to 89% more effective than control warmup exercises); Lequesne Index (0 to 26) (WMD ‐2.90; 95% CI ‐3.41 to ‐2.39, P < 0.00001 and WMD ‐5.60; 95% CI ‐6.38 to ‐4.82, P < 0.00001) (Hyalgan plus exercise plus ultrasound was 34 to 77% more effective than control warmup exercises); range of motion (degrees) (WMD 22; 95% CI 16.42 to 27.58, P < 0.00001 and WMD 26; 95% CI 17.14 to 34.86, P < 0.00001) (Hyalgan plus exercise plus ultrasound was 20 to 24% more effective than control warmup execises); and ambulation speed (metres per minute) (WMD 19.80; 95% CI 18.17 to 21.43, P < 0.00001 and WMD 29.20; 95% CI 26.18 to 32.22, P < 0.00001) (Hyalgan plus exercise plus ultrasound was 29 to 42% more effective than control warmup exercises).
Safety There were no statistically significant differences in the total number of withdrawals either during treatment or overall.
One RCT included was a schedule comparison of Hyalgan (Karras 2001). Efficacy There was no statistically significant difference in the number of patients assessing the response as satisfactory between the five injection Hyalgan schedule (67%) and the three injection Hyalgan schedule (79%). Safety From the abstract it was not possible to ascertain to which group the patients belonged that experienced three cases of local pain.
Hyalgan versus other hyaluronans
Readers are directed to the Adant and Fermathron product results for comparisons of Hyalgan against these two HA products, respectively.
One RCT included was a comparison of Hyalgan and Hylan G‐F 20 (Brown 2003). This trial was discontinued on ethical grounds due to the frequency of acute inflammatory reactions with Hylan G‐F 20 (21%) compared to Hyalgan (0%); this difference was not statistically significant. No efficacy data were extracted from the abstract. Product ‐ Hylan G‐F 20 (Synvisc) Description of studies Twenty‐four RCTs were included (Adams 1995; Atamaz 2005; Auerbach 2002; Bayramoglu 2003; Brown 2003; Caborn 2004; Cubukcu 2004 (abstract ‐ Ardic 2001); Dickson 2001; Groppa 2001; Kahan 2003a; Karatay 2004; Karatosun 2005; Karatosun 2005a; Karlsson 2002; Kotevoglu 2005; Leopold 2003; Moreland 1993; Raynauld 2002; Rejaili 2005; Scale 1994a (2 inj); Scale 1994b (3 inj); Kirchner 2005 (abstract ‐ Thompson 2002); Wobig 1998; Wobig 1999). Considering only the 17 trials in which Hylan G‐F 20 was designated the experimental intervention, the Jadad score ranged from 1 to 5 with an average quality of 3. One trial scored 5 (Moreland 1993), five scored 4 (Dickson 2001; Scale 1994a (2 inj); Scale 1994b (3 inj); Wobig 1998; Wobig 1999), five scored 3 (Adams 1995; Kahan 2003a; Karatosun 2005; Leopold 2003; Raynauld 2002), five scored 2 (Atamaz 2005; Auerbach 2002; Caborn 2004; Cubukcu 2004; Rejaili 2005), and one scored 1 (Groppa 2001). Allocation concealment was adequate in nine trials and inadequate (not reported) in eight trials (Atamaz 2005; Auerbach 2002; Caborn 2004; Cubukcu 2004; Dickson 2001; Groppa 2001; Karatosun 2005; Rejaili 2005).
Hylan G‐F 20 has been compared against IA control treatment (Ardic 2001; Cubukcu 2004; Dickson 2001; Groppa 2001; Karlsson 2002b (SvP); Kotevoglu 2005; Moreland 1993; Scale 1994a (2 inj); Scale 1994b (3 inj); Wobig 1998; Wobig 1999c (NEhyl)), IA corticosteroid (Caborn 2004; Leopold 2003), nonsteroidal anti‐inflammatory drug (Adams 1995; Dickson 2001), IA gaseous oxygen (Auerbach 2002), physiotherapy (Bayramoglu 2003), appropriate care (Kahan 2003a; Raynauld 2002), exercise programme (Karatosun 2005), in combination with arthroscopy (Rejaili 2005), and hyaluronan (Atamaz 2005; Bayramoglu 2003; Karatay 2004; Karatosun 2005a; Kotevoglu 2005 [Orthovisc]; Brown 2003 [Hyalgan]; Karlsson 2002c (AvS) [Artzal]; Kirchner 2005 (Thompson 2002) [BioHy (Arthrease, Euflexxa, Nuflexxa)]; Wobig 1999 [Artz, Healon]). The draft manuscript for the abstract presented by Moreland et al. (Moreland 1993) was kindly provided by Biomatrix, Inc. as were the Pre‐Market Approval (PMA) data for the studies by Adams et al. (Adams 1995), Scale et al. (Scale 1994a (2 inj); Scale 1994b (3 inj)), and Wobig et al. (Wobig 1998; Wobig 1999). The trials were completed in nine countries: Brazil (Rejaili 2005), Canada (Adams 1995; Raynauld 2002), England (Dickson 2001), France (Kahan 2003a), Germany (Auerbach 2002; Scale 1994a (2 inj); Scale 1994b (3 inj); Wobig 1998; Wobig 1999), Republic of Moldova (Groppa 2001), Scotland (Dickson 2001), Turkey (Atamaz 2005; Cubukcu 2004; Karatosun 2005), and the United States (Caborn 2004; Leopold 2003; Moreland 1993). They were published over a twelve‐year period: 1993 through 2005. Sample size per group varied from 10 (Cubukcu 2004; Rejaili 2005) to 253 (Kahan 2003a) while sample size per trial varied from 20 to 518. One trial was eight weeks in duration (Cubukcu 2004 (Ardic 2001), two trials were twelve weeks in duration (Dickson 2001; Wobig 1999), four trials were 12 weeks in duration with a telephone interview at 26 weeks (Adams 1995; Scale 1994a (2 inj); Scale 1994b (3 inj); Wobig 1998), two trials were 24 weeks in duration (Leopold 2003; Rejaili 2005), one trial was 26 weeks in duration (Caborn 2004), one trial was 34 weeks in duration (Moreland 1993), one trial was 36 weeks in duration (Kahan 2003a), four trials were 52 weeks in duration (Atamaz 2005; Auerbach 2002; Groppa 2001; Raynauld 2002), and one trial was 18 months in duration (Karatosun 2005).
For the six trials that were included in the PMA P940015 (Adams 1995; Moreland 1993; Scale 1994a (2 inj); Scale 1994b (3 inj); Wobig 1998; Wobig 1999), control and Hylan G‐F 20 treatments were prepared in syringes that had identical appearances and which were coded only by random numbers. All subjects participating in these trials received arthrocentesis with removal of effusion if present. All IA procedures were performed in an identical manner for treatment and control study groups in these trials. A screen, blinding the patient from the procedure, was utilised in four trials (Adams 1995; Dickson 2001; Moreland 1993; Wobig 1998).
Twenty‐six studies were excluded (Bell 1999; Bellamy 2000; Bruce 2004; Chhabra 2000; Clarke 2001; Evanich 2001; Goorman 2000; Ines 2002; Koyuncu 2003; Legre 2001; Lee 2004; Lussier 1996; Magobotha 2001; Mathieu 2001; Miller 1999; Myburgh 2001; Olszynski 2002; Sripada 1999; Stambuk 2001; Torrance 2002; Vad 2000; Waddell 2001a; Waddell 2001b; Weiss 1999; Wobig 1999d; Wulwik 2001). Two trials are awaiting assessment (Russell 2003 (Talwalkar 2005); Shariati 2001). These trials have been published only as abstracts with no extractable data, and at the closure of the database for this review no full length manuscripts have been published.
Adams et al. reported a 26‐week, parallel‐group RCT performed at six centres in Canada comparing three weekly injections of Hylan G‐F 20 to either NSAID continuation plus three weekly control arthrocenteses or NSAID continuation plus three weekly injections of Hylan G‐F 20 in 102 patients with OA of the knee (Adams 1995). All groups showed significant improvement from baseline at 12 weeks but did not differ from each other. The two groups receiving Hylan G‐F 20 were significantly better than the NSAID alone group at Week 26.
Several design issues are noted for the Adams et al. RCT (Adams 1995). This trial was designed to evaluate viscosupplementation with Hylan G‐F 20 as a replacement for continuous NSAID therapy. There was no washout period. The concomitant use of acetaminophen for analgesia was permitted and recorded by pill counts. However, usage was not reported since it was documented in different formats by the treating physicians and could not be standardised into a single format for purposes of uniform analysis. The resumption of NSAID between weeks 12 and 26 was reported. 55.6% of patients in the Hylan G‐F 20 group only resumed taking NSAID compared to 84.4% in the NSAID plus Hylan G‐F 20 group and 96.8% in the NSAID group. Fifteen per cent of the included patients presented with effusion at the first visit. The Hylan G‐F 20 only group may not have been blinded since they were instructed to discontinue their NSAID. The authors addressed this concern in the publication by commenting that, "if incomplete blinding introduced a bias, it would be against the Hylan G‐F 20‐only group in that patients recognized that they were discontinuing an active medication, and consequently may have expected their condition to worsen". The method of assessment at 26 weeks was by telephone follow‐up which differed from that of baseline (i.e. office visit). A subsequent study showed that there was no significant difference in results obtained by telephone compared to office visits for the WOMAC 3.0 Osteoarthritis Index (Bellamy 2002).
Atamaz et al. reported a one‐year, parallel‐group (three‐arm), single‐blind RCT performed at a single centre in Turkey comparing three weekly injections followed by one additional injection at six months of Hylan G‐F 20 (Synvisc) or hyaluronan (Orthovisc) to a physical therapy programme five times a week for three weeks with a series of infrared, short‐wave diathermy pulsed patterns and interferential therapy in 85 patients with OA of the knee (Atamaz 2005). The authors reported significant improvement in all variables measured in both groups during the follow‐up except for range of motion and the WOMAC OA Index stiffness subscale. Patients in the physical therapy group had greater improvement in pain (at rest, at night, SF‐36) and SF‐36 social functioning. This improvement was not different between the physical therapy group and the Hylan G‐F 20 group, but the physical therapy group was superior to the Orthovisc group for non‐activity‐related pain and functional performance. Based on subgroup analyses, the decrease in pain on touch and WOMAC OA Index physical function was greater in the Hylan G‐F 20 group compared to the Orthovisc group. With respect to safety, the authors reported that no serious local or systemic adverse events were observed following injections. Dr. F. Atamaz kindly provided a copy of the manuscript which is in press.
This trial used repeat injection but only one injection at six months. Although the trial was single‐blind, the same physicians administered the injections and the same observer performed clinical assessments. Of the 85 patients enrolled, three did not meet the inclusion criteria and were not included in the analyses. Local reactions consisting of mild swelling, warmth and pain at the injection site were reported by one patient in the Synvisc group and three patients in the Orthovisc group, but all four patients had relief within a few days after application of cold packs. Paracetamol up to a maximum of 2 grams daily was permitted during the trial. Dr. F. Atamaz kindly provided a manuscript of this trial which has been accepted for publication in Rheumatology International.
Auerbach et al. reported a one‐year, parallel‐group RCT performed at a single centre in Germany comparing three weekly injections of Hylan G‐F 20 plus an exercise programme to five weekly IA injections of gaseous oxygen (three days per week) plus an exercise programme in 111 patients with OA of the knee (Auerbach 2002; Auerbach 2002a). Both treatments were effective in relieving pain and improving joint function. Pain relief by Hylan G‐F 20 and improvement in function by oxygen treatment were shown for more severe levels of cartilage damage.
The Auerbach trial was one of the few trials not published in English. Both the thesis (Auerbach 2002a) and the journal article (Auerbach 2002) were published in German. An English abstract was provided in the journal article. It was the only trial in which HA was compared to IA injection of gaseous oxygen. The authors studied the relation between treatment effect and severity of cartilage damage.
Caborn et al. reported a 26‐week, parallel group, single‐blind RCT performed at 14 centres in the United States comparing three weekly injections of Hylan G‐F 20 to one IA injection of triamcinolone hexacetonide (Aristospan) in 218 patients with OA of the knee (Caborn 2003; Caborn 2004; Lanzer 2002). Treatment with Hylan G‐F 20 resulted in a longer duration of effect than triamcinolone hexacetonide. Both treatments were well tolerated with 10% of patients in each group reporting an adverse event that resulted in withdrawal from the trial.
The Caborn et al. trial was single‐blind and details regarding the method of randomisation were not published (Caborn 2004). The triamcinolone hexacetonide group received only one injection compared to the three injections administered to the Hylan G‐F 20 group. Analgesic and NSAID usage were monitored throughout this trial. Patients with effusion of greater than 10 ml were excluded. Almost 30% of each treatment group had severe radiological ratings while approximately 60% in each group had moderate ratings.
Cubukcu et al. reported an eight‐week, placebo‐controlled RCT performed at one centre in Turkey comparing three weekly injections of Hylan G‐F 20 to three weekly injections of saline in 30 patients with OA of the knee (Cubukcu 2004; Ardic 2001 (abstract)). The authors reported a statistically significant between‐group difference at the end of the trial (i.e. eight weeks) for WOMAC pain, WOMAC physical function, night pain, rest pain, walking pain, need for paracetamol and evaluation of treatment by the patient. With respect to safety, no patients dropped out of the study and no systemic adverse events were reported. One patient complained of mild transient local pain in the injected area a day after the first injection. Details regarding methods of blinding and randomisation were not reported.
No explanation was given for the unequal group allocation (i.e. 2:1 patients or 3:1 knees). A major limitation of this study is the small sample size particularly in the placebo group.
Dickson et al. reported a 12‐week, parallel‐group, double‐blind RCT performed at 18 centres in England and Scotland comparing three weekly injections of Hylan G‐F 20 and dummy capsules taken once daily to either Diclofenac retard 100 mg taken once daily and three weekly arthrocenteses or dummy capsules taken once daily and three weekly arthrocenteses in 165 patients with OA of the knee (Dickson 2001). Patients, completing the 12‐week study, could enter an open‐label study in which they received treatment with up to four additional courses of Hylan G‐F 20 over a one‐year period. Hylan G‐F 20 was significantly better than either diclofenac or arthrocentesis in reducing WOMAC pain. The diclofenac group had significantly more total and gastrointestinal adverse events than the Hylan G‐F 20 or control groups.
The Dickson et al. trial was one of the few trials conducted in general practice (Dickson 2001). To ensure blinding, all three arms of the trial received arthrocentesis. The diclofenac sodium dosage of 100 mg daily may be considered by some as subtherapeutic but the Diclomax Retard 1993 product label indicated this to be the recommended adult dosage. The mean number of paracetamol tablets taken for analgesic rescue medication (3000 mg daily permitted) was published.
Groppa and Moshneaga reported a one‐year, blind CT performed at a single centre in The Republic of Moldova comparing three weekly injections of Hylan G‐F 20 to three weekly injections of placebo in 25 patients with OA of knee (Groppa 2001). Courses were repeated at six and 12 months. After the first course, one‐third of the patients treated with Hylan G‐F 20 had decreased pain and improved joint function compared to none in the placebo group. After three courses, 87% of the Hylan G‐F 20 patients had moderate or very good effect compared to only 20% of the patients in the control group who had moderate effect. No safety data were reported in the abstract.
The Groppa trial randomised a sample size of 25 patients (Groppa 2001). However, the control group was matched by gender, disease duration and x‐ray date. The study was designed to address the important issue of repeat treatment with a second and third course repeated at six and 12 months, respectively. Radiography, ultrasonography and scintigraphy with Te 99m were all utilised in evaluation.
Kahan et al. reported a nine‐month, open‐label, parallel‐group, RCT performed with 81 rheumatologists (21 hospital based, 60 office based) in France comparing three weekly injections of Hylan G‐F 20 to conventional treatment in 518 patients with OA of the knee (Kahan 2003 [article published in French]; Kahan 2003a). The authors reported that Hylan G‐F 20 viscosupplementation was more effective than conventional treatment at no additional cost.
The Kahan et al. trial provided medicoeconomic data on viscosupplementation for OA (Kahan 2003a; Kahan 2003). The design was very similar to the Raynauld et al. trial (Raynauld 2002). The study was completed under conditions of actual practice.
Karatosun et al. reported an eighteen‐month, single‐blind, parallel group, RCT performed at a single centre in Turkey comparing three weekly injections of Hylan G‐F 20 to an exercise programme that included a series of progressive simple range of motion and resistance exercises for six weeks (Karatosun 2005). The authors reported no statistically significant differences between the two groups. However, both groups had improved Hospital for Special Surgery scores at the end of the trial. While all patients in the exercise group completed the trial, 21 patients in the Hylan G‐F 20 did not. With respect to safety, no adverse events were reported that were related to ia injection of Hylan G‐F 20.
This trial enrolled only patients with Kellgren‐Lawrence Grade III knee OA. All radiographs were evaluated by two of the authors and concensus had to be reached in order for a patient to be enrolled in the trial. In addition, 91% of the patients had bilateral knee OA. A blinded physical therapist completed patient evaluations. Approximately 60 per cent of the Hylan G‐F 20 patients completed the trial. The authors acknowledged the "relatively high" drop out rate, noting that these patients had statistically significant improvement from baseline. They suggested that the reasons for seeking other forms of treatment in this group might have been due to their increased satisfaction levels. Dr. Vasfi Karatosun kindly provided means and standard deviations for the reported outcome measures.
Leopold et al. reported a six‐month, single‐blind, parallel‐group, RCT performed at a single centre in the United States comparing three weekly injections of Hylan G‐F 20 to one injection of betamethasone sodium phosphate‐betamethasone acetate (Celestone Soluspan), which could be repeated during the study, in 100 patients with OA of the knee (Leopold 2003; Redd 2003). No differences in pain or function were found between the two groups at the six months follow‐up. Neither treatment worked well in females. One patient in the Hylan G‐F 20 group withdrew because of an acute local reaction. One‐fifth of the study population withdrew because of a lack of treatment efficacy. Only safety data have been extracted from this trial. Since the outcome variables had results that were not normally distributed, nonparametric statistical methods were used to analyze the data (e.g. change in median outcomes scores).
The Leopold et al. trial was an independent trial not funded by the manufacturer of the hyaluronate‐based product under study (Leopold 2003). The injection procedure was standardised by: 1) patient was in the supine position, 2) the injection was made superolaterally into the suprapatellar notch, and 3) patients were encouraged to refrain from strenuous activity for a day. However, effusions were aspirated in the HA group whereas they were not in the corticosteroid group. In addition, patients in the corticosteroid group were permitted to have one more injection any time during the study. The authors chose not to use the Ahlback radiographic grading system, "because three of the four stages include knees with a completely obliterated joint space". This was the only trial to find a gender difference in treatment response.
Moreland et al. reported a 34‐week, parallel‐group, double‐blind RCT performed at five centres in the United States comparing three weekly injections of Hylan G‐F 20 to three weekly arthrocenteses in 94 patients with OA of the knee (Moreland 1993). This trial had two phases. Phase I lasted 10 weeks, after which patients could enter Phase II in which all patients received treatment with Hylan G‐F 20. For this analysis, the Phase II data were not included because, although patient blinding was maintained during this Phase, treatment was not randomised. Analyses were based on the week eight evaluation endpoint which was two weeks after the third injection in Phase I. A statistically significant difference, in favour of Hylan G‐F 20, was detected in overall pain only in a predefined 'flare' population but not in the 'intent‐to‐treat' population. During the two phases approximately 7% of patients receiving Hylan G‐F 20 discontinued treatment due to local adverse reactions (pain or swelling) in the injected knee.
The Moreland et al. trial was only published as an abstract but an in‐house unpublished manuscript allowed this trial to be included in the review (Moreland 1993). This trial examined the "clinimetric utility" of identifying a flare population. Despite a four‐week washout of all anti‐inflammatory medication, only 30% of patients demonstrated a flare in pain symptoms. However, patients were randomised regardless of flare criteria. The authors noted that the final evaluation for Phase I of the trial was only two weeks after completing treatment. This may have minimised any between‐group differences, and could have maximised the short‐term effect of arthrocentesis. Acetaminophen usage was permitted throughout the entire trial duration but there was no significant difference between the groups in daily usage.
Raynauld et al. reported a one‐year, open‐label, parallel‐group, RCT performed at 14 centres in Canada comparing appropriate care with Hylan G‐F 20 (AC + H) to appropriate care without Hylan G‐F 20 (AC) in 255 patients with OA of the knee (Raynauld 2002; Bellamy 2005a; Bellamy 2005b; Hamburger 2005; Raynauld 2005; Raynauld 2005a). For all the primary and secondary effectiveness outcome measures the AC + H group was superior to the AC group. Safety differences favoured the AC + H group.
The Raynauld et al. trial was an effectiveness study that also included an economic evaluation (Torrance 2002). The study was strengthened by the expertise of an independent, academic Steering Committee. This 'pragmatic' study operated under 'a real world scenario'. The trial highlighted the difference between radiologic grading completed by a central reader and that done by site investigators. Although Kellgren and Lawrence Grade 4 was an entry exclusion criteria, 20% of the appropriate care plus Hylan G‐F 20 group and 33% of the appropriate care without Hylan G‐F 20 group were rated as Grade 4 by the central reader. However, when Grade 4 was used as a covariate there was no significant difference in the analysis results. Repeat treatment was permitted to either or both knees as required during the trial.
The Rejaili et al. trial was a 24‐week, parallel‐group RCT performed at a single centre in Brazil comparing arthroscopy (articular lavage and debridement) followed by three weekly postoperative injections of Hylan G‐F 20 to arthroscopy alone in 20 patients with OA of the knee (Rejaili 2005). The authors reported that statistically significant differences were found in favour of the group receiving Hylan G‐F 20 postoperatively following arthroscopy for pain during rest at night, pain during movement with a 10% overload of the corporal weight, reduction of pain during the most painful movements of the knee, and in the number of potassium diclofenac tablets ingested daily for pain relief in the affected knee. With respect to safety, it was reported that postinjection synovitis did not occur during the trial.
The publication by Scale et al. reported two separate trials (Scale 1994a (2 inj); Scale 1994b (3 inj)). One was a comparison of two biweekly injections of Hylan G‐F 20 versus two biweekly injections of saline in 50 patients with OA of the knee (Scale 1994a (2 inj)), and the other was a comparison of three weekly injections of Hylan G‐F 20 versus three weekly injections of saline in 30 patients with OA of the knee (Scale 1994b (3 inj)). Both studies were 26‐week, parallel‐group, double‐blind RCTs performed at a single centre in Germany. Patients were excluded if effusion was present in the joint. For most outcome measures, the Hylan G‐F 20 treatment showed statistically significant superiority over saline treatment for both treatment regimens. The three‐injection treatment regimen was statistically more effective than the two‐injection treatment regimen. One local, treatment‐related, adverse event represented 1% of all the Hylan G‐F 20 injections or 2.5% of all the knees treated with Hylan G‐F 20 in this study.
Scale et al. published the first RCTs of Hylan G‐F 20. Continuous outcome measures were transformed into categorical scores. '"Successful treatment' (i.e. responder) was defined as a score of 0 to 20 mm on the VAS for the pain and activity reduction outcome measures, and a score of 80 to 100 mm for the improvement of the most painful knee movement. Although the journal publication reported results based on a combined control group, the PMA report provided results based on the separate randomised control groups which were used in this review. The three‐injection trial randomised 30 patients in total.
Wobig et al. reported a 26‐week, parallel‐group, double‐blind RCT performed at four centres in Germany comparing three weekly injections of Hylan G‐F 20 to three weekly injections of saline in 110 patients with OA of the knee (Wobig 1998). Statistically significant differences between Hylan G‐F 20 and saline treatment were reported for all outcome measures. No adverse events were observed in the injected joint after Hylan G‐F 20 treatment.
In the Wobig et al. RCT, patients with effusion were excluded (Wobig 1998). Again a categorical analysis was completed based on the same responder criteria as Scale et al. above. 98% of the randomised patients completed all follow‐up visits. Only one Hylan G‐F 20 patient did not participate in the telephone interview and one saline patient, who missed the visits at weeks eight and 12, did participate in the telephone interview at week 26.
The 1999 Wobig publication reported the results of two arms (Hylan G‐F 20 versus Artz) of a four‐arm trial (Artz, Healon, Hylan G‐F 20, nonelastoviscous hylan) (Wobig 1999). This was a 12‐week, parallel‐group, double‐blind RCT performed at six centres in Germany comparing three weekly injections of Hylan G‐F 20 to either three weekly injections of Artz (Wobig 1999b (Artz)), three weekly injections of Healon (Wobig 1999a (Healon)), or three weekly injections of nonelastoviscous (denatured) hylan (Wobig 1999c (NEhyl)) in 109 knees. Considering only the published Hylan G‐F 20 versus Artz comparison, significantly greater pain‐relieving effects were detected in favour of Hylan G‐F 20. No statistically significant differences in the incidence of adverse events between these two groups were detected.
In an attempt to explain the mechanism of action of viscosupplementation, the objective of the Wobig et al. trial (Wobig 1999b (Artz)) was to determine if a correlation existed between clinical effectiveness and elastoviscosity. Patients were once again categorised as 'symptom‐free' based on the Scale et al. criteria above.
Descriptions of the seven RCT in which Hylan G‐F 20 was the control treatment are found in the other product results sections: BioHy (Arthrease, Euflexxa, Nuflexxa) (Kirchner 2006, (Thompson 2002 ‐ abstract), Artz (Artzal, Supartz) (Karlsson 2002), Hyalgan (Brown 2003), and Orthovisc (Bayramoglu 2003; Karatay 2005; Karatosun 2005a; Kotevoglu 2005).
Hylan G‐F 20 (Synvisc) versus placebo
Nine RCTs included were comparisons of Hylan G‐F 20 and placebos (Cubukcu 2004; Dickson 2001; Groppa 2001; Karlsson 2002b (SvP); Moreland 1993; Scale 1994a (2 inj); Scale 1994b (3 inj); Wobig 1998, Wobig 1999c (NEhyl)). Control treatments included IA saline, arthrocentesis, arthrocentesis and placebo capsules taken once daily, and nonelastoviscous (NE) denatured hylan fluid. The current product monograph for Synvisc (Synvisc Hylan G‐F 20) indicates administration by IA injection once a week (one week apart) for a total of three injections. Efficacy Table 28; Table 29; Table 30; Table 31 Statistically significant differences in favour of Hylan G‐F 20 compared to placebo were found in pain on weight bearing (measured on 0 to 100 mm VAS) at 1 to 4 weeks postinjection (WMD (random‐effects model) ‐12.54; 95% CI ‐20.39 to ‐4.69, P value 0.002) (Karlsson 2002b (SvP); Moreland 1993; Scale 1994a (2 inj); Scale 1994b (3 inj); Wobig 1998; Wobig 1999c (NEhyl)). With the exception of the Karlsson RCT (Karlsson 2002b (SvP)), Hylan G‐F 20 was 4 to 24% more effective than placebo. With five trials, a statistically significant difference in favour of Hylan G‐F 20 compared to placebo was found at 5 to 13 weeks postinjection (WMD (random‐effects model) ‐22.46; 95% CI ‐35.24 to ‐9.68, P value 0.0006) (Karlsson 2002b (SvP); Scale 1994a (2 inj); Scale 1994b (3 inj); Wobig 1998; Wobig 1999c (NEhyl)). Hylan G‐F 20 was 1 to 43% more effective than placebo. At 14 to 26 weeks postinjection, there was a statistically significant difference in favour of Hylan G‐F 20 compared to placebo (WMD (random‐effects model) ‐20.70; 95% CI ‐35.56 to ‐5.83, P value 0.006) (Karlsson 2002b (SvP); Scale 1994a (2 inj); Scale 1994b (3 inj); Wobig 1998). Hylan G‐F 20 was 1 to 49% more effective than placebo.
28. Clinical benefit table: Hylan G‐F 20 versus placebo. Continuous outcome measures.
| Study | Time | Treatment group | Outcome (scale) | N of Pts | Baseline Mean | End of Study Mean | Absolute Benefit | Relative Difference |
| Scale 1994a | 5‐13 wk | E: Hylan G‐F 20 | Weight bearing pain (0‐100 mm VAS) | 25 | 61 | 27 | ‐20 (I) | ‐29.9% (I) |
| C: Saline | 25 | 67 | 53 | |||||
| Scale 1994a | 5‐13 wk | E: Hylan G‐F 20 | Pain at night (0‐100 mm VAS) | 25 | 29 | 16 | ‐13 (I) | ‐50.0% (I) |
| C: Saline | 25 | 26 | 26 | |||||
| Scale 1994b | 5‐13 wk | E: Hylan G‐F 20 | Weight bearing pain (0‐100 mm VAS) | 15 | 65 | 11 | ‐27 (I) | ‐38.6% (I) |
| C: Saline | 15 | 70 | 43 | |||||
| Scale 1994b | 5‐13 wk | E: Hylan G‐F 20 | Pain at night (0‐100 mm VAS) | 15 | 30 | 2 | ‐10 (I) | ‐30.3% (I) |
| C: Saline | 15 | 33 | 15 | |||||
| Wobig 1998 | 5‐13 wk | E: Hylan G‐F 20 | Weight bearing pain (0‐100 mm VAS) | 57 | 70 | 23 | ‐32 (I) | ‐42.7% (I) |
| C: Saline | 60 | 75 | 60 | |||||
| Wobig 1998 | 5‐13 wk | E: Hylan G‐F 20 | Pain at night (0‐100 mm VAS) | 57 | 41 | 12 | ‐13 (I) | ‐28.3% (I) |
| C: Saline | 60 | 46 | 30 | |||||
| Wobig 1999 | 5‐13 wk | E: Hylan G‐F 20 | Weight bearing pain (0‐100 mm VAS) | 38 | 70 | 32 | ‐1 (I) | ‐1.3% (I) |
| C: Nonelastoviscous Hylan G‐F 20 | 36 | 80 | 43 | |||||
| Wobig 1999 | 5‐13 wk | E: Hylan G‐F 20 | Pain at night (0‐100 mm VAS) | 38 | 26 | 13 | 2 (W) | 7.4% (W) |
| C: Nonelastoviscous Hylan G‐F 20 | 36 | 27 | 12 | |||||
| Moreland 1993 | 1‐4 wk | E: Hylan GF 20 | Pain on motion (0‐100 mm VAS) | 46 | 69 | 47 | ‐3 (I) | ‐4.3% (I) |
| C: Arthrocentesis | 48 | 70 | 51 | |||||
| Moreland 1993 | 1‐4 wk | E: Hylan G‐F 20 | Pain at night (0‐100 mm VAS) | 46 | 60 | 36 | 6 (W) | 8% (W) |
| C: Arthrocentesis | 48 | 75 | 45 | |||||
| Moreland 1993 | 1‐4 wk | E: Hylan GF 20 | Pain at rest (0‐100 mm VAS) | 46 | 61 | 39 | ‐2 (I) | ‐3.1% (I) |
| C: Arthrocentesis | 48 | 64 | 44 | |||||
| Moreland 1993 | 1‐4 wk | E: Hylan G‐F 20 | Pain walking (0‐100 mm VAS) | 46 | 79 | 57 | ‐2 (I) | ‐2.5% (I) |
| C: Arthrocentesis | 48 | 80 | 60 | |||||
| Moreland 1993 | 1‐4 wk | E: Hylan GF 20 | Pain overall (0‐100 mm VAS) | 46 | 78 | 55 | ‐2 (I) | ‐2.6% (I) |
| C: Arthrocentesis | 48 | 78 | 57 | |||||
| Dickson 2001 | 5‐13 wk | E: Hylan G‐F 20 | WOMAC pain (0‐100 mm VAS) | 53 | 59 | 26 | ‐9 (I) | ‐15.5% (I) |
| C: Arthrocentesis + Placebo capsules | 57 | 58 | 34 | |||||
| Dickson 2001 | 5‐13 wk | E: Hylan G‐F 20 | WOMAC function (0‐100 VAS) | 53 | 54 | 38 | ‐7 (I) | ‐12.5% (I) |
| C: Arthrocentesis + Placebo capsules | 57 | 56 | 47 | |||||
| Dickson 2001 | 5‐13 wk | E: Hylan G‐F 20 | Lequesne Index (0‐24) | 53 | 13.9 | 10.9 | ‐1 (I) | ‐6.9% (I) |
| C: Arthrocentesis + Placebo capsules | 57 | 14.5 | 12.5 | |||||
| Karlsson 2002b | 1‐4 wk | E: Hylan G‐F 20 | Pain on weight bearing (0‐100 mm VAS) | 88 | 63 | 45 | 3.0 (W) | 4.6% (W) |
| C: Saline | 66 | 65 | 44 | |||||
| Karlsson 2002b | 5‐13 wk | E: Hylan G‐F 20 | Pain on weight bearing (0‐100 mm VAS) | 88 | 63 | 41 | ‐3.0 (I) | ‐4.6% (I) |
| C: Saline | 66 | 65 | 46 | |||||
| Karlsson 2002b | 14‐26 wk | E: Hylan G‐F 20 | Pain on weight bearing (0‐100 mm VAS) | 88 | 63 | 43 | 1.0 (W) | 1.5% (W) |
| C: Saline | 66 | 65 | 44 | |||||
| Karlsson 2002b | 5‐13 wk | E: Hylan G‐F 20 | WOMAC (0‐100 mm VAS) | 88 | 48.7 | 31.7 | 1.2 (W) | 2.5% (W) |
| C: Saline | 66 | 48.9 | 30.7 | |||||
| Karlsson 2002b | 14‐26 wk | E: Hylan G‐F 20 | WOMAC (0‐100 mm VAS) | 88 | 48.7 | 31.9 | ‐1.0 (I) | ‐2.0% (I) |
| C: Saline | 66 | 48.9 | 33.1 | |||||
| Karlsson 2002b | 14‐26 wk | E: Hylan G‐F 20 | Lequesne Index (0‐24) | 88 | 13.4 | 9.0 | 0.3 (W) | 2.2% (W) |
| C: Saline | 66 | 13.6 | 8.9 | |||||
| Scale 1994a | 14‐26 wk | E: Hylan G‐F 20 | Pain on weight bearing (0‐100 mm VAS) | 15 | 61 | 18 | ‐33 (I) | ‐49.3 (I) |
| C: Saline | 21 | 67 | 57 | |||||
| Scale 1994a | 14‐26 wk | E: Hylan G‐F 20 | Pain at night (0‐100 mm VAS) | 15 | 29 | 10 | ‐25 (I) | ‐96.2 (I) |
| C: Saline | 21 | 26 | 32 | |||||
| Scale 1994b | 14‐26 wk | E: Hylan G‐F 20 | Pain on weight bearing (0‐100 mm VAS) | 15 | 65 | 22 | ‐18 (I) | ‐25.7 (I) |
| C: Saline | 15 | 70 | 45 | |||||
| Scale 1994b | 14‐26 wk | E: Hylan G‐F 20 | Pain at night (0‐100 mm VAS) | 15 | 30 | 3 | ‐10 (I) | ‐30.3 (I) |
| C: Saline | 15 | 33 | 16 | |||||
| Wobig 1998 | 14‐26 wk | E: Hylan G‐F 20 | Pain on weight bearing (0‐100 mm VAS) | 56 | 70 | 35 | ‐16 (I) | ‐21.3 (I) |
| C: Saline | 60 | 75 | 56 | |||||
| Wobig 1998 | 14‐26 wk | E: Hylan G‐F 20 | Pain at night (0‐100 mm VAS) | 56 | 41 | 16 | ‐13 (I) | ‐28.3% (I) |
| C: Saline | 60 | 46 | 34 | |||||
| Scale 1994a | 1‐4 wk | E: Hylan G‐F 20 | Weight bearing pain (0‐100 mm VAS) | 25 | 61 | 32 | ‐9 (I) | ‐13.4% (I) |
| C: Saline | 25 | 67 | 47 | |||||
| Scale 1994a | 1‐4 wk | E: Hylan G‐F 20 | Pain at night (0‐100 mm VAS) | 25 | 29 | 18 | ‐8 (I) | ‐30.8% (I) |
| C: Saline | 25 | 26 | 23 | |||||
| Scale 1994b | 1‐4 wk | E: Hylan G‐F 20 | Weight bearing pain (0‐100 mm VAS) | 15 | 65 | 22 | ‐17 (I) | ‐24.3% (I) |
| C: Saline | 15 | 70 | 44 | |||||
| Scale 1994b | 1‐4 wk | E: Hylan G‐F 20 | Pain at night (0‐100 mm VAS) | 15 | 30 | 7 | ‐7 (I) | ‐21.2% (I) |
| C: Saline | 15 | 33 | 17 | |||||
| Wobig 1998 | 1‐4 wk | E: Hylan G‐F 20 | Weight bearing pain (0‐100 mm VAS) | 57 | 70 | 31 | ‐17 (I) | ‐22.7% (I) |
| C: Saline | 60 | 75 | 53 | |||||
| Wobig 1998 | 1‐4 wk | E: Hylan G‐F 20 | Pain at night (0‐100 mm VAS) | 57 | 41 | 15 | ‐6 (I) | ‐13.0% (I) |
| C: Saline | 60 | 46 | 26 | |||||
| Wobig 1999 | 1‐4 wk | E: Hylan G‐F 20 | Weight bearing pain (0‐100 mm VAS) | 38 | 70 | 40 | ‐3 (I) | ‐3.8% (I) |
| C: Saline | 36 | 80 | 53 | |||||
| Wobig 1998 | 1‐4 wk | E: Hylan G‐F 20 | Pain at night (0‐100 mm VAS) | 38 | 26 | 12 | 1 (W) | 3.7% (W) |
| C: Saline | 36 | 27 | 12 | |||||
| Cubukcu 2004 | 1‐4 wk | E: Hylan G‐F 20 | Pain at night (0‐100 mm VAS) | 20 | 45 | 27 | ||
| C: Saline | 10 | 54 | 37 | |||||
| Cubukcu 2004 | 5‐13 wk | E: Hylan G‐F 20 | Pain at night (0‐100 mm VAS) | 20 | 45 | 23 | ||
| C: Saline | 10 | 54 | 44 | |||||
| Cubukcu 2004 | 1‐4 wk | E: Hylan G‐F 20 | Pain at rest (0‐100 mm VAS) | 20 | 47 | 29 | ||
| C: Saline | 10 | 51 | 39 | |||||
| Cubukcu 2004 | 5‐13 wk | E: Hylan G‐F 20 | Pain at rest (0‐100 mm VAS) | 20 | 47 | 22 | ||
| C: Saline | 10 | 51 | 41 | |||||
| Cubukcu 2004 | 1‐4 wk | E: Hylan G‐F 20 | Pain walking (0‐100 mm VAS) | 20 | 71 | 47 | ||
| C: Saline | 10 | 67 | 51 | |||||
| Cubukcu 2004 | 5‐13 wk | E: Hylan G‐F 20 | Pain walking (0‐100 mm VAS) | 20 | 71 | 40 | ||
| C: Saline | 10 | 67 | 54 | |||||
| Cubukcu 2004 | 1‐4 wk | E: Hylan G‐F 20 | Need for paracetamol (pill count) | 20 | 1.0 | 0.0 | ||
| C: Saline | 10 | 0.9 | 0.1 | |||||
| Cubukcu 2004 | 5‐13 wk | E: Hylan G‐F 20 | Need for paracetamol (pill count) | 20 | 1.0 | 0.0 | ||
| C: Saline | 10 | 0.9 | 0.7 | |||||
| Cubukcu 2004 | 1‐4 wk | E: Hylan G‐F 20 | WOMAC pain (5‐25) | 20 | 16 | 11 | ||
| C: Saline | 10 | 18 | 14 | |||||
| Cubukcu 2004 | 5‐13 wk | E: Hylan G‐F 20 | WOMAC pain (5‐25) | 20 | 16 | 9 | ||
| C: Saline | 10 | 18 | 15 | |||||
| Cubukcu 2004 | 1‐4 wk | E: Hylan G‐F 20 | WOMAC function (17‐85) | 20 | 50 | 41 | ||
| C: Saline | 10 | 48 | 47 | |||||
| Cubukcu 2004 | 5‐13 wk | E: Hylan G‐F 20 | WOMAC function (17‐85) | 20 | 50 | 36 | ||
| C: Saline | 10 | 48 | 47 |
29. Clinical benefit table: Hylan G‐F 20. Patient global assessment.
| Study | Time | Treat group | Outcome | No.improved | No.of pts. | Risk (% occurrence) | Risk Difference | NNT |
| Dickson 2001 | 5‐13 wk | E: Hylan G‐F 20 | Number of patients very good/good | 29 | 42 | 69 | 21 | 4.8 |
| C: Arthrocentesis | 23 | 48 | 48 | |||||
| Dickson 2001 | 5‐13 wk | E: Hylan G‐F 20 | Number of patients very good/good | 29 | 42 | 69 | 14 | 7.1 |
| C:Diclofenac + arthrocentesis | 35 | 42 | 83 | |||||
| Adams 1995 | 14‐26 wk | E: Hylan G‐F 20 | Number of patients rating treatment excellent, very good, good | 17 | 27 | 63 | 24 | 4.2 |
| C: NSAID + arthrocentesis | 12 | 31 | 39 | |||||
| Adams 1995 | 14‐26 wk | E: Hylan G‐F 20 + NSAID | Number of patients rating treatment excellent, very good, good | 17 | 27 | 63 | 7 | 14.3 |
| C: NSAID + arthrocentesis | 18 | 32 | 56 | |||||
| Raynauld 2002 | 45‐52 wk | E: Hylan G‐F 20 + Appropriate Care | Number of patients improved in study knee | 93 | 127 | 73 | 46 | 2.2 |
| C: Appropriate care | 35 | 128 | 27 |
30. Clinical benefit table. Hylan G‐F 20. Continuous outcome measures.
| Study | TIme | Treatment | Outcome | N of Pts | Baseline Mean | End of Study Mean | Absolute Benefit | Relative Difference |
| Cubukcu 2004 | 1‐4 wk | E: Hylan G‐F 20 | WOMAC stiffness (2‐10) | 20 | 6 | 4 | ‐1 (I) | ‐16.7% (I) |
| C: Saline | 10 | 6 | 5 | |||||
| Cubukcu 2004 | 5‐13 wk | E: Hylan G‐F 20 | WOMAC stiffness (2‐10) | 20 | 6 | 4 | ‐1 (I) | ‐16.7% (I) |
| C: Saline | 10 | 6 | 5 | |||||
| Cubukcu 2004 | 1‐4 wk | E: Hylan G‐F 20 | 15 m walking time | 20 | 21 | 17 | ‐3 (I) | ‐16.72% (I) |
| C: Saline | 10 | 18 | 17 | |||||
| Cubukcu 2004 | 5‐13 wk | E: Hylan G‐F 20 | 15 m walking time | 20 | 21 | 16 | ‐4 (I) | ‐22.2% (I) |
| C: Saline | 10 | 18 | 17 | |||||
| Karatosun 2005 | 1‐4 wk | E: Hylan G‐F 20 | Pain during activity | 52 | 4.0 | 10.8 | 2.4 (I) | 53.3% (I) |
| C: Exercise | 53 | 4.5 | 8.9 | |||||
| Karatosun 2005 | 5‐13 wk | E: Hylan G‐F 20 | Pain during activity | 52 | 4.0 | 10.8 | 2.2 (I) | 48.9% (I) |
| C: Exercise | 53 | 4.5 | 9.1 | |||||
| Karatosun 2005 | 14‐26 wk | E: Hylan G‐F 20 | Pain during activity | 52 | 4.0 | 11.1 | 3.0 (I) | 66.7% (I) |
| C: Exercise | 53 | 4.5 | 8.6 | |||||
| Karatosun 2005 | 45‐52 wk | E: Hylan G‐F 20 | Pain during activity | 46 | 4.0 | 8.5 | ‐1.2 (W) | ‐26.7% (W) |
| C: Exercise | 53 | 4.5 | 10.2 | |||||
| Karatosun 2005 | 74 wk | E: Hylan G‐F 20 | Pain during activity | 31 | 4.0 | 12.9 | 1.3 (I) | 28.9% (I) |
| C: Exercise | 53 | 4.5 | 12.1 | |||||
| Karatosun 2005 | 1‐4 wk | E: Hylan G‐F 20 | Pain at rest | 52 | 7.8 | 13.1 | 2.1 (I) | 23.1% (I) |
| C: Exercise | 53 | 9.1 | 12.2 | |||||
| Karatosun 2005 | 5‐13 wk | E: Hylan G‐F 20 | Pain at rest | 52 | 7.8 | 12.7 | 1.3 (I) | 14.3% (I) |
| C: Exercise | 53 | 9.1 | 12.7 | |||||
| Karatosun 2005 | 14‐26 wk | E: Hylan G‐F 20 | Pain at rest | 52 | 7.8 | 12.8 | 1.7 (I) | 18.7% (I) |
| C: Exercise | 53 | 9.1 | 12.4 | |||||
| Karatosun 2005 | 45‐52 wk | E: Hylan G‐F 20 | Pain at rest | 46 | 7.8 | 11.7 | 0.1 (I) | 1.1% (I) |
| C: Exercise | 53 | 9.1 | 12.9 | |||||
| Karatosun 2005 | 74 wk | E: Hylan G‐F 20 | Pain at rest | 31 | 7.8 | 13.7 | 1.8 (I) | 19.8% (I) |
| C: Exercise | 53 | 9.1 | 13.2 | |||||
| Karatosun 2005 | 1‐4 wk | E: Hylan G‐F 20 | Pain during climbing stairs | 52 | 2.5 | 3.2 | 0.2 (I) | 8% (I) |
| C: Exercise | 53 | 2.5 | 3.0 | |||||
| Karatosun 2005 | 5‐13 wk | E: Hylan G‐F 20 | Pain during climbing stairs | 52 | 2.5 | 3.3 | 0.1 (I) | 4% (I) |
| C: Exercise | 53 | 2.5 | 3.2 | |||||
| Karatosun 2005 | 14‐26 wk | E: Hylan G‐F 20 | Pain during climbing stairs | 52 | 2.5 | 3.2 | 0 | 0% |
| C: Exercise | 53 | 2.5 | 3.2 | |||||
| Karatosun 2005 | 45‐52 wk | E: Hylan G‐F 20 | Pain during climbing stairs | 46 | 2.5 | 3.1 | ‐0.1 (W) | ‐4% (W) |
| C: Exercise | 53 | 2.5 | 3.2 | |||||
| Karatosun 2005 | 74 wk | E: Hylan G‐F 20 | Pain during climbing stairs | 31 | 2.5 | 3.9 | 0.2 (I) | 8% (I) |
| C: Exercise | 53 | 2.5 | 3.7 | |||||
| Karatosun 2005 | 1‐4 wk | E: Hylan G‐F 20 | Pain during transfer activity | 52 | 2.9 | 4.0 | ‐0.1 (W) | ‐3.2% (W) |
| C: Exercise | 53 | 3.1 | 4.3 | |||||
| Karatosun 2005 | 5‐13 wk | E: Hylan G‐F 20 | Pain during transfer activity | 52 | 2.9 | 4.2 | 0 | 0% |
| C: Exercise | 53 | 3.1 | 4.4 | |||||
| Karatosun 2005 | 14‐26 wk | E: Hylan G‐F 20 | Pain during transfer activity | 52 | 2.9 | 4.3 | 0.2 (I) | 6.5% (I) |
| C: Exercise | 53 | 3.1 | 4.3 | |||||
| Karatosun 2005 | 45‐52 wk | E: Hylan G‐F 20 | Pain during transfer activity | 46 | 2.9 | 4.1 | ‐0.3 (W) | ‐9.7% (W) |
| C: Exercise | 53 | 3.1 | 4.6 | |||||
| Karatosun 2005 | 74 wk | E: Hylan G‐F 20 | Pain during transfer activity | 31 | 2.9 | 4.1 | 0.1 (I) | 3.2% (I) |
| C: Exercise | 53 | 3.1 | 4.2 | |||||
| Karatosun 2005 | 1‐4 wk | E: Hylan G‐F 20 | Walkiing distance | 52 | 8.1 | 10.2 | 0.7 (I) | 8.9% (I) |
| C: Exercise | 53 | 7.9 | 9.3 | |||||
| Karatosun 2005 | 5‐13 wk | E: Hylan G‐F 20 | Walking distance | 52 | 8.1 | 10.5 | 0.2 (I) | 2.5% (I) |
| C: Exercise | 53 | 7.9 | 10.1 | |||||
| Karatosun 2005 | 14‐26 wk | E: Hylan G‐F 20 | Walking distance | 52 | 8.1 | 10.4 | 0.5 (I) | 6.3% (I) |
| C: Exercise | 53 | 7.9 | 9.7 | |||||
| Karatosun 2005 | 45‐52 wk | E: Hylan G‐F 20 | Walking distance | 46 | 8.1 | 9.6 | ‐0.5 (W) | ‐6.3% (W) |
| C: Exercise | 53 | 7.9 | 9.9 | |||||
| Karatosun 2005 | 74 wk | E: Hylan G‐F 20 | Walking distance | 31 | 8.1 | 10.4 | ‐0.1 (W) | ‐1.3% (W) |
| C: Exercise | 53 | 7.9 | 10.3 | |||||
| Karatosun 2005 | 1‐4 wk | E: Hylan G‐F 20 | Range of motion | 52 | 113.2 | 116.3 | 0.4 (I) | 0.3% (I) |
| C: Exercise | 53 | 114.4 | 117.1 | |||||
| Karatosun 2005 | 5‐13 wk | E: Hylan G‐F 20 | Range of motion | 52 | 113.2 | 117.1 | 0.4 (I) | 0.3% (I) |
| C: Exercise | 53 | 114.4 | 117.9 | |||||
| Karatosun 2005 | 14‐26 wk | E: Hylan G‐F 20 | Range of motion | 52 | 113.2 | 117.8 | 1.2 (I) | 1.0% (I) |
| C: Exercise | 53 | 114.4 | 117.8 | |||||
| Karatosun 2005 | 45‐52 wk | E: Hylan G‐F 20 | Range of motion | 46 | 113.2 | 117.2 | 0.6 (I) | 0.5% (I) |
| C: Exercise | 53 | 114.4 | 117.8 | |||||
| Karatosun 2005 | 74 wk | E: Hylan G‐F 20 | Range of motion | 31 | 113.2 | 118.6 | 1.9 (I) | 1.7% (I) |
| C: Exercise | 53 | 114.4 | 117.9 | |||||
| Karatosun 2005 | 1‐4 wk | E: Hylan G‐F 20 | Total Hospital for Special Surgery Knee Score | 52 | 62.6 | 81.3 | 4.3 (I) | 6.6% (I) |
| C: Exercise | 53 | 65.4 | 79.8 | |||||
| Karatosun 2005 | 5‐13 wk | E: Hylan G‐F 20 | Total Hospital for Special Surgery Knee Score | 52 | 62.6 | 82.2 | 3.48 (I) | 5.3% (I) |
| C: Exercise | 53 | 65.4 | 81.52 | |||||
| Karatosun 2005 | 14‐26 wk | E: Hylan G‐F 20 | Total Hospital for Special Surgery Knee Score | 52 | 62.6 | 82.7 | 5.5 (I) | 8.4% (I) |
| C: Exercise | 53 | 65.4 | 80.0 | |||||
| Karatosun 2005 | 45‐52 wk | E: Hylan G‐F 20 | Total Hospital for Special Surgery Knee Score | 46 | 62.6 | 78.8 | ‐1.16 (W) | ‐1.8% (W) |
| C: Exercise | 53 | 65.4 | 82.76 | |||||
| Karatosun 2005 | 74 wk | E: Hylan G‐F 20 | Total Hospital for Special Surgery Knee Score | 31 | 62.6 | 88.8 | 3.3 (I) | 5.0 (I) |
| C: Exercise | 53 | 65.4 | 88.3 |
31. Clinical benefit table: Hylan G‐F 20. Continuous outcome measures.
| Study | Time | Treatment | Outcome | N of Pts | Baseline Mean | End of Study Mean | Absolute Benefit | Relative Difference |
| Atamaz 2005 | 1‐4 wk | E: Hylan G‐F 20 | WOMAC pain (Likert) | 20 | 12.4 | 8.3 | ‐1.2 (I) | ‐8.5% (I) |
| C: Physical Therapy | 40 | 14.2 | 11.3 | |||||
| Atamaz 2005 | 5‐13 wk | E: Hylan G‐F 20 | WOMAC pain (Likert) | 20 | 12.4 | 8.7 | ‐1.3 (I) | ‐9.2% (I) |
| C: Physical Therapy | 40 | 14.2 | 11.8 | |||||
| Atamaz 2005 | 14‐26 wk | E: Hylan G‐F 20 | WOMAC pain (Likert) | 20 | 12.4 | 10.4 | 0.9 (W) | 6.3% (W) |
| C: Physical Therapy | 40 | 14.2 | 11.3 | |||||
| Atamaz 2005 | 37 wk | E: Hylan G‐F 20 | WOMAC pain (Likert) | 20 | 12.4 | 10.4 | ‐0.1 (I) | ‐0.7% (I) |
| C: Physical Therapy | 40 | 14.2 | 12.3 | |||||
| Atamaz 2005 | 45‐52 wk | E: Hylan G‐F 20 | WOMAC pain (Likert) | 20 | 12.4 | 10.2 | ‐3.5 (I) | ‐24.6% (I) |
| C: Physical Therapy | 40 | 14. | 15.5 | |||||
| Atamaz 2005 | 1‐4 wk | E: Hylan G‐F 20 | Spontaneous pain (0‐100 mm VAS) | 20 | 85.0 | 64.0 | 29.0 (W) | 31.0% (W) |
| C: Physical Therapy | 40 | 93.5 | 43.5 | |||||
| Atamaz 2005 | 5‐13 wk | E: Hylan G‐F 20 | Spontaneous pain (0‐100 mm VAS) | 20 | 85.0 | 45.5 | 4.5 (W) | 4.8% (W) |
| C: Physical Therapy | 40 | 93.5 | 49.5 | |||||
| Atamaz 2005 | 14‐26 wk | E: Hylan G‐F 20 | Spontaneous pain (0‐100 mm VAS) | 20 | 85.0 | 50.7 | 10.7 (W) | 11.4% (W) |
| C: Physical Therap | 40 | 93.5 | 48.5 | |||||
| Atamaz 2005 | 37 wk | E: Hylan G‐F 20 | Spontaneous pain (0‐100 mm VAS) | 20 | 85.0 | 51.7 | 9.5 (W) | 10.2% (W) |
| C: Physical Therapy | 40 | 93.5 | 50.7 | |||||
| Atamaz 2005 | 45‐52 wk | E: Hylan G‐F 20 | Spontaneous pain (0‐100 mm VAS) | 20 | 85.0 | 49.0 | ‐2 (I) | ‐2.1% (I) |
| C: Physical Therapy | 40 | 93.5 | 59.5 | |||||
| Atamaz 2005 | 1‐4 wk | E: Hylan G‐F 20 | SF‐36 pain | 20 | 25.6 | 59.4 | 4.3 (I) | 14.5% (I) |
| C: Physical Therapy | 40 | 29.6 | 59.1 | |||||
| Atamaz 2005 | 5‐13 wk | E: Hylan G‐F 20 | SF‐36 pain | 20 | 25.6 | 58.8 | 6.6 (I) | 22.3% (I) |
| C: Physical Therapy | 40 | 29.6 | 56.2 | |||||
| Atamaz 2005 | 14‐26 wk | E: Hylan G‐F 20 | SF‐36 pain | 20 | 25.6 | 55.7 | 5.1 (I) | 17.2% (I) |
| C: Physical Therapy | 40 | 29.6 | 54.6 | |||||
| Atamaz 2005 | 37 wk | E: Hylan G‐F 20 | SF‐36 pain | 20 | 25.6 | 43.8 | ‐3.5 (W) | ‐11.8% (W) |
| C: Physical Therapy | 40 | 29.6 | 51.3 | |||||
| Atamaz 2005 | 45‐52 wk | E: Hylan G‐F 20 | SF‐36 pain | 20 | 25.6 | 46.7 | 0.5 (I) | 1.7% (I) |
| C: Physical Therapy | 40 | 29.6 | 50.2 | |||||
| Atamaz 2005 | 1‐4 wk | E: Hylan G‐F 20 | WOMAC physical function (Likert) | 20 | 58.3 | 40.1 | ‐5.9 (I) | ‐11.8% (I) |
| C: Physical Therapy | 40 | 49.9 | 37.6 | |||||
| Atamaz 2005 | 5‐13 wk | E: Hylan G‐F 20 | WOMAC physical function | 20 | 58.3 | 41.7 | ‐5.6 (I) | ‐11.2% (I) |
| C: Physical Therapy | 40 | 49.9 | 38.9 | |||||
| Atamaz 2005 | 14‐26 wk | E: Hylan G‐F 20 | WOMAC physical function | 20 | 58.3 | 41.9 | ‐8.4 (I) | ‐16.8% (I) |
| C: Physical Therapy | 40 | 49.9 | 41.9 | |||||
| Atamaz 2005 | 37 wk | E: Hylan G‐F 20 | WOMAC physical function | 20 | 58.3 | 38.6 | ‐8.0 (I) | ‐16.0% (I) |
| C: Physical Therapy | 40 | 49.9 | 38.2 | |||||
| Atamaz 2005 | 45‐52 wk | E: Hylan G‐F 20 | WOMAC physical function | 20 | 58.3 | 38.9 | ‐7.7 (I) | ‐15.4% (I) |
| C: Physical Therapy | 40 | 49.9 | 38.2 | |||||
| Atamaz 2005 | 1‐4 wk | E: Hylan G‐F 20 | SF‐36 physical functioning | 20 | 35.5 | 57.2 | ‐0.3 (W) | ‐0.9% (W) |
| C: Physical Therapy | 40 | 31.7 | 53.7 | |||||
| Atamaz 2005 | 5‐13 wk | E: Hylan G‐F 20 | SF‐36 physical functioning | 20 | 35.5 | 61.7 | 4.4 (I) | 13.9% (I) |
| C: Physical Therapy | 40 | 31.7 | 53.5 | |||||
| Atamaz 2005 | 14‐26 wk | E: Hylan G‐F 20 | SF‐36 physical functioning | 20 | 35.5 | 55.7 | ‐2.0 (W) | ‐6.3% (W) |
| C: Physical Therapy | 40 | 31.7 | 54.0 | |||||
| Atamaz 2005 | 37 wk | E: Hylan G‐F 20 | SF‐36 physical functioning | 20 | 35.5 | 45.0 | ‐8.0 (W) | ‐25.2% (W) |
| C: Physical Therapy | 40 | 31.7 | 49.2 | |||||
| Atamaz 2005 | 45‐52 wk | E: Hylan G‐F 20 | SF‐36 physical functioning | 20 | 35.5 | 54.0 | ‐2.8 (W) | ‐8.8% (W) |
| C: Physical Therapy | 40 | 31.7 | 53.0 |
Statistically significant differences in favour of Hylan G‐F 20 compared to placebo were found in pain at night (measured on 0 to 100 mm VAS) at 1 to 4 weeks postinjection (WMD ‐8.03; 95% CI ‐11.95 to ‐4.12, P < 0.0001) (Cubukcu 2004; Moreland 1993; Scale 1994a (2 inj); Scale 1994b (3 inj); Wobig 1998; Wobig 1999c (NEhyl)). Hylan G‐F 20 was 13 to 31% more effective than placebo. With five trials, a statistically significant difference in favour of Hylan G‐F 20 compared to placebo was found at 5 to 13 weeks postinjection (WMD (random‐effects model) ‐13.08; 95% CI ‐20.35 to ‐5.80, P value 0.0004) (Cubukcu 2004; Scale 1994a (2 inj); Scale 1994b (3 inj); Wobig 1998; Wobig 1999c (NEhyl)). Hylan G‐F 20 was 28 to 50% more effective than placebo. At 14 to 26 weeks postinjection, based on three trials, there was a statistically significant difference in favour of Hylan G‐F 20 compared to placebo (WMD ‐17.12; 95% CI ‐23.22 to ‐11.02, P < 0.00001) (Scale 1994a (2 inj); Scale 1994b (3 inj); Wobig 1998). Hylan G‐F 20 was 28 to 96% more effective than placebo.
Statistically significant differences in favour of Hylan G‐F 20 compared to saline were detected in pain at rest (0 ‐ 100 mm VAS) both at 1 to 4 weeks postinjection (WMD ‐9.44; 95% CI ‐14.07 to ‐4.82, P < 0.0001)(Cubukcu 2004; Moreland 1993); and at 5 to 13 weeks postinjection (WMD ‐18.67; 95% CI ‐23.32 to ‐14.02, P < 0.00001) (Cubukcu 2004). Statistically significant differences in favour of Hylan G‐F 20 compared to saline were detected in pain walking (0‐100 mm VAS) at 5 to 13 weeks postinjection (WMD ‐13.80; 95% CI ‐19.74 to ‐7.86, P < 0.00001) (Cubukcu 2004); but not at 1 to 4 weeks postinjection (Cubukcu 2004; Moreland 1993). No statistically significant difference was detected at 1 to 4 weeks postinjection in pain overall (0 to 100 mm VAS) (Moreland 1993).
Statistically significant differences were detected in WOMAC OA Index pain at 1 to 4 week postinjection (SMD ‐1.26; 95% CI ‐1.86 to ‐0.66, P < 0.0001) (Cubukcu 2004; Kotevoglu 2005), at 5 to 13 weeks postinjection (SMD ‐0.69; 95% CI ‐1.02 to ‐0.36, P < 0.0001)(Cubukcu 2004; Dickson 2001; Kotevoglu 2005), and at 14 to 26 weeks postinjection (WMD ‐1.09; 95% CI ‐1.92 to ‐0.25, P value 0.01)(Kotevoglu 2005).
A statistically significant difference in favour of Hylan G‐F 20 was detected in the WOMAC OA Index physical function subscale at 1 to 4 weeks postinjection (WMD (RE) ‐9.42; 95% CI ‐18.46 to ‐0.37, P value 0.04 (Cubukcu 2004; Kotevoglu 2005), at 5 to 13 weeks postinjection (WMD ‐11.91; 95% CI ‐15.06 to ‐8.76, P < 0.00001) (Cubukcu 2004; Dickson 2001; Kotevoglu 2005), at 14 to 26 weeks postinjection (WMD ‐17.00; 95% CI ‐26.90 to ‐7.10, P value 0.0008)(Kotevoglu 2005).
A statistically significant difference in favour of Hylan G‐F was detected in the Lequesne Index at 5 to 13 weeks postinjection (WMD ‐1.60; 95% CI ‐2.99 to ‐0.21, P value 0.02) (Dickson 2001). Hylan G‐F 20 was 7% more effective than placebo.The RevMan analysis differed from the publication analysis (Dickson 2001). The publication reported no difference in the Lequesne Index at 5 to 13 weeks (P value 0.17) whereas RevMan detected a statistically significant difference in favour of Hylan G‐F 20. No statistically significant difference was detected in the Lequesne Index at 14 to 26 weeks postinjection (Karlsson 2002b (SvP)).
A statistically significant difference in favour of Hylan G‐F 20 compared to placebo was detected in improvement in the most painful knee movement (0 to 100 mm VAS) both at 1 to 4 weeks postinjection (WMD 19.29; 95% CI 12.16 to 26.31, P < 0.00001) and at 5 to 13 weeks postinjection (WMD (random‐effects model) 33.87; 95% CI 21.19 to 46.55, P < 0.00001) (Scale 1994a (2 inj); Scale 1994b (3 inj); Wobig 1998; Wobig 1999c (NEhyl)).
No statistically significant difference in 15 metre walking time was detected between Hylan G‐F 20 and saline either at 1 to 4 or 5 to 13 weeks postinjection (Cubukcu 2004).
Statistically significant differences were detected in WOMAC OA Index stiffness (Likert) at 1 to 4 weeks postinjection (WMD ‐1.08; 95% CI ‐1.73 to ‐0.44, P value 0.001), at 5 to 13 weeks postinjection (WMD ‐1.34; 95% CI ‐2.13 to ‐0.55, P value 0.0009) (Cubukcu 2004; Kotevoglu 2005), and at 14 to 26 weeks postinjection (WMD ‐1.00; 95% CI ‐1.89 to ‐0.11, P value 0.03) (Kotevoglu 2005).
When patient global assessment data were dichotomised into improved or not improved by classifying responses of 'very poor', 'poor' and 'fair' as 'not improved' and 'good' and 'very good' as 'improved', more patients in the Hylan G‐F 20 group were either 'very good' or 'good' (69%) than in the double control group (48%) at 5 to 13 weeks postinjection (RR 1.44; 95% CI 1.01 to 2.06, P value 0.05) (Dickson 2001).
A statistically significant difference in favour of Hylan G‐F 20 compared to placebo was detected for patient global assessment of treatment efficacy (0 to 100 mm VAS) both at 1 to 4 weeks postinjection (SMD 0.70; 95% CI 0.46 to 0.93, P < 0.00001) and at 5 to 13 weeks postinjection (SMD (random effects) 1.54; 95% CI 0.84 to 2.24, P < 0.0001) (Cubukcu 2004; Scale 1994a (2 inj); Scale 1994b (3 inj); Wobig 1998; Wobig 1999c (NEhyl)).
Statistically significant differences were detected in patient global assessment (measured 0 to 100 mm VAS, where 100 was worst severity) in favour of Hylan G‐F 20 compared to saline both at 1 to 4 weeks postinjection (WMD ‐20.00; 95% CI ‐33.16 o ‐6.84, P value 0.003) and at 5 to 13 weeks postinjection (WMD ‐20.00; 95% CI ‐30.57 to ‐9.43, P value 0.0002); but not at 14 to 26 weeks postinjection (Kotevoglu 2005). Similarly, statistically significant differences were detected in physican global assessment (measured 0 to 100 mm VAS, where 100 was worst severity) in favour of Hylan G‐F 20 compared to saline both at 1 to 4 weeks postinjection (WMD ‐20.00; 95% CI ‐37.64 to ‐2.36, P value 0.03) and at 5 to 13 weeks postinjection (WMD ‐20.00; 95% CI ‐36.10 to ‐3.90, P value 0.01) but not at 14 to 26 weeks postinjection (Kotevoglu 2005).
No statistically significant difference was noted in the number of clinical failures at 14 to 26 weeks postinjection: Hylan G‐F 20 7% and Saline 11%, or at 45 to 52 weeks postinjection: Hylan G‐F 20 46% and saline 54% (Karlsson 2002b (SvP)), or in the number of survivors (i.e. patients not requiring additional treatment to study knee): Hylan G‐F 20 44% and saline 33% (Karlsson 2002b (SvP)).
In the Cubukcu et al. RCT, the need for paracetamol tablets was measured by pill counts (means and standard deviations reported). The original publication reported a statistically significant difference between Hylan G‐F 20 and saline at 5 to 13 weeks postinjection in favour of Hylan G‐F 20 (P < 0.05) but no significant difference at 1 to 4 weeks postinjection (Cubukcu 2004). The RevMan software is unable to provide an estimate of this difference.
Considering only the two most homogeneous trials, i.e., the three‐injection trial of Scale (Scale 1994b (3 inj)) and the Wobig trial (Wobig 1998), a statistically significant difference in favour of Hylan G‐F 20 compared to saline was detected in pain on weight bearing (0 to 100 mm VAS) at 1 to 4 weeks postinjection (WMD ‐22.00; 95% CI ‐29.13 to ‐14.87, P < 0.00001), at 5 to 13 weeks postinjection (WMD ‐35.68; 95% CI ‐42.81 to ‐28.55, P < 0.00001), and at 14 to 26 weeks postinjection (WMD ‐21.62; 95% CI ‐30.84 to ‐12.39, P < 0.00001). A statistically significant difference in favour of Hylan G‐F 20 compared to saline was detected in pain at night (0 to 100 mm VAS) at 1 to 4 weeks postinjection (WMD ‐10.64; 95% CI ‐17.29 to ‐3.99, P value 0.002), at 5 to 13 weeks postinjection (WMD ‐15.50; 95% CI ‐21.38 to ‐9.62, P < 0.00001), and at 14 to 26 weeks postinjection (WMD ‐16.20; 95% CI ‐22.85 to ‐9.55, P < 0.00001). A statistically significant difference in favour of Hylan G‐F 20 compared to saline was detected in improvement in the most painful knee movement (0 to 100 mm VAS) both at 1 to 4 weeks postinjection (WMD 23.97; 95% CI 14.34 to 33.60, P < 0.00001) and at 5 to 13 weeks postinjection (WMD 40.56; 95% CI 31.11 to 50.01, P < 0.00001). A statistically significant difference in favour of Hylan G‐F 20 compared to saline was detected for the variable treatment efficacy (improvement on a 0 to 100 mm VAS) both at 1 to 4 weeks postinjection (WMD 26.62; 95% CI 17.39 to 35.84, P < 0.00001) and at 5 to 13 weeks postinjection (WMD 43.85; 95% CI 34.62 to 53.07, P < 0.00001). Safety
No statistically significant differences were detected in the total number of withdrawals overall at 1 to 4 weeks postinjection (Moreland 1993), at 5 to 13 weeks (Cubukcu 2004; Dickson 2001; Wobig 1998; Wobig 1999c (NEhyl), or at 14 to 26 weeks postinjection (Kotevoglu 2005). No statistically significant differences were detected in the number of withdrawals due to adverse events. The number of local reactions was significantly higher in the Hylan G‐F 20 plus arthrocentesis group compared to arthrocentesis (RR 30.23; 95% CI 1.86 to 492.59, P value 0.02) (Dickson 2001).
No significant differences were detected in the number of patients with local reactions (Cubukcu 2004; Dickson 2001; Kotevoglu 2005; Moreland 1993; Wobig 1998; Wobig 1999c (NEhyl)); number of patients with local adverse reaction at 1 to 4 weeks postinjection but study drug continued (Scale 1994b (3 inj)); number of patients with one or more probable or possible related systemic adverse events at 5 to 13 weeks postinjection (Dickson 2001); number of patients reporting systemic adverse reactions at 5 to 13 weeks postinjection (Cubukcu 2004; Wobig 1998; Wobig 1999c (NEhyl)); or number of patients withdrawn due to noncompliance (Kotevoglu 2005).
Hylan G‐F 20 (Synvisc) versus corticosteroid
32. Clinical benefit table: Hylan G‐F 20 versus triamcinolone hexacetonide. Continuo.
| Study | Time | Treatment group | Outcome (scale) | N of Pts | Baseline Mean | End of Study | Absolute Benefit | Relative Benefit |
| Caborn 2004 | 5‐13 wk | E: Hylan G‐F 20 | WOMAC ‐ pain walking on a flat surface (0‐4 Likert) | 113 | 2.12 | 1.20 | ‐0.37 (I) | ‐17.2% (I) |
| C: Triamcinolone hexacetonide | 102 | 2.15 | 1.60 | |||||
| Caborn 2004 | 14‐26 wk | E: Hylan G‐F 20 | WOMAC ‐ pain walking on a flat surface (0‐4 Likert) | 113 | 2.12 | 1.40 | ‐0.37 (I) | ‐17.2% (I) |
| C: Triamcinolone hexacetonide | 102 | 2.15 | 1.80 | |||||
| Caborn 2004 | 5‐13 wk | E: Hylan G‐F 20 | WOMAC physical function (0‐68 Likert) | 113 | 38.60 | 23.50 | ‐5.70 (I) | ‐15.0% (I) |
| C: Triamcinolone hexacetonide | 102 | 37.90 | 28.50 | |||||
| Caborn 2004 | 14‐26 wk | E: Hylan G‐F 20 | WOMAC physical function (0‐68 Likert) | 113 | 38.60 | 25.50 | ‐7.20 (I) | ‐19.0% (I) |
| C: Triamcinolone hexacetonide | 102 | 37.90 | 30.70 | |||||
| Caborn 2004 | 5‐13 wk | E: Hylan G‐F 20 | WOMAC total score (0‐96 Likert) | 113 | 54.00 | 32.70 | ‐8.30 (I) | ‐15.6% (I) |
| C: Triamcinolone hexacetonide | 102 | 53.10 | 40.10 | |||||
| Caborn 2004 | 14‐26 wk | E: Hylan G‐F 20 | WOMAC total score (0‐96) | 113 | 54.00 | 35.60 | ‐8.20 (I) | ‐15.4% (I) |
| C: Triamcinolone hexacetonide | 102 | 53.10 | 42.90 | |||||
| Caborn 2004 | 5‐13 wk | E: Hylan G‐F 20 | Patient global assessment (0‐100 mm VAS) | 113 | 68.40 | 36.70 | ‐14.50 (I) | ‐21.5% (I) |
| C: Triamcinolone hexacetonide | 102 | 67.30 | 50.10 | |||||
| Caborn 2004 | 14‐26 wk | E: Hylan G‐F 20 | Patient global assessment (0‐100 mm VAS) | 113 | 68.40 | 40.30 | ‐16.20 (I) | ‐24.1% (I) |
| C: Triamcinolone hexacetonide | 102 | 67.30 | 55.40 |
Two RCTs included were comparisons of Hylan G‐F 20 and IA corticosteroid.
One RCT was a comparison of Hylan G‐F 20 and betamethasone sodium phosphate ‐ betamethasone acetate (Leopold 2003). One RCT was a comparison of Hylan G‐F 20 and triamcinolone hexacetonide (Caborn 2004). Efficacy The efficacy outcome measure results in the Leopold trial (Leopold 2003) were presented as changes in median scores because the data were not normally distributed. Therefore, only safety data for this RCT are reported.
A statistically significant difference in favour of Hylan G‐F 20 compared to triamcinolone hexacetonide was found for WOMAC pain walking on a flat surface (scored 0 to 4) in the Caborn trial (Caborn 2004) (WMD ‐0.40; 95% CI ‐0.65 to ‐0.15, P value 0.002) at 5 to 13 weeks postinjection and (WMD ‐0.40; 95% CI ‐0.68 to ‐0.12, P value 0.005) at 14 to 26 weeks postinjection. Hylan G‐F 20 was 17% more effective than triamcinolone hexacetonide. A statistically significant difference in favour of Hylan G‐F 20 compared to triamcinolone hexacetonide was found for the WOMAC physical function subscale (scored 0 to 68) (WMD ‐5.00; 95% CI ‐8.86 to ‐1.14, P value 0.01) at 5 to 13 weeks postinjection and (WMD ‐5.20; 95% CI ‐9.10 to ‐1.30, P value 0.009) at 14 to 26 weeks postinjection. Hylan G‐F 20 was, on average, 17% more effective than triamcinolone hexacetonide. A statistically significant difference in favour of Hylan G‐F 20 compared to triamcinolone hexacetonide was found for WOMAC total score (scored 0‐96) (WMD ‐7.40; 95% CI ‐12.74 to ‐2.06, P value 0.007) at 5 to 13 weeks postinjection and (WMD ‐7.30; 95% CI ‐12.76 to ‐1.84, P value 0.009) at 14 to 26 weeks postinjection. Hylan G‐F 20 was 15% more effective than triamcinolone hexacetonide. A statistically significant difference in favour of Hylan G‐F 20 compared to triamcinolone hexacetonide was found for for patient global assessment (scored 0 to 100 mm VAS) (WMD ‐13.40; 95% CI ‐20.03 to ‐6.77, P value 0.00007) at 5 to 13 weeks postinjection and (WMD ‐15.10; 95% CI ‐22.17 to ‐8.03, P value 0.00003) at 14 to 26 week postinjection. Hylan G‐F 20 was approximately 23% more effective than triamcinolone hexacetonide.
In the Caborn trial (Caborn 2004) there was no statistically significant difference in the number of responders defined as at least a one‐point improvement in the WOMAC pain walking on a flat surface at 1 to 4 weeks postinjection. However, there was a statistically significant difference in favour of Hylan G‐F 20 at 5 to 13 weeks postinjection (RR 1.44; 95% CI 1.09 to 1.90, P value 0.01). The NNT for the number of responders was 5. At 14 to 26 weeks postinjection, the RR was 1.44 (95% CI 1.00 to 2.09) P value 0.05. There was no statistically significant difference in analgesic usage between week 0 and prior to week 12 or between week 12 and prior to week 26. Safety With respect to the Leopold trial (Leopold 2003), there were no statistically significant differences in the safety outcomes: total withdrawals overall; withdrawals due to lack of efficacy; or withdrawals due to acute local reactions.
With respect to the Caborn trial (Caborn 2004), there was a statistically significant difference in favour of Hylan G‐F 20 compared to triamcinolone hexacetonide in the number of withdrawals due to lack of efficacy (RR 0.03; 95% CI 0.00 to 0.48, P value 0.01). There were no statistically significant differences in the total number of withdrawals overall or the number of withdrawals due to adverse events.
Hylan G‐F 20 (Synvisc) versus NSAID
33. Clinical benefit table: Hylan G‐F 20 versus NSAID. Continuous outcome measures.
| Study | TIme | Treatment | Outcome (scale) | N of pts | Baseline Mean | End of Study Mean | Absolute Benefit | Relative Difference |
| Adams 1995 | 14‐26 wk | E: Hylan G‐F 20 | Pain on motion (0‐100 mm VAS) | 29 | 61 | 40 | ‐10 (I) | ‐15.9% (I) |
| C: NSAID | 33 | 63 | 52 | |||||
| Adams 1995 | 14‐26 wk | E: Hylan G‐F 20 | Pain at night (0‐100 mm VAS) | 29 | 35 | 25 | ‐4 (I) | ‐11.7% (I) |
| C: NSAID | 33 | 34 | 28 | |||||
| Adams 1995 | 14‐26 wk | E: Hylan G‐F 20 | Pain at rest (0‐100 mm VAS) | 29 | 36 | 25 | ‐4 (I) | ‐13.8% (I) |
| C: NSAID | 33 | 29 | 22 | |||||
| Adams 1995 | 14‐26 wk | E: Hylan G‐F 20 | Pain overall (0‐100 mm VAS) | 29 | 62 | 47 | ‐5 (I) | ‐8.1% (I) |
| C: NSAID | 33 | 62 | 52 | |||||
| Dickson 2001 | 5‐13 wk | E: Hylan G‐F 20 | WOMAC pain (0‐100 mm VAS) | 53 | 59 | 26 | ‐10 (I) | ‐16.4% (I) |
| C: Diclofenac | 55 | 61 | 38 | |||||
| Dickson 2001 | 5‐13 wk | E: Hylan G‐F 20 | WOMAC function (0‐100 mm VAS) | 53 | 54 | 38 | ‐2 (I) | ‐3.6% (I) |
| C: Diclofenac | 55 | 56 | 42 | |||||
| Dickson 2001 | 5‐13 wk | E: Hylan G‐F 20 | Lequesne Index (0‐24) | 53 | 13.9 | 10.9 | ‐1 (I) | ‐7.2% (I) |
| C: Diclofenac | 55 | 13.9 | 11.9 | |||||
| Adams 1995 | 5‐13 wk | E: Hylan G‐F 20 + NSAID | Pain on motion (0‐100 mm VAS) | 34 | 60 | 34 | ‐7 (I) | ‐11.1% (I) |
| C: NSAID | 33 | 63 | 44 | |||||
| Adams 1995 | 5‐13 wk | E: Hylan GF 20 + NSAID | Pain at night (0‐100 mm VAS) | 34 | 20 | 10 | 3 (W) | 8.8% (W) |
| C: NSAID | 33 | 34 | 21 | |||||
| Adams 1995 | 5‐13 wk | E: Hylan G‐F 20 + NSAID | Pain at rest (0‐100 mm VAS) | 34 | 26 | 14 | ‐3 (I) | ‐10.3% (I) |
| C: NSAID | 33 | 29 | 20 | |||||
| Adams 1995 | 5‐13 wk | E: Hylan G‐F 20 + NSAID | Pain overall (0‐100 mm VAS) | 34 | 57 | 31 | ‐7 (I) | ‐11.3% (I) |
| C: NSAID | 33 | 62 | 43 | |||||
| Adams 1995 | 14‐26 wk | E: Hylan G‐F 20 + NSAID | Pain on motion (0‐100 mm VAS) | 32 | 60 | 37 | ‐12 (I) | ‐19% (I) |
| C: NSAID | 31 | 63 | 52 | |||||
| Adams 1995 | 14‐26 wk | E: Hylan G‐F 20 + NSAID | Pain at night (0‐100 mm VAS) | 32 | 20 | 9 | ‐5 (I) | ‐14.7% (I) |
| C: NSAID | 31 | 34 | 28 | |||||
| Adams 1995 | 14‐26 wk | E: Hylan G‐F 20 + NSAID | Pain at rest (0‐100 mm VAS) | 32 | 26 | 11 | ‐8 (I) | ‐27.6% (I) |
| C: NSAID | 31 | 29 | 22 | |||||
| Adams 1995 | 14‐26 wk | E: Hylan G‐F 20 + NSAID | Pain overall (0‐100 mm VAS) | 32 | 57 | 37 | ‐10 (I) | ‐16.1% (I) |
| C: NSAID | 31 | 62 | 52 |
Two trials included were comparisons of Hylan G‐F 20 and NSAID (Adams 1995; Dickson 2001). In the Adams trial (Adams 1995), the early 5 to 13 weeks postinjection follow‐up assessment was reported as change (improvement) scores, while the 14 to 26 week follow‐up was based on difference scores. The Dickson trial (Dickson 2001) results were reported as change (improvement) scores. Efficacy There were no statistically significant differences in any of the efficacy measures scored on a 0 to 100 mm VAS at either 5 to 13 or 14 to 26 weeks postinjection: pain on motion; pain at rest; pain at night; pain overall (0 to 100 mm VAS) (Adams 1995).
The RevMan analysis differed from the Adams publication (Adams 1995) analysis. The publication reported a statistically significant difference (P value 0.05) in favour of Hylan G‐F 20 over NSAID in pain at rest at 5 to 13 weeks whereas the RevMan analysis detected no difference (P value 0.6).
There was a statistically significant difference in favour of Hylan G‐F 20 compared to NSAID in the WOMAC OA Index pain subscale (0 to 100 mm VAS) (WMD ‐12.00; 95% CI ‐23.09 to ‐0.91, P value 0.03) at 5 to 13 weeks postinjection (Dickson 2001). Hylan G‐F 20 was 16% more effective than NSAID. There were no statistically significant differences in physical function measured either on the WOMAC OA Index physical function subscale (0 to 100 mm VAS) or on the Lequesne Index (0 to 24) at 5 to 13 weeks postinjection (Dickson 2001).
There were no statistically significant differences in the patient global assessment, measured as the number of patients assessing the treatment as excellent, very good or good, either at 5 to 13 weeks postinjection (Dickson 2001) or at 14 to 26 weeks postinjection (Adams 1995). Safety There were no statistically significant differences in the following safety outcome measures: total withdrawals overall at 5 to 13 weeks postinjection (Dickson 2001) or at 14 to 26 weeks postinjection (Adams 1995); withdrawals due to adverse events at 14 to 26 weeks postinjection (Adams 1995); or the number of patients with local reactions at 5 to 13 weeks postinjection (Dickson 2001). There was a statistically significant difference in favour of Hylan G‐F 20 compared to NSAID for the number of patients with possible or probable related systemic adverse events at 5 to 13 weeks postinjection (RR 0.46; 95% CI 0.25 to 0.83, P value 0.01) (Dickson 2001). The NNT was 4.
Hylan G‐F 20 (Synvisc) + NSAID versus NSAID alone
The second comparison that was made from the Adams trial (Adams 1995) was Hylan G‐F 20 plus NSAID and arthrocentesis versus NSAID and arthrocentesis alone. Efficacy There were no statistically significant differences between the two groups at 5 to 13 weeks postinjection for the following pain outcomes (0 to 100 mm VAS): pain on motion; pain at rest; pain at night; or pain overall. There were statistically significant differences in favour of Hylan G‐F 20+NSAID+arthrocentesis compared to NSAID+arthrocentesis at 14 to 26 weeks postinjection for pain on motion (WMD ‐15.00; 95% CI ‐26.09 to ‐3.91, P value 0.008); pain at rest (WMD ‐11.00; 95% CI ‐19.31 to ‐2.69, P value 0.01); pain at night (WMD ‐19.00; 95% CI ‐30.09 to ‐7.91, P value 0.0008); and pain overall (WMD ‐15.00; 95% CI ‐26.09 to ‐3.91, P value 0.008). Hylan G‐F 20+NSAID+arthrocentesis was approximately 10% more effective than NSAID+arthrocentesis. There was no statistically significant difference in the number of patients reporting that they were 'excellent, very good, or good' . Safety There was no statistically significant difference in the total withdrawals overall.
Hylan G‐F 20 (Synvisc) versus physical therapy
One RCT included a comparison of Hylan G‐F 20 to physical therapy (Atamaz 2005).
Efficacy
There was a statistically significant between‐group difference in favour of physical therapy compared to Hylan G‐F 20 in spontaneous pain (0 to 100 mm VAS) at 1 to 4 weeks postinjection (WMD 20.50; 95% CI 10.21 to 30.79, P < 0.0001) (physicl therapy was 5% more effective than Hylan G‐F 20), but not at 5 to 13, 14 to 26, 37, or 45 to 52 weeks postinjection. Statistically significant differences in favour of Hylan G‐F 20 were detected in WOMAC pain (Likert) at 1 to 4 weeks postinjection (WMD ‐3.00; 95% CI ‐4.85 to ‐1.15, P value 0.001), at 5 to 13 weeks postinjection (WMD ‐3.10; 95% CI ‐5.12 to ‐1.08, P value 0.003) (Hylan G‐F 20 was 9% more effective than physical therapy), at 37 weeks postinjection (WMD ‐1.90; 95% CI ‐3.71 to ‐0.09, P value 0.04) (Hylan G‐F 20 was 1% more effective than physical therapy), and at 45 to 52 weeks postinjection (WMD ‐5.30; 95% CI ‐7.50 to ‐3.10, P < 0.00001) (Hylan G‐F 20 was 25% more effective than physical therapy), but not at 14 to 26 weeks postinjection. There were no statistically significant differences detected in WOMAC physical function (Likert), SF‐36 pain or SF‐36 physical functioning at any of the time‐points: 1 to 4, 5 to 13, 14 to 26, 36, or 45 to 52 weeks postinjection. Safety
In the Atamaz et al. RCT, while one patient in the Hylan G‐F 20 group reported a local reaction which resolved within a few days, no serious local or systemic adverse events were observed following injections (Atamaz 2005). Hylan G‐F 20 (Synvisc) + physiotherapy versus physiotherapy alone
One RCT included a comparison of Hylan G‐F 20 plus physiotherapy to physiotherapy alone (Bayramoglu 2003). Efficacy There was no statistically significant difference in the Lequesne Index (scored 0 to 24) either at the end of treatment or at 5 to 13 weeks post injection. Safety There was no statistically significant difference in the number of total withdrawals overall at 5 to 13 weeks postinjection.
Hylan G‐F 20 (Synvisc) versus exercise programme
One RCT included was a comparison of Hylan G‐F 20 to an exercise programme (Karatosun 2005).
Efficacy
The primary outcome measure for this trial was the Hospital for Special Surgery Knee Score. There were no statistically significant differences in the Score at any of the assessment times: 1 to 4, 5 to 13, 14 to 26, 45 to 52, or 74 weeks postinjection. By analysing the separate categories that make up the Score, the following statistically significant differences were detected in favour of Hylan G‐F 20 for pain during activity at 1 to 4 weeks postinjection (WMD 1.90; 95% CI 0.19 to 3.61, P value 0.03) (Hylan G‐F 20 was 53% more effective than exercise); at 5 to 13 weeks postinjection (WMD 1.70; 95% CI 0.17 to 3.23, P value 0.03) (Hylan G‐F 20 was 49% more effective than exercise); and at 14 to 26 weeks postinjection (WMD 2.50; 95% CI 0.85 to 4.15, P value 0.003) (Hylan G‐F 20 was 27% more effective than exercise). A statistically significant difference in favour of exercise was detected for pain during transfer activity at 45 to 52 weeks postinjection (WMD ‐0.50; 95% CI ‐0.95 to ‐0.05, P value 0.03) (exercise was 10% more effective than Hylan G‐F 20).
Safety
A statistically significant difference was detected in the total withdrawals overall in favour of the exercise group (RR 43.81; 95% CI 2.72 to 704.87, P value 0.008).
Hylan G‐F 20 (Synvisc) versus IA gaseous oxygen
One RCT was a comparison of Hylan G‐F 20 plus an exercise programme to IA gaseous oxygen plus an exercise programme (Auerbach 2002; Auerbach 2002a). Efficacy A between‐group difference was found for pain under load (0 to 100 mm VAS) at 5 to 13 weeks postinjection in favour of the oxygen group (WMD 12.83; 95% CI 1.96 to 23.70, P value 0.02) but no statistically significant differences were found at the other assessments: end of treatment, 14 to 26 weeks postinjection, or 45 to 52 weeks postinjection. There were no statistically significant differences between the groups for pain at rest (0 to 100 mm VAS); WOMAC OA Index pain (0 to 20); or WOMAC OA Index physical function (0 to 68) at any of the assessments: end of treatment, 5 to 13, 14 to 26, or 45 to 52 weeks postinjection.
The RevMan analysis differed from the Auerbach publication (Auerbach 2002) analysis. In the publication, statistically significant differences were found at 45 to 52 weeks postinjection in favour of Hylan G‐F 20 compared to IA gaseous oxygen for pain under load (P value 0.001), WOMAC pain (P value 0.003), and WOMAC function (P value 0.001) whereas the RevMan analysis did not detect any significant differences (pain under load P value 0.2, WOMAC pain P value 0.3, WOMAC function P value 0.2). Safety There was no statistically significant difference in the total number of withdrawals overall or in the number of patients having total knee replacements.
Hylan G‐F 20 (Synvisc) + appropriate care versus appropriate care alone Table 34; Table 35 Two trials included were comparisons of the combination of Hylan G‐F 20 and appropriate care (AC) to appropriate care alone (Kahan 2003a; Raynauld 2002). Efficacy A statistically significant difference in favour of Hylan G‐F 20 and AC compared to AC alone was found in the WOMAC OA Index pain subscale (0 to 20 Likert) at 45 to 52 weeks postinjection (WMD ‐3.16; 95% CI ‐4.17 to ‐2.15, P < 0.00001) (Raynauld 2002). The combination group was 22% more effective than AC alone group. A statistically significant difference in favour of Hylan G‐F 20 and AC compared to AC alone was found in the WOMAC OA Index physical function subscale (0 to 68 Likert) at 45 to 52 weeks postinjection (WMD ‐9.61; 95% CI ‐13.09 to ‐6.13, P < 0.00001) (Raynauld 2002). The combination group was 22% more effective than AC alone group. The patient global assessment, based on the number of patients improved in the study knee, was statistically better for the Hylan G‐F 20 and AC group (73%) compared to AC alone (27%) (RR 2.68; 95% CI 1.98 to 3.62, P < 0.00001) (Raynauld 2002). The NNT for patient global assessment was 2.
34. Clinical benefit table: Hylan G‐F 20 versus appropriate care. Continuous outcome.
| Study | TIme | Treatment | Outcome (scale) | N of Pts | Baseline Mean | End of Study Mean | Absolute Benefit | Relative Difference |
| Raynauld 2002 | 45‐52 wk | E: Hylan G‐F 20 + appropriate care | WOMAC pain (0‐20 Likert) | 127 | 11.35 | 6.94 | ‐2.57 (I) | ‐21.5% (I) |
| C: Appropriate care | 127 | 11.94 | 10.10 | |||||
| Raynauld 2002 | 45‐52 wk | E: Hylan G‐F 20 + appropriate care | WOMAC function (0‐68 Likert) | 127 | 39.54 | 24.26 | ‐8.95 (I) | ‐22.3% (I) |
| C: Appropriate care | 127 | 40.20 | 33.87 | |||||
| Raynauld 2002 | 45‐52 wk | E: Hylan G‐F 20 + appropriate care | SF‐36 Function | 127 | 28.33 | 33.24 | 5.31 (I) | 18.8% (I) |
| C: Appropriate care | 126 | 28.18 | 27.78 | |||||
| Raynauld 2002 | 45‐52 wk | E: Hylan G‐F 20 + appropriate care | SF‐36 Mental | 127 | 51.74 | 55.29 | 0.81 (I) | 1.6% (I) |
| C: Appropriate care | 126 | 49.91 | 52.65 | |||||
| Kahan 2003a | 36 wk | E: Hylan G‐F 20 + appropriate care | WOMAC pain (0‐100 mm VAS) | 251 | 50.00 | 25.40 | ‐12.4 (I) | ‐24.7% (I) |
| C: Appropriate care | 246 | 50.30 | 38.10 | |||||
| Kahan 2003a | 36 wk | E: Hylan G‐F 20 + appropriate care | Pain on walking (0‐100 mm VAS) | 253 | 61.10 | 23.80 | ‐12.9 (I) | ‐21.4% (I) |
| C: Appropriate care | 253 | 60.30 | 35.90 | |||||
| Kahan 2003a | 36 wk | E: Hylan G‐F 20 + appropriate care | WOMAC function (0‐100 mm VAS) | 251 | 45.50 | 27.10 | ‐11.3 (I) | ‐23.8% (I) |
| C: Appropriate care | 247 | 47.40 | 40.30 | |||||
| Kahan 2003a | 36 wk | E: Hylan G‐F 20 + appropriate care | WOMAC stiffness (0‐100 mm VAS) | 252 | 45.00 | 24.40 | ‐12.9 (I) | ‐28.7% (I) |
| C: Appropriate care | 246 | 44.90 | 37.20 | |||||
| Kahan 2003a | 36 wk | E: Hylan G‐F 20 + appropriate care | WOMAC total (0‐100 mm VAS) | 250 | 46.30 | 26.50 | ‐11.6 (I) | ‐24.2% (I) |
| C: Appropriate care | 245 | 47.90 | 39.70 | |||||
| Kahan 2003a | 36 wk | E: Hylan G‐F 20 + appropriate care | Lequesne Index (0‐24) | 253 | 11.10 | 7.50 | ‐2 (I) | ‐17.7% (I) |
| C: Appropriate care | 253 | 11.30 | 9.70 |
35. Clinical benefit table: Hylan G‐F 20 versus appropriate care. Dichotomous outcom.
| Study | Time | Treatment | Outcome | No. improved | No. of pts. | Risk (%) | Risk difference | NNT |
| Raynauld 2002 | 45‐52 wk | E: Hylan G‐F 20 + appropriate care | Patient global (Number of patients improved in study knee) | 93 | 127 | 73 | 46 | 2 |
| C: Appropriate care | 35 | 128 | 27 | |||||
| Kahan 2003a | 36 wk | E: Hylan G‐F 20 + appropriate care | Patient global (Number of patients rating effectiveness good or satisfactory) | 186 | 253 | 74 | 23 | 4.3 |
| C: Appropriate care | 129 | 253 | 51 | |||||
| Kahan 2003a | 36 wk | E: Hylan G‐F 20 + appropriate care | Number of responders (20% decrease in pain on walking) | 223 | 253 | 88 | 20 | 5 |
| C: Appropriate care | 172 | 253 | 68 |
A statistically significant difference in favour of Hylan G‐F 20 and AC compared to AC alone was found in the WOMAC OA Index pain subscale (0 to 100 mm VAS) (WMD ‐12.70; 95% CI ‐16.41 to ‐8.99, P < 0.00001) (Kahan 2003a). The combination group was 25% more effective than AC alone. A statistically significant difference in favour of Hylan G‐F 20 and AC compared to AC alone was found in the WOMAC OA Index physical function subscale (WMD ‐13.20; 95% CI ‐17.02 to ‐9.38, P < 0.00001) (Kahan 2003a). The combination group was 24% more effective than AC alone. A statistically significant difference was found in favour of Hylan G‐F 20 and AC compared to AC alone in the Lequesne Index (0 to 24) (WMD ‐2.20; 95% CI ‐2.98 to ‐1.42, P < 0.00001) (Kahan 2003a). The combination group was 18% more effective than AC alone. The patient global assessment, based on effectiveness rated as good or satisfactory, was statistically better for the Hylan G‐F 20 and AC group (74%) compared to AC alone (51%) (RR 1.44; 95% CI 1.25 to 1.66, P < 0.00001) (Kahan 2003a). The NNT for patient global assessment was 4. The number of responders, defined as those patients with at least a 20% decrease in pain on walking, was significantly higher in the Hylan G‐F 20 and AC group (88%) compared to AC alone (68%) (RR 1.30; 95% CI 1.18 to 1.43, P < 0.00001) (Kahan 2003a). Safety There was no statistically significant difference in the total withdrawals overall, the number of patients reporting side effects from baseline (Kahan 2003a; Raynauld 2002), or the number of patients withdrawn due to adverse events in the Kahan trial (Kahan 2003a). The number of patients reporting mild, moderate or severe side effects at the end of the study was significantly higher in the AC alone group (68%) compared to the Hylan G‐F 20 and AC group (52%) (RR 0.76; 95% CI 0.61 to 0.94, P value 0.01) (Raynauld 2002). There was a statistically significant difference in the number of patients with gastrointestinal adverse events in favour of the Hylan G‐F 20 and AC group compared to AC alone (RR 0.38; 95% CI 0.25 to 0.60, P value 0.00002) (Kahan 2003a; Raynauld 2002). Significantly fewer patients withdrew due to lack of effectiveness in the Hylan G‐F 20 and AC group (2%) compared to the AC alone group (7%) (RR 0.35; 95% CI 0.14 to 0.88, P value 0.03) (Kahan 2003a).
Hylan G‐F 20 (Synvisc) plus arthroscopy versus arthroscopy alone
One RCT has been a comparison of Hylan G‐F 20 following arthroscopy and arthroscopy alone (Rejaili 2005).
Efficacy
Results have not been reported for the four efficacy outcomes since only means, but not standard deviations, were reported at the 24‐week follow‐up.
Safety
No postinjection synovitis was observed during the trial. With respect to the arthroscopy procedure, there were no intra or postoperative complications in the patients. These are the only data that were reported with respect to safety.
Hylan G‐F 20 (Synvisc) versus other hyaluronan
36. Clinical benefit table: Hylan G‐F20 versus hyaluronan.Continuous outcome measure.
| Study | TIme | Treatment | Outcome (scale) | N of Pts | Baseline Mean | End of Study Mean | Absolute Benefit | Relative Difference |
| Wobig 1999 | 1‐4 wk | E: Hylan G‐F 20 | Weight bearing pain (0‐100 mm VAS) | 38 | 70 | 40 | ‐1 (I) | ‐1.4% (I) |
| C: Artz | 35 | 72 | 43 | |||||
| Wobig 1999 | 1‐4 wk | E: Hylan G‐F 20 | Pain at night (0‐100 mm VAS) | 38 | 26 | 12 | 1 (W) | 3.3% (W) |
| C: Artz | 35 | 30 | 15 | |||||
| Wobig 1999 | 5‐13 wk | E: Hylan G‐F 20 | Weight bearing pain (0‐100 mm VAS) | 38 | 70 | 32 | ‐14 (I) | ‐19.4% (I) |
| C: Artz | 35 | 72 | 48 | |||||
| Wobig 1999 | 5‐13 wk | E: Hylan G‐F 20 | Pain at night (0‐100 mm VAS) | 38 | 26 | 13 | 0 | 0% |
| C: Artz | 35 | 30 | 17 | |||||
| Wobig 1999 | 1‐4 wk | E: Hylan G‐F 20 | Weight bearing pain (0‐100 mm VAS) | 38 | 70 | 40 | ‐7 (I) | ‐9.9% (I) |
| C: Healon | 39 | 71 | 48 | |||||
| Wobig 1999 | 1‐4 wk | E: Hylan G‐F 20 | Pain at night (0‐100 mm VAS) | 38 | 26 | 12 | ‐1 (I) | ‐2.9% (I) |
| C: Healon | 39 | 35 | 22 | |||||
| Wobig 1999 | 5‐13 wk | E: Hylan G‐F 20 | Weight bearing pain (0‐100 mm VAS) | 38 | 70 | 32 | ‐5 (I) | ‐7.0% (I) |
| C: Healon | 39 | 71 | 38 | |||||
| Wobig 1999 | 5‐13 wk | E: Hylan G‐F 20 | Pain at night (0‐100 mm VAS) | 38 | 26 | 13 | 6 (W) | 17.1% (W) |
| C: Healon | 39 | 35 | 16 | |||||
| Atamaz 2005 | 1‐4 wk | E: Hylan G‐F 20 | WOMAC pain (Likert) | 20 | 12.4 | 8.3 | 0 | 0 |
| C: Orthovisc | 20 | 13.4 | 9.3 | |||||
| Atamaz 2005 | 5‐13 wk | E: Hylan G‐F 20 | WOMAC pain (Likert) | 20 | 12.4 | 8.7 | ‐1.5 (I) | ‐11.2% (I) |
| C: Orthovisc | 20 | 13.4 | 11.2 | |||||
| Atamaz 2005 | 14‐26 wk | E: Hylan G‐F 20 | WOMAC pain (Likert) | 20 | 12.4 | 10.4 | ‐0.5 (I) | ‐3.7% (I) |
| C: Orthovisc | 20 | 13.4 | 11.9 | |||||
| Atamaz 2005 | 36 wk | E: Hylan G‐F 20 | WOMAC pain (Likert) | 20 | 12.4 | 10.4 | 1.0 (W) | 7.5% (W) |
| C: Orthovisc | 20 | 13.4 | 10.4 | |||||
| Atamaz 2005 | 45‐52 wk | E: Hylan G‐F 20 | WOMAC pain (Likert) | 20 | 12.4 | 10.2 | 0 | 0 |
| C: Orthovisc | 20 | 13.4 | 11.2 | |||||
| Atamaz 2005 | 1‐4 wk | E: Hylan G‐F 20 | Spontaneous pain (0‐100 mm VAS) | 20 | 85.0 | 64.0 | 6.4 (W) | 9.1% (W) |
| C: Orthovisc | 20 | 70.3 | 42.9 | |||||
| Atamaz 2005 | 5‐13 wk | E: Hylan G‐F 20 | Spontaneous pain (0‐100 mm VAS) | 20 | 85.0 | 50.7 | ‐22.4 (I) | ‐31.9% (I) |
| C: Orthovisc | 20 | 70.3 | 58.4 | |||||
| Atamaz 2005 | 14‐26 wk | E: Hylan G‐F 20 | Spontaneous pain (0‐100 mm VAS) | 20 | 85.0 | 51.7 | ‐29.2 (I) | ‐41.5% (I) |
| C: Orthovisc | 20 | 70.3 | 66.2 | |||||
| Atamaz 2005 | 36 wk | E: Hylan G‐F 20 | Spontaneous pain (0‐100 mm VAS) | 20 | 85.0 | 51.7 | ‐15.2 (I) | ‐21.6% (I) |
| C: Orthovisc | 20 | 70.3 | 52.2 | |||||
| Atamaz 2005 | 45‐52 wk | E: Hylan G‐F 20 | Spontaneous pain (0‐100 mm VAS) | 20 | 85.0 | 49.0 | ‐22.4 (I) | ‐31.9% (I) |
| C: Orthovisc | 20 | 70.3 | 56.7 | |||||
| Atamaz 2005 | 1‐4 wk | E: Hylan G‐F 20 | SF‐36 pain | 20 | 25.6 | 59.4 | 22.7 (I) | 62.4% (I) |
| C: Orthovisc | 20 | 36.4 | 47.5 | |||||
| Atamaz 2005 | 5‐13 wk | E: Hylan G‐F 20 | SF‐36 pain | 20 | 25.6 | 58.8 | 41.6 (I) | 114.3% (I) |
| C: Orthovisc | 20 | 36.4 | 28.0 | |||||
| Atamaz 2005 | 14‐26 wk | E: Hylan G‐F 20 | SF‐36 pain | 20 | 25.6 | 55.7 | 30.6 (I) | 84.1% (I) |
| C: Orthovisc | 20 | 36.4 | 35.9 | |||||
| Atamaz 2005 | 36 wk | E: Hylan G‐F 20 | SF‐36 pain | 20 | 25.6 | 43.8 | 9.3 (I) | 25.5% (I) |
| C: Orthovisc | 20 | 36.4 | 45.3 | |||||
| Atamaz 2005 | 45‐52 wk | E: Hylan G‐F 20 | SF‐36 pain | 20 | 25.6 | 46.7 | 19.8 (I) | 54.4% (I) |
| C: Orthovisc | 20 | 36.4 | 37.7 | |||||
| Atamaz 2005 | 1‐4 wk | E: Hylan G‐F 20 | WOMAC function (Likert) | 20 | 58.3 | 40.1 | ‐11.9 (I) | ‐28.7% (I) |
| C: Orthovisc | 20 | 41.5 | 35.2 | |||||
| Atamaz 2005 | 5‐13 wk | E: Hylan G‐F 20 | WOMAC function (Likert) | 20 | 58.3 | 41.7 | ‐11.3 (I) | ‐27.2% (I) |
| C: Orthovisc | 20 | 41.5 | 36.2 | |||||
| Atamaz 2005 | 14‐26 wk | E: Hylan G‐F 20 | WOMAC function (Likert) | 20 | 58.3 | 41.9 | ‐16.7 (I) | ‐40.2% (I) |
| C: Orthovisc | 20 | 41.5 | 41.8 | |||||
| Atamaz 2005 | 36 wk | E: Hylan G‐F 20 | WOMAC function (Likert) | 20 | 58.3 | 38.6 | ‐17.8 (I) | ‐42.9% (I) |
| C: Orthovisc | 20 | 41.5 | 39.6 | |||||
| Atamaz 2005 | 45‐52 wk | E: Hylan G‐F 20 | WOMAC function (Likert) | 20 | 58.3 | 38.9 | ‐15.5 (I) | ‐37.3% (I) |
| C: Orthovisc | 20 | 41.5 | 37.6 | |||||
| Atamaz 2005 | 1‐4 wk | E: Hylan G‐F 20 | SF‐36 physical functioning | 20 | 35.5 | 57.2 | 12.0 (I) | 27.0 (I) |
| C: Orthovisc | 20 | 44.5 | 54.2 | |||||
| Atamaz 2005 | 5‐13 wk | E: Hylan G‐F 20 | SF‐36 physical functioning | 20 | 35.5 | 61.7 | 29.2 (I) | 65.6% (I) |
| C: Orthovisc | 20 | 44.5 | 41.5 | |||||
| Atamaz 2005 | 14‐26 wk | E: Hylan G‐F 20 | SF‐36 physical functioning | 20 | 35.5 | 55.7 | 20.2 (I) | 56.9% (I) |
| C: Orthovisc | 20 | 44.5 | 44.5 | |||||
| Atamaz 2005 | 36 wk | E: Hylan G‐F 20 | SF‐36 physical functioning | 20 | 35.5 | 45.0 | 4.8 (I) | 10.8 (I) |
| C: Orthovisc | 20 | 44.5 | 49.2 | |||||
| Atamaz 2005 | 45‐52 wk | E: Hylan G‐F 20 | SF‐36 physical functioning | 20 | 35.5 | 54.0 | 32.0 (I) | 71.9% (I) |
| C: Orthovisc | 20 | 44.5 | 31.0 |
Nine RCTs have been comparisons of Hylan G‐F 20 and hyaluronan: 1) Artzal (Karlsson 2002) ‐ readers are directed to the Artz product results, 2) Artz (Wobig 1999b (Artz)) and Healon (Wobig 1999a (Healon)), 3) Hyalgan (Brown 2003) ‐ readers are directed to the Hyalgan product results, 4) Orthovisc (Atamaz 2005; Bayramoglu 2003; Karatay 2004; Karatosun 2005a; Kotevoglu 2005) ‐ readers are directed to the Orthovisc product results, and 5) Arthrease (Kirchner 2005; Thompson 2002) ‐ readers are directed to the BioHy (Arthrease, Euflexxa, Nuflexxa) product results.
The Wobig 199 trial had two active arms: Artz (Wobig 1999b (Artz) and Healon (Wobig 1999a (Healon)). Since Healon is not indicated for the treatment of knee OA we have completed the analysis both including and excluding this arm. Efficacy There was no statistically significant difference in pain on weight bearing (0 to 100 mm VAS) at 1 to 4 weeks postinjection (Karlsson 2002c (AvS), Wobig 1999a (Healon), Wobig 1999b (Artz)), or at 14 to 26 weeks postinjection (Karlsson 2002c (AvS)). There was a statistically significant difference in favour of Hylan G‐F 20 compared to other hyaluronans at 5 to 13 weeks postinjection (WMD ‐6.59; 95% CI ‐12.46 to ‐0.73, P value 0.03) (Karlsson 2002c (AvS); Wobig 1999a (Healon); Wobig 1999b (Artz)). There was a statistically significant difference in favour of Hylan G‐F 20 in pain at night (0 to 100 mm VAS) at 1 to 4 weeks postinjection (WMD ‐7.07; 95% CI ‐13.41 to ‐0.73, P value 0.03), but no difference at 5 to 13 weeks postinjection (Wobig 1999a (Healon); Wobig 1999b (Artz)). There was no significant difference in improvement in knee movement (0 to 100 mm VAS) at 1 to 4 weeks postinjection, but there was a statistically significant difference in favour of Hylan G‐F 20 at 5 to 13 weeks postinjection (WMD 12.50; 95% CI 2.70 to 22.30, P value 0.01). There was no significant difference in the patient global evaluation of treatment efficacy (0 to 100 mm VAS) at 1 to 4 or at 5‐13 weeks postinjection.
When excluding the Healon arm, there was no statistically significant difference in pain on weight bearing at 1 to 4 or at 5 to 13 weeks postinjection (Karlsson 2002c (AvS), Wobig 1999b (Artz)). There was no statistically significant difference in pain at night at 1 to 4 or at 5 to 13 weeks postinjection (Wobig 1999b (Artz)). There was no significant difference in improvement in knee movement (0 to 100 mm VAS) at 1 to 4 weeks postinjection. There was a significant difference in improvement in knee movement in favour of Hylan G‐F 20 at 5 to 13 weeks postinjection (WMD 17.00; 95% CI 3.14 to 30.66, P value 0.02). There was no significant difference in patient global evaluation of treatment efficacy at 1 to 4 weeks postinjection. There was a statistically significant difference in patient global evaluation of treatment efficacy in favour of Hylan G‐F 20 at 5 to 13 weeks postinjection (WMD 16.00; 95% CI 2.14 to 29.86, P value 0.02). Safety The safety profile of the three groups (Artz, Healon and Hylan G‐F 20) was very similar (Wobig 1999). No patients reported systemic reactions. Two Hylan G‐F 20 patients and one Artz patient reported local reactions. One Hylan G‐F 20 patient and two Healon patients withdrew from the trial.
Product ‐ Hyruan
Description of studies:
Three studies were excluded (Lee 1999; Oberoi 2004; Rastogi 2005). One study is awaiting assessment (Lee 2002). Product ‐ NRD‐101 (Suvenyl) Description of studies: Two RCTs have been included (Pham 2003 (abstract); Pham 2004 (final publication); Tsukamoto 1995(abstract); Yamamoto 1994 (final publication)).
Pham et al. reported a one‐year, parallel‐group, double‐blind, placebo‐controlled, multicentre (46 rheumatology departments) RCT performed in France comparing three weekly injections of NRD‐101 plus oral placebo to: 1) three weekly injections of saline solution plus Diacerein 50 mg twice daily, and 2) three weekly IA injections of saline solution plus oral placebo (Pham 2004, Pham 2003). The objective was to evaluate long‐term structural and symptomatic efficacy of three courses (every three months) of three weekly IA injections of NRD‐101over a one‐year period. No statistically significant between‐group differences were found for pain. There was a statistically significant deterioration in joint space width but no difference between the three groups. The trial did not find any structural and/or symptomatic effect for NRD‐101 and Diacerein. With respect to safety, patients in the NRD‐101 group had significantly more knee pain during or after intraarticular injection, while patients in the Diacerein group had more diarrhoea and urine colouration. With respect to methodological quality, the trial scored 5 out of 5 on the Jadad scale achieving points for both randomisation and blinding details. Allocation concealment was adequate.
The statistical analyses were performed using the change between baseline and the final visit since raw means and standard deviations for unadjusted post‐test scores were not available.
Yamamoto et al. reported a five‐week, parallel‐group, double‐blind RCT performed at 31 centres in Japan comparing five weekly injections of NRD‐101 (produced by fermentation using Streptococcus equi, a type of lactobacilli, Denki Kagaku Kogyo) to five weekly injections of Artz in 203 patients with OA of the knee (Tsukamoto 1995; Yamamoto 1994). Statistically significant differences in favour of NRD‐101 were reported for 'final global improvement' and 'usefulness' but not for evaluation of improvement in clinical symptoms. Adverse events were reported for 2 of 100 NRD‐101 patients and 3 of 99 Artz patients.
This comparative HA trial was of short duration with the longest assessment only one week postinjection. The 31 trial sites were all Departments of Orthopedic Surgery. Almost all of the clinical evaluations were based on physician ratings rather than on patient ratings.
With respect to methodological quality, the average Jadad score was 5 out of 5; both the Pham trial and the Yamamoto trial scoring 5. Allocation concealment was adequate for both trials. One trial was excluded (Kurokawa 1994).
NRD‐101 (Suvenyl) versus placebo Efficacy
37. Clinical benefit table: NRD‐101 (Suvenyl) versus placebo. Continuous outcome mea.
| Study | Time | Treatment | Outcome | N of Pts | Baseline Mean | End of Study Mean | Absolute Benefit | Relative Difference |
| Pham 2004 | 1‐4 wk | E: NRD‐101 | Pain (0‐100 mm VAS) | 131 | 61.7 | |||
| C: Placebo | 85 | 59.1 | ||||||
| Pham 2004 | 14‐26 wk | E: NRD‐101 | Pain (0‐100 mm VAS) | 131 | 61.7 | |||
| C: Placebo | 85 | 59.1 | ||||||
| Pham 2004 | 45‐52 wk | E: NRD‐101 | Pain (0‐100 mm VAS) | 131 | 61.7 | 28.2 | 1.0 (W) | 1.7% (W) |
| C: Placebo | 85 | 59.1 | 24.6 | |||||
| Pham 2004 | 1‐4 wk | E: NRD‐101 | Lequesne Index (0‐24) | 131 | 11.1 | |||
| C: Placebo | 85 | 10.5 | ||||||
| Pham 2004 | 14‐26 wk | E: NRD‐101 | Lequesne Index (0‐24) | 131 | 11.1 | |||
| C: Placebo | 85 | 10.5 | ||||||
| Pham 2004 | 45‐52 wk | E: NRD‐101 | Lequesne Index (0‐24) | 131 | 11.1 | |||
| C: Placebo | 85 | 10.5 | ||||||
| Pham 2004 | 1‐4 wk | E: NRD‐101 | Patient global assessment (0‐100 mm VAS) | 131 | 59.7 | |||
| C: Placebo | 85 | 57.3 | ||||||
| Pham 2004 | 14‐26 wk | E: NRD‐101 | Patient global assessment | 131 | 59.7 | |||
| C: Placebo | 85 | 57.3 | ||||||
| Pham 2004 | 45‐52 wk | E: NRD‐101 | Patient global assessment (0‐100 mm VAS) | 131 | 59.7 | 30.0 | 1.4 (W) | 2.4% (W) |
| C: Placebo | 85 | 57.3 | 26.2 | |||||
| Pham 2004 | 1‐4 wk | E: NRD‐101 | Percentage of painful days during the previous month (0‐100 mm VAS) | 131 | 85.5 | |||
| C: Placebo | 85 | 82.6 | ||||||
| Pham 2004 | 14‐26 wk | E: NRD‐101 | Percentage of painful days during the previous month (0‐100 mm VAS) | 131 | 85.5 | |||
| C: Placebo | 85 | 82.6 | ||||||
| Pham 2004 | 45‐52 wk | E: NRD‐101 | Percentage of painful days during the previous month (0‐100 mm VAS) | 131 | 85.5 | 42.0 | 3.1 (W) | 3.8% (W) |
| C: Placebo | 85 | 82.6 | 36.0 |
38. Clinical benefit table: NRD‐101 (Suvenyl) versus placebo. Dichotomous outcome me.
| Study | Time | Treatment | Outcome | No. improved | No. of pts | Risk (%) | Risk difference | NNT |
| Pham 2004 | 45‐52 wk | E: NRD‐101 | Patient assessment of treatment efficacy (no. pts rating very good or good versus moderate, bad or very ad) | 86 | 120 | 72 | 4 | 25 |
| C: Placebo (saline + oral placebo) | 57 | 75 | 76 | |||||
| Pham 2004 | 45‐52 wk | E: NRD‐101 | Joint space width (percentage of progressors: joint space narrowing greater than 0.5 mm) | 23 | 131 | 18 | 2 | 50 |
| C: Placebo (saline plus oral placebo) | 17 | 85 | 20 |
Readers should note that the results of the efficacy data on the symptomatic outcome measures were reported as change between baseline and the final visit for the Pham trial (Pham 2004). There were no statistically significant differences between NRD‐101 and placebo for pain (0‐100 mm VAS), the Lequesne Index (0‐100 modified scale), patient global assessment (0‐100 mm VAS), or the percentage of painful days (0‐100 mm VAS.
Data were reported on the percentage of progressors (joint space narrowing greater than 0.5 mm). There was no statistically significant difference between NRD 101 + oral placebo 23 of 131 (17.6%) and saline injection + oral placebo 17 out of 85 (20.3%). Safety
No statistically significant differences were detected for the following safety variables between NRD‐101 and placebo: total wihdrawals overall, withdrawals due to inefficacy, number of withdrawals due to adverse events, number of patients reporting knee pain during or after IA injection, or number of patients reporting diarrhoea (Pham 2004).
NRD‐101 (Suvenyl) versus corticosteroid: no trials included.
NRD‐101 (Suvenyl) versus NSAID (Diacerein) Efficacy
Table 39; Table 40 Readers should note that the results of the efficacy data on the symptomatic outcome measures were reported as change between baseline and the final visit for the Pham trial (Pham 2004). There were no statistically significant differences between NRD‐101 and Diacerein for any of the efficacy outcome measures: pain (0‐100 mm VAS), Lequesne Index (0‐100 modified scale), patient global assessment (0‐100 mm VAS) or the percentage of painful days (0‐100 mm VAS).
39. Clinical benefit table: NRD‐101 (Suvenyl) versus Diacerein. Continuous outcome m.
| Study | Time | Treatment | Outcome | N of Pts | Baseline Mean | End of Study Mean | Absolute Benefit | Relative Difference |
| Pham 2004 | 1‐4 wk | E: NRD‐101 | Pain (0‐100 mm VAS) | 131 | 61.7 | |||
| C: Diacerein | 85 | 59.6 | ||||||
| Pham 2004 | 14‐26 wk | E: NRD‐101 | Pain (0‐100 mm VAS) | 131 | 61.7 | |||
| C: Diacerein | 85 | 59.6 | ||||||
| Pham 2004 | 45‐52 wk | E: NRD‐101 | Pain (0‐100 mm VAS) | 131 | 61.7 | 28.2 | 0.4 (W) | 0.7% (W) |
| C: Diacerein | 85 | 59.6 | 25.7 | |||||
| Pham 2004 | 1‐4 wk | E: NRD‐101 | Lequesne Index (0‐24) | 131 | 11.1 | |||
| C: Diacerein | 85 | 10.5 | ||||||
| Pham 2004 | 14‐26 wk | E: NRD‐101 | Lequesne Index (0‐24) | 131 | 11.1 | |||
| C: Diacerein | 85 | 10.5 | ||||||
| Pham 2004 | 45‐52 wk | E: NRD‐101 | Lequesne Index (0‐24) | 131 | 11.1 | |||
| C: Diacerein | 85 | 10.5 | ||||||
| Pham 2004 | 1‐4 wk | E: NRD‐101 | Patient global assessment (0‐100 mm VAS) | 131 | 59.7 | |||
| C: Diacerein | 85 | 57.3 | ||||||
| Pham 2004 | 14‐26 wk | E: NRD‐101 | Patient global assessment (0‐100 mm VAS) | 131 | 59.7 | |||
| C: Diacerein | 85 | 57.3 | ||||||
| Pham 2004 | 45‐52 wk | E: NRD‐101 | Patient global assessment | 131 | 59.7 | 30.0 | 3.1 (W) | 5.4% (W) |
| C: Diacerein | 85 | 57.3 | 24.5 | |||||
| Pham 2004 | 1‐4 wk | E: NRD‐101 | Percentage of painful days during the previous month (0‐100 mm VAS) | 131 | 85.5 | |||
| C: Diacerein | 85 | 83.0 | ||||||
| Pham 2004 | 14‐26 wk | E: NRD‐101 | Percentage of painful days durign the previous month (0‐100 mm VAS) | 131 | 85.5 | |||
| C: Diacerein | 85 | 83.0 | ||||||
| Pham 2004 | 45‐52 wk | E: NRD‐101 | Percentage of painful days during the previous month (0‐100 mm VAS) | 131 | 85.5 | 42.0 | 2.1 (W) | 2.5% (W) |
| C: Diacerein | 85 | 83.0 | 37.4 |
40. Clinical benefit table: NRD‐101 (Suvenyl) versus Diacerein. Dichotomous outcome.
| Study | Time | Treatment | Outcome | No. improved | No. of pts | Risk (%) | Risk difference | NNT |
| Pham 2004 | 45‐52 wk | E: NRD‐101 | Patient assessment of treatment efficacy (no. pts rating very good or good versus moderate, bad or very bad) | 86 | 120 | 72 | 7 | 14 |
| C: Diacerein | 49 | 75 | 65 | |||||
| Pham 2004 | 45‐52 wk | E: NRD‐101 | Joint space width (percentage progressors: joint space narrowing greater than 0.5 mm) | 23 | 131 | 18 | 1 | 100 |
| C: Diacerein | 16 | 85 | 19 |
Data were reported on the percentage of progressors (joint space narrowing greater than 0.5 mm) (Pham 2003). There was no statistically significant difference between NRD 101 + oral placebo 23 of 131 (17.6%) and Diacerein + saline injection 16 of 85 (18.9%). Safety
A statistically significant difference in favour of NRD‐101 compared to Diacerein was detected in the number of patients that reported diarrhoea (RR 0.22; 95% CI 0.12 to 0.40, P < 0.00001) (41% versus 9%). A statistically significant difference in favour of Diacerein compared to NRD‐101 was detected in the number of patients that reported knee pain during or after IA injection (RR 2.51; 95% CI 1.21 to 5.21, P value 0.01) (24% versus 9%). There were no statistically significant differences between NRD‐101 and Diacerein for the total withdrawals overall, withdrawals due to inefficacy, or the number of withdrawals due to adverse events (Pham 2004).
NRD‐101 (Suvenyl) versus other hyaluronans Efficacy Table 41; Table 42 For the NRD‐101 comparison against Artz (Tsukamoto 1995; Yamamoto 1994) there were no statistically significant differences between the two products in any measure of efficacy at 1 to 4 weeks postinjection: spontaneous pain, pain on pressure, pain during the night, passive movement pain, passive flexion, passive extension, and patient global assessment. Safety
41. Clinical benefit table: NRD‐101 (Suvenyl) versus Artz. Dichotomous outcome measu.
| Study | TIme | Treatment | Outcome | No. improved | No. of pts. | Risk (%) | Risk difference | NNT |
| Yamamoto 1994 | 1‐4 wk | E: NRD‐101 | Spontaneous pain (number of patients improved) | 48 | 67 | 72 | 11 | 9.1 |
| C: Artz | 43 | 70 | 61 | |||||
| Yamamoto 1994 | 1‐4 wk | E: NRD‐101 | Pain during night (number of patients improved) | 39 | 54 | 72 | ‐2 | 50 |
| C: Artz | 39 | 53 | 74 | |||||
| Yamamoto 1994 | 1‐4 wk | E: NRD‐101 | Pressure pain (number of patients improved) | 60 | 94 | 64 | 7 | 14.3 |
| C: Artz | 48 | 84 | 57 | |||||
| Yamamoto 1994 | 1‐4 wk | E: NRD‐101 | Passive movement pain (number of patients improved) | 31 | 53 | 58 | ‐8 | 12.5 |
| C: Artz | 57 | 86 | 66 | |||||
| Yamamoto 1994 | 1‐4 wk | E: NRD‐101 | Number of patients good/very good | 50 | 81 | 62 | 2 | 50 |
| C: Artz | 43 | 72 | 60 |
42. Clinical benefit table: NRD‐101 (Suvenyl) versus Artz. Continuous outcome measur.
| Study | Time | Treatment | Outcome | N of Pts | Baseline Mean | End of Study Mean | Absolute Benefit | Relative Benefit |
| Yamamoto 1994 | 1‐4 wk | E: NRD‐101 | Passive flexion (degrees) | 95 | 132.30 | 137.10 | 1.4 (I) | 1.1% (I) |
| C: Artz | 86 | 132.70 | 136.10 | |||||
| Yamamoto 1994 | 1‐4 wk | E: NRD‐101 | Passive extension (degrees) | 95 | 4.8 | 4.0 | 0.2 (I) | 3.8% (I) |
| C: Artz | 86 | 5.2 | 4.2 |
There was a trend of more withdrawals overall in the Artz group (15%) compared to the NRD‐101 group (6%) (RR 0.40; 95% CI 0.16 to 1.00, P value 0.05) (Yamamoto 1994). There were a similar number of adverse events reported in the two groups: 2 of 100 in NRD‐101 and 3 of 99 in the Artz group. Product ‐Orthovisc Description of studies Fourteen randomised controlled trials of Orthovisc (Anika Therapeutics, Inc., Woburn, MA) have been included. Eleven have been reported as journal articles (Bayramoglu 2003; Brandt 2001; Karatay 2005a; Karatosun 2005a; Kotevoglu 2005; Neustadt 2005a ‐3inj; Ozturk 2005; Sezgin 2005; Tascioglu 2003; Tekeoglu 1998; Yentur 2003), one was the basis of a specialization thesis (Kalay 1997), one was presented as a poster at the 10th National Rheumatology Congress in Turkey (Guler 1996), and one remains unpublished (Hizmetli 1999). Orthovisc has been compared against placebo (Brandt 2001; Guler 1996; Hizmetli 1999; Kotevoglu 2005; Sezgin 2005), arthrocentesis (Neustadt 2005a ‐3inj), betamethasone (Tekeoglu 1998), 6‐methylprednisolone acetate (Tascioglu 2003), in combination with triamcinolone acetonide (Ozturk 2005), IA hylan (Bayramoglu 2003; Karatay 2004; Karatosun 2005a; Kotevoglu 2005), physical therapy (Bayramoglu 2003; Kalay 1997), and in combination with lidocaine (Yentur 2003). With the exception of the Brandt RCT (Brandt 2001), which was conducted in the United States, and the Neustadt RCT (Neustadt 2005a ‐3inj), which was conducted in Canada and the United States, the other twelve RCT were conducted in Turkey. With respect to methodological quality, the average Jadad score was 2.9 out of 5, with one trial scoring 5 (Neustadt 2005a ‐3inj), two trials scoring 4 (Brandt 2001; Hizmetli 1999), three trials scoring 3 (Guler 1996; Kotevoglu 2005; Ozturk 2005), six trials scoring 2 (Bayramoglu 2003; Kalay 1997; Sezgin 2005; Tascioglu 2003; Tekeoglu 1998; Yentur 2003), and one trial scoring 1 (Karatay 2005a). Allocation concealment was adequately described in four trials (Brandt 2001; Karatosun 2005a; Neustadt 2005a ‐3inj; Ozturk 2005) and unclear (not reported) in the remaining ten trials. Seven trials were excluded (Ates 2001; Birbara 2004; Koyuncu 2002; Olszynski 2002; Oron 2003; Sepici 2002; Toh 2002; Toh 2003). Three trials are awaiting assessment (Gur 2002; Kilinc 2002; Renk[inodot]tepe 20). These trials have only been published as abstracts with no extractable data, and at the closure of the database for this review no full length manuscripts have been published.
Bayramoglu et al. reported a three‐month, parallel‐group RCT performed at a single centre in Turkey comparing three weekly injections of Orthovisc plus a physical therapy programme to three weekly injections of Hylan G‐F 20 plus a physical therapy programme to a physical therapy programme alone (deep tissue heating with short wave diathermy, transcutaneous electrical neuromuscular stimulation and exercises) in 46 patients with OA of the knee (Bayramoglu 2003). The authors were particularly interested in examining the effect of IA HA injection on muscular strength; testing the hypothesis that if patients were relieved of pain and disability then indirectly they would build stronger quadriceps muscles. They reported within‐group improvement in the Lequesne score for all three groups but no between‐group difference. No within‐ or between‐group difference was detected in muscular strength. No between‐group differences were reported for range of motion, knee instability, existing deformities and radiographic grade. No adverse events were associated with the IA hyaluronic acid injections.
The Bayramoglu et al. RCT had a small sample size. However, it was classified as a pilot study. The presence or absence of effusion, usage of rescue and concomitant medications, and OA diagnosis criteria were not reported. There was a difference in the number of patients with bilateral disease: 100% physical therapy (PT) group, 75% Orthovisc group and 67% Hylan G‐F 20 group. No difference was found with respect to the MW of the HA products. Since PT is part of the first line nonpharmacologic therapy in the medical management of patients with OA of the knee, the designation of PT alone as a treatment group in comparison to the two combination groups (pharmacologic + nonpharmacologic groups) was a particular interest in this trial.
Brandt et al. reported a 27‐week, placebo‐controlled, double‐blind RCT performed at 10 centres in the United States comparing three weekly injections of Orthovisc to three weekly injections of saline in 226 patients with OA of the knee (Brandt 2001). The authors examined the influence of contralateral knee pain in a post hoc analysis of patients who completed at least 15 weeks of the trial, had no major protocol violations, and a WOMAC OA Index pain score less than 12 in the contralateral knee. This 'effectiveness' population controlled for the severity in the contralateral knee. The authors concluded that, in patients with mild to moderate OA of the knee, Orthovisc produced statistically and clinically significant improvement. No side effects were attributed to treatment. The incidence of injection site reaction was similar in both groups: 2.1% Orthovisc and 1.5% saline.
The Brandt et al. RCT did not report the presence or absence of effusion or disease duration (Brandt 2001). In this trial, acetaminophen was permitted at the recommended treatment dosage of 1 g four times daily, but was restricted 24 h before assessment visits. Patients in this trial had a high percentage of bilateral knee disease, but only the index knee received treatment. WOMAC OA Index questionnaires were completed by patients for each knee separately. The severity of pain in the contralateral knee confounded the outcome measurements in the index knee. The authors discussed how the pain response may be affected by severity of contralateral knee pain. They also noted the large placebo response detected in this trial. Although 78% of the patients randomised completed the trial, results were based only on the effectiveness population (i.e. 60%). It is of note that no significant difference was detected in the intent‐to‐treat population between Orthovisc and placebo. The authors defined a clinically meaningful improvement as a decrease of at least three units in the WOMAC pain subscale score. They utilised a 1 to 5 scoring system for the Likert version of the WOMAC OA Index resulting in a score range of 5 to 25 for the pain subscale of the Index.
Guler et al. reported a 10‐week, placebo‐controlled, double‐blind RCT performed at one centre in Turkey comparing three weekly injections of Orthovisc to three weekly injections of saline in 30 patients with OA of the knee (Guler 1996). Statistically significant improvement was reported in the Orthovisc group for the WOMAC pain and physical function subscales, walking time, and acetaminophen usage compared to the saline group. No adverse events were reported.
The small trial by Guler et al. demonstrated between‐group differences (Guler 1996). Of particular note, there was a statistically significant decrease in the use of acetaminophen in the Orthovisc group. Although the abstract reported WOMAC OA Index subscale ranges with the minimum set at zero, it appeared that the score was based on 1 to 5.
Hizmetli et al. completed a one‐year, placebo‐controlled, double‐blind RCT in Turkey comparing three weekly injections of Orthovisc to saline in 50 patients with OA of the knee (Hizmetli 1999). A fourth injection was given at six months. Statistically significant differences in all subscales of the WOMAC OA Index in favour of Orthovisc were reported. No local or systemic side effects were observed. This unpublished report was kindly provided by Anika Therapeutics Inc.
The Hizmetli et al. trial was one of a few unpublished trials included in this review (Hizmetli 1999). The manuscript did not report presence or absence of effusion, disease duration, or presence of uni/bilateral disease. The trial addressed repeat treatment at six months. Analgesics were restricted for the first four weeks of the trial.
Kalay reported a 56‐day, parallel‐group, open‐label RCT performed at a single centre in Turkey comparing two weekly injections of Orthovisc plus a physical therapy programme to a physical therapy programme (paraffin, short wave, quadriceps exercises) in 40 patients with OA of the knee (Kalay 1997). Statistically significant improvement was reported in the Orthovisc group compared to the physical therapy alone group for the following clinical outcome measures: pain, paracetamol usage, walk time, and patient and investigator evaluation of treatment. Two patients in the Orthovisc group had local pain and swelling which resolved within 24 hours.
The Kalay trial utilised a two‐injection schedule rather than a three‐injection schedule (Kalay 1997). The publication did not report the presence or absence of effusion or disease duration. However, supplemental use of paracetamol as rescue medication was graded and recorded. Statistically significant decreases in consumption were seen in both groups at the end of the study compared to baseline. As well, a statistically significant between‐group difference in favour of Orthovisc was found at the eighth week.
Karatay et al. reported a three‐week, parallel group RCT performed at a single centre in Turkey comparing three weekly injections of Orthovisc to three weekly injections of hylan G‐F 20 in 40 patients with OA of the knee (Karatay 2004; Karatay 2005; Karatay 2005a). The objective of this trial was to evaluate the effects of HA on synovial fluid levels of intercellular adhesion molecule‐1 (ICAM‐1) and vascular cell adhesion molecule‐1 (V‐CAM‐1). ICAM‐1 and VCAM‐1 levels were significantly reduced in both groups. Both groups showed within‐group improvement in WOMAC pain and physical function scores with significant within‐group improvement being detected for WOMAC stiffness. However, no signiifcant between‐group differences were found for any of the outcome measures. Safety was not reported.
Karatosun et al. reported a one‐year, double‐blind, parallel‐group RCT performed at a single centre in Turkey comparing three weekly injections of Orthovisc to three weekly injections of Hylan G‐F 20 in 92 patients with OA of the knee (Karatosun 2005a). The authors reported no statistically significant differences between the groups as both groups improved in the Hospital for Special Surgery scores. Both HA products were well tolerated with no complications due to HA injection being reported. Approximately 30% of patients in each group (Orthovisc 30.4% and Hylan G‐F 20 34.8%) withdrew early from the trial.
Patients with advanced (i.e. Kellgren‐Lawrence Grade III) bilateral knee OA were enrolled in this trial. A blinded physical therapist assessed the efficacy and safety of the therapy. This is one of the longest trials comparing two HA products using the Hospital for Special Surgery Knee Score as the primary outcome measure. Dr. Karatosun kindly provided means and standard deviations for the reported outcome measures.
Kotevolgu et al. reported a six‐month, parallel‐group, placebo‐controlled, double‐blind RCT performed at a single centre in Turkey comparing three weekly injections of Orthovisc to three weekly injections of Synvisc Hylan G‐F 20 or saline solution in 78 patients with OA of the knee without effusion (Kotevoglu 2005). The authors reported that all patients showed clinical improvement but that neither hyaluronan product was more effective than the other. With respect to safety, local adverse events were reported by two patients and these (transient pain at injection site or warm knee lasting for one night) resolved without sequelae. Dr. Nurdan Kotevoglu kindly provided an Excel worksheet with the means and standard deviations for the WOMAC OA Index, patient global assessment and physican global assessment; in addition clarified withdrawals.
Neustadt et al. (Neustadt 2005a ‐3inj) reported a six‐month, double‐blind, arthrocentesis‐controlled RCT performed at 24 centres in Canada and the United States comparing four weekly injections of Orthovisc to either three weekly injections of Orthovisc followed by one arthrocentesis or four arthrocenteses without injection in 372 patients with OA of the knee. The authors reported that there was no statistically significant difference in the primary outcome (greater than or equal to 20% improvement in the WOMAC OA Index pain subscale score) between the 4‐injection Orthovisc group and the arthrocentesis group. With respect to safety, no between group differences were reported in the incidence of adverse events.
For the above RCT, the ITT population was used for safety analyses. However, the "primary planned analysis population" was the evaluable population which was defined as "patients who received all 4 treatments and at least one followup visit and who had no significant protocol deviation". One of the inclusion criteria for this trial was that patients had to score less than 150 mm out of 500 mm on the WOMAC OA Index pain subscale in the contralateral (untreated) knee. In the tables of comparisons and data, the 4 injection schedule comparison is referred to as Neustadt 2005b‐4inj, while the 3 injection schedule is referred to as Neustadt 2005a ‐3inj. The analyses were performed using the change from baseline and absolute means and standard deviations for unadjusted post‐test score were not available from Anika Therapeutics, Inc.. Anika Therapeutics, Inc. kindly provided additional information regarding reasons for discontinuation and a patient tree. Withdrawals were separated into those who withdrew before 8 weeks (n=34) and those who withdrew after 8 weeks (n=78).
Ozturk et al. reported a one‐year, parallel‐group, single‐blind RCT performed at a single centre in Turkey comparing three weekly injections of Orthovisc followed by three weekly injections at six months of the same Orthovisc regimen but in combination with one ml of triamcinolone acetonide (Kenacort‐A) prior to the first and fourth injections of Orthovisc after any effusion had been aspirated in 47 patients with OA of the knee (Ozturk 2005). The objective of this study was to assess the efficacy and safety of Orthovisc with/without corticosteroid. Repeat treatment occurred at the sixth month. In addition, magnetic resonance imaging was used to evaluate the progression of OA. The authors reported that neither treatment showed progression of cartilage damage. With respect to efficacy, an improvement was reported in all patients for functional measures but pain decreased more rapidly and to lower levels in the combination treatment group. With respect to safety, one patient from the combination group and two patients from the Orthovisc group reported adverse events (i.e. local reactions including mild swelling, warmth, pain at the injection site) after the third injection. However, these events resolved within a few days after application of cold packs. Dr. F. Atamaz kindly provided absolute means and standard deviations for both groups as well as clarified group allocation for withdrawals.
Sezgin et al. reported a four‐week, placebo‐controlled, single‐blind RCT performed at a single centre in Turkey comparing three weekly injections of Orthovisc to three weekly injections of sodium chloride (0.9%) in 41 patients with OA of the knee (Sezgin 2005). The objective of this study was to investigate whether hyaluronan had any effect on inflammatory cytokines. The authors reported that hyaluronan significantly decreased IL‐6 levels which correlated with clinical improvement. WOMAC pain, stiffness and physical function scores decreased more in the hyaluronan group than the control group, as did flexion, walking time, knee circumference and amount of effusion. With respect to safety, no patients reported any adverse events during or after the treatment; albeit some patients reported short‐lasting pain (one or 2 minutes) during the injections.
Tascioglu and Oner reported a six‐month, parallel‐group, open‐label RCT performed at a single centre in Turkey comparing three weekly injections of Orthovisc to three weekly injections of 6‐methylprednisolone acetate (6‐MPA) in 69 female patients with OA of the knee (Tascioglu 2003). A significant improvement was reported in both groups at week four in pain and Lequesne outcome measures. At three months, a significant improvement in pain and Lequesne was reported in favour of Orthovisc compared to 6‐MPA. By six months, there was no difference between the two groups. No serious systemic adverse events were reported that could be related to the treatment. Similar percentages of patients reported knee pain after injection (Orthovisc 21%, 6‐MPA 18%). There was no significant between‐group difference with respect to adverse events.
In the Tascioglu and Oner trial paracetamol to a maximum of 3 g was permitted but with restriction 48 hours prior to an assessment (Tascioglu 2003). The percentage of patients with uni and bilateral disease was not reported.
Tekeoglu et al. reported a 15‐week, parallel‐group, open‐label RCT performed in Turkey comparing three weekly injections of Orthovisc to three weekly injections of betamethasone in 40 female patients with OA of the knee (Tekeoglu 1998). In the short term (week 3), betamethasone was more effective than Orthovisc. In the long term (week 15), Orthovisc was more effective than betamethasone. No local or systemic reactions were reported.
The Tekeoglu et al. trial allowed patients to take paracetamol as well (Tekeoglu 1998). Again, the percentage of patients with uni and bilateral disease was not reported. In this RCT, patients were advised to rest for one day after injection 'to avoid overcharging the injected joint'.
Yentur et al. reported a 21‐day, parallel‐group, single‐blind RCT performed in Turkey comparing three weekly injections of Orthovisc plus trigger point injections with 0.5% lidocaine to three weekly injections of Orthovisc in 34 female patients with OA of the knee (Yentur 2003). The authors reported that the combination therapy group had significantly reduced pain and improved function while pain reduction and function improvement were not significant in the Orthovisc alone group. Although the authors reported that no local or systemic adverse events were observed, some patients reported local pain which only lasted for one day and ecchymosis which healed in a few days. Only one patient in the Orthovisc group did not complete the trial.
This small trial addressed an interesting question whether injection of 15 specific trigger points with lidocaine in combination with hyaluronic acid was more effective than hyaluronic acid alone. In this design, symptoms arising from the soft tissues surrounding the knee and not just the joint were treated. A two‐day rest period after each injection was utilised in the trial. In addition, a blinded physician completed all assessments.
Orthovisc versus placebo Efficacy Table 43; Table 44; Table 45; Table 46; Table 47 A statistically significant difference was detected in pain, as measured by the WOMAC OA Index (scored 5 to 25), in favour of Orthovisc compared to placebo (WMD (RE) ‐4.36; 95% CI ‐7.51 to ‐1.21, P < 0.00001) at 1 to 4 weeks postinjection (Hizmetli 1999; Kotevoglu 2005; Sezgin 2005); (WMD ‐5.40; 95% CI ‐6.92 to ‐3.89, P < 0.00001) at 5 to 13 weeks postinjection; (WMD (RE) ‐4.41; 95% CI ‐6.95 to ‐1.88, P value 0.0007) at 14 to 26 weeks postinjection (Hizmetli 1999; Kotevoglu 2005); and (WMD ‐5.30; 95% CI ‐7.02 to ‐3.58, P < 0.00001) at 45 to 52 weeks postinjection (Hizmetli 1999). Orthovisc was between 23 and 45% more effective than saline in relieving pain as measured by the WOMAC OA Index pain subscale. Item five of the WOMAC OA Index pain subscale, pain on standing (measured on a 0 to 100 mm VAS), was utilised as a secondary outcome measure in the Neustadt et al. RCT. No statistically significant difference was detected in this outcome measure between Orthovisc and arthrocentesis (Neustadt 2005a ‐3inj; Neustadt 2005b‐4inj).
43. Clinical benefit table: Orthovisc. Continuous outcome measures (1).
| Study | Time | Treatment | Outcome (scale) | N of Pts | Baseline Mean | End of Study Mean | Absolute Benefit | Relative Difference |
| Bayramoglu 2003 | End of treatment | E: Orthovisc + PT | Lequesene Index (0‐24) | 16 | 12.4 | 9.1 | ‐1.00 (I) | ‐8.6% (I) |
| C: PT | 15 | 11.6 | 9.3 | |||||
| Bayramoglu 2003 | End of treatment | E: Orthovisc + PT | Lequesne Index (0‐24) | 16 | 12.4 | 9.1 | 0.9 (W) | 7.0% (W) |
| C: Hylan G‐F 20 + PT | 15 | 12.8 | 8.6 | |||||
| Bayramoglu 2003 | 5‐13 wk | E: Orthovisc + PT | Lequesene Index (0‐24) | 16 | 12.4 | 7.6 | ‐2.6 (I) | ‐22.4% (I) |
| C: PT | 15 | 11.6 | 9.4 | |||||
| Bayramoglu 2003 | 5‐13 wk | E: Orthovisc + PT | Lequesne Index (0‐24) | 16 | 12.4 | 7.6 | ‐0.6 (I) | ‐4.7% (I) |
| C: Hylan G‐F 20 + PT | 15 | 12.8 | 8.6 | |||||
| Tascioglu 2003 | 1‐4 wk | E: Orthovisc | Pain on weight bearing (0‐100 mm VAS) | 28 | 54.26 | 31.83 | 3.87 (W) | 7.3% (W) |
| C: 6‐MPA | 27 | 53.10 | 26.80 | |||||
| Tascioglu 2003 | 1‐4 wk | E: Orthovisc | Pain at rest (0‐100 mm VAS) | 28 | 30.43 | 11.83 | 3.00 (W) | 10.0% (W) |
| C: 6‐MPA | 27 | 29.90 | 8.30 | |||||
| Tascioglu 2003 | 1‐4 wk | E: Orthovisc | Pain on walking (0‐100 mm VAS) | 28 | 67.60 | 37.60 | 1.00 (W) | 1.5% (W) |
| C: 6‐MPA | 27 | 69.00 | 38.00 | |||||
| Tascioglu 2003 | 1‐4 wk | E: Orthovisc | Lequesne Index (0‐24) | 28 | 10.23 | 7.86 | ‐0.47 (I) | ‐4.8% (I) |
| C: 6‐MPA | 27 | 9.86 | 7.96 | |||||
| Tascioglu 2003 | 1‐4 wk | E: Orthovisc | Flexion (degrees) | 28 | 108.70 | 116.36 | 1.52 (I) | 1.4% (I) |
| C: 6‐MPA | 27 | 108.06 | 114.20 | |||||
| Tascioglu 2003 | 5‐13 wk | E: Orthovisc | Pain on weight bearing (0‐100 mm VAS) | 28 | 54.26 | 22.86 | ‐16.80 (I) | ‐31.6% (I) |
| C: 6‐MPA | 27 | 53.10 | 38.50 | |||||
| Tascioglu 2003 | 5‐13 wk | E: Orthovisc | Pain at rest (0‐100 mm VAS) | 28 | 30.43 | 12.00 | ‐8.23 (I) | ‐27.5% (I) |
| C: 6‐MPA | 27 | 29.90 | 19.70 | |||||
| Tascioglu 2003 | 5‐13 wk | E: Orthovisc | Pain on walking (0‐100 mm VAS) | 28 | 67.60 | 32.03 | ‐17.03 (I) | ‐24.7% (I) |
| C: 6‐MPA | 27 | 69.00 | 50.46 | |||||
| Tascioglu 2003 | 5‐13 wk | E: Orthovisc | Lequesne Index (0‐24) | 28 | 10.23 | 7.66 | ‐1.77 (I) | ‐17.9% (I) |
| C: 6‐MPA | 27 | 9.86 | 9.06 | |||||
| Tascioglu 2003 | 5‐13 wk | E: Orthovisc | Flexion (degrees) | 28 | 108.70 | 115.76 | 1.72 (I) | 1.6% (I) |
| C: 6‐MPA | 27 | 108.06 | 113.40 | |||||
| Tascioglu 2003 | 14‐26 wk | E: Orthovisc | Pain on weight bearing (0‐100 mm VAS) | 28 | 54.26 | 40.96 | ‐16.56 (I) | ‐31.2% (I) |
| C: 6‐MPA | 27 | 53.10 | 56.36 | |||||
| Tascioglu 2003 | 14‐26 wk | E: Orthovisc | Pain at rest (0‐100 mm VAS) | 28 | 30.43 | 23.56 | ‐3.43 (I) | ‐11.5% (I) |
| C: 6‐MPA | 27 | 29.90 | 26.46 | |||||
| Tascioglu 2003 | 14‐26 wk | E: Orthovisc | Pain on walking (0‐100 mm VAS) | 28 | 67.60 | 51.16 | ‐13.50 (I) | ‐19.6% (I) |
| C: 6‐MPA | 27 | 69.00 | 66.06 | |||||
| Tascioglu 2003 | 14‐26 wk | E: Orthovisc | Lequesne Index (0‐24) | 28 | 10.23 | 8.46 | ‐1.51 (I) | ‐15.3% (I) |
| C: 6‐MPA | 27 | 9.86 | 9.60 | |||||
| Tascioglu 2003 | 14‐26 wk | E: Orthovisc | Flexion (degrees) | 28 | 108.70 | 114.60 | 4.36 (I) | 4.0% (I) |
| C: 6‐MPA | 27 | 108.06 | 109.60 | |||||
| Hizmetli 1999 | 1‐4 wk | E: Orthovisc | WOMAC pain (5‐25 Likert) | 20 | 17.75 | 10.20 | ‐7.80 (I) | ‐44.6% (I) |
| C: Saline | 20 | 17.45 | 17.70 | |||||
| Hizmetli 1999 | 5‐13 wk | E: Orthovisc | WOMAC pain (5‐25 Likert) | 20 | 17.75 | 11.75 | ‐6.25 (I) | ‐35.4% (I) |
| C: Saline | 20 | 17.45 | 17.70 | |||||
| Hizmetli 1999 | 14‐26 wk | E: Orthovisc | WOMAC pain (5‐25 Likert) | 20 | 17.75 | 12.80 | ‐5.90 (I) | ‐33.7% (I) |
| C: Saline | 20 | 17.45 | 18.40 | |||||
| Hizmetli 1999 | 45‐52 wk | E: Orthovisc | WOMAC pain (5‐25 Likert) | 20 | 17.75 | 13.80 | ‐5.60 (I) | ‐32% (I) |
| C: Saline | 20 | 17.45 | 19.10 | |||||
| Hizmetli 1999 | 1‐4 wk | E: Orthovisc | WOMAC function (17‐85 Likert) | 20 | 53.15 | 39.85 | ‐13.40 (I) | ‐25.8% (I) |
| C: Saline | 20 | 52.00 | 52.10 | |||||
| Hizmetli 1999 | 5‐13 wk | E: Orthovisc | WOMAC function (17‐85 Likert) | 20 | 53.15 | 41.35 | ‐11.30 (I) | ‐21.7 (I) |
| C: Saline | 20 | 52.00 | 51.50 | |||||
| Hizmetli 1999 | 14‐26 wk | E: Orthovisc | WOMAC function (17‐85 Likert) | 20 | 53.15 | 43.20 | ‐10.45 (I) | ‐20.2 (I) |
| C: Saline | 20 | 52.00 | 52.50 | |||||
| Hizmetli 1999 | 46‐52 wk | E: Orthovisc | WOMAC function (17‐85 Likert) | 20 | 53.15 | 45.80 | ‐8.25 (I) | ‐16.0 (I) |
| C: Saline | 20 | 52.00 | 52.90 | |||||
| Tekeoglu 1998 | 1‐4 wk | E: Orthovisc | WOMAC function (17‐85 Likert) | 20 | 45.50 | 34.30 | 3.10 (W) | 6.8% (W) |
| C: Betamethasone | 20 | 45.60 | 31.30 | |||||
| Tekeoglu 1998 | 5‐13 wk | E: Orthovisc | WOMAC function (17‐85 Likert) | 20 | 45.50 | 30.90 | ‐8.90 (I) | ‐19.5% (I) |
| C: Betamethasone | 20 | 45.60 | 39.90 | |||||
| Tekeoglu 1998 | 1‐4 wk | E: Orthovisc | Maximum flexion (degrees) | 20 | 110.50 | 117.30 | 0.60 (I) | 0.5% (I) |
| C: Betamethsone | 20 | 116.00 | 122.20 | |||||
| Tekeoglu 1998 | 5‐13 wk | E: Orthovisc | Maximum flexion (degrees) | 20 | 110.50 | 121.20 | ‐1.55 (W) | ‐1.3% (W) |
| C: Betamethasone | 20 | 116.00 | 128.25 | |||||
| Kalay 1997 | 1‐4 wk | E: Orthovisc + PT | Activity pain (0‐100 mm VAS) | 20 | 46.8 | 12.50 | ‐11.4 (I) | ‐30.7% (I) |
| C: PT | 20 | 37.1 | 14.20 | |||||
| Kalay 1997 | 1‐4 wk | E: Orthovisc + PT | Spontaneous pain (0‐100 mm VAS) | 20 | 26.1 | 5.80 | ‐3.6 (W) | ‐16.3% (W) |
| C: PT | 20 | 22.1 | 5.40 | |||||
| Kalay 1997 | 1‐4 wk | E: Orthovisc + PT | Night pain (0‐100 mm VAS) | 20 | 24.3 | 5.40 | ‐2.8 (I) | ‐12.9% (I) |
| C: PT | 20 | 21.7 | 5.60 | |||||
| Kalay 1997 | 1‐4 wk | E: Orthovisc + PT | 25 m walk time (sec) | 20 | 22.4 | 15.30 | ‐3.10 (I) | ‐16.7% (I) |
| C: PT | 20 | 18.6 | 14.60 | |||||
| Kalay 1997 | 1‐4 wk | E: Orthovisc + PT | Flexion (degrees) | 20 | 126.00 | 130.00 | 2.70 (I) | 2.1% (I) |
| C: PT | 20 | 128.50 | 129.80 | |||||
| Kalay 1997 | 5‐13 wk | E: Orthovisc + PT | Activity pain (0‐100 mm VAS) | 20 | 46.8 | 6.10 | ‐16.2 (I) | ‐43.7% (I) |
| C: PT | 20 | 37.1 | 12.60 | |||||
| Kalay 1997 | 5‐13 wk | E: Orthovisc + PT | Spontaneous pain (0‐100 mm VAS) | 20 | 26.1 | 1.70 | ‐8.1 (I) | ‐16.3% (I) |
| C: PT | 20 | 22.1 | 5.80 | |||||
| Kalay 1997 | 5‐13 wk | E: Orthovisc + PT | Night pain (0‐100 mm VAS) | 20 | 24.3 | 1.60 | ‐5.9 (I) | ‐27.2% (I) |
| C: PT | 20 | 21.7 | 4.90 | |||||
| Kalay 1997 | 5‐13 wk | E: Orthovisc + PT | 25 m walk time (sec) | 20 | 22.4 | 13.30 | ‐4.90 (I) | ‐26.3% (I) |
| C: PT | 20 | 18.6 | 14.40 | |||||
| Kalay 1997 | 5‐13 wk | E: Orthovisc + PT | Flexion (degrees) | 20 | 126.00 | 130.00 | 2.70 (I) | 2.1% (I) |
| C: PT | 20 | 128.50 | 129.80 | |||||
| Karatay 2004 | 1‐4 wk | E: Orthovisc | WOMAC pain (0‐20 Likert) | 20 | 11.2 | 6.4 | ‐0.8 (I) | ‐7.4% (I) |
| C: Hylan G‐F 20 | 20 | 10.8 | 6.2 | |||||
| Karatay 2004 | 1‐4 wk | E: Orthovisc | WOMAC function (0‐68 Likert) | 20 | 35.0 | 7.4 | ‐3.2 (I) | ‐10.0% (I) |
| C: Hylan G‐F 20 | 20 | 31.9 | 7.5 | |||||
| Karatay 2004 | 1‐4 wk | E: Orthovisc | WOMAC stiffness (0‐8 Likert) | 20 | 3.8 | 1.8 | ‐0.2 (I) | ‐5.6% (I) |
| C: Hylan G‐F 20 | 20 | 3.6 | 1.8 | |||||
| Karatay 2004 | 1‐4 wk | E: Orthovisc | SF intercellular adhesion molecule‐1 (ICAM‐1) | 20 | 19.2 | 11.1 | ‐0.3 (I) | ‐1.7% (I) |
| C: Hylan G‐F 20 | 20 | 17.8 | 10.0 | |||||
| Karatay 2004 | 1‐4 wk | E: Orthovisc | SF vascular cell adhesion molecule‐1 (VCAM) | 20 | 40.5 | 14.2 | 1.3 (W) | 3.4% (W) |
| C: Hylan G‐F 20 | 20 | 37.8 | 10.2 |
44. Clinical benefit table: Orthovisc. Continuous outcome measures (2).
| Study | Time | Treatment | Outcome | N of Pts | Baseline Mean | End of Study Mean | Absolute Benefit | Relative Difference |
| Sezgin 2005 | 1‐4 wk | E: Orthovisc | WOMAC pain (5‐25 LIkert) | 22 | 18.9 | 8.9 | ‐3.9 (I) | ‐22.7% (I) |
| C: Saline | 19 | 17.2 | 11.1 | |||||
| Sezgin 2005 | 1‐4 wk | E: Orthovisc | WOMAC stiffness (2‐10 Likert) | 22 | 6.5 | 3.4 | ‐2.0 (I) | ‐44.4% (I) |
| C: Saline | 19 | 4.5 | 3.4 | |||||
| Sezgin 2005 | 1‐4 wk | E: Orthovisc | WOMAC physical function (17‐85 Likert) | 22 | 64.1 | 32.2 | ‐20.9 (I) | ‐41.8% (I) |
| C: Saline | 19 | 50.0 | 39.0 | |||||
| Sezgin 2005 | 1‐4 wk | E: Orthovisc | Flexion (degrees) | 22 | 95.9 | 125.2 | 16.5 (I) | 15.2% (I) |
| C: Saline | 19 | 108.4 | 121.2 | |||||
| Sezgin 2005 | 1‐4 wk | E: Orthovisc | 25 metre walking time (sec) | 22 | 43.1 | 26.4 | ‐11.2 (I) | ‐35.6% (I) |
| C: Saline | 19 | 31.5 | 26.0 | |||||
| Sezgin 2005 | 1‐4 wk | E: Orthovisc | Knee cirumference (cm) | 22 | 41.5 | 40.0 | ‐0.5 (I) | ‐1.2% (I) |
| C: Saline | 19 | 41.3 | 40.3 | |||||
| Sezgin 2005 | 1‐4 wk | E: Orthovisc | Synovial fluid effusion volume (ml) | 22 | 19.0 | 7.6 | ‐4.5 (I) | ‐24.3% (I) |
| C: Saline | 19 | 18.5 | 11.6 | |||||
| Sezgin 2005 | 1‐4 wk | E: Orthovisc | Interleukin 6 level in synovial fluid (pg/ml) | 22 | 42.8 | 22.3 | ‐3.0 (I) | ‐5.8% (I) |
| C: Saline | 19 | 51.7 | 34.2 | |||||
| Sezgin 2005 | 1‐4 wk | E: Orthovisc | Interleukin 8 level in synovial fluid (pg/ml) | 22 | 20.6 | 17.0 | ‐7.5 (I) | ‐41.9% (I) |
| C: Saline | 19 | 17.9 | 21.8 | |||||
| Sezgin 2005 | 1‐4 wk | E: Orthovisc | Tumor necrosis factor alpha levels in synovial fluid (pg/ml) | 22 | 77.0 | 58.7 | ‐5.5 (I) | ‐6.8% (I) |
| C: Saline | 19 | 80.8 | 68.0 | |||||
| Neustadt 2005a | 5‐13 wk | E: Orthovisc (4 injections) | WOMAC pain (0‐500 mm VAS) | |||||
| C: Arthrocentesis | ||||||||
| Neustadt 2005a | 5‐13 wk | E: Orthovisc (3 injections) | WOMAC pain (0‐500 mm VAS) | |||||
| C: Arthrocentesis | ||||||||
| Neustadt 2005a | 14‐26 wk | E: Orthovisc (4 injections) | WOMAC pain (0‐500 mm VAS) | |||||
| C: Arthrocentesis | ||||||||
| Neustadt 2005a | 14‐26 wk | E: Orthovisc (3 injections) | WOMAC pain (0‐500 mm VAS) | |||||
| C: Arthrocentesis | ||||||||
| Neustadt 2005a | 5‐13 wk | E: Orthovisc (4 injections) | Pain on standing (0‐100 mm VAS) | |||||
| C: Arthrocentesis | ||||||||
| Neustadt 2005a | 5‐13 wk | E: Orthovisc (3 injections) | Pain on standing (0‐100 mm VAS) | |||||
| C: Arthrocentesis | ||||||||
| Neustadt 2005a | 14‐26 wk | E: Orthovisc (4 injections) | Pain on standing (0‐100 mm VAS) | |||||
| C: Arthrocentesis | ||||||||
| Neustadt 2005a | 14‐26 wk | E: Orthovisc (3 injections) | Pain on standing (0‐100 mm VAS) | |||||
| C: Arthrocentesis | ||||||||
| Neustadt 2005a | 5‐13 wk | E: Orthovisc (4 injections) | Patient global score (0‐100 mm VAS) | |||||
| C: Arthrocentesis | ||||||||
| Neustadt 2005a | 5‐13 wk | E: Orthovisc (3 injections) | Patient global score (0‐100 mm VAS) | |||||
| C: Arthrocentesis | ||||||||
| Neustadt 2005a | 14‐26 wk | E: Orthovisc (4 injections) | Patient global score (0‐100 mm VAS) | |||||
| C: Arthrocentesis | ||||||||
| Neustadt 2005a | 14‐26 wk | E: Orthovisc (3 injections) | Patient global score (0‐100 mm VAS) | |||||
| C: Arthrocentesis | ||||||||
| Neustadt 2005a | 5‐13 wk | E: Orthovisc (4 injections) | Investigator global score (0‐100 mm VAS) | |||||
| C: Arthrocentesis | ||||||||
| Neustadt 2005a | 5‐13 wk | E: Orthovisc (3 injections) | Investigator global score (0‐100 mm VAS) | |||||
| C: Arthrocentesis | ||||||||
| Neustadt 2005a | 14‐26 wk | E: Orthovisc (4 injections) | Investigator global score (0‐100 mm VAS) | |||||
| C: Arthrocentesis | ||||||||
| Neustadt 2005a | 14‐26 wk | E: Orthovisc (3 injections) | Investigator global score (0‐100 mm VAS) | |||||
| C: Arthrocentesis | ||||||||
| Yentur 2003 | 1 wk | E: Orthovisc+lidocaine | Pain at rest (0‐4 point scale) | 17 | 2.90 | 0.52 | ‐2.07 (I) | ‐80.9% (I) |
| C: Orthovisc | 16 | 2.56 | 2.25 | |||||
| Yentur 2003 | 1 wk | E: Orthovisc+lidocaine | Pain/restrictions walking (0‐4 point scale) | 17 | 2.35 | 0.88 | ‐1.10 (I) | ‐46.4% (I) |
| C: Orthovisc | 16 | 2.37 | 2.00 | |||||
| Yentur 2003 | 1 wk | E: Orthovisc+lidocaine | Pain/restrictions going up or down stairs (0‐4 point scale) | 17 | 2.60 | 0.88 | ‐1.47 (I) | ‐56.1% (I) |
| C: Orthovisc | 16 | 2.62 | 2.37 | |||||
| Yentur 2003 | 1 wk | E: Orthovisc+lidocaine | Range of motion (degrees) | 17 | 103.8 | 124.4 | 21.2 (I) | 18.2% (I) |
| C: Orthovisc | 16 | 116.2 | 116.8 | |||||
| Karatosun 2005a | 1‐4 wk | E: Orthovisc | Hospital for Special Surgery Knee Score | 39 | 67.7 | 86.5 | 2.2 (I) | 3.1% (I) |
| C: Hylan G‐F 20 | 40 | 70.1 | 86.7 | |||||
| Karatosun 2005a | 5‐13 wk | E: Orthovisc | Hospital for Special Surgery Knee Score | 39 | 67.7 | 87.3 | 3.4 (I) | 4.9% (I) |
| C: Hylan G‐F 20 | 34 | 70.1 | 86.3 | |||||
| Karatosun 2005a | 14‐26 wk | E: Orthovisc | Hospital for Special Surgery Knee Score | 37 | 67.7 | 84.7 | 1.4 (I) | 2.0% (I) |
| C: Hylan G‐F 20 | 34 | 70.1 | 85.7 | |||||
| Karatosun 2005 | 45‐52 wk | E: Orthovisc | Hospital for Special Surgery Knee Score | 30 | 67.7 | 86.6 | 2.3 (I) | 3.3% (I) |
| C: Hylan G‐F 20 | 32 | 70.1 | 86.7 | |||||
| Karatosun 2005a | 1‐4 wk | E: Orthovisc | Pain during activity (HSSKS) | 39 | 4.4 | 11.2 | 0.8 (I) | 15.4% (I) |
| C: Hylan G‐F 20 | 40 | 5.2 | 11.2 | |||||
| Karatosun 2005a | 5‐13 wk | E: Orthovisc | Pain during activity (HSSKS) | 39 | 4.4 | 11.3 | 1.8 (I) | 34.6% (I) |
| C: Hylan G‐F 20 | 34 | 5.2 | 10.3 | |||||
| Karatosun 2005a | 14‐26 wk | E: Orthovisc | Pain during activity (HSSKS) | 37 | 4.4 | 10.5 | 0.7 (I) | 13.5% (I) |
| C: Hylan G‐F 20 | 34 | 5.2 | 10.6 | |||||
| Karatosun 2005a | 45‐52 wk | E: Orthovisc | Pain during activity (HSSKS) | 30 | 4.4 | 10.8 | 0.5 (I) | 9.6% (I) |
| C: Hylan G‐F 20 | 32 | 5.2 | 11.1 | |||||
| Karatosun 2005a | 1‐4 wk | E: Orthovisc | Pain at rest (HSSKS) | 39 | 9.1 | 14.1 | 0.1 (I) | 1.2% (I) |
| C: Hylan G‐F 20 | 40 | 8.1 | 13.0 | |||||
| Karatosun 2005a | 5‐13 wk | E: Orthovisc | Pain at rest (HSSKS) | 39 | 9.1 | 13.4 | ‐0.8 (W) | ‐9.9% (W) |
| C: Hylan G‐F 20 | 34 | 8.1 | 13.2 | |||||
| Karatosun 2005a | 14‐26 wk | E: Orthovisc | Pain at rest (HSSKS) | 37 | 9.1 | 13.2 | ‐1.3 (W) | ‐16.0% W) |
| C: Hylan G‐F 20 | 34 | 8.1 | 13.5 | |||||
| Karatosun 2005a | 45‐52 wk | E: Orthovisc | Pain at rest (HSSKS) | 30 | 9.1 | 13.4 | ‐0.7 (W) | ‐8.6% (W) |
| C: Hylan G‐F 20 | 32 | 8.1 | 13.1 | |||||
| Karatosun 2005a | 1‐4 wk | E: Orthovisc | Pain during climbing stairs (HSSKS) | 39 | 2.1 | 3.5 | 0 | 0% |
| C: Hylan G‐F 20 | 40 | 2.1 | 3.5 | |||||
| Karatosun 2005a | 5‐13 wk | E: Orthovisc | Pain during climbing stairs (HSSKS) | 39 | 2.1 | 3.5 | ‐0.1 (W) | ‐4.8% (W) |
| C: Hylan G‐F 20 | 34 | 2.1 | 3.6 | |||||
| Karatosun 2005a | 14‐26 wk | E: Orthovisc | Pain during climbing stairs (HSSKS) | 37 | 2.1 | 3.0 | ‐0.1 (W) | ‐4.8% (W) |
| C: Hylan G‐F 20 | 34 | 2.1 | 3.1 | |||||
| Karatosun 2005a | 45‐52 wk | E: Orthovisc | Pain during climbing stairs (HSSKS) | 30 | 2.1 | 3.0 | ‐0.4 (W) | ‐19.0% (W) |
| C: Hylan G‐F 20 | 32 | 2.1 | 3.4 |
45. Clinical benefit table: Orthovisc. Continuous outcome measures (3).
| Study | Time | Treatment | Outcome | N of Pts | Baseline Mean | End of Study Mean | Absolute Benefit | Relative Difference |
| Karatosun 2005a | 1‐4 wk | E: Orthovisc | Pain during transfer activity | 39 | 2.5 | 4.0 | ‐1.1 (W) | ‐42.3% (W) |
| C: Hylan G‐F 0 | 40 | 2.6 | 4.2 | |||||
| Karatosun 2005a | 5‐13 wk | E: Orthovisc | Pain during transfer activity | 39 | 2.5 | 4.5 | 0.5 (I) | 19.25 (I) |
| C: Hylan G‐F 20 | 34 | 2.6 | 4.1 | |||||
| Karatosun 2005a | 14‐26 wj | E: Orthovisc | Pain during transfer activity | 37 | 2.5 | 3.9 | 0.2 (I) | 7.7% (I) |
| C: Hylan G‐F 20 | 34 | 2.6 | 3.8 | |||||
| Karatosun 2005a | 45‐52 wk | E: Orthovisc | Pain during transfer activity | 30 | 2.5 | 4.3 | 0.3 (I) | 11.5% (I) |
| C: Hylan G‐F 20 | 32 | 2.6 | 4.1 | |||||
| Karatosun 2005a | 1‐4 wk | E: Orthovisc | Walking distance | 39 | 5.4 | 8.7 | 1.7 (I) | 20.5% (I) |
| C: Hylan G‐F 20 | 40 | 8.3 | 9.9 | |||||
| Karatosun 2005a | 5‐13 wk | E: Orthovisc | Walking distance | 39 | 5.4 | 9.2 | 2.0 (I) | 24.2% (I) |
| C: Hylan G‐F 20 | 34 | 8.3 | 10.1 | |||||
| Karatosun 2005a | 14‐26 wk | E: Orthovisc | Walking distance | 37 | 5.4 | 9.1 | 2.0 (I) | 24.2% (I) |
| C: Hylan G‐F 20 | 34 | 8.3 | 10.0 | |||||
| Karatosun 2005a | 45‐52 wk | E: Orthovisc | Walking distance | 30 | 5.4 | 9.6 | 2.3 (I) | 27.7% (I) |
| C: Hylan G‐F 20 | 32 | 8.3 | 10.2 | |||||
| Karatosun 2005a | 1‐4 wk | E: Orthovisc | Range of motion | 39 | 113.0 | 123.0 | 3.8 (I) | 3.3% (I) |
| C: Hylan G‐F 20 | 40 | 114.4 | 120.6 | |||||
| Karatosun 2005a | 5‐13 wk | E: Orthovisc | Range of motion | 39 | 113.0 | 121.9 | 2.3 (I) | 2.0% (I) |
| C: Hylan G‐F 20 | 34 | 114.4 | 121.0 | |||||
| Karatosun 2005a | 14‐26 wk | E: Orthovisc | Range of motion | 37 | 113.0 | 118.0 | ‐0.4 (W) | ‐0.3% (W) |
| C: Hylan G‐F 20 | 34 | 114.4 | 119.8 | |||||
| Karatosun 2005a | 45‐52 wk | E: Orthovisc | Range of motion | 30 | 113.0 | 122.0 | 2.1 (I) | 1.8% (I) |
| C: Hylan G‐F 20 | 32 | 114.4 | 121.3 | |||||
| Atamaz 2005 | 1‐4 wk | E: Orthovisc | WOMAC pain (Likert) | 20 | 13.4 | 9.3 | 0 | 0% |
| C: Hylan G‐F 20 | 20 | 12.4 | 8.3 | |||||
| Atamaz 2005 | 5‐13 wk | E: Orthovisc | WOMAC pain (Likert) | 20 | 13.4 | 11.2 | 1.5 (W) | 12.1% (W) |
| C: Hylan G‐F 20 | 20 | 12.4 | 8.7 | |||||
| Atamaz 2005 | 14‐26 wk | E: Orthovisc | WOMAC pain (Likert) | 20 | 13.4 | 11.9 | 0.5 (W) | 4.0% (W) |
| C: Hylan G‐F 20 | 20 | 12.4 | 10.4 | |||||
| Atamaz 2005 | 36 wk | E: Orthovisc | WOMAC pain (Likert) | 20 | 13.4 | 10.4 | ‐1.0 (I) | 8.1% (I) |
| C: Hylan G‐F 20 | 20 | 12.4 | 10.4 | |||||
| Atamaz 2005 | 45‐52 wk | E: Orthovisc | WOMAC pain (Likert) | 20 | 13.4 | 11.2 | 0 | 0% |
| C: Hylan G‐F 20 | 20 | 12.4 | 10.2 | |||||
| Atamaz 2005 | 1‐4 wk | E: Orthovisc | Spontaneous pain (0‐100 mm VAS) | 20 | 70.3 | 42.9 | ‐6.4 (I) | ‐7.5% (I) |
| C: Hylan G‐F 20 | 20 | 85.0 | 64.0 | |||||
| Atamaz 2005 | 5‐13 wk | E: Orthovisc | Spontaneous pain (0‐100 mm VAS) | 20 | 70.3 | 58.4 | 27.6 (W) | 32.5% (W) |
| C: Hylan G‐F 20 | 20 | 85.0 | 45.5 | |||||
| Atamaz 2005 | 14‐26 wk | E: Orthovisc | Spontaneous pain (0‐100 mm VAS) | 20 | 70.3 | 66.2 | 30.2 (W) | 35.5% (W) |
| C: Hylan G‐F 20 | 20 | 85.0 | 50.7 | |||||
| Atamaz 2005 | 36 wk | E: Orthovisc | Spontaneous pain (0‐100 mm VAS) | 20 | 70.3 | 52.2 | 15.2 (W) | 17.9% (W) |
| C: Hylan G‐F 20 | 20 | 85.0 | 51.7 | |||||
| Atamaz 2005 | 45‐52 wk | E: Orthovisc | Spontaneous pain (0‐100 mm VAS) | 20 | 70.3 | 56.7 | 22.4 (W) | 26.4% (W) |
| C: Hylan G‐F 20 | 20 | 85.0 | 49.0 | |||||
| Atamaz 2005 | 1‐4 wk | E: Orthovisc | SF‐36 pain | 20 | 36.4 | 47.5 | ‐22.7 (W) | ‐88.7% (W) |
| C: Hylan G‐F 20 | 20 | 25.6 | 59.4 | |||||
| Atamaz 2005 | 5‐13 wk | E: Orthovisc | SF‐36 pain | 20 | 36.4 | 28.0 | 24.8 (W) | 96.9% (W) |
| C: Hylan G‐F 20 | 20 | 25.6 | 58.8 | |||||
| Atamaz 2005 | 14‐26 wk | E: Orthovisc | SF‐36 pain | 20 | 36.4 | 35.9 | 29.6 (W) | 115.6% (W) |
| C: Hylan G‐F 20 | 20 | 25.6 | 55.7 | |||||
| Atamaz 2005 | 36 wk | E: Orthovisc | SF‐36 pain | 20 | 36.4 | 45.3 | 9.3 (W) | 36.3% (W) |
| C: Hylan G‐F 20 | 20 | 25.6 | 43.8 | |||||
| Atamaz 2005 | 45‐52 wk | E: Orthovisc | SF‐36 pain | 20 | 36.4 | 37.7 | 19.8 (W) | 77.3% (W) |
| C: Hylan G‐F 20 | 20 | 25.6 | 46.7 | |||||
| Atamaz 2005 | 1‐4 wk | E: Orthovisc | WOMAC physical function | 20 | 41.5 | 35.2 | 11.9 (W) | 20.4% (W) |
| C: Hylan G‐F 20 | 20 | 58.3 | 40.1 | |||||
| Atamaz 2005 | 5‐13 wk | E: Orthovisc | WOMAC physical function | 20 | 41.5 | 36.2 | 11.3 (W) | 19.4% (W) |
| C: Hylan G‐F 20 | 20 | 58.3 | 41.7 | |||||
| Atamaz 2005 | 14‐26 wk | E: Orthovisc | WOMAC physical function | 20 | 41.5 | 41.8 | 16.1 (W) | 27.6% (W) |
| C: Hylan G‐F 20 | 20 | 58.3 | 41.9 | |||||
| Atamaz 2005 | 36 wk | E: Orthovisc | WOMAC physical function | 20 | 41.5 | 39.6 | 17.8 (W) | 30.5% (W) |
| C: Hylan G‐F 20 | 20 | 58.3 | 38.6 | |||||
| Atamaz 2005 | 45‐52 wk | E: Orthovisc | WOMAC physical function | 20 | 41.5 | 37.6 | 15.5 (W) | 26.6% (W) |
| C: Hylan G‐F 20 | 20 | 58.3 | 38.9 | |||||
| Atamaz 2005 | 1‐4 wk | E: Orthovisc | SF‐36 physical functioning | 20 | 44.5 | 54.2 | ‐12.0 (W) | ‐33.8% (W) |
| C: Hylan G‐F 20 | 20 | 35.5 | 57.2 | |||||
| Atamaz 2005 | 5‐13 wk | E: Orthovisc | SF‐36 physical functioning | 20 | 44.5 | 41.5 | ‐23.2 (W) | ‐65.4% (W) |
| C: Hylan G‐F 20 | 20 | 35.5 | 61.7 | |||||
| Atamaz 2005 | 14‐26 wk | E: Orthovisc | SF‐36 physical functionin | 20 | 44.5 | 44.5 | ‐20.2 (W) | ‐56.9% (W) |
| C: Hylan G‐F 20 | 20 | 35.5 | 55.7 | |||||
| Atamaz 2005 | 36 wk | E: Orthovisc | SF‐36 physical functioning | 20 | 44.5 | 49.2 | ‐4.8 (W) | ‐13.5% (W) |
| C: Hylan G‐F 20 | 20 | 35.5 | 45.0 | |||||
| Atamaz 2005 | 45‐52 wk | E: Orthovisc | SF‐36 physical functioning | 20 | 44.5 | 31.0 | ‐32.0 (W) | ‐90.1% (W) |
| C: Hylan G‐F 20 | 20 | 35.5 | 54.0 | |||||
| Atamaz 2005 | 1‐4 wk | E: Orthovisc | WOMAC pain (Likert) | 20 | 13.4 | 9.3 | ‐1.2 (I) | ‐8.5% (I) |
| C: Physical therapy | 40 | 14.2 | 11.3 | |||||
| Atamaz 2005 | 5‐13 wk | E: Orthovisc | WOMAC pain (Likert) | 20 | 13.4 | 11.2 | 0.2 (W) | 1.4% (W) |
| C: Physical therapy | 40 | 14.2 | 11.8 | |||||
| Atamaz 2005 | 14‐26 wk | E: Orthovisc | WOMAC pain (Likert) | 20 | 13.4 | 11.9 | 1.4 (W) | 9.9% (W) |
| C: Physical therapy | 40 | 14.2 | 11.3 | |||||
| Atamaz 2005 | 36 wk | E: Orthovisc | WOMAC pain (Likert) | 20 | 13.4 | 10.4 | ‐1.1 (I) | ‐7.7% (I) |
| C: Physical therapy | 40 | 14.2 | 12.3 | |||||
| Atamaz 2005 | 45‐52 wk | E: Orthovisc | WOMAC pain (Likert) | 20 | 13.4 | 11.2 | ‐3.5 (I) | ‐24.6% (I) |
| C: Physical therapy | 40 | 14.2 | 15.5 | |||||
| Atamaz 2005 | 1‐4 wk | E: Orthovisc | Spontaneous pain (0‐100 mm VAS) | 20 | 70.3 | 42.9 | ‐6.4 (I) | ‐7.5% (I) |
| C: Physical therapy | 40 | 93.5 | 43.5 | |||||
| Atamaz 2005 | 5‐13 wk | E: Orthovisc | Spontaneous pain (0‐100 mm VAS) | 20 | 70.3 | 58.4 | 22.4 (W) | 26.4% (W) |
| C: Physical therapy | 40 | 93.5 | 49.5 | |||||
| Atamaz 2005 | 14‐26 wk | E: Orthovisc | Spontaneous pain (0‐100 mm VAS) | 20 | 70.3 | 66.2 | 29.2 (W) | 34.4% (W) |
| C: Physical therapy | 40 | 93.5 | 48.5 | |||||
| Atamaz 2005 | 36 wk | E: Orthovisc | Spontaneous pain (0‐100 mm VAS) | 20 | 70.3 | 52.2 | 15.2 (W) | 17.9% (W) |
| C: Physical therapy | 40 | 93.5 | 50.7 | |||||
| Atamaz 2005 | 45‐52 wk | E: Orthovisc | Spontaneous pain (0‐100 mm VAS) | 20 | 70.3 | 56.7 | 22.4 (W) | 26.4% (W) |
| C: Physical therapy | 40 | 93.5 | 59.5 |
46. Clinical benefit table: Orthovisc. Continuous outcome measures (4).
| Study | Time | Treatment | Outcome | N of Pts | Baseline Mean | End of Study Mean | Absolute Benefit | Relative Difference |
| Atamaz 2005 | 1‐4 wk | E: Orthovisc | SF‐36 pain | 20 | 36.4 | 47.5 | ‐18.4 (W) | ‐62.2% (W) |
| C: Physical therapy | 40 | 29.6 | 59.1 | |||||
| Atamaz 2005 | 5‐13 wk | E: Orthovisc | SF‐36 pain | 20 | 36.4 | 28.0 | 18.2 (W) | 61.5% (W) |
| C: Physical therapy | 40 | 29.6 | 56.2 | |||||
| Atamaz 2005 | 14‐26 wk | E: Orthovisc | SF‐36 pain | 20 | 36.4 | 35.9 | 24.5 (W) | 82.8% (W) |
| C: Physical therapy | 40 | 29.6 | 54.6 | |||||
| Atamaz 2005 | 36 wk | E: Orthovisc | SF‐36 pain | 20 | 36.4 | 45.3 | ‐12.8 (W) | ‐43.2% (W) |
| C: Physical therapy | 40 | 29.6 | 51.3 | |||||
| Atamaz 2005 | 45‐52 wk | E: Orthovisc | SF‐36 pain | 20 | 36.4 | 37.7 | ‐19.3 (W) | ‐65.2% (W) |
| C: Physical therapy | 40 | 46.7 | 50.2 | |||||
| Atamaz 2005 | 1‐4 wk | E: Orthovisc | WOMAC physical function | 20 | 41.5 | 35.2 | 6.0 (W) | 12.0% (W) |
| C: Physical therapy | 40 | 49.9 | 37.6 | |||||
| Atamaz 2005 | 5‐13 wk | E: Orthovisc | WOMAC physical function | 20 | 41.5 | 36.2 | 5.7 (W) | 11.4% (W) |
| C: Physical therapy | 40 | 49.9 | 38.9 | |||||
| Atamaz 2005 | 14‐26 wk | E: Orthovisc | WOMAC physical function | 20 | 41.5 | 41.8 | 7.7 (W) | 15.% (W) |
| C: Physical therapy | 40 | 49.9 | 41.9 | |||||
| Atamaz 2005 | 36 wk | E: Orthovisc | WOMAC physical function | 20 | 41.5 | 39.6 | 9.8 (W) | 19.6% (W) |
| C: Physical therapy | 40 | 49.9 | 38.2 | |||||
| Atamaz 2005 | 45‐52 wk | E: Orthovisc | WOMAC physical function | 20 | 41.5 | 37.6 | 7.8 (W) | 15.6% (W) |
| C: Physical therapy | 40 | 49.9 | 38.2 | |||||
| Atamaz 2005 | 1‐4 wk | E: Orthovisc | SF‐36 physical functioning | 20 | 44.5 | 54.2 | ‐12.3 (W) | ‐38.8% (W) |
| C: Physical therapy | 40 | 31.7 | 53.7 | |||||
| Atamaz 2005 | 5‐13 wk | E: Orthovisc | SF‐36 physical functioning | 20 | 44.5 | 41.5 | ‐24.8 (W) | ‐78.2% (W) |
| C: Physical therapy | 40 | 31.7 | 53.5 | |||||
| Atamaz 2005 | 14‐26 wk | E: Orthovisc | SF‐36 physical functioning | 20 | 44.5 | 44.5 | ‐22.3 (W) | ‐70.3% (WO |
| C: Physical therapy | 40 | 31.7 | 54.0 | |||||
| Atamaz 2005 | 36 wk | E: Orthovisc | SF‐36 physical functioning | 20 | 44.5 | 49.2 | ‐12.8 (W) | ‐40.4% (W) |
| C: Physical therapy | 40 | 31.7 | 49.2 | |||||
| Atamaz 2005 | 45‐52 wk | E: Orthovisc | SF‐36 physical functioning | 20 | 44.5 | 31.0 | ‐34.8 (W) | ‐109.8% (W) |
| C: Physical therapy | 40 | 31.7 | 53.0 | |||||
| Ozturk 2005 | 1‐4 wk | E: Orthovisc | Pain (0‐100 mm VAS) | 24 | 66.7 | 53.5 | 18.9 (W) | ‐26.0% (W) |
| C: Orthovisc+triamcinolone acetonide | 16 | 72.6 | 40.5 | |||||
| Ozturk 2005 | 1‐4 wk | E: Orthovisc | WOMAC OA Index stiffness subscale | 24 | 4.1 | 3.9 | 0.8 (W) | ‐19.5% (W) |
| C: Orthovisc+triamcinolone acetonide | 16 | 4.1 | 3.1 | |||||
| Ozturk 2005 | 5‐13 wk | E: Orthovisc | WOMAC OA Index stiffness subscale | 24 | 4.1 | 3.9 | 0.8 (W) | ‐19.5% (W) |
| C: Orthovisc+triamcinolone acetonide | 16 | 4.1 | 3.1 | |||||
| Ozturk 2005 | 45‐52 wk | E: Orthovisc | WOMAC OA Index stiffness subscale | 24 | 4.1 | 3.9 | 0.8 (W) | ‐19.5% (W) |
| C: Orthovisc+triamcinolone acetonide | 16 | 4.1 | 3.1 |
47. Clinical benefit table: Orthovisc. Dichotomous outcome measures.
| Study | Time | Treatment | Outcome | No. improved | No. of pts. | Risk (%) | Risk difference | NNT |
| Brandt 2001 | 14‐26 wk | E: Orthovisc | WOMAC pain (number of patients improved) | 61 | 66 | 92 | 5 | 20 |
| C: Saline | 60 | 69 | 87 | |||||
| Brandt 2001 | 14‐26 wk | E: Orthovisc | WOMAC pain greater than 5 unit improvement | 38 | 66 | 58 | 17 | 5.9 |
| C: Saline | 28 | 69 | 41 | |||||
| Tekeoglu 1998 | 1‐4 wk | E: Orthovisc | Patient global (number of patients good/very good) | 10 | 20 | 50 | ‐10 | 10 |
| C: Betamethasone | 12 | 20 | 60 | |||||
| Tekeoglu 1998 | 5‐13 wk | E: Orthovisc | Patient global (number of patients good/very good) | 15 | 20 | 75 | 35 | 2.9 |
| C: Betamethasone | 8 | 20 | 40 | |||||
| Kalay 1997 | 5‐13 wk | E: Orthovisc + PT | Number of patients rating treatment effective/very effective | 19 | 20 | 95 | 35 | 2.9 |
| C: PT | 12 | 20 | 60 | |||||
| Guler 1996 | 5‐13 wk | E: Orthovisc | Number of patients rating treatment effective/very effective | 11 | 15 | 73 | 40 | 2.5 |
| C: Saline | 5 | 15 | 33 |
The proportion of patients achieving a 20% relative and 50 mm absolute improvement from baseline in the WOMAC OA Index pain subscale (measured on a 0 to 500 mm VAS) was the primary outcome measure for the Neustadt et al. RCT. No statistically significant difference was detected between Orthovisc and arthrocentesis either at 5 to 13 weeks postinjection (RE) or at 14 to 26 weeks postinjection. When evaluating the proportion of patients achieving a 40% relative improvement from baseline, a statistically significant difference was detected in favour of the Orthovisc group compared to arthrocentesis at 5 to 13 weeks postinjection (RR 1.30; 95% CI 1.08 to 1.57, P value 0.006); while a trend was detected at 14 to 26 weeks postinjection (RR 1.22; 95% CI 1.00 to 1.49, P value 0.05). No statistically significant diference was detected in the 50% relative improvement comparison (Neustadt 2005a ‐3inj; Neustadt 2005b‐4inj).
In Brandt's trial (Brandt 2001), results are presented only for the effectiveness population which represents approximately a 40% loss of the initially randomised population. There was a trend in favour of Orthovisc compared to saline in the number of patients who achieved a greater than five‐unit improvement in the WOMAC pain score relative to baseline score by 25 weeks postinjection (Orthovisc 58%, saline 40%) (RR 1.42; 95% CI 1.00 to 2.02, P value 0.05). The RevMan analysis (P value 0.05) disagreed with the publication analysis where a statistically significant difference was detected in favour of Orthovisc (P value 0.04). There was no statistically significant difference in the number of patients who improved in the WOMAC pain subscale score at 14 to 26 weeks postinjection: Orthovisc 92% versus saline 87%.
Physical function, as measured by the WOMAC OA Index (scored 17 to 85), improved significantly with Orthovisc compared to placebo at three of four follow‐up assessments: (WMD ‐7.20; 95% CI ‐8.84 to ‐5.56, P < 0.00001) at 1 to 4 weeks postinjection (Hizmetli 1999; Kotevoglu 2005; Sezgin 2005); (WMD ‐12.87; 95% CI ‐18.60 to ‐7.14, P < 0.0001) at 5 to 13 weeks postinjection; and (WMD ‐10.88; 95% CI ‐16.97 to ‐4.79, P value 0.0005) at 14 to 26 weeks postinjection (Hizmetli 1999; Kotevoglu 2005); but no statistically significant difference was detected at 45 to 52 weeks postinjection (Hizmetli 1999). Orthovisc was between 16 and 42% more effective than saline in improving physical function as measured by the WOMAC OA Index physical function subscale.
No statistically significant differences were detected in the WOMAC OA Index stiffness subscale (scored 2 to 10) between Orthovisc and saline at 1 to 4 weeks postinjection (Kotevoglu 2005; Sezgin 2005). Statistically significant differences were detected in favour of Orthovisc compared to saline both at 5 to 13 weeks postinjection (WMD ‐1.50; 95% CI ‐2.84 to ‐0.16, P value 0.03)(Kotevoglu 2005) and at 14 to 26 weeks postinjection (WMD ‐1.50; 95% CI ‐2.71 to ‐0.29, P value 0.02) (Kotevoglu 2005).
No statistically significant differences were detected in the total score for the WOMAC OA Index (scored 0 to 2400 mm VAS) between Orthovisc and arthrocentesis either at 5 to 13 or 14 to 26 weeks postinjection (Neustadt 2005a ‐3inj; Neustadt 2005b‐4inj. ).
A statistically significant difference in favour of Orthovisc compared to saline was detected both in patient global assessment (0‐100 mm, where 100 was worst severity) both at 1to 4 weeks postinjection (WMD ‐20.00; 95% CI, ‐33.22 to ‐6.78, P value 0.003) and at 5 to 13 weeks postinjection (WMD ‐20.00; 95% CI ‐30.63 to ‐9.37, P value 0.0002); but not at 14 to 26 weeks postinjection (Kotevoglu 2005). No statistically significant differences was detected between Orthovisc and saline in physican global assessment (0‐100 mm, where 100 was worst severity) in the Kotevoglu RCT. Similarly, no statistically significant differences were detected in either the patient or physician global assessments (measured on 0 to 100 mm VAS) between Orthovisc and arthrocentesis either at 5 to 13 or 14 to 26 weeks postinjection (Neustadt 2005a ‐3inj; Neustadt 2005b‐4inj).
Patient satisfaction with treatment was similar in the Orthovisc (73%) and saline (33%) groups (Guler 1996); (RR 2.20; 95% CI 1.01 to 4.79, P value 0.05) at 5 to 13 weeks postinjection.
Results for additional outcome measures utilised in the Sezgin RCT are as follows. Statistically significant difference were detected in favour of Orthovisc compared to saline for range of motion (measured in degrees) (WMD 4.00; 95% CI 2.02 to 5.98, P < 0.0001)(Orthovisc was 15% more effective than saline in improving flexion); volume of synovial fluid effusion (WMD ‐4.00; 95% CI ‐5.66 to ‐2.34, P < 0.00001) (Orthovisc was 24% more effective than saline); interleukin 6 level in the synovial fluid (WMD ‐11.90; 95% CI ‐14.09 to ‐9.71, P < 0.00001) (Orthovisc was 6% more effective than saline); and interleukin 8 level in the synovial fluid (WMD ‐4.80; 95% CI ‐6.54 to 3.06, P < 0.00001) (Orthovisc; Orthovisc was 42% more effective than saline) (Sezgin 2005). No statistically significant differences were detected in 25 metre walking time (measured in seconds), knee circumference (measured in mm), tumor necrosis factor alpha levels in synovial fluid (Sezgin 2005); or WOMAC OA Index stiffness subscale score (Kotevoglu 2005; Sezgin 2005).
Safety No local or systemic adverse events were observed in the Hizmetli trial (Hizmetli 1999). No complications (e.g. during or after intraarticular injection) were reported in the Guler trial (Guler 1996).
The safety data was based on the intention to treat population in the Brandt trial (Brandt 2001). There were no statistically significant differences between Orthovisc and saline or arthrocentesis in the safety profile for the following outcome measures: total withdrawals overall (Brandt 2001; Kotevoglu 2005; Neustadt 2005a ‐3inj; Neustadt 2005b‐4inj; Sezgin 2005); withdrawals due to lack of efficacy (Brandt 2001; Neustadt 2005a ‐3inj; Neustadt 2005b‐4inj; Sezgin 2005); number of patients with local skin rash (Brandt 2001; Neustadt 2005a ‐3inj; Neustadt 2005b‐4inj); number of patients with treatment related adverse events (Brandt 2001); number of patients with musculoskeletal adverse events; number of patients with respiratory adverse events; number of patients with general body adverse events; number of patients with nervous system adverse events (Brandt 2001; Neustadt 2005a ‐3inj; Neustadt 2005b‐4inj); number of patients with local reaction or number of patients withdrawn due to noncompliance (Kotevoglu 2005).
Orthovisc versus corticosteroid Efficacy In the Orthovisc/betamethasone comparison (Tekeoglu 1998), at 1 to 4 weeks postinjection, there were no statistically significant differences for: WOMAC OA Index physical function (scored 17 to 85); the number of patients good or very good; and maximum flexion. At 5 to 13 weeks postinjection, Orthovisc was significantly better than betamethasone for WOMAC function (WMD ‐9.00; 95% CI ‐14.15 to ‐3.85, P value 0.0006). Orthovisc was 20% more effective than betamethasone in improving physical function. Orthovisc was significantly better than betamethasone for patient global assessment (i.e. number of patients good/very good) (RR 1.88; 95% CI 1.04 to 3.39, P value 0.04). The NNT for patient global assessment was 3. There was no statistically significant between‐group difference for maximum flexion at 5 to 13 weeks.
In the Orthovisc/6‐methylprednisolone acetate (6‐MPA) comparison (Tascioglu 2003), there were no statistically significant differences between the two groups for any of the pain outcome measures (0 to 100 mm VAS), the Lequesne Index (0 to 24), or flexion outcome measures at 1 to 4 weeks postinjection. However, at 5 to 13 weeks postinjection, statistically significant differences were detected in all outcome measures, except flexion, in favour of the Orthovisc group: pain on weight bearing (WMD ‐15.64; 95% CI ‐24.51 to ‐6.77, P value 0.0006); pain at rest (WMD ‐7.70; 95% CI ‐13.50 to ‐1.90, P value 0.009); pain on walking (WMD ‐18.43; 95% CI ‐29.19 to ‐7.67, P value 0.0008); and the Lequesne Index (WMD ‐1.40; 95% CI ‐2.13 to ‐0.67, P value 0.0002). Orthovisc was between 25 and 32% more effective than 6‐MPA in relieving pain. Orthovisc was 18% more effective than 6‐MPA in improving function (Lequesne). At 14 to 26 weeks postinjection, statistically significant differences in all outcome measures, except pain on rest, were detected in favour of the Orthovisc group: pain on weight bearing (WMD ‐15.40; 95% CI ‐25.91 to ‐4.89, P value 0.004); pain on walking (WMD ‐14.90; 95% CI ‐25.91 to ‐3.89, P value 0.008); Lequesne Index (WMD ‐1.14; 95% CI ‐2.16 to ‐0.12, P value 0.03), and flexion (WMD 5.00; 95% CI 0.19 to 9.81, P value 0.04). Orthovisc was between 20 and 31% more effective than 6‐MPA in relieving pain and between 4 and 15% more effective than 6‐MPA in improving function.
The RevMan analysis differed from the publication analysis (Tascioglu 2003). The publication reported no statistically significant between‐group difference at six months in pain on weight bearing whereas RevMan detected a statistically significant difference (P value 0.004) in favour of Orthovisc compared to 6‐MPA. The publication reported no statistically significant between‐group difference at six months in pain on walking whereas RevMan detected a statistically significant difference (P value 0.008) in favour of Orthovisc compared to 6‐MPA. The publication reported no statistically significant between‐group difference at six months in the Lequesne Index whereas RevMan detected a statistically significant difference (P value 0.03) in favour of Orthovisc compared to 6‐MPA. The publication reported no statistically significant between‐group difference at six months in flexion whereas RevMan detected a statistically significant difference (P value 0.04) in favour of Orthovisc compared to 6‐MPA.
When assessing the combination of trimacinolone acetonide with Orthovisc to Orthovisc alone (Ozturk 2005), a statistically significant difference in favour of the combination group was found for pain (0 to 100 mm VAS) at 1 to 4 weeks postinjection (WMD 13.00; 95% CI 3.77 to 22.23, P value 0.006) (combination was 26% more effective than Orthovisc alone), but not at any of the other time‐points: 5 to 13, 14 to 26, 34, or 45 to 52 weeks postinjection. A statistically significant difference was detected in favour of the combination treatment group compared to Orthovisc alone for the WOMAC OA Index stiffness subscale (0 to 8 Likert) at 1 to 4 weeks postinjection (WMD 0.80; 95% CI 0.02 to 1.58, P value 0.04), at 34 weeks postinjection (WMD 0.80; 95% CI 0.12 to 1.48, P value 0.02), and at 45 to 52 weeks postinjection (WMD 0.80; 95% CI 0.06 to 1.54, P value 0.04) (combination was 20% more effective than Orthovisc alone), but not at 5 to 13 or 14 to 26 weeks postinjection. No statistically significant differences were noted between the groups for the following outcome measures at any of the timepoints: WOMAC OA Index pain subscale (0 to 20 Likert), WOMAC OA Index physical function subscale (0 to 68 Likert), WOMAC OA Index total score (0 to 96 Likert), 50 foot walking time (seconds), and range of motion (degrees).
Safety There were no adverse local (e.g. postinjection synovitis) or systemic reactions reported in either the Orthovisc or betamethasone group with all patients completing the trial (Tekeoglu 1998). There were no statistically significant differences in the safety profile of Orthovisc compared to 6‐MPA (Tascioglu 2003). A similar number of patients were withdrawn overall: Orthovisc 6.7% and 6‐MPA 10%. One patient in each group withdrew due to increased pain. A similar number of patients reported musculoskeletal adverse events: Orthovisc 25% and 6‐MPA 19%; skin adverse events: Orthovisc 7% and 6‐MPA 4%; gastrointestinal adverse events: Orthovisc 11% and 6‐MPA 7%; general adverse events: Orthovisc 14% and 6‐MPA 19%; and knee pain after injection: Orthovisc 21% and 6‐MPA 19%.
In the Orthovisc plus triamcinolone acetonide versus Orthovisc alone RCT, a statistically significant difference was detected in favour of Orthovisc alone for the number of total withdrawals overall (RR 0.12, 95% CI 0.02 to 0.88, P value 0.04), but not for the number of withdrawals due to lack of efficacy or in the number of patients reporting adverse events (Ozturk 2005).
Orthovisc versus NSAID: no trials included.
Orthovisc versus physiotherapy
Three RCT included comparisons of Orthovisc and physical therapy (Atamaz 2005; Bayramoglu 2003; Kalay 1997). Efficacy
There was a statistically significant difference in spontaneous pain (0 to 100 mm VAS) in favour of physical therapy compared to Orthovisc at 14 to 26 weeks postinjection (WMD 17.70; 95% CI 3.70 to 31.70, P value 0.01), but not at any of the other timepoints: 1 to 4, 5 to 13, 37, or 45 to 52 weeks postinjection (Atamaz 2005). There were statistically significant differences in WOMAC OA Index pain (Likert) in favour of Orthovisc compared to physical therapy at 1 to 4 weeks postinjection (WMD ‐2.00; 95% CI ‐3.61 to ‐0.39, P value 0.02), and at 45 to 52 weeks postinjection (WMD ‐4.30; 95% CI ‐6.66 to ‐1.94, P value 0.0004), but not at 5 to 13, 14 to 26, or 37 weeks postinjection. There were no statistically significant differences between Orthovisc and physical therapy in WOMAC OA Index physical function (Likert) at any of the timepoints: 1 to 4, 5 to 13, 14 to 26, 37, or 45 to 52 weeks postinjection. There were statistically significant differences in favour of physical therapy compared to Orthovisc for SF‐36 pain at two of the five timepoints: 5 to 13 weeks postinjection (WMD ‐28.20; 95% CI ‐38.98 to ‐17.42, P < 0.00001), and 14 to 26 weeks postinjection (WMD ‐18.70; 95% CI ‐31.67 to ‐5.73, P value 0.005); while a trend was detected at 45 to 52 weeks postinjection (WMD ‐12.50; 95% CI ‐25.03 to 0.03, P value 0.05), but not at 1 to 4 or 37 weeks postinjection. Statistically significant differences in favour of physical therapy compared to Orthovisc were detected in SF‐36 physical functioning at 5 to 13 weeks postinjection (WMD ‐12.00; 95% CI ‐23.25 to ‐0.75, P value 0.04), and at 45 to 52 weeks postinjection (WMD ‐22.00; 95% CI ‐33.76 to ‐10.24, P value 0.0002), but not at the other timepoints: 1 to 4, 14 to 26, or 37 weeks postinjection. In the Orthovisc plus physiotherapy versus physiotherapy comparison (Kalay 1997), there were no statistically significant differences at 1 to 4 weeks postinjection for: activity pain (VAS); spontaneous pain (VAS); night pain (VAS); 25 m walk time (sec); and flexion WMD was not estimable as the SD of the treatment group was zero. At 5 to 13 weeks postinjection, the combination of Orthovisc and physiotherapy was significantly better than physiotherapy alone for activity pain (WMD ‐6.50; 95% CI ‐11.93 to ‐1.07, P value 0.02) and spontaneous pain (WMD ‐4.10; 95% CI ‐7.43 to ‐0.77, P value 0.02). Orthovisc plus physiotherapy was between 16 and 44% more effective than physiotherapy alone in relieving pain. No statistically significant differences were found for night pain; walk time; and flexion WMD was not estimable again due to the SD of the treatment group being zero. The number of patients rating the treatment as effective or very effective was significantly higher in the Orthovisc plus physiotherapy arm (95%) compared to the physiotherapy group (60%) (RR 1.58; 95% CI 1.09 to 2.30, P value 0.02). The NNT for patient global assessment was 3.
The RevMan analysis differed from the publication analysis. The publication reported a statistically significant difference in activity pain at day 21 (1 to 4 weeks postinjection) in favour of Orthovisc plus physiotherapy compared to physiotherapy alone (P value 0.03) whereas RevMan detected no difference (P value 0.5). The publication reported a statistically significant difference in night pain at day 56 (5 to 13 weeks postinjection) in favour of Orthovisc plus physiotherapy compared to physiotherapy alone (P value 0.02) whereas RevMan detected no difference (P value 0.7). The publication reported a statistically significant difference in walk time both at day 21 (P value 0.0049) and day 56 (P value 0.0001) in favour of Orthovisc plus physiotherapy compared to physiotherapy alone whereas RevMan detected no difference (P value 0.4 and 0.2).
In the Orthovisc plus physical therapy versus physical therapy comparison (Bayramoglu 2003), there were no statistically significant differences in the Lequesne Index at the end of treatment at three weeks or at three months. Safety With respect to safety, two patients in the Orthovisc plus physiotherapy group (Kalay 1997) experienced local pain and swelling several hours after the IA injections which resolved in 24 hours with cold application; however, this difference was not statistically significant. In this trial the treatment schedule differed from the other four trials, in that only two injections were given on days 0 and 7. There were no adverse events associated with the IA hyaluronic acid injections in the second trial (Bayramoglu 2003). There was no statistically detectable difference in the number of withdrawals overall. No patients in either trial withdrew because of adverse events or experienced any systemic adverse events.
In the Atamaz et al. RCT, while three patients in the Orthovisc group reported local reactions which resolved within a few days, no serious local or systemic adverse events were observed (Atamaz 2005).
Orthovisc plus trigger point injection with lidocaine versus Orthovisc
Efficacy
In the one trial included (Yentur 2003), there were statistically significant differences in favour of Orthovisc plus lidocaine versus Orthovisc alone at one week postinjection for the following outcome measures: pain at rest (WMD ‐1.73; 95% CI, ‐2.21 to ‐1.25, P < 0.00001); pain/restrictions walking (WMD ‐1.12; 95% CI, ‐1.60 to ‐0.64, P < 0.00001), and pain/restrictions going up or down stairs (WMD ‐1.49; 95% CI, ‐1.97 to ‐1.01, P < 0.00001). There was no statistically significant difference in range of motion.
Safety
Only one patient in the Orthovisc alone group did not complete the trial (Yentur 2003).
Efficacy
In the Neustadt et al. trial, which compared Orthovisc given as a four‐injection regimen to Orthovisc given as a three‐injection regimen plus one arthrocentesis, statistically significant differences in favour of the four‐injection regimen were detected in the number of patients achieving a 20% relative improvement from baseline in the WOMAC OA Index pain score at 5 to 13 weeks postinjection (RR 1.26; 95% CI 1.07 to 1.49, P value 0.005), and in the patient global assessment (measured on a 0 to 100 mm VAS) (WMD ‐8.80; 95% CI ‐16.61 to ‐0.99, P value 0.03)(Neustadt 2005a ‐3inj; Neustadt 2005b‐4inj. No statistically significant differences were detected for any of the other outcome measures: WOMAC OA Index pain on standing item, WOMAC OA Index total score, physician global assessment, or number of patients achieving a 40% or 50% relative improvement from baseline in the WOMAC OA Index pain score.
Safety There were no statistically significant differences in the number of total withdrawals overall; number of withdrawals due to lack of efficacy; number of patients reporting adverse events; number of patients with gastrointestinal adverse events; number of patients with general body adverse events; number of patients with infections; number of patients with musculoskeletal adverse events; number of patients with nervous system adverse events; number of patients with respiratory adverse events; or number of patients with skin adverse events (Neustadt 2005a ‐3inj; Neustadt 2005b‐4inj .
Orthovisc versus other hyaluronans Efficacy
In the Atamaz et al. trial (Atamaz 2005), a statistically significant difference in favour of Orthovisc compared to Hylan G‐F 20 were detected for spontaneous pain (0 to 100 mm VAS) at 1 to 4 weeks postinjection (WMD ‐21.10; 95% CI ‐33.08 to ‐9.12, P value 0.0006) (Orthovisc was 8% more effective than Hylan G‐F 20). However, a statistically significant difference in favour of Hylan G‐F 20 compared to Orthovisc was detected both at 5 to 13 weeks postinjection (WMD 12.90; 95% CI 0.85 to 24.95, P value 0.04) and at 14 to 26 weeks postinjection (WMD 15.50; 95% CI 0.80 to 30.20, P value 0.04) (Hylan G‐F 20 was 33 to 36% more effective than Orthovisc, respectively). No statistically significant differences were detected at 37 weeks or 45 to 52 weeks postinjection.
In one trial included (Bayramoglu 2003), there were no statistically significant differences between Orthovisc plus a physical therapy programme versus Hylan G‐F 20 plus a physical therapy programme in the Lequesne Index either at the end of the treatment schedule or at three months.
There were no statistically significant differences between Orthovisc and Hylan G‐F 20 in the WOMAC OA Index pain or physical function subscales at 1 to 4 weeks postinjection (Atamaz 2005; Karatay 2004;Kotevoglu 2005); at 5 to 13 or 14 to 26 weeks postinjection (Atamaz 2005; Kotevoglu 2005); and at 37 or 45 to 52 weeks postinjection (Atamaz 2005). There was no statistically significant difference detected in the WOMAC OA Index stiffness subscale (Likert scale) either at 1 to 4 weeks postinjection (Karatay 2004; Kotevoglu 2005); 5 to 13 or 14 to 26 weeks postinjection (Kotevoglu 2005).
There was no statistically significant difference in the patient global assessment (100 mm VAS, where 100 was the worst severity) at 1 to 4, 5 to 13, or 14 to 26 weeks postinjection (Kotevoglu 2005). However, in the physician global assessment (100 mm VAS, where 100 was the worst severity), there were statistically significant differences in favour of Hylan G‐F 20 both at 1 to 4 weeks postinjection (WMD 20.00; 95% CI 7.27 to 32.73, P value 0.002) and at 5 to 13 weeks postinjection (WMD 20.00; 95% CI 8.06 to 31.94, p=0.001), but not at 14 to 26 weeks postinjection (Kotevoglu 2005).
In the Karatay et al. trial, there were no statistically significant differences between Orthovisc and Hylan G‐F 20 at one week postinjection for synovial fluid intercellular adhesion molecule‐1 or synovial fluid vascular cell adhesion molecule‐1 (Karatay 2004).
With respect to the SF‐36, statistically significant differences were detected in favour of Hylan G‐F 20 compared to Orthovisc in SF‐36 pain both at 5 to 13 weeks postinjection (WMD ‐30.80; 95% CI ‐43.03 to ‐18.57, P < 0.00001) and at 14 to 26 weeks postinjection (WMD ‐19.80; 95% CI ‐35.52 to ‐4.08, P value 0.01) but not at 1 to 4, 37, or 45 to 52 weeks postinjection (Atamaz 2005). For SF‐36 physical functioning, statistically significant differences were detected in favour of Hylan G‐F 20 compared to Orthovisc both at 5 to 13 weeks postinjection (WMD ‐20.20; 95% CI ‐29.47 to ‐10.93, P < 0.0001) and at 45 to 52 weeks postinjection (WMD ‐23.00; 95% CI ‐35.97 to ‐10.03, P value 0.0005) (Atamaz 2005).
In the Karatosun et al. trial (Karatosun 2005a), there were no statistically significant differences between Orthovisc and Hylan G‐F 20 in any of the efficacy outcome measures reported at 1 to 4, 5 to 13, 14 to 26, or 45 to 52 weeks postinjection: Hospital for Special Surgery Knee Score (HSSKS), pain during activity (part of the HSSKS); pain at rest (part of the HSSKS); pain during transfer activity (part of the HSSKS); walking distance; or range of motion.
Safety There were no adverse events associated with either of the IA hyaluronic acid injections (Bayramoglu 2003). No safety outcome measures were reported in the Karatay et al. trial (Karatay 2004). There were no statistically significant differences in the number of total withdrawals overall (Karatosun 2005a; Kotevoglu 2005); number of withdrawals due to lack of efficacy (Karatosun 2005a); number of patients wih local adverse events (Atamaz 2005; Kotevoglu 2005); number of withdrawals due to noncompliance (Kotevoglu 2005).
Product ‐ Ostenil Description of studies One RCT was excluded: Uebelhart 2003. Product ‐ Replasyn Description of studies One RCT has been reported.
Cohen et al. reported an eight‐week, placebo‐controlled, double‐blind RCT performed at four centres in Canada and the United States comparing three weekly injections of Replasyn to placebo (not specified) in 39 patients with OA of the knee (Cohen 1994). A significant within group difference was found for pain on walking by week 8 in the Replasyn group. However, no between‐group differences were found in pain on walking, range of motion, the WOMAC functional index, or patient and physician global assessments. Transient joint pain or swelling was reported in 3 of 19 Replasyn and 6 of 20 placebo patients.
An abstract is the only publication of this trial.
Replasyn versus placebo Efficacy Since no measure of dispersion was reported in the abstract (Cohen 1994) this review does not report efficacy data. Safety There was no statistically significant difference in the number of patients with local adverse reactions: Replasyn 16% versus placebo 30%.
Replasyn versus corticosteroid: no trials included.
Replasyn versus NSAID: no trials included.
Replasyn versus other hyaluronan: no trials included. Product ‐ SLM‐10 Description of studies One RCT has been included.
Kawabata et al. reported a five‐week, parallel‐group, single‐blind RCT performed at 23 centres in Japan comparing five weekly injections of SLM‐10 (developed and produced by fermentation with Streptococcus zooepidemicus of Lancefield's group C, Shiseido Co., Ltd.) to five‐weekly injections of Artz in 172 patients with OA of the knee (Kawabata 1993). No statistically significant between‐group differences were reported for patients' impression, final global improvement and utility, leading the authors to conclude that SLM‐10 was as useful as Artz. Adverse events were reported in one SLM‐10 patient and two Artz patients. The Jadad score for this trial was 2 out of 5; single‐blind and no specific details regarding randomisation were reported. Allocation concealment was adequate.
This comparative HA trial was of short duration with the longest assessment only one week postinjection. In addition, it was single‐blind because of differences in the HA; SLM‐10 was provided in a syringe while Artz was provided in an ampoule. The 23 trial sites were all Departments of Orthopedic Surgery. Almost all of the clinical evaluations were based on attending physician or committee ratings rather than on patient ratings. The case study committee, as well as the attending physician, assessed overall severity, final global improvement, overall safety and usefulness. Differences in results were noted in assessments made by the attending physician compared to those made by the committee. In the analysis method section of the publication, it reports that "cases which deviated from the protocol or those judged to be inappropriate as the subjects of assessment were excluded from the analysis of corresponding assessment item". However, no definition of appropriateness was reported.
Five trials were excluded (Minami 1993; Ono 1993; Ono 1993a; Suzu 1993; Taneda 1993).
SLM‐10 versus placebo: no trials included.
SLM‐10 versus corticosteroid: no trials included.
SLM‐10 versus NSAID: no trials included.
SLM‐10 versus other hyaluronan Efficacy Table 48 Regarding the SLM‐10 comparison against Artz (Kawabata 1993), significantly more patients improved on pain on pressure in the Artz group (82%) compared to the SLM‐10 group (64%) (RR 0.78; 95% CI 0.64 to 0.96, P value 0.02). The NNT for pain on pressure was 2. No statistically significant between‐group differences were found for pain in movement, pain when resting, and patient global assessment. Safety There was no statistically significant difference in the total number of withdrawals overall in the Artz group (12%) compared to SLM‐10 group (3%). The incidence of local adverse events related to study drug, resulting in withdrawal, was similar in the Artz (3%) and the SLM‐10 (1%) groups. One patient in each group had a local adverse event with no specific causal relationship to the study drug and continued in the trial. Product ‐ Suplasyn Description of studies One RCT has been included.
48. Clinical benefit table: SLM‐10 versus Artz. Dichotomous outcome measures.
| Study | Time | Treatment | Outcome | No. improved | No. of pts | Risk (%) | Risk difference | NNT |
| Kawabata 1993 | 1‐4 wk | E: SLM‐10 | Pain in movement (number of patients improved) | 59 | 82 | 72 | ‐9 | 11.1 |
| C: Artz | 60 | 74 | 81 | |||||
| Kawabata 1993 | 1‐4 wk | E: SLM‐10 | Pain when resting (number of patietns improved) | 33 | 93 | 85 | 5 | 20 |
| C: Artz | 33 | 41 | 80 | |||||
| Kawabata 1993 | 1‐4 wk | E: SLM‐10 | Pressure pain (number of patients improved) | 48 | 75 | 64 | ‐18 | 5.6 |
| C: Artz | 54 | 66 | 82 | |||||
| Kawabata 1993 | 1‐4 wk | E: SLM‐10 | Number of patients better/much better | 56 | 82 | 68 | ‐4 | 25 |
| C: Artz | 53 | 74 | 72 |
Petrella et al. reported a 12‐week, placebo‐controlled, double‐blind RCT performed at a single centre in Canada comparing Suplasyn (a bacterial source HA) plus placebo (lactose), placebo (lactose plus saline), NSAID (Arthrotec plus saline), and Suplasyn plus NSAID in 120 patients with OA of the knee (Petrella 2002). The authors reported that Suplasyn was superior to placebo alone or NSAIDs alone for pain with physical activity and functional performance. Suplasyn was as effective as NSAID for resting pain relief. With respect to safety, Petrella reported that two patients had moderate gastrointestinal irritation resulting in their withdrawal, and that most adverse events occurred in the NSAID plus saline group. No serious adverse events occurred.
The efficacy outcome measures extracted from this trial were pain after walking (0 to 100 mm VAS), WOMAC pain (0 to 10 cm) and WOMAC function (0 to 10 cm), pain at rest (0 to 100 mm VAS), and walk time (seconds). Of the four groups, three comparisons are reported: (Suplasyn plus lactose) versus (saline plus lactose), (Suplasyn plus lactose) versus (NSAID plus saline), and (Suplasyn plus NSAID) versus (NSAID plus saline); not reporting the combination of (NSAID plus saline) versus placebo (lactose plus saline). With respect to methodological quality, it scored 5 out of 5 on the Jadad scale achieving bonus points for providing details of appropriate randomisation and blinding. Allocation concealment was adequate. An editorial reported the results obtained from this trial using a factorial design analysis (Felson 2002). Two trials were excluded (Olszynski 2002; Payne 2000).
Some design points were noted: 1) a medial approach was utilised for injections; 2) rescue medication with 2600 mg (650 g x 4) of acetaminophen was permitted; 3) a 10‐minute home‐based resistance exercise programme was part of the treatment and was monitored by a patient diary; 4) patients were recruited from a primary care referral centre; 5) no details were published regarding the presence or absence of effusion, disease duration, and OA diagnosis criteria. The only significant results reported were based on within‐group comparisons. No information on rescue medication usage was reported.
A randomised, double‐blind trial comparing three and six injections of Suplasyn is awaiting assessment (Petrella 2002). This trial has only been published as an abstract with no extractable data and at the closure of the database for this review no full length manuscript had been published. Three trials were excluded (Mazieres 2004; Petrella 2003a; Petrella 2003b).
Suplasyn versus placebo Efficacy Table 49 No statistically significant differences were found between Suplasyn and placebo for the following outcome measures: pain after walking; WOMAC OA Index pain; WOMAC OA Index physical function; and walk time. A statistically significant difference, in favour of the placebo group (saline + lactose) compared to the treatment group (Suplasyn + lactose), was found for the primary outcome measure, pain at rest (WMD 0.83; 95% CI 0.03 to 1.63, P value 0.04). Suplasyn plus lactose was 25% less effective than saline plus lactose in relieving pain at rest.
49. Clinical benefit table: Suplasyn. Continuous outcome measures.
| Study | Time | Treatment | Outcome (scale) | N of Pts | Baseline Mean | End of Study Mean | Absolute Benefit | Relative Difference |
| Petrella 2002 | 1‐4 wk | E: Suplasyn+lactose | WOMAC pain (0‐10 cm) | 30 | 3.32 | 2.42 | ‐0.47 (I) | ‐13% (I) |
| C: Saline+lactose | 30 | 3.62 | 3.19 | |||||
| C: Saline+NSAID | 30 | 4.22 | 2.86 | 0.46 (W) | 11% (W) | |||
| C: Suplasyn+NSAID | 30 | 3.65 | 2.59 | 0.16 (W) | 4% (W) | |||
| Petrella 2002 | 1‐4 wk | E: Suplasyn+lactose | WOMAC function (0‐10 cm) | 30 | 4.10 | 2.45 | ‐0.66 (I) | ‐14% (I) |
| C: Saline+lactose | 30 | 4.72 | 3.73 | |||||
| C: Saline+NSAID | 30 | 4.32 | 2.76 | ‐0.09 (I) | ‐2% (I) | |||
| C: Suplasyn+NSAID | 30 | 3.90 | 2.73 | ‐0.48 (I) | ‐12% (I) | |||
| Petrella 2002 | 1‐4 wk | E: Suplasyn+lactose | WOMAC stiffness (0‐10 cm) | 30 | 4.60 | 2.95 | ‐1.53 (I) | ‐30% (I) |
| C: Saline+lactose | 30 | 5.12 | 5.00 | |||||
| C: Saline+NSAID | 30 | 5.14 | 2.80 | 0.69 (W) | 13% (W) | |||
| C: Suplasyn+NSAID | 30 | 4.82 | 2.71 | 0.46 (W) | 10% (W) | |||
| Petrella 2002 | 1‐4 wk | E: Suplasyn+lactose | Rest pain (0‐10 cm) | 30 | 3.29 | 2.60 | 0.84 (W) | 25% (W) |
| C: Saline+lactose | 30 | 3.30 | 1.77 | |||||
| C: Saline + NSAID | 30 | 3.34 | 1.58 | 1.07 (W) | 32% (W) | |||
| C: Suplasyn+NSAID | 30 | 3.60 | 1.56 | 1.35 (W) | 38% (W) | |||
| Petrella 2002 | 1‐4 wk | E: Suplasyn+lactose | Self‐paced walk pain (0‐10 cm) | 30 | 3.94 | 2.89 | ‐1.08 (I) | ‐31% (I) |
| C: Saline+lactose | 30 | 3.53 | 3.56 | |||||
| C: Saline+NSAID | 30 | 3.78 | 1.81 | 0.92 (W) | 24% (W) | |||
| C: Suplasyn+NSAID | 30 | 3.84 | 2.05 | 0.74 (W) | 19% (W) | |||
| Petrella 2002 | 1‐4 wk | E: Suplasyn+lactose | Walk time (sec) | 30 | 77.23 | 74.21 | ‐3.53 (I) | ‐5% (I) |
| C: Saline+lactose | 30 | 70.56 | 71.07 | |||||
| C: Saline+NSAID | 30 | 77.64 | 75.70 | ‐1.08 (I) | ‐1% (I) | |||
| C: Suplasyn+NSAID | 30 | 78.81 | 72.22 | 3.57 (W) | 5% (W) |
The RevMan analysis differed from the publication analysis. The publication reported that Suplasyn may be superior to placebo for pain with physical activity and functional performance whereas the RevMan analysis detected no difference. Safety
There was no statistically significant difference in the number of withdrawals overall: Suplasyn 17% versus placebo 7%. Suplasyn versus corticosteroid: no trials included.
Suplasyn versus NSAID Efficacy No statistically significant differences were found between Suplasyn and NSAID for: WOMAC OA Index pain; WOMAC OA Index physical function; walk time; pain at rest; and pain after walking.
The RevMan analysis differed from the publication analysis. The publication reported that Suplasyn may be superior to NSAID alone for pain relief, pain with physical activity, and functional performance whereas the RevMan analysis detected no difference. Safety There was no statistically significant difference in the number of withdrawals overall: Suplasyn 17% versus NSAID 3%.
Suplasyn + NSAID versus NSAID alone Efficacy No statistically significant differences were found between Suplasyn plus NSAID versus NSAID alone for pain after walking; WOMAC OA Index pain; WOMAC OA Index physical function; pain at rest; and walk time. Safety There was no statistically significant difference in the number of withdrawals overall: Suplasyn plus NSAID 13% versus NSAID alone 3%. Suplasyn versus other hyaluronan: no trials included. Product ‐ Synject Description of studies
One trial was excluded: Alonge 2004. Product ‐ Zeel compositum Description of studies
One RCT included was a comparison of Zeel compositum and Hyalart (Nahler 1996 [article published in German with English abstract]; Nahler 1998). With respect to methodological quality, the Jadad score was 4 out of 5. Allocation concealment was unclear.
Nahler et al. reported a five‐week, parallel‐group, single‐blind RCT performed at twelve centres in Germany and Austria comparing 10 injections (two injections a week for five weeks) of Zeel compositum to five weekly injections of Hyalart in 121 patients with OA of the knee (Nahler 1998). Both treatments were equally effective in treating patients. Undesirable side effects were reported by 11% of Zeel patients and 23% of Hyalart patients; the most frequent being local inflammation or irritation following the injection. One patient withdrew from the study early due to suspected allergic reaction after injection with Hyalart. For this trial, Zeel was the treatment group and Hyalart was the control group.
This is the only RCT in the review comparing homeopathy drug therapy to HA. It was designed as a clinical equivalence study. The follow‐up assessment was short, one week following the treatment. As the authors noted, the design was single‐blind due to the imbalance in number of injections (Hyalart n = 5 versus Zeel n = 10). It was deemed 'unethical' to equalise the frequency of injections with additional injections of a placebo.
Zeel versus placebo: no trials included.
Zeel versus corticosteroid: no trials included.
Zeel versus NSAID: no trials included.
Zeel versus other hyaluronans Efficacy Table 50 At the end of treatment (i.e. last injection), there were no statistically significant between‐group differences in any of the efficacy outcome measures: pain during movement, pain during the night, assessment of improvement, and assessment of tolerance all scored on a 0 to 100 mm VAS. There was no statistically significant difference in the number of patients who reported noticeable improvement in symptoms: Zeel 87% versus Hyalart 93%. Safety There was no statistically significant difference in the number of patients with side effects: Zeel 11% versus Hyalart 23%; or in the number of patients withdrawn due to lack of efficacy: Zeel 4% versus Hyalart 2%.
50. Clinical benefit table: Zeel versus Hyalgan. Continuous outcome measures.
| Study | Time | Treatment | Outcome (scale) | N of Pts | Baseline Mean | End of Study Mean | Absolute Benefit | Relative Difference |
| Nahler 1998 | 1‐4 wk | T: Zeel | Pain during movement (0‐100 mm VAS) | 57 | 67 | 31 | 1 (W) | 1.6% (W) |
| C: Hyalgan | 57 | 63 | 26 | |||||
| Nahler 1998 | 1‐4 wk | T: Zeel | Pain at night (0‐100 mm VAS) | 57 | 33 | 9 | 4 (W) | 11.4% (W) |
| C: Hyalgan | 57 | 35 | 7 |
Product ‐ Hyaluronan (brand name not identified)
Description of studies
One RCT included was a comparison of hyaluronan and different dosages of celecoxib (Wu 2004). The article was published in Chinese with an abstract in English. Dr. H. Qian of The University of Western Ontario, London, Canada, kindly provided an English translation of the article.
Wu et al. reported a 16‐week, parallel‐group, single‐blind RCT performed in China comparing hyaluronan to: 1) hyaluronan plus low dose celecoxib, 2) hyaluronan plus self‐controlled dose celecoxib, 3) regular dose celecoxib, and 4) self‐controlled celecoxib in 150 patients with OA of the knee (Wu 2004). Outcome measures included WOMAC Osteoarthritis Index physical function subscale, degree of satisfaction at the end of treatment, and totally used dosage of celecoxib. The authors reported that the clinical symptoms improved by the fourth week in the hyaluronan group, at the second week in the hyaluronan plus low dosage celecoxib, and at the first week in the other three groups. In addition, the improvement was maintained until the end of the treatment in all five groups. They concluded that hyaluronan plus self‐controlled celecoxib can improve the clinical symptoms of OA and also significantly decrease the amount of required celecoxib to maintain good therapeutic effects. With respect to safety, all patients completed the trial except seven patients in the hyaluronan group that discontinued early because of inefficacy. In addition, no treatment was discontinued due to severe side effects in any of the five groups. The trial scored 2 out of 5 on the Jadad scale; details regarding method of randomisation were not reported and the trial was single‐blind. Details regarding allocation concealment were not reported.
The results of the WOMAC OA Index physical function subscale were presented as means in Figure 2 with no measure of dispersion reported. Consequently, we were not able to include this outcome measure in our analyses.
Efficacy A statistically significant difference in favour of regular dose celecoxib compared to hyaluronan was detected in patient general satisfaction with treatment (RR 0.62; 95% CI 0.46 to 0.84, P value 0.002) (Wu 2004). No statistically significant differences were detected for any of the other comparisons: regular dose celecoxib versus hyaluronan plus low dose celecoxib or regular dose celecoxib versus hyaluronan plus voluntary dose of celecoxib.
Safety
When comparing hyaluronan to regular dose celecoxib, no statisticaly significant difference was detected in the number of withdrawals due to inefficacy (Wu 2004).
By‐class (pooled) analysis
Table 51; Table 52; Table 53; Table 54
51. Trials that utilised repeat courses of treatment.
| Study ID | Product |
| Jubb 2003 | Hyalgan |
| Karras 2001 | Hyalgan |
| Listrat 1997 | Hyalgan |
| St. J. Dixon 1988 | Hyalgan |
| Groppa 2001 | Hylan G‐F 20 (Synvisc) |
| Leopold 2003 | Hylan G‐F 20 (Synvisc) |
| Raynauld 2002 | Hylan G‐F 20 (Synvisc) |
| Pham 2004 | NRD‐101 (Suvenyl) |
| Hizmetli 1999 | Orthovisc |
| Ozturk 2005 | Orthovisc |
| Atamaz 2006 | Hylan G‐F 20 and Orthovisc |
52. Effect size based on Standardised Mean Difference ‐ Part I.
| Product | Comparison | Outcome | 1‐4 wk | 5‐13 wk | 14‐26 wk | 45‐52 wk |
| Artz, Artzal | Placebo | Pain (VAS) | 0.02 (‐0.16,0.20) P value 0.8 | ‐0.19 (‐0.37,‐0.01) P value 0.04 | 0.00 (‐0.24,0.23) P value 1 | |
| Pain (0‐3) | ‐0.14 (‐0.54,0.26) P value 0.5 | |||||
| WOMAC pain (Likert) | ‐0.24 (‐0.50,0.02) P value 0.07 | |||||
| WOMAC function (Likert) | ‐0.22 (‐0.49,0.04) P value 0.10 | |||||
| WOMAC stiffness (Likert) | ‐0.24 (‐0.51,0.02) P value 0.07 | |||||
| Lequesne Index (0‐24) | 0.06 (‐0.23,0.34) P value 0.7 | ‐0.11 (‐0.39,0.17) P value 0.5 | 0.11 (‐0.09,0.31) P value 0.3 | |||
| Range of motion (degrees) | 0.22 (‐0.18,0.61) P value 0.3 | |||||
| Hylan G‐F 20 | Pain weight bearing (VAS) | ‐0.04 (‐0.34,0.26) P value 0.8 | 0.03 (‐0.26,0.33) P value 0.8 | 0.15 (‐0.15,0.44) P value 0.3 | ||
| Lequesne Index (0‐24) | 0.21 (‐0.08,0.50) P value 0.16 | |||||
| BioHy (Arthrease) | Hylan G‐F 20 | WOMAC pain (VAS) | ‐0.18 (‐0.40,0.04) P value 0.10 | ‐0.19 (‐0.41,0.03) P value 0.08 | ||
| Fermathron | Hyalart | Pain (VAS) | 0.11 (‐0.14,0.37) P value 0.4 | 0.04 (‐0.22,0.30) P value 0.8 | ||
| Lequesne Index (0‐24) | 0.11 (‐0.14,0.37) P value 0.4 | 0.14 (‐0.12,0.39) P value 0.3 | ||||
| Hyalgan | Placebo | Pain weight bearing (VAS) | ‐0.32 (‐0.58,‐0.05) P value 0.02 | ‐0.41 (‐0.66,‐0.16) P value 0.001 | ‐0.22 (‐0.43,‐0.02) P value 0.03 | ‐0.07 (‐0.24,0.10) P value 0.4 |
| Pain spontaneous (VAS) | ‐1.14 (‐1.64,‐0.64) P value 0.00001 | ‐1.07 (‐1.56,‐0.57) P value 0.00003 | ||||
| Pain at rest (VAS) | ‐0.49 (‐0.88,‐0.10) P value 0.01 | ‐0.72 (‐1.06,‐0.38) P value 0.00004 | 0.07 (‐0.29,0.43) P value 0.7 | |||
| Pain at night (VAS) | ‐0.69 (‐1.88,0.50) P value 0.3 | |||||
| WOMAC pain (VAS) | ‐0.18 (‐0.47,0.10) P value 0.2 | ‐0.10 (‐0.40,0.19) P value 0.5 | ‐0.38 (‐0.68,‐0.08) P value 0.01 | |||
| WOMAC function (VAS) | ‐0.09 (=0.37,0.20) P value 0.5 | ‐0.07 (‐0.37,0.22) P value 0.6 | ‐0.28 (‐0.57,0.02) P value 0.07 | |||
| Lequesne Index (0‐24) | ‐0.39 (‐0.63,‐0.16) P value 0.0010 | ‐0.60 (‐0.89,‐0.31) P value 0.00006 | ‐0.30 (‐0.74,0.14) P value 0.18 | ‐0.28 (‐0.69,0.13) P value 0.18 | ||
| Flexion (degrees) | 0.30 (‐0.37,0.97) P value 0.4 | 0.70 (0.01,1.39) P value 0.05 | ||||
| Synovial fluid volume (ml) | ‐0.07 (‐0.39,0.24) P value 0.6 | ‐0.51 (‐1.02,‐0.01) P value 0.04 | ||||
| Joint space width (total population) | 0.26 (0.02,0.49) P value 0.04 | |||||
| Joint space width (subgroups) | 0.12 (‐0.28,0.52) P value 0.6 | |||||
| Arthroscopy | Pain (VAS) | 0.42 (‐0.31,1.15) P value 0.3 | 0.00 (‐0.70,0.70) P value 1 | ‐0.25 (‐1.00,0.49) P value 0.5 | 0.00 (‐0.79,0.79) P value 1 | |
| Knee Society Function Scale | 0.53 (‐0.21,1.26) P value 0.16 | 0.49 (‐0.23,1.21) P value 0.18 | 0.77 (0.00,1.54) P value 0.05 | 0.72 (‐0.10,1.54) P value 0.08 | ||
| Lequesne Index (0‐24) | 0.53 (‐0.21,1.26) P value 0.16 | 0.49 (‐0.23,1.21) P value 0.18 | 0.77 (0.00,1.54) P value 0.05 | 0.72 (‐0.10,1.54) P value 0.08 | ||
| NSAID | Pain after 50 foot walk (VAS) | 0.00 (‐0.23,0.23) P value 1 | 0.08 (‐0.17,0.33) P value 0.5 | ‐0.13 (‐0.40,0.14) P value 0.3 | ||
| Methylprednisolone acetate | Spontaneous pain intensity (VAS) | ‐0.27 (‐0.58,0.03) P value 0.08 | ‐0.41 (‐0.90,0.08) P value 0.10 | 0.10 (‐0.60,0.79) P value 0.8 | ||
| Range of motion (degrees) | 0.39 (0.05,0.74) P value 0.03 | 0.40 (0.05,0.75) P value 0.02 | 0.07 (‐0.62,0.77) P value 0.8 | |||
| Triamcinolone hexacetonide | Pain on nominated activity (VAS) | ‐0.01 (‐0.53,0.52) P value 1 (end of treatment) | ‐0.39 (‐1.29,0.52) P value 0.4 | |||
| Pain at rest (VAS) | ‐0.02 (‐0.54,0.50) P value 0.9 (end of treatment) | ‐0.76 (‐1.69,0.18) P value 0.11 | ||||
| Pain at night (VAS) | ‐0.21 (‐0.74,0.31) P value 0.4 (end of treatment) | ‐1.11 (‐2.09,‐0.14) P value 0.03 | ||||
| Mucopolysaccharide polysulfuric acid ester | Pain (0‐30) | 0.66 (0.14,1.19) P value 0.01 (end of treatment) | ||||
| Function (0‐30) | 0.11 (‐0.40,0.63) P value 0.7 (end of treatment) | |||||
| Range of motion (0‐10) | 0.39 (‐0.13,0.91) P value 0.14 (end of treatment) | |||||
| Total Larson rating score (0‐77) | 0.63 (0.10,1.16) P value 0.02 (end of treatment) | |||||
| Appropriate care | Pain overall (VAS) | ‐0.53 (‐1.20,0.14) P value 0.12 | ||||
| Lequesne Index (0‐24) | ‐0.20 (‐0.85,0.46) P value 0.6 | |||||
| Joint space width (mm) | 0.63 (‐0.04,1.30) P value 0.07 | |||||
| Quality of life: AIMS | ‐0.16 (‐0.82,0.49) P value 0.6 | |||||
| Arthroscopy overall score (VAS) | ‐0.79 (‐1.47,‐0.10) P value 0.02 | |||||
| SFA score (VAS) | ‐0.90 (‐1.59,‐0.21) P value 0.01 | |||||
| Hylan G‐F 20 | Placebo | Pain weight bearing (VAS) | ‐0.51 (‐0.87,‐0.15) P value 0.006 | ‐0.94 (‐1.57,‐0.31) P value 0.003 | ‐0.77 (‐1.38,‐0.15) P value 0.01 | |
| Pain at night (VAS) | ‐0.30 (‐0.50,‐0.09) P value 0.005 | ‐0.52 (‐1.00,‐0.05) P value 0.03 | ‐0.82 (‐1.12,‐0.51) p<0.00001 | |||
| WOMAC pain (VAS) | ‐0.31 (‐0.68,0.07) P value 0.11 | |||||
| Pain at rest (VAS) | ‐0.14 (‐0.55,0.26) P value 0.5 | |||||
| Pain overall (VAS) | ‐0.07 (‐0.48,0.33) P value 0.7 | |||||
| Lequesne Index (0‐24) | 0.02 (‐0.30,0.34) P value 0.9 | |||||
| WOMAC function (VAS) | ‐0.43 (‐0.81,‐0.05) P value 0.03 | |||||
| Function: improvement (VAS) | 0.63 (0.39,0.88) p<0.00001 | 1.29 (0.97,1.60) p<0.00001 | ||||
| Patient global: treatment efficacy (VAS) | 0.72 (0.47,0.96) p<0.00001 | 1.19 (0.66,1.71) P value 0.00001 | ||||
| NSAID | Pain on motion (VAS) | ‐0.27 (‐0.80,0.25) P value 0.3 | ‐0.49 (‐1.02,0.03) P value 0.07 | |||
| Pain at rest (VAS) | ‐0.14 (‐0.66,0.39) P value 0.6 | ‐0.15 (‐0.67,0.36) P value 0.6 | ||||
| Pain at night (VAS) | ‐0.29 (‐0.82,0.23) P value 0.3 | ‐0.12 (‐0.64,0.39) P value 0.6 | ||||
| Pain overall (VAS) | ‐0.18 (‐0.71,0.34) P value 0.5 | ‐0.23 (‐0.75,0.29) P value 0.4 | ||||
| WOMAC pain (VAS) | ‐0.41 (‐0.79,‐0.02) P value 0.04 | |||||
| WOMAC function (VAS) | ‐0.21 (‐0.59,0.16) P value 0.3 | |||||
| Lequesne Index (0‐24) | ‐0.27 (‐0.65,0.11) P value 0.16 | |||||
| Hylan G‐F 20 + NSAID | NSAID | Pain on motion (VAS) | ‐0.44 (‐0.93,0.06) P value 0.08 | ‐0.66 (‐1.17,‐0.15) P value 0.01 | ||
| Pain at rest (VAS) | ‐0.44 (‐0.93,0.06) P value 0.08 | ‐0.66 (‐1.17,‐0.15) P value 0.01 | ||||
| Pain at night (VAS) | ‐0.48 (‐0.98,0.02) P value 0.06 | ‐0.84 (‐1.35,‐0.32) P value 0.002 | ||||
| Pain overall (VAS) | ‐0.46 (‐0.96,0.03) P value 0.07 | ‐0.66 (‐1.17,‐0.15) P value 0.01 | ||||
| Hylan G‐F 20 | Triamcinolone hexacetonide | WOMAC pain Q1 (Likert) | ‐0.43 (‐0.70,‐0.16) P value 0.002 | ‐0.38 (‐0.65,‐0.11) P value 0.005 | ||
| WOMAC function (Likert) | ‐0.35 (‐0.62,‐0.08) P value 0.01 | ‐0.36 (‐0.63,‐0.09) P value 0.010 | ||||
| WOMAC total score (Likert) | ‐0.37 (‐0.64,‐0.10) P value 0.007 | ‐0.36 (‐0.63,‐0.09) P value 0.010 | ||||
| Patient global (VAS) | ‐0.54 (‐0.81,‐0.27) P value 0.0001 | ‐0.57 (‐0.84,‐0.30) P value 0.00004 | ||||
| Hylan G‐F 20 + PT | Physiotherapy (PT) | Lequesne Index (0‐24) | ‐0.24 (‐1.11,0.63) P value0.6 (end of treatment) | ‐0.23 (‐1.10,0.64) P value 0.6 | ||
| Hylan G‐F 20 | Appropriate care | WOMAC pain (Likert) | ‐0.77 (‐1.02,‐0.51) p<0.00001 | |||
| WOMAC function (Likert) | ‐0.72 (‐0.98,‐0.45) p<0.00001 | |||||
| WOMAC pain (VAS) | ‐0.60 (‐0.78,‐0.42) p<0.00001 (36 wk) | |||||
| Pain walking (VAS) | ‐0.53 (‐0.71,‐0.36) p<0.00001 (36 wk) | |||||
| WOMAC function (VAS) | ‐0.61 (‐0.79,‐0.43) p<0.00001 (36 wk) | |||||
| Lequesne Index (0‐24) | ‐0.49 (‐0.67,‐0.32) p<0.00001 (36 wk) | |||||
| WOMAC total (VAS) | ‐0.63 (‐0.81,‐0.45) p<0.00001 (36 wk) | |||||
| Gaseous oxygen | Pain under load (VAS) | 0.30 (‐0.08,0.68) P value 0.12 (end of treatment) | 0.44 (0.06,0.82) P value 0.02 | 0.27 (‐0.10,0.65) P value 0.16 | 0.24 (‐0.14,0.61) P value 0.2 | |
| Pain at rest (VAS) | 0.06 (‐0.32,0.43) P value 0.8 (end of treatment) | 0.26 (‐0.12,0.63) P value 0.18 | 0.10 (‐0.28,0.48) P value 0.6 | 0.00 (‐0.37,0.38) P value 1 | ||
| WOMAC pain (Likert) | 0.34 (‐0.04,0.71) P value 0.08 (end of treatment) | 0.35 (‐0.03,0.73) P value 0.07 | 0.14 (‐0.24,0.51) P value 0.5 | 0.20 (‐0.18,0.57) P value 0.3 | ||
| WOMAC function (Likert) | 0.24 (‐0.14,0.62) P value 0.2 (end of treatment) | 0.21 (‐0.17,0.58) P value 0.3 | 0.27 (‐0.11,0.65) P value 0.16 | 0.26 (‐0.11,0.64) P value 0.17 | ||
| WOMAC stiffness (Likert) | 0.10 (‐0.27,0.48) P value 0.6 (end of treatment) | 0.28 (‐0.10,0.65) P value 0.15 | 0.47 (0.09,0.85) P value 0.02 | 0.25 (‐0.13,0.63) P value 0.2 | ||
| Hyaluronan | Pain weight bearing (VAS) | ‐0.08 (‐0.30,0.14) P value 0.5 | ‐0.28 (‐0.64,0.09) P value 0.13 | ‐0.15 (‐0.44,0.15) P value 0.3 | ||
| Pain at night (VAS) | ‐0.34 (‐0.06,‐0.01) P value 0.04 | ‐0.14 (‐0.47,0.18) P value 0.4 | ||||
| Function: improvement (VAS) | ‐0.02 (‐0.34,0.30) P value 0.9 | 0.41 (0.08,0.73) P value 0.02 | ||||
| Patient global (treatment efficacy) (VAS) | 0.06 (‐0.26,0.38) P value 0.7 | 0.31 (‐0.02,0.63) P value 0.07 | ||||
| NRD‐101 | Artz | Flexion (end of treatment) | 0.08 (‐0.21,0.37) P value 0.6 | |||
| Extension (end of treatment) | ‐0.04 (‐0.33,0.26) P value 0.8 | |||||
| Orthovisc | Placebo | WOMAC pain (Likert) | ‐1.68 (‐2.41,‐0.95) p<0.00001 | ‐1.88 (‐2.64,‐1.12) p<0.00001 | ‐1.86 (‐2.61,‐1.11) p<0.00001 | ‐1.87 (‐2.63,‐1.12) p<0.00001 |
| WOMAC function (Likert) | ‐0.87 (‐1.46,‐0.17) P value 0.009 | ‐0.81 (‐1.46,‐0.17) P value 0.01 | ‐0.73 (‐1.38,‐0.09) P value 0.03 | ‐0.52 (‐1.15,‐0.11) P value 0.11 | ||
| Betamethasone | WOMAC function (VAS) | 0.34 (‐0.29,0.96) P value 0.3 | ‐1.06 (‐1.73,‐0.40) P value 0.002 | |||
| Flexion (degrees) | ‐0.30 (‐0.93,0.32) P value 0.3 | ‐0.51 (‐1.14,0.12) P value 0.11 | ||||
| 6‐MPA | Pain weight bearing (VAS) | 0.26 (‐0.27,0.79) P value 0.3 | ‐0.92 (‐1.48,‐0.36) P value 0.001 | ‐0.76 (‐1.31,‐0.21) P value 0.007 | ||
| Pain at rest (VAS) | 0.33 (‐0.21,0.86) P value 0.2 | ‐0.69 (‐1.24,‐0.15) P value 0.01 | ‐0.23 (‐0.76,0.30) P value 0.4 | |||
| Pain on walking (VAS) | ‐0.02 (‐0.55,0.51) P value 0.9 | ‐0.89 (‐1.45,‐0.33) P value 0.002 | ‐0.71 (‐1.25,‐0.16) P value 0.01 | |||
| Lequesne Index (0‐24) | ‐0.06 (‐0.59,0.46) P value 0.8 | ‐0.99 (‐1.56,‐0.43) P value 0.0005 | ‐0.58 (‐1.12,‐0.04) P value 0.04 | |||
| Flexion (degrees) | 0.24 (‐0.29,0.77) P value 0.4 | 0.29 (‐0.24,0.83) P value 0.3 | 0.54 (0.00,1.08) P value 0.05 | |||
| Orthovisc + PT | Physiotherapy (PT) | Activity pain (VAS) | ‐0.19 (‐0.81,0.43) P value 0.6 | ‐0.73 (‐1.37,‐0.08) P value 0.03 | ||
| Spontaneous pain (VAS) | 0.07 (‐0.55,0.69) P value 0.8 | ‐0.75 (‐1.39,‐0.10) P value 0.02 | ||||
| Night pain (VAS) | ‐0.03 (‐0.65,0.59) P value 0.9 | ‐0.57 (‐1.20,0.07) P value 0.08 | ||||
| Lequesne Index (0‐24) | ‐0.06 (‐0.87,0.76) P value 0.9 | ‐0.44 (‐1.27,0.38) P value 0.3 | ||||
| 25 m walk time | 0.25 (‐0.37,0.87) P value 0.4 | ‐0.41 (‐1.04,0.21) P value 0.19 |
53. Effect size based on Standardised Mean Difference ‐ Part II.
| Product | Comparison | Outcome | 1‐4 wk | 5‐13 wk | 14‐26 wk | 45‐52 wk |
| Orthovisc+PT | Hylan G‐F 20+PT | Lequesne Index (0‐24) | 0.16 (‐0.59,0.91) P value 0.7 (End of treatment) | ‐0.30 (‐1.05,0.45) P value 0.4 | ||
| Suplasyn | Placebo | Pain after walking (VAS) | ‐0.38 (‐0.92,0.17) P value 0.17 | |||
| WOMAC pain (VAS) | ‐0.29 (‐0.83,0.25) P value 0.3 | |||||
| Pain at rest (VAS) | 0.56 (0.01,1.11) P value 0.05 | |||||
| WOMAC function (VAS) | ‐0.47 (‐1.02,0.07) P value 0.09 | |||||
| Walk time (sec) | 0.18 (‐0.36,0.72) P value 0.5 | |||||
| NSAID | Pain after walking (VAS) | 0.39 (‐0.15,0.93) P value 0.16 | ||||
| WOMAC pain (VAS) | ‐0.17 (‐0.70,0.37) P value 0.5 | |||||
| Pain at rest (VAS) | 0.40 (‐0.14,0.95) P value 0.14 | |||||
| WOMAC function (VAS) | ‐0.13 (‐0.66,0.41) P value 0.6 | |||||
| Walk time (sec) | ‐0.09 (‐0.62,0.45) P value 0.7 | |||||
| Suplasyn+NSAID | NSAID | Pain after walking (VAS) | 0.09 (‐0.44,0.62) P value 0.7 | |||
| WOMAC pain (VAS) | ‐0.10 (‐0.63,0.43) P value 0.7 | |||||
| Pain at rest (VAS) | ‐0.01 (‐0.54,0.52) P value 1 | |||||
| WOMAC function (VAS) | ‐0.01 (‐0.54,0.52) P value 1 | |||||
| Walk time (sec) | ‐0.21 (‐0.74,0.32) P value 0.4 | |||||
| Zeel | Hyalart | Pain during movement (VAS) | 0.23 (‐0.15,0.61) P value 0.2 (end of treatment) | |||
| Pain during night (VAS) | 0.09 (‐0.29,0.47) P value 0.6 (end of treatment) | |||||
| Patient assessment of improvement (VAS) | ‐0.16 (‐0.53,0.21) P value 0.4 (end of treatment) | |||||
| Patient assessment of tolerance (VAS) | ‐0.16 (‐0.53,0.21) P value 0.4 (end of treatment) | |||||
| HA/Hylan (Pooled) | Placebo | Pain weight bearing (VAS) | ‐0.37 (‐0.55,‐0.19) P < 0.0001 | ‐0.33 (‐0.55,‐0.11) P value 0.004 | ‐0.33 (‐0.55,‐0.11) P value 0.004 | ‐0.09 (‐0.27,0.08) P value 0.3 |
| Pain at rest (VAS) | ‐0.27 (‐0.65,0.11) P value 0.17 | |||||
| WOMAC pain (VAS) | ‐0.21 (‐0.46,0.05) P value 0.11 | ‐0.23 (‐0.46,0.00) P value 0.05 | ‐0.38 (‐0.68,‐0.08) P value 0.01 | |||
| WOMAC function (VAS) | ‐0.17 (‐0.42,0.08) P value 0.19 | ‐0.75 (‐1.12,‐0.38) P value 0.00008 | ||||
| Lequesne Index (0‐24) | ‐0.21 (‐0.39,‐0.03) P value 0.02 | ‐0.36 (‐0.54,‐0.18) P < 0.0001 | 0.01 (‐0.16,0.19) P value 0.9 | ‐0.28 (‐0.69,0.13) P value 0.18 | ||
| Flexion (degrees) | 0.24 (‐0.10,0.58) P value 0.17 | 0.70 (0.01,1.39) P value 0.05 |
54. Effect size based on Standardised Mean Difference ‐ Part III.
| Product | Comparison | Outcome | 1‐4 wk | 5‐13 wk | 14‐26 wk | 45‐52 wk |
| NASHA (Durolane) | Saline | WOMAC pain (Likert: 0‐20) | ||||
| WOMAC stiffness (Likert: 0‐8) | ||||||
| WOMAC physical function (Likert: 0‐68) | ||||||
| Patient global assessment (Likert: 1‐5) | ||||||
| SF‐36 physical componet summary ( ) | ||||||
| SF‐36 mental component summary ( ) | ||||||
| NRD‐101 (Suvenyl) | Placebo | Pain (0‐100 mm VAS) | ||||
| Lequesne Index (0‐24) | ||||||
| Patient global assessment (0‐100 mm VAS) | ||||||
| Percentage of painful days during the previous month (0‐100 mm VAS) | ||||||
| NRD‐101 (Suvenyl) | Diacerein | Pain (0‐100 mm VAS) | ||||
| Lequesne Index (0‐24) | ||||||
| Patient global assessment (0‐100 mm VAS) | ||||||
| Percentage of painful days during the previous month (0‐100 mm VAS) | ||||||
| Hyalgan+exercise+ultrasound | Exercise+ultrasound | Pain (0‐10 cm VAS) | ||||
| Lequesne Index (0‐26) | ||||||
| Range of motion (degrees) | ||||||
| Ambulation speed (metres/minute) | ||||||
| Mean peak torque at 60 degrees per second (flexion/concentric) | ||||||
| Mean peak torque at 180 degrees per second (flexion/concentric) | ||||||
| Hyalgan+exercise+ultrasound | Exercise | Pain (0‐10 cm VAS) | ||||
| Lequesne Index (0‐26) | ||||||
| Range of motion (degrees) | ||||||
| Ambulation speed (metres/minute) | ||||||
| Mean peak torque at 60 degrees per second (flexion/concentric) | ||||||
| Mean peak torque at 180 degrees per second (flexion/concentric) | ||||||
| Hyalgan+exercise+ultrasound | Control warmup exercises | Pain (0‐10 cm) | ||||
| Lequesne Index (0‐26) | ||||||
| Range of motion (degrees) | ||||||
| Ambulation speed (metres/minute) | ||||||
| Mean peak torque at 60 degrees per second (flexion/concentric) | ||||||
| Mean peak torque at 180 degrees per second (flexion/concentric) | ||||||
| Hylan G‐F 20 | Exercise programme | Hospital for Special Surgery Knee Score | ||||
Forty‐two trials included comparisons of hyaluronan/hylan and placebo (Altman 1998; Altman 2004; Ardic 2001; Bragantini 1987; Brandt 2001; Bunyaratavej 2001; Carrabba 1995; Cohen 1994; Corrado 1995; Creamer 1994; Cubukcu 2004; Day 2004; Dickson 2001; Dougados 1993; Formiguera Sala 1995; Grecomoro 1987; Groppa 2001; Guler 1996; Henderson 1994; Hizmetli 1999; Huskisson 1999; Jubb 2003; Karlsson 2002; Kotevoglu 2005; Lohmander 1996; Moreland 1993; Neustadt 2005a ‐3inj; Petrella 2002; Pham 2003; Pham 2004; Puhl 1993; Scale 1994a (2 inj); Scale 1994b (3 inj); Shichikawa 1983a; Shichikawa 1983b; St. J. Dixon 1988; Tamir 2001; Tsai 2003; Wobig 1998; Wobig 1999c (NEhyl); Wu 1997). In the figures, the Kotevoglu 2002 citation refers to the Hylan G‐F 20 versus saline comparison while the Kotevoglu 2005 citation refers to the Orthovisc versus saline comparison.
In this section, we report only analyses based on multiple studies. Analyses based on single products and/or studies can be found in the relevant by‐product results section. This section is most informative when read in combination with the relevant by‐product section(s).
There was a statistically significant difference in favour of HA compared to placebo for pain on weight bearing (0 to100 mm VAS) at three assessments: at 1 to 4 weeks postinjection, based on 22 trials (WMD (random‐effects model) ‐7.70; 95% CI ‐11.29 to ‐4.10, P < 0.0001); at 5 to 13 weeks postinjection, based on 17 trials (WMD (random‐effects model) ‐13.00; 95% CI ‐17.77 to ‐8.23, P < 0.00001); at 14 to 26 weeks postinjection, based on 9 trials (WMD (random‐effects model) ‐9.04; 95% CI ‐14.83 to ‐3.24, P value 0.002); but not at 45 to 52 weeks postinjection based on 3 trials.
There was a statistically significant difference in pain at rest (0 to 100 mm VAS) at 1 to 4 weeks postinjection based on eight trials (WMD (random‐effects model) ‐5.37; 95% CI ‐9.90 to ‐0.85, P value 0.02).
There were statistically significant differences in the WOMAC OA Index pain subscale in favour of HA versus placebo at 1 to 4 weeks postinjection based on six trials (SMD (random‐effects model) ‐1.22; 95% CI ‐1.93 to ‐0.52, P value 0.0007) (Cubukcu 2004; Hizmetli 1999; Kotevoglu 2005; Petrella 2002; Sezgin 2005; Tsai 2003) at 5 to 13 weeks postinjection based on five trials (SMD ‐1.02 (random‐effects model); 95% CI ‐1.57 to ‐0.47, P value 0.003) (Cubukcu 2004; Day 2004; Dickson 2001; Hizmetli 1999; Kotevoglu 2005; Tsai 2003); and at 14 to 26 weeks postinjection based on three trials (SMD ‐1.04 (random‐effects model); 95% CI ‐1.75 to ‐0.32, P value 0.005) (Hizmetli 1999; Kotevoglu 2005; Tsai 2003).
There were statistically significant differences in the WOMAC OA Index physical function subscale in favour of HA versus placebo at 1 to 4 weeks postinjection based on six trials (SMD ‐1.02; 95% CI ‐1.62 to ‐0.42, P value 0.0008); at 5 to 13 weeks postinjection based on 6 trials (SMD ‐0.85; 95% CI ‐1.31 to ‐0.39, P value 0.0003); and at 14 to 26 weeks postinjection based on three trials (SMD ‐0.80; 95% CI ‐1.37 to ‐0.24, P value 0.005) (Hizmetli 1999; Kotevoglu 2002; Kotevoglu 2005; Tsai 2003).
There was a statistically significant difference in the Lequesne Index both at 1 to 4 weeks postinjection (WMD ‐0.82; 95% CI ‐1.48 to ‐0.16, P value 0.02) (Carrabba 1995; Dougados 1993; Huskisson 1999; Puhl 1993); and at 5 to 13 weeks postinjection (WMD ‐1.38; 95% CI ‐2.04 to ‐0.73, P < 0.0001) (Carrabba 1995; Dickson 2001; Huskisson 1999; Puhl 1993). There was no statistically significant difference either at 14 to 26 weeks postinjection (Huskisson 1999; Karlsson 2002; Lohmander 1996) or 45 to 52 weeks postinjection (Dougados 1993).
With respect to patient global assessment (expressed as the number of patients improved), there were no statistically significant differences between HA and placebo at any of the four assessment times: at 1 to 4 weeks post injection (Corrado 1995; Creamer 1994; Lohmander 1996; Shichikawa 1983a; Shichikawa 1983b); at 5 to 13 weeks postinjection (Corrado 1995; Dickson 2001; Guler 1996; Lohmander 1996; Puhl 1993); at 14 to 26 weeks postinjection (Henderson 1994; Huskisson 1999; Lohmander 1996); and at 45 to 52 weeks postinjection (Dougados 1993; Pham 2004).
There was a statistically significant difference in flexion (degrees) in favour of HA versus placeo at 1 to 4 weeks postinjection (WMD 3.87; 95% CI 2.06 to 5.68, P < 0.0001) (Corrado 1995; Sezgin 2005; Shichikawa 1983a; Shichikawa 1983b); and at 5 to 13 weeks postinjection (WMD 7.60; 95% CI 0.46 to 14.74, P value 0.04) (Corrado 1995).
In safety analyses in HA versus placebo comparisons, no statistically significant differences were detected in the following: total withdrawals overall (1 to 4 weeks, 5 to 13 weeks, 14 to 26 weeks, 45 to 52 weeks postinjection), patients with local adverse reaction and study drug discontinued, number of patients with local adverse reaction but study drug continued, number of patients discontinued due to adverse events, withdrawals due to lack of efficacy, number of adverse events due to local skin reaction, number of patients with gastro‐intestinal complaints, number of patients with treatment related adverse events, number of patients with possible study medication related events, number of serious adverse events, number of adverse events probably/possibly related to treatment, and number of patients reporting adverse events. A statistically significant event favouring placebo was noted in the number of adverse events for injection site pain (RR 1.70; 95%CI 1.19 to 2.44, P value 0.004).
In comparative studies of HA versus NSAID, no statistically significant differences were detected in pain on walking at 1 to 4 weeks post‐injection or total withdrawals overall at 14 to 26 weeks postinjection.
In comparative studies of HA versus methylprednisolone acetate, statistically significant differences in favour of IA steroid were detected in range of motion (degrees of flexion) at 1 to 4 weeks postinjection (WMD 3.87; 95%CI 0.36 to 7.37, P value 0.03) and 5 to 13 weeks postinjection (WMD 3.66; 95%CI 0.48 to 6.83, P value 0.02).
In six comparative studies of selected HA products, no statistically significant differences were detected between the products concerned in: pain on movement (number of patients improved) (1 to 4 weeks postinjection), pressure pain (number of patients improved) (1 to 4 weeks postinjection), Lequesne Index (1 to 4 weeks and 5 to 13 weeks postinjection), or patient global assessment (1 to 4 weeks, 5 to 13 weeks, 14 to 26 weeks and 45 to 52 weeks postinjection).
Discussion
This review is current as of the end of December 2005, and contains both by‐product and by‐class analyses. It is comprehensive and more current than preceding systematic reviews and avoids limiting the review to a single product, variable or timepoint, or forcing different variables assessed using different instruments through a hierarchical algorithm in a reductionist manner, that attempts to obtain a single value capturing complex, dynamic, and heterogeneous phenomena. In developing a strategy for conducting this review, we have considered the complexity of the HA class of interventions, issues relating to the design, execution, analysis and interpretation of clinical trials, and the nuances of systematic reviews and meta‐analytic techniques. It is recognized in combining studies using different designs that any resulting heterogeneity may be in part or in whole attributable to design elements, or characteristics of the patient population, rather than to variability in the efficacy of the HA product. This heterogeneity can in part be addressed by recognizing the presence and potential determinants of the heterogeneity and conducting the review in a manner that attempts to minimize the influence of any existent heterogeneity.
Previous systematic reviews by Lo et al. (Lo 2003), Wang et al. (Wang 2004), Arrich et al. (Arrich 2005) and Modawal et al. (Modawal 2005) have differed regarding the magnitude of clinical benefit of HA products. Lo et al. (Lo 2003), in particular, concluded that the effect size may be small at the class level. Bernstein (Bernstein 2004) has drawn attention to the discrepancy between the Lo et al. (Lo 2003) and Wang et al. (Wang 2004) commentaries on effect size. Hou and Wang (Hou 2004) have correctly asserted that the reviews differ in the approach to effect size estimation, search date and searching source, and in their interpretation of funnel plot distortion. The use of a hierarchy to identify a single time point and variable, from each study, in a phenomenon that is time and variable dependent, may also contribute in part to the small effect size observed in the Lo et al. meta‐analysis. Arrich et al. reported reasons for discrepancies between their systematic review and three other relevant reviews. Some of these discrepancies were attributable to differences in the literature search, trial selection criteria, quality scoring, quantitative summary expressed as number of positive trials, use of change scores, and mixing of end (time) points (Arrich 2005). Modawal et al. confirmed that the treatment effect was time dependent. Among the limitations of their meta‐analysis, they reported heterogeneity of trials, trial quality, confounding by use of rescue analgesia during trial, and lack of intention‐to‐treat analyses (Modawal 2005). Brandt (Brandt 2004) reported that Dieppe et al. found a pooled effect size of ‐0.48 with a confidence interval of ‐0.72 to ‐0.23 in an analysis of 11 clinical trials. It appears, therefore, that the results of the meta‐analyses may be, significantly method dependent, and reviewers should be aware of the nuances associated with the method used in this and other meta‐analyses.
HA products differ in their origin, method of production, molecular weights (MW), biologic characteristics, rheologic properties, residence time in the joint and pharmacodynamic properties. As a consequence, any by‐class analysis needs to be approached with due recognition that the products may differ in important respects, and that this may restrict the valuation of individual products, particularly where patients have not been randomised to receive the competing alternatives. The by‐class analysis is also less informative to clinicians, since practitioners generally seek to make evidence‐based decisions in treating individual patients with specific products, and are interested in the time course and dimensionality of the clinical response to individual products. In this review, we have presented both by‐product analyses and by‐class analyses in order that readers can make their own judgement regarding individual products as well as the class as a whole. The provision of separate within‐product by‐variable and by‐time analyses, for different comparisons, permits the reader to appreciate the time‐dependency of the response and the differential effects detected on different outcome variables.
The clinical epidemiology toolbox contains numerous alternative approaches to the design, execution and analysis of clinical trials. It is our understanding that traditionally, this class of intervention was considered as a device class and originally was not generally subject to the same evaluation guidelines that then existed for pharmacologic agents. This may explain, in part, the heterogeneity in research designs and outcome measurement techniques used, particularly in some of the earlier studies, a phenomenon, however, not peculiar to this class of interventions. Our review detected differences in at least nineteen areas of trial design including: clinical environment, sample size, number of study arms, number of centres, nature of the placebo comparator, inclusion and exclusion criteria, washout period, re‐treatment opportunity, concomitant therapy, follow‐up schedule, duration of follow‐up, outcome measures, age, gender balance, disease duration, baseline pain severity, radiographic grade, treatment schedule, rescue medication. These differences were sometimes evident, even when comparing different trials involving the same HA product.
The nuances of systematic reviews and meta‐analysis require due consideration of any assumptions, implicit or explicit that are made to combine information and data from diverse sources into valid and meaningful summary statistics. In particular, it is necessary to be familiar with a number of factors including, but not limited to the following: RevMan 4.2 software and its operations; assumptions, if any, regarding the value of ρ in imputations which require converting between change scores and post‐test scores; the significance of the test for heterogeneity and its implications both on the appropriateness of combining studies and the use of fixed‐effect versus random‐effects models of analysis; the consequence of basing analyses on transformed data, for example where different outcomes (pain walking, pain at night, global pain) measured on different instruments, have been filtered through a hierarchical algorithm to obtain a single measure of pain suitable for meta‐analysis. This latter issue is particularly concerning given the differential impact of interventions on different components of the symptom complex and between‐instrument differences in responsiveness (synonym: sensitivity to change). Other methodologic issues include the potential for publication bias, and the interpretation of the clinical importance of the observed treatment effects. In an attempt to address potential publication bias, we have searched abstract books, as well as published manuscripts, corresponded with manufacturers, and contacted investigators in the search for additional information or unpublished studies.
This review highlights the challenge of interpreting the results of clinical trials of intra‐articular (IA) injections of hyaluronan and hylan in knee OA. Greater standardisation in methodology would facilitate assessment of these trials. Complete descriptions of blinding, randomisation, withdrawals and dropout would improve reporting quality. There was wide variation in the method of assessment of outcome. The distinction between primary and secondary outcome measures was infrequently reported. The utilisation of local anaesthetic also varied as well as description of the injection technique employed. The inclusion/exclusion criterion of presence of effusion at study entry was variable with some trials limiting the entry of subjects with a predefined volume of effusion. Different osteoarthritic populations were included in the trials; some subjects had unilateral disease while others had bilateral disease. Variability was noted in both timing and method (e.g. office versus telephone) of assessments, and in the opportunity for retreatment. In some trials, a per protocol rather than intent‐to‐treat statistical analysis was reported.
Safety was reported in variable formats, e.g. number of adverse events per number of injections, number of 'related' adverse events, number of subjects reporting adverse events, number of serious adverse events, number of local (injection site) reactions, number of systemic reactions, number of patients withdrawing due to adverse events. The denominator for safety analyses was frequently based on the intent‐to‐treat population. However, in some trials it was difficult to ascertain the denominator (patients versus injections). Ideally, the following should be reported: 1) withdrawals overall, 2) withdrawals due to all adverse events, 3) withdrawals due to system specific adverse events (e.g. gastrointestinal related grouped, cardiovascular grouped, etc.), and 4) withdrawals due to lack of efficacy.
Safety of hyaluronan and hylan in the general population for approved products in the U.S.A. can be examined by review of the U.S.A. Food and Drug Administration Manufacturers and User Device Experience (MAUDE) database available online at http://www.fda.gov/cdrh/maude.html. Large pharmacoepidemiologic databases are generally better sources of safety data than small individual clinical trials. An article by Hammesfahr, Knopf and Stitik reviews the safety data for the three products marketed in the United States, e.g. Hyalgan, Supartz and Synvisc (Hammesfahr 2003). They concluded that HA therapy is a safe treatment for OA of the knee. In addition, Hamburger et al. also concluded that HA therapy is a safe treatment for knee OA, but that there may be interproduct variability in safety profiles (Albert 2005; Hamburger 2003; Hamburger 2005; Raynauld 2005a).
The possibility of publication bias exists if reviewers choose to exclude unpublished studies. McAuley et al. recommend the inclusion of all reports, grey and published, that meet predefined inclusion criteria in meta‐analyses (McAuley 2000). In this review, nine included studies (Ardic 2001; Brown 2003; Cohen 1994; Groppa 2001; Guler 1996; Karras 2001; Moreland 1993; Pham 2003; Tsai 2003) were published only as abstracts. However, an in‐house manuscript by Moreland (Moreland 1993) was provided. The articles by Hizmetli (Hizmetli 1999) and Lin (Lin 2004) were in‐house publications. Two specialization thesis (Auerbach 2002a; Kalay 1997) were included. Published articles have the advantage of having undergone the peer review process. Frequently, abstracts do not provide enough information to be included in reviews, and, consequently, are excluded.
The method of statistical analysis can affect the result. The utilisation of follow‐up (difference) scores, change (improvement) scores, or unadjusted post‐test (synonym: final value) scores for continuous outcome measures can influence the result. Vickers and Altman (Vickers 2001), Norman (Norman 1989), Lund (Lund 1988) and Stucki et al. (Stucki 1996) have discussed this issue.
A high placebo effect has been noted in HA clinical trials (Bhogal 2000). This response may be attributed to a number of factors including: 1) removal of excess synovial fluid, 2) patient expectation, 3) Hawthorne effect of participating in a clinical trial, or 4) active treatment effect of saline and/or arthrocentesis (Kaptchuk 2000). The modulating effects of rescue analgesia and co‐therapy with other OA treatments on outcome variables also should be considered.
The effect of treating both unilateral and bilateral disease in the same trial is problematic. Generally, efficacy results were based on analyses of the worse joint, while safety results were based on analyses of both joints. In some patients both knees received the same intervention, while for other patients they received one intervention in one knee and the comparative intervention in the other knee. The time between treatment of the knees varied considerably with some knees both being treated the same day, while other knees had a 210‐day difference between initiation of treatment. The selection of a target joint (e.g. study knee) is one method of resolving this controversy. The problem of analysing the person versus the joint(s) has been reported in the literature (Sutton 1997; Zhang 1996).
Some trials used the Ahlback classification of knee OA. A recent publication, suggested that this classification had some 'major limitations' (Galli 2004). Even low grade Ahlback grades reflect substantial structural damage. Patients with higher grade structural damage may be generally less responsive to treatment (Barrett 2002; Evanich 2001; Lussier 1996; Magilavy 2003; Toh 2002; Vad 2003).
Limitations of this review are the omission of open trials and case series, the omission of studies that failed to meet inclusion criteria, the lack of standard outcome measures restricting pooling opportunities, and restricted access to source data. Strengths of the review are the inclusion of only randomised controlled trials, the focus on four core OARSI and OMERACT outcome measures, and adherence to the principles of Cochrane systematic reviews.
A product‐based discussion is followed by a class‐based discussion. All comments are based on the trials that could be included in this review, the data that could be extracted and the analyses that could be performed, and should be interpreted and utilized by readers with the understanding that the review was conducted using the methodology described in the earlier part of this document, a methodology anchored to the Cochrane review process using RevMan 4.2 software, and limited potentially by restricted access to both unpublished studies and primary data. It should be recalled that HA products are not generally immediate in their onset, and that the 5 to 13 week time period may be one of the more relevant for single course studies, while later periods may be particularly relevant for studies allowing more than a single course. Statistically detectable differences seen in the 1 to 4 week postinjection period represent a relatively early onset of action and are not necessarily expected in all responding patients or all studies. It should also be noted that statistically detectable improvement may not necessarily be detected on all variables or at the same point in time. Function may improve more slowly than pain, and it may be more difficult to detect an effect on night pain than on walking pain. Finally, comparisons against other efficacious forms of treatment are likely to result in either no statistically detectable difference in efficacy or in relatively small differences (cf studies of HA products against placebo). The inability to show a statistically detectable difference between an HA product and placebo, in at least one key variable such as pain, function or patient global assessment from about 5 to 13 weeks onwards might be regarded with some degree of concern.
RevMan output for continuous data can be in the form of the WMD or SMD. The WMD provides a summary statistic whose magnitude is related to a number of factors including the treatment effect and the scale length of the instrument on which the underlying data were collected. What constitutes a minimum clinically important difference (MCID) is subject to ongoing debate (Bellamy 1993). The value for the minimum perceptible clinical improvement (MPCI) for the WOMAC Index is approximately 10 normalised units (0 to 100). This may serve as one indicator of the clinical importance of the WMD for pain, stiffness and function measured on 0 to 100 normalised unit scales. Tubach and colleagues have proposed definitions of Minimal Clinically Important Improvement (MCII) (Tubach 2005), for pain, WOMAC function and patient global assessment. In contrast, the SMD provides a summary statistic adjusted by the variance, is of a different order of magnitude to the WMD and expresses the effect size as a unitless measure. What constitutes a small, medium, or large effect size is a matter for debate. We have used the proposals advanced by Cohen (Cohen 1977), and operationalised in a recent publications by Jordan et al. (Jordan 2003), and Mazieres et al. (Mazieres 2001) i.e. small effect size = 0.2, moderate effect size, i.e. clinically recognisable = 0.5, large effect size = 0.8. Other measures of clinical value are the percentage superiority in response and the NNT. We are not aware of published critical values for these parameters in OA management. Nevertheless, tables have been provided for all the aforementioned parameters, in order that readers can make informed decisions. It should be noted that the magnitude of these parameters differs with product, comparison, variable and time period.
We have observed that in some analyses, the RevMan 4.2 output differs from the original publication (Table 1). The discrepancies are likely due to the use of secondary data and the statistical methods available within the software programme. Reviewers are advised to consider these disparities when making product‐based evaluations. Product ‐ Adant No placebo‐controlled trials were included in this review. The only data that could be included in the review suggested that Adant is not different to Hyalgan with respect to patient global assessment at 1 to 4 weeks, 5 to 13 weeks, and 14 to 26 weeks, or with respect to the risk of experiencing injection‐related pain. This review provides some supportive evidence for the efficacy and safety of Adant, but is based on limited data, and does not include placebo‐controlled trials. Product ‐ Artz (Artzal) In comparative studies of Artz and placebo included in this review, several outcome measures (Lequesne Index, range of motion, WOMAC OA Index), failed to detect a statistically significant difference at 1 to 4 weeks, 5 to 13 weeks, 14 to 26 weeks and 45 to 52 weeks, with the exception of patient global assessment at 1 to 4 weeks and 5 to 13 weeks and pain and the number of clinical failures at 5 to 13 weeks postinjection. Given the inclusion of single course studies, and the time‐dependent dynamics of HA therapy, the positive effects of Artz on pain and patient global assessment seen at 5 to 13 weeks postinjection are expected. It is of note that statistically significant differences were detected on one pain measure but not another at 5 to 13 weeks. Significant effects on physical function cannot be confirmed from these analyses. It should be noted that the original analyses give a more positive result than the RevMan analyses we have performed. Taken collectively, the data generally support the efficacy of Artz (Artzal).
Analyses supported the safety of Artz, with no statistically significant differences from placebo being detected for the majority of safety variables.
No trials of Artzal against either corticosteroid or NSAID therapy were reported and no comment can be made on the relative effectiveness or safety against these two classes of interventions.
In comparative analyses of Artz and Hylan G‐F 20, there were no statistically significant differences at any of the four time periods in any of the four efficacy or three safety variables. This analysis derives from an ostensibly negative study. The two products could not be differentiated based on this single study. Product ‐ BioHy (Arthrease, Euflexxa, Nuflexxa) The placebo‐controlled study is inconclusive for efficacy, likely as a result of previously described methodologic issues. There was no statistically significant between‐group difference in the proportion of patients experiencing postinjection pain, or in overall withdrawals and there were no systemic reactions in either group, providing some support for the safety of BioHy within the limits of the available data.
No trials of BioHy against either corticosteroid or NSAID therapy were reported and no comment can be made on the relative effectiveness or safety against these two classes of interventions.
In comparative analyses of BioHy and Hylan G‐F 20, pre‐specified criteria for non‐inferiority were met. Joint effusion was significantly less likely in the BioHy group. Statistically significant differences in favour of Bio‐Hy were detected in the RevMan analyses for WOMAC function and number of patients using rescue analgesia at 1 to 4 and 5 to 13 weeks, but not in other efficacy variables including pain. There were a number of instances in which the RevMan analyses differed from the original publication. The two products could not be differentiated based on this single study.
Product ‐ Durolane The placebo controlled trial of Durolane was essentially negative, no statistically significant differences being detected on any efficacy variable in analyses based on all patients. The RevMan subanalysis of patients differed from the original publication. On the basis of RevMan analysis of this single study, no comment can be made regarding the relative efficacy of Durolane versus placebo. Evaluation of the efficacy of Durolane in patients with isolated knee OA requires further study.
Product ‐ Fermathron No trials of Fermathron against placebo were reported and efficacy against placebo cannot, therefore, be assessed. No trials of Fermathron against either corticosteroid or NSAID therapy were reported and no comment can be made on the relative effectiveness or safety against these two classes of interventions.
In comparative analyses of Fermathron and Hyalart, there were no statistically significant differences at either of the time periods in any of the three efficacy variables, or in the safety variable. The two products could not be differentiated based on this single study. Product ‐Hyalgan
In comparative studies of Hyalgan and placebo included in this review, statistically significant differences were detected at 1 to 4 weeks (pain on weight‐bearing, spontaneous pain, pain at rest, Lequesne Index, number of joints improved for walking pain, number of joints improved for weight under load), 5 to 13 weeks (pain on weight‐bearing, spontaneous pain, pain at rest, Lequesne Index, number of joints improved for walking pain, number of joints improved for weight under load, flexion, patient global assessment), 14 to 26 weeks (pain on weight‐bearing, WOMAC pain). Statistically significant differences were not detected for pain at rest at 14 to 26 weeks, pain on weight bearing at 45 to 52 weeks, night pain, WOMAC pain at 1 to 4 weeks or 5 to 13 weeks, WOMAC function, Lequesne Index at 14 to 26 weeks, flexion at 1 to 4 weeks, or patient global assessment at 1 to 4 weeks, 14 to 26 weeks and 45 to 52 weeks. Many of the aforementioned statistically significant differences were highly significant, and clinically important (WMD (disregarding sign) for pain (0 to 100 mm) varying from 3.93 to 33.50). Overall, these analyses strongly support the evidence for efficacy of Hyalgan. No statistically significant differences from placebo were detected in the majority of safety variables although number of patients with local adverse events, number of patients with local adverse events that caused discontinuation, and number of patients with treatment‐related adverse events was significantly greater with Hyalgan. Analyses of safety data also support the safety of Hyalgan.
Comparative studies of Hyalgan against IA methylprednisolone suggest that Hyalgan is superior to methylprednisolone at 5 to 13 weeks postinjection on spontaneous pain intensity, number of patients with moderate to severe pain under load, number of patients with moderate or greater rest pain, flexion, patient global assessment, but with the exception of flexion was not different at 1 to 4 weeks. No statistically significant differences were detected at 14 to 26 weeks or 45 to 52 weeks postinjection. These differences are probably due to the quick onset but often relatively short duration of the response to IA corticosteroid treatment. Overall, these analyses suggest that Hyalgan is comparable, or superior in efficacy to methylprednisolone, notwithstanding that the latter has a faster onset of action but the former a longer duration of action. Analyses of safety data also supported the safety of Hyalgan, with no statistically significant differences from IA methylprednisolone being detected in safety variables. The comparative study of Hyalgan against IA triamcinolone hexacetonide suggests that Hyalgan is not different in efficacy to triamcinolone hexacetonide, except in pain at night at 14 to 26 weeks. Analyses of safety data supported the safety of Hyalgan, with no statistically significant differences from IA triamcinolone hexacetonide being detected in safety variables. Collectively these data support the efficacy and safety of Hyalgan, and show some 5 to 13 week postinjection advantages in favour of Hyalgan over methylprednisolone.
The comparative study of Hyalgan against NSAID suggests that Hyalgan is comparable in efficacy to NSAID therapy at 1 to 4 weeks, 5 to 13 weeks, and 14 to 26 weeks postinjection, based on pain after a 50‐feet walk and number of patients with moderate to marked pain. There were significantly fewer patients with gastrointestinal complaints, but more injection‐site pain on Hyalgan; otherwise there were no statistically detectable differences in safety. Overall, these analyses suggest that Hyalgan is comparable in efficacy to NSAID therapy and similar in safety, with the exception of more injection‐site pain events but fewer gastrointestinal adverse events than NSAID.
The comparative study of Hyalgan against mucopolysaccharide polysulfuric acid ester detected statistically significant differences in pain, Larson rating and patient global assessment, but no difference in function or range of motion. There was no difference in safety profile. The data are limited and no conclusion can be reached from this review regarding relative efficacy and safety.
The comparative study of Hyalgan versus conventional therapy detected statistically significant differences in arthroscopy score but not in clinical outcomes at 45 to 52 weeks. The data are limited, but are of interest in terms of potential structure modification effects.
Huang et al.'s comparative study of combining Hyalgan therapy with ultrasound and exercise versus physiotherapy programmes without Hyalgan co‐therapy, suggested positive clinical benefits in some outcome variables both at end of study and 1‐year follow‐up. This interesting observation requires confirmation, but may suggest a role for Hyalgan as a co‐therapy, in some patients requiring physical forms of therapy for knee OA.
Product ‐ Hylan G‐F 20 (Synvisc) In comparative studies of Hylan G‐F 20 and placebo included in this review, statistically significant differences were detected at 1 to 4 weeks (WOMAC OA Index pain, pain on weight‐bearing, night pain, rest pain, improvement in most painful knee movement, WOMAC OA Index stiffness, WOMAC OA Index physical function, patient global assessment of treatment efficacy, physician global assessment), 5 to 13 weeks (WOMAC pain, pain on weight‐bearing, rest pain, pain walking, night pain, WOMAC OA Index stiffness, WOMAC function, Lequesne Index, improvement in most painful knee movement, patient global assessment of treatment efficacy, physician global assessment), 14 to 26 weeks (WOMAC pain, pain on weight‐bearing, night pain, WOMAC function). Statistically significant differences were not detected for pain overall , 15 metre walking time, number of clinical failures or number of survivors. Many of the aforementioned statistically significant differences were highly significant, and clinically important (WMD (disregarding sign) for pain (0 to 100 mm) varying from 8.03 to 35.68). Overall, these analyses strongly support the evidence for efficacy of Hylan G‐F 20. Analyses of safety data also support the safety of Hylan G‐F 20, with no statistically significant differences from placebo being detected in the majority of safety variables.
Comparative studies of Hylan G‐F 20 against corticosteroid suggest that Hylan G‐F 20 is superior to triamcinolone hexacetonide at 5 to 13 weeks, and 14 to 26 weeks post injection on WOMAC pain walking on a flat surface, WOMAC function and total WOMAC score, but not at 1 to 4 weeks. This difference is probably due to the quick onset but often relatively short duration of the response to IA corticosteroid treatment. Overall, these analyses suggest that Hylan G‐F 20 is comparable in efficacy to IA corticosteroid, notwithstanding that the latter has a faster onset of action but the former a longer duration of action. Analyses of safety data also supported the safety of Hylan G‐F 20, with no statistically significant differences from IA corticosteroid being detected in the majority of safety variables.
Comparative studies of Hylan G‐F20 against NSAID suggest that Hylan G‐F 20 is comparable in efficacy to NSAID therapy at 5 to 13 weeks, and 14 to 26 weeks postinjection, based on the majority of variables. There were significantly fewer patients with possible or probable related systemic adverse events on Hylan G‐F 20 but otherwise there were no statistically detectable differences in safety. Overall, these analyses suggest that Hylan G‐F 20 is comparable in efficacy to NSAID therapy and similar or slightly superior in safety.
The comparative study of Hylan G‐F 20 plus physiotherapy against physiotherapy alone detected no difference in Lequesne score or withdrawals but is limited in its scope and generalisability (Bayramoglu 2003). In contrast, in the comparative study of Hylan G‐F20 vs physiotherapy (Atamaz 2005), while there was an early effect in favour of physiotherapy at 1 to 4 weeks, other analyses favoured Hylan G‐F 20 (WOMAC pain at 1at 4 weeks and 5 to 13 weeks, 37 weeks and 45 to 52 weeks). In the comparative study of Hylan G‐F 20 versus an exercise programme (Karatosun 2005), statistically significant differences in favour of Hylan G‐F 20 were detected in several pain components of the Hospital for Special Surgery Knee Score, but not in the overall score at any of the time points. There were fewer withdrawals in the exercise group. Taken collectively, and recognizing the disparate nature of the physiotherapy interventions and comparisons analysed, Hylan G‐F 20 may be superior to physiotherapy alone or an exercise programme in some knee OA patients with respect to pain relief.
The comparative study of Hylan G‐F 20 and intra‐articular gaseous oxygen, detected no statistically significant differences on the majority of variables. Indeed the only variable on which a difference was detected was pain under load at 5 to 13 weeks and was in favour of intra‐articular gaseous oxygen. The two treatments could not be differentiated based on this single study.
Two comparative studies of Hylan G‐F 20 plus appropriate care versus appropriate care alone both confirm the superiority of adding Hylan G‐F 20 to appropriate care as assessed by the WOMAC OA Index, Lequesne Index and patient global assessment. Safety variables either detected no statistically significant difference or were in favour of Hylan G‐F 20 plus appropriate care. These studies provide strong support for the incorporation of Hylan G‐F 20 into routine clinical care treatment paradigms. Product ‐ NRD‐101
In the comparative study of NRD‐101 plus oral placebo versus intra‐articular saline and oral placebo, performed by Pham (Pham 2004), no statistically significant between‐group differences were detected in pain, Lequesne index, patient global assessment, percentage of painful days or radiographic progressors. On the basis of RevMan analysis of this single study, no comment can be made regarding the relative efficacy of NRD‐101 versus placebo.
In the comparative analyses against Artz, no statistically significant differences were detected between the products in improvement in clinical symptoms or safety. The two products could not be differentiated based on this single study.
The comparative study performed by Pham (Pham 2004) detected no statistically significant differences on clinical outcome variables or radiographic progression between NRD‐101 and Diacerein. However, NRD‐101 was associated with significantly more local reactions and Diacerien with significantly more diarrhea. On the basis of RevMan analysis of this single study, no comment can be made regarding the relative efficacy of NRD‐101 versus Diacerein. Product ‐Orthovisc
In comparative studies of Orthovisc and placebo included in this review, statistically significant differences in WOMAC pain and WOMAC function were detected at 1 to 4 weeks, 5 to 13 weeks, and 14 to 26 weeks postinjection, WOMAC stiffness at 5 to 13 weeks and 14 to 26 weeks postinjection, and patient global assessment at 1 to 4 weeks and 5 to 13 weeks postinjection. These analyses support the evidence for efficacy of Orthovisc. Analyses of safety data also supported the safety of Orthovisc, with no statistically significant differences from placebo being detected in the safety profile.
Comparative studies of Orthovisc against corticosteroid suggest that Orthovisc is superior to 6‐MPA at 5 to 13 weeks and 14 to 26 weeks postinjection and superior to betamethasone at 5 to 13 weeks postinjection. No statistically significant differences were detected at 1 to 4 weeks against either corticosteroid. This time‐dependent difference is probably due to the quick onset but often relatively short duration of the response to IA corticosteroid treatment. Overall, these analyses suggest that Orthovisc is comparable in efficacy to IA corticosteroids at 1 to 4 weeks and superior at 5 to 13 weeks and 14 to 26 weeks, notwithstanding that the latter have a faster onset of action but the former a longer duration of action. Analyses of safety data also support the safety of Orthovisc, with no statistically significant differences from either IA corticosteroid preparation being detected in the safety profile. In the study performed by Ozturk (Ozturk 2005), in which Orthovisc was compared in combination with triamcinolone acetonide to Orthovisc alone, statistically significant differences, in favour of the combination, were detected for pain (1 to 4 weeks) and WOMAC stiffness (1 to 4, 34 and 45 to 52 weeks), although there were fewer withdrawals in the Orthovisc alone group. Given that significant differences were not noted on the majority of outcome variables, but acknowledging the apparent clinical benefit of the combination on some variables, the value of combination therapy merits further evaluation.
No trials of Orthovisc against either NSAID therapy were reported and no comment can be made on the relative effectiveness or safety against this class of intervention.
In the comparative study of Orthovisc plus physiotherapy against physiotherapy alone, no statistically significant differences in efficacy variables were detected at 1 to 4 weeks postinjection. Statistically significant differences in favour of Orthovisc were noted in some, but not all, variables at 5 to 13 weeks postinjection. There were no statistically significant differences in safety profile. These analyses suggest that adding Orthovisc to physiotherapy may be beneficial with respect to activity pain and spontaneous pain, at 5 to 13 weeks postinjection. The more recent study of Orthovisc versus physiotherapy by Atamaz (Atamaz 2005), detected statistically significant differences in favour of Orthovisc for spontaneous pain (14 to 26 weeks), WOMAC pain (1 to 4 and 45 to 52 weeks), SF‐36 pain (5 to 13 and 14 to 26 weeks), SF‐36 physical function (5 to 13 and 45 to 52 weeks). The comparison of Orthovisc plus physiotherapy versus physiotherapy alone (Bayramoglu 2003) failed to detect between group differences using the Lequesne index. Taken collectively, the studies of Kalay (Kalay 1997) and Atamaz (Atamaz 2005), suggest that Orthovisc offers clinical benefit compared to physiotherapy.
In a comparative analysis of Orthovisc plus physical therapy versus Hylan G‐F 20 plus physical therapy (Bayramoglu 2003), there were no statistically significant differences in efficacy or safety. Several studies have compared Orthovisc and Hylan G‐F 20 (Atamaz 2005; Bayramoglu 2003; Karatay 2004; Karatosun 2005; Kotevoglu 2005). Statistically significant differences have not generally been detected, but where detected, the majority have been in favour of Hylan G‐F20. The two products could not be clearly differentiated based on these studies.
The comparative study of Orthovisc alone versus Orthovisc plus co‐treatment with trigger point injections (Yentur 2003), suggested clinical benefit in pain relief with the combination programme. No recommendation can be made on the basis of this single study, but the concept merits further evaluation in relevant knee OA patients.
The comparison of Orthovisc treatment schedules conducted by Neustadt (Neustadt 2005) detected statistically significant differences in favour of the 4‐injection regimen in WOMAC 20% pain response at 5 to 13 weeks and in the patient global assessment.
In a comparative analysis of Orthovisc plus physical therapy versus Hylan G‐F 20 plus physical therapy there were no statistically significant differences in efficacy or safety. The two products could not be differentiated based on this single study. Product ‐ Replasyn It was not possible to conduct informative analysis of Replasyn as part of this review, and therefore no conclusion can be reached regarding efficacy or safety, based on our review. The original publication, referred to previously, noted a significant difference in only one of six variables. Product ‐ SLM‐10 SLM‐10 was comparable in efficacy to Artz on three outcome measures and statistically significantly inferior on pain on pressure. There was no difference in safety profile. This review provides some supportive evidence for the efficacy and safety of SLM‐10, but is based on limited data, and does not include placebo‐controlled trials or studies against NSAID, IA corticosteroid or appropriate care. Product ‐ Suplasyn No statistically significant differences were detected in our analyses between Suplasyn and placebo for four of the five efficacy measures and for the fifth favoured the control group. No statistically detectable differences were noted in the safety profile. The review does not incontrovertibly support the efficacy of Suplasyn, given negative outcomes for the majority of variables in our RevMan analyses, which are somewhat at variance with the original publication. However, Felson and Anderson (Felson 2002) published an editorial on HA injections for OA in the same issue of Archives of Internal Medicine in which the Petrella trial (Petrella 2002) was published. They re‐evaluated the data of Petrella analysing it as a factorial experiment, and noted that Suplasyn had no "significant or important clinical effect on pain" and "there [were] null results for disability and other outcomes".
No statistically significant differences in efficacy or safety variables were detected between Suplasyn and NSAID. The two treatment strategies could not be differentiated based on this single study. Product ‐ Zeel compositum No statistically significant differences in efficacy or safety variables were detected between Zeel compositum and Hyalart. The two products could not be differentiated based on this study.
Product ‐ Hyaluronan (brand name not identified)
The interpretation of the study reported by Wu (Wu 2004) is problematic since the exact nature of the HA product could not be identified. The authors concluded that HA plus self‐controlled celecoxib could improve the clinical symptoms of knee OA. We are not able to reach a conclusion based on this study due to lack of sufficient information.
By‐class analyses
The pooled analyses address issues relating to class characteristics and may not be shared to the same extent by each individual HA product. Readers including practitioners, regulators and third party payers should be cautious in extrapolating from the class to an individual product or vice versa, as the class‐based analysis may either under‐estimate or over‐estimate the performance of individual component products. For product‐based information, readers are referred to the relevant preceding sections. Only comparisons against placebo are discussed, because of the relatively large number of studies available for some of these analyses. The other comparisons were limited, in some cases, by a relative paucity of studies.
Statistically significant differences were detected between HA and placebo at 1 to 4 weeks (WOMAC pain, pain on weight bearing, pain at rest, WOMAC function, Lequesne Index, flexion), 5 to 13 weeks (pain on weight bearing, WOMAC pain, WOMAC function, Lequesne Index, flexion), and 14 to 26 weeks (pain on weight bearing, WOMAC pain, WOMAC function, flexion) postinjection. Apart from a higher incidence of injection site pain, no statistically significant differences versus placebo were noted in the safety profile variables. These data generally support the evidence for the efficacy and safety (versus placebo) of the HA class of intervention.
Authors' conclusions
Implications for practice.
The review presented is comprehensive and permits practitioners to more fully consider the therapeutic profile of HA products. Each analysis addresses a different issue, and practitioners are recommended to review those analyses specifically relating to their questions. This should involve examining the original publication, the methodology employed in conducting the review, the results for the product(s) of interest, with attention to the relevant variables and timepoints. Readers should consider the clinical importance as well as the statistical significance of any differences detected. Readers should be aware that the results of our review derive from a defined approach to the analysis of selected studies, that selected studies vary in quality and that the analyses do not consider studies excluded from consideration. Nevertheless, the approach is traditional, follows Cochrane guidelines and uses RevMan 4.2 software.
Controversy in the existing literature is part due to a combination of the heterogeneous time‐dependant nature of the response to the HA class of products, diversity in protocol design in the contributing studies, and the different approaches taken to the conduct of systematic reviews. We have attempted to dissect out the effect of these issues by performing multiple analyses on a by‐product, by‐comparison, by‐variable, by‐timepoint basis. While this does not provide a single answer to questions of efficacy, effectiveness and safety, the analyses permit the complexity of the HA effect to be appreciated.
The analyses suggest that there is considerable heterogeneity in the clinical response, such that there are differential therapeutic effects by different HA products, on different variables and that the response is time dependent. For example, when pain on weight bearing at 5 to 13 weeks postinjection is considered the evidence is very supportive of therapeutic benefit over placebo, and the effect size (SRM) may be as high as 0.94 depending on the product and is 0.61 for the HA class in general. Given that effect sizes can be classified as small (0.2), medium (0.5) or large (0.8), these analyses suggest a range of effect sizes up to large product‐based effect on pain on weight bearing, and a moderate class‐based effect on pain on weight bearing.
The dynamics of the response are such that a statistically significant, clinically important, effect 1 to 4 weeks postinjection versus placebo is not necessarily achievable, but should be evident by the 5 to 13 week time point. Nevertheless, early responses are observed in some comparisons. In contrast, in comparisons against placebo there may be a more durable, albeit slower response compared to IA corticosteroids. In long‐term studies, the effects of combining single course with repeat treatment studies in our analyses deserve due consideration, particularly when reviewing the late stage endpoints, for example 45 to 52 weeks. In single course studies the last course may have been almost one year prior when a persisting effect might not be expected, while in repeat‐course studies the last course may have been recent, or even 5 to 13 weeks prior, when a clinical benefit might well be anticipated. These nuances deserve due recognition since they account for some of the diversity in the responses reported in the literature.
These issues notwithstanding, HA products generally appear superior to placebo on multiple efficacy variables, providing support for the use of those HA products for which the effect is not only statistically significant but also clinically important. These benefits appear to be achievable without attributable systemic adverse events but with occasional local reactions which tend, for the most part, to be relatively transient, resolving without sequelae either spontaneously or with simple intervention. It should be noted that this review is not the premier source of safety data, since sample sizes are relatively small in the trials reported, particularly for detecting less frequent or even rare adverse events. Readers are referred to the general literature and the surveillance literature for a more comprehensive appreciation of safety issues. Nevertheless, based on the evidence reviewed, HA products appear in general to be safe.
Implications for research.
The following types of studies would be informative: long‐term trials (up to one year) including repeat course studies, head‐to‐head comparisons of different HA products, effectiveness, cost‐effectiveness and cost‐utility studies, studies of different OA subgroups, dissection of the determinants of the response to HA products, exploration of the apparently differential effect of HA products on different variables. The aforementioned studies should follow OARSI and other similar guidelines for the conduct and design of OA studies. The use of standardized outcome measures is encouraged to facilitate meta‐analyses and between trial comparisons.
Feedback
New feedback, 21 September 2014
Summary
Date of Submission: 21‐Sep‐2014 Name: Jos Verbeek Email Address: jos.verbeek@ttl.fi Affiliation: Finnish Institute of Occupational Health Role: senior researcher Comment: I promised a friend to find out about Hyalgan proposed by a doctor for his osteoarthritic knee. I would like to give my friend an estimate of the reduction in pain that he could expect from the injections. I was impressed by the conclusion of the review: overall, these analyses strongly support the evidence for efficacy of Hyalgan. It took me several hours to find my way through the 673 pages of the review where the text lacks links to the analyses. I was surprised to find the data not being in concordance with the strong conclusions. At three months follow‐up, in ten trials, the median pain level on weight bearing was 43 out of 100 in the control group and the pooled mean difference 6.2. This means that the pain level decreased with 15% as a result of the injections. At one year follow‐up there is no significant difference anymore. Given that the review is sponsored by the pharmaceutical industry producing the very product and that there are two more recent reviews, as mentioned by Hilda Bastian in her comment in Pubmed commons (see altmetrics), with conclusions opposite to this review, I strongly believe that the authors’ conclusions are wrong and that they should amend their conclusions or that this review should be retracted. Based on the data presented above, my friend thought that it would be wise not to take these injections, and I fully agree. I agree with the conflict of interest statement below: I certify that I have no affiliations with or involvement in any organization or entity with a financial interest in the subject matter of my feedback.
Reply
Dear Jos, Thank you for this feedback. We have a new author team working on an update of this review and have shared this feedback with them. The updated review is expected by December 2015. We appreciate you taking the time to send us these comments. Thanks and best wishes, Lara Maxwell, Cochrane Musculoskeletal Group, Co‐Managing Editor
Contributors
Lara Maxwell, Cochrane Musculoskeletal Group, Co‐Managing Editor, on behalf of the CMSG co‐ordinating editors
What's new
| Date | Event | Description |
|---|---|---|
| 6 November 2014 | Amended | Updated with Feedback and editorial response |
| 6 November 2014 | Feedback has been incorporated | Updated with Feedback and editorial response |
History
Protocol first published: Issue 2, 1998 Review first published: Issue 2, 2005
| Date | Event | Description |
|---|---|---|
| 10 November 2008 | Amended | Converted to new review format. CMSG ID: A018‐R |
Notes
This update was required as the Cochrane Funding Arbitration Panel ruled that the original review contravened the "current" sponsorship policy. In order to have the review reinstated into the Cochrane Library, the review was updated using no commercial sources of support and the electronic literature search was updated (Medline). The financial support for the original review is now disclosed in the "conflict of interest" statement. This update includes 16 "new" RCT: Altman 2004, Atamaz (accepted for publication), Cubukcu 2005, Huang 2005, Karatay 2004, Karatosun 2005, Karatosun 2005a, Kirchner 2006, Kotevoglu 2005, Neustadt 2005, Ozturk 2005, Pham 2004, Rejaili 2005, Sezgin 2005, Wu 2004, and Yentur 2003. In the original review, only limited information was included for three of the "new" RCT based on the following abstracts: Ardic 2001 (Cubukcu 2005), Pham 2003 (Pham 2004), and Thompson 2002 (Kirchner 2006).
Acknowledgements
The authors are grateful to Jessie McGowan for conducting the search strategy. We acknowledge the translation of the Wu 2004 article by Dr. Hua Qian, MD, PhD, The Robarts Research Institute, The University of Western Ontario. We acknowledge the assistance of former Musculoskeletal Review Group Co‐ordinator Maria Judd and current Musculoskeletal Review Group Co‐ordinator Lara Maxwell for their guidance in completing this review.
Appendices
Appendix 1. Search strategy
1 osteoarthritis.tw,sh. 2 knee joint/ 3 knee.tw,sh. 4 1 and (2 or 3) 5 osteoarthritis, knee/ 6 4 or 5 7 hyaluronic.sh,tw,rn. 8 hyaluronan.tw. 9 sodium hyaluronate.tw. 10 (hylan or healonid).tw. 11 (hyalgan or hylectin or hyalflex).tw. 12 (hylartil or replasyn or suplasyn).tw. 13 (polyreumin or polireumin).tw. 14 nrd 101.tw 15 (artz or artzal).tw. 16 slm 10.tw. 17 (neovisc or orthovisc).tw. 18 adant.tw. 19 etapharm.tw. 20 or/7‐19 21 6 and 20 22 clinical trial.pt. 23 randomized controlled trial.pt. 24 tu.fs. 25 dt.fs. 26 random$.tw. 27 (double adj blind$).tw. 28 placebo$.tw. 29 (single adj blind$).tw. 30 random allocation.tw. 31 or/22‐30 32 21 and 31 33 meta‐analysis.pt,sh. 34 (meta‐anal: or metaanal:).tw. 35 (quantitativ: review: or quantitativ: overv 36 (methodologic: review: or methodologic: ove 37 (systematic: review: or systematic: overvie 38 review.pt. and medline.tw. 39 or/33‐38 40 21 and 39 41 32 or 40 42 limit 41 to human
Data and analyses
Comparison 1. Adant versus Hyalgan.
| Outcome or subgroup title | No. of studies | No. of participants | Statistical method | Effect size |
|---|---|---|---|---|
| 1 Patient global assessment (number of patients excellent/good) | 1 | Risk Ratio (M‐H, Fixed, 95% CI) | Subtotals only | |
| 1.1 1 to 4 weeks post‐injection | 1 | 49 | Risk Ratio (M‐H, Fixed, 95% CI) | 1.18 [0.57, 2.41] |
| 1.2 5 to 13 weeks post‐injection | 1 | 49 | Risk Ratio (M‐H, Fixed, 95% CI) | 2.38 [0.93, 6.09] |
| 1.3 14 to 26 weeks post‐injection | 1 | 49 | Risk Ratio (M‐H, Fixed, 95% CI) | 2.11 [0.67, 6.70] |
| 2 Safety: number of painful injections | 1 | Risk Ratio (M‐H, Fixed, 95% CI) | Subtotals only | |
| 2.1 1 to 4 weeks post‐injection | 1 | 49 | Risk Ratio (M‐H, Fixed, 95% CI) | 1.9 [0.43, 8.46] |
1.1. Analysis.
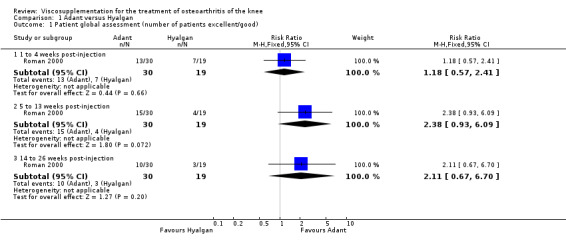
Comparison 1 Adant versus Hyalgan, Outcome 1 Patient global assessment (number of patients excellent/good).
1.2. Analysis.
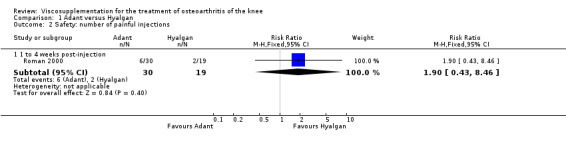
Comparison 1 Adant versus Hyalgan, Outcome 2 Safety: number of painful injections.
Comparison 2. Artz versus placebo.
| Outcome or subgroup title | No. of studies | No. of participants | Statistical method | Effect size |
|---|---|---|---|---|
| 1 Pain (100 mm VAS) | 3 | Mean Difference (IV, Fixed, 95% CI) | Subtotals only | |
| 1.1 1 to 4 weeks post‐injection | 3 | 507 | Mean Difference (IV, Fixed, 95% CI) | 0.56 [‐3.83, 4.94] |
| 1.2 5 to 13 weeks post‐injection | 3 | 507 | Mean Difference (IV, Fixed, 95% CI) | ‐4.55 [‐9.09, ‐0.00] |
| 1.3 14 to 26 weeks post‐injection | 2 | 312 | Mean Difference (IV, Fixed, 95% CI) | ‐0.42 [‐6.90, 6.06] |
| 2 Pain score (0‐3) | 1 | Mean Difference (IV, Fixed, 95% CI) | Subtotals only | |
| 2.1 1 to 4 weeks post ‐injection | 1 | 98 | Mean Difference (IV, Fixed, 95% CI) | ‐0.07 [‐0.28, 0.14] |
| 3 WOMAC pain (0‐20 Likert) | 1 | Mean Difference (IV, Fixed, 95% CI) | Subtotals only | |
| 3.1 5 to 13 weeks post‐injection | 1 | 223 | Mean Difference (IV, Fixed, 95% CI) | ‐0.77 [‐1.61, 0.07] |
| 4 WOMAC function (0‐68 Likert) | 1 | Mean Difference (IV, Fixed, 95% CI) | Subtotals only | |
| 4.1 5 to 13 weeks post‐injection | 1 | 223 | Mean Difference (IV, Fixed, 95% CI) | ‐2.44 [‐5.33, 0.45] |
| 5 Lequesne Index (0‐24) | 3 | Mean Difference (IV, Fixed, 95% CI) | Subtotals only | |
| 5.1 1 to 4 weeks post‐injection | 1 | 195 | Mean Difference (IV, Fixed, 95% CI) | 0.19 [‐0.85, 1.23] |
| 5.2 5 to 13 weeks post‐injection | 1 | 195 | Mean Difference (IV, Fixed, 95% CI) | ‐0.36 [‐1.40, 0.68] |
| 5.3 14 to 26 weeks post‐injection | 2 | 397 | Mean Difference (IV, Fixed, 95% CI) | 0.51 [‐0.43, 1.45] |
| 6 Range of motion | 1 | Mean Difference (IV, Fixed, 95% CI) | Subtotals only | |
| 7 Patient global assessment (number of patients improved) | 4 | Risk Ratio (M‐H, Fixed, 95% CI) | Subtotals only | |
| 7.1 1 to 4 weeks post‐injection | 3 | 495 | Risk Ratio (M‐H, Fixed, 95% CI) | 1.17 [1.04, 1.32] |
| 7.2 5 to 13 weeks post‐injection | 2 | 384 | Risk Ratio (M‐H, Fixed, 95% CI) | 1.07 [0.95, 1.21] |
| 7.3 14 to 26 weeks post‐injection | 1 | 189 | Risk Ratio (M‐H, Fixed, 95% CI) | 1.31 [1.00, 1.72] |
| 8 WOMAC stiffness (0‐8 Likert) | 1 | Mean Difference (IV, Fixed, 95% CI) | Subtotals only | |
| 8.1 5 to 13 weeks post‐injection | 1 | 223 | Mean Difference (IV, Fixed, 95% CI) | ‐0.35 [‐0.73, 0.03] |
| 9 Number of survivors (patients not requiring additional treatment for study knee) 45 to 52 weeks post‐injection | 1 | Risk Ratio (M‐H, Fixed, 95% CI) | Subtotals only | |
| 10 Number of clinical failures | 1 | Risk Ratio (M‐H, Fixed, 95% CI) | Subtotals only | |
| 10.1 14 to 26 weeks post‐injection | 1 | 156 | Risk Ratio (M‐H, Fixed, 95% CI) | 0.21 [0.04, 0.98] |
| 10.2 45 to 52 weeks post‐injection | 1 | 114 | Risk Ratio (M‐H, Fixed, 95% CI) | 0.73 [0.49, 1.08] |
| 11 Safety: total withdrawals overall | 5 | Risk Ratio (M‐H, Fixed, 95% CI) | Subtotals only | |
| 11.1 1 to 4 weeks post‐injection | 2 | 330 | Risk Ratio (M‐H, Fixed, 95% CI) | 1.03 [0.48, 2.22] |
| 11.2 5 to 13 weeks post‐injection | 2 | 449 | Risk Ratio (M‐H, Fixed, 95% CI) | 1.06 [0.64, 1.76] |
| 11.3 14 to 26 weeks post‐injection | 1 | 240 | Risk Ratio (M‐H, Fixed, 95% CI) | 0.6 [0.15, 2.45] |
| 12 Safety: number of patients reporting adverse events (45 to 52 weeks post‐ injection) | 1 | Risk Ratio (M‐H, Fixed, 95% CI) | Subtotals only | |
| 13 Safety: withdrawals due to adverse events | 5 | Risk Ratio (M‐H, Fixed, 95% CI) | Subtotals only | |
| 13.1 1 to 4 weeks post‐injection | 2 | 322 | Risk Ratio (M‐H, Fixed, 95% CI) | 0.26 [0.03, 2.28] |
| 13.2 5 to 13 weeks post‐injection | 1 | 223 | Risk Ratio (M‐H, Fixed, 95% CI) | 1.06 [0.07, 16.81] |
| 13.3 14 to 26 weeks post‐injection | 1 | 240 | Risk Ratio (M‐H, Fixed, 95% CI) | 0.4 [0.08, 2.02] |
| 13.4 45 to 52 weeks post‐injection | 1 | 156 | Risk Ratio (M‐H, Fixed, 95% CI) | 0.73 [0.11, 5.07] |
| 14 Safety: number of patients with local adverse reaction but study drug continued | 1 | Risk Ratio (M‐H, Fixed, 95% CI) | Subtotals only | |
| 15 Safety: number of adverse events probably/possibly related to treatment | 3 | Risk Ratio (M‐H, Fixed, 95% CI) | Subtotals only | |
| 15.1 5 to 13 weeks post‐injection | 2 | 432 | Risk Ratio (M‐H, Fixed, 95% CI) | 1.59 [1.12, 2.26] |
| 15.2 45 to 52 weeks post‐injection | 1 | 224 | Risk Ratio (M‐H, Fixed, 95% CI) | 0.53 [0.08, 3.72] |
| 16 Safety: number of serious adverse events (45 to 52 weeks post‐injection) | 1 | Risk Ratio (M‐H, Fixed, 95% CI) | Subtotals only | |
| 17 Safety: total withdrawals overall (knees) | 1 | Risk Ratio (M‐H, Fixed, 95% CI) | Subtotals only | |
| 17.1 5 to 13 weeks post‐injection | 1 | 116 | Risk Ratio (M‐H, Fixed, 95% CI) | 0.40 [0.16, 0.98] |
| 17.2 14 to 26 weeks post‐injection | 1 | 116 | Risk Ratio (M‐H, Fixed, 95% CI) | 0.93 [0.65, 1.34] |
2.1. Analysis.
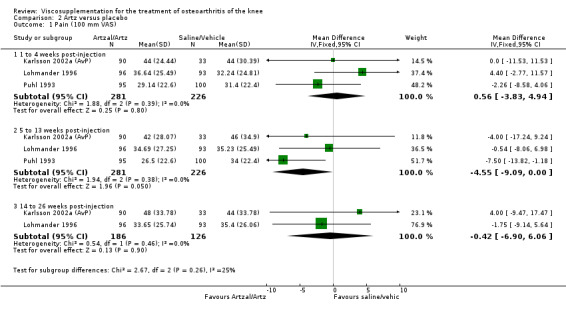
Comparison 2 Artz versus placebo, Outcome 1 Pain (100 mm VAS).
2.2. Analysis.

Comparison 2 Artz versus placebo, Outcome 2 Pain score (0‐3).
2.3. Analysis.
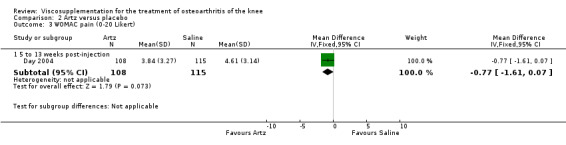
Comparison 2 Artz versus placebo, Outcome 3 WOMAC pain (0‐20 Likert).
2.4. Analysis.
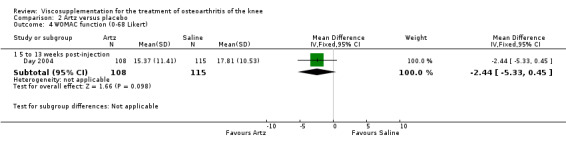
Comparison 2 Artz versus placebo, Outcome 4 WOMAC function (0‐68 Likert).
2.5. Analysis.
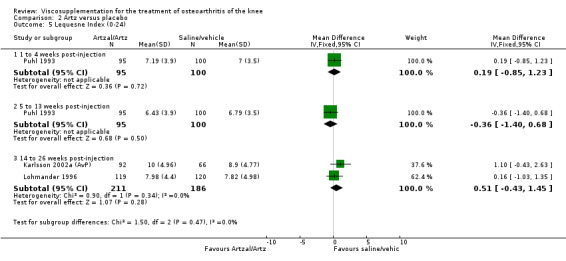
Comparison 2 Artz versus placebo, Outcome 5 Lequesne Index (0‐24).
2.6. Analysis.

Comparison 2 Artz versus placebo, Outcome 6 Range of motion.
2.7. Analysis.
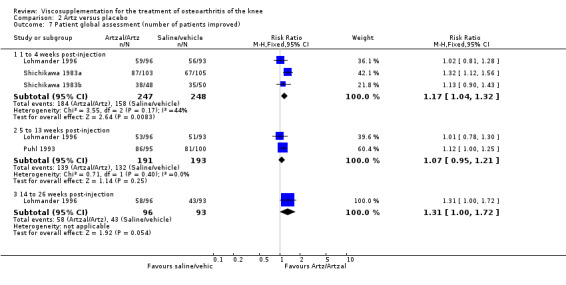
Comparison 2 Artz versus placebo, Outcome 7 Patient global assessment (number of patients improved).
2.8. Analysis.

Comparison 2 Artz versus placebo, Outcome 8 WOMAC stiffness (0‐8 Likert).
2.9. Analysis.
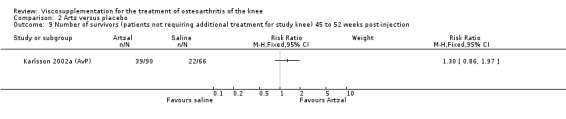
Comparison 2 Artz versus placebo, Outcome 9 Number of survivors (patients not requiring additional treatment for study knee) 45 to 52 weeks post‐injection.
2.10. Analysis.
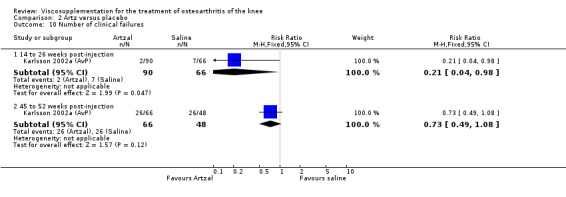
Comparison 2 Artz versus placebo, Outcome 10 Number of clinical failures.
2.11. Analysis.

Comparison 2 Artz versus placebo, Outcome 11 Safety: total withdrawals overall.
2.12. Analysis.
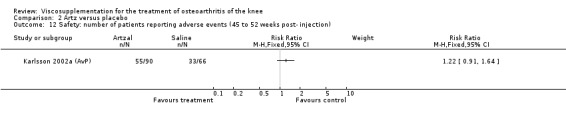
Comparison 2 Artz versus placebo, Outcome 12 Safety: number of patients reporting adverse events (45 to 52 weeks post‐ injection).
2.13. Analysis.
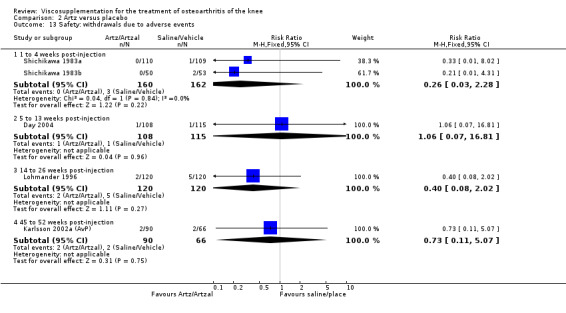
Comparison 2 Artz versus placebo, Outcome 13 Safety: withdrawals due to adverse events.
2.14. Analysis.

Comparison 2 Artz versus placebo, Outcome 14 Safety: number of patients with local adverse reaction but study drug continued.
2.15. Analysis.
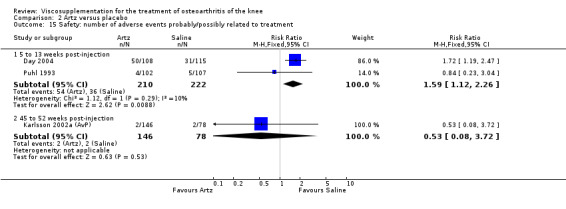
Comparison 2 Artz versus placebo, Outcome 15 Safety: number of adverse events probably/possibly related to treatment.
2.16. Analysis.

Comparison 2 Artz versus placebo, Outcome 16 Safety: number of serious adverse events (45 to 52 weeks post‐injection).
2.17. Analysis.
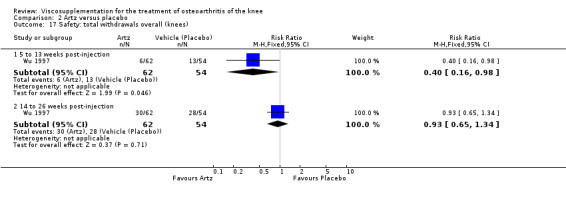
Comparison 2 Artz versus placebo, Outcome 17 Safety: total withdrawals overall (knees).
Comparison 3. Artzal versus Hylan G‐F 20 (Also see Hylan G‐F 20 versus hyaluronan, NRD‐101 versus Artz, SLM‐10 versus Artz).
| Outcome or subgroup title | No. of studies | No. of participants | Statistical method | Effect size |
|---|---|---|---|---|
| 1 Pain on weight bearing (0‐100 mm VAS) | 1 | Mean Difference (IV, Fixed, 95% CI) | Subtotals only | |
| 1.1 1 to 4 weeks post‐injection | 1 | 176 | Mean Difference (IV, Fixed, 95% CI) | ‐1.0 [‐8.41, 6.41] |
| 1.2 5 to 13 weeks post‐injection | 1 | 176 | Mean Difference (IV, Fixed, 95% CI) | 1.0 [‐7.83, 9.83] |
| 1.3 14 to 26 weeks post‐injection | 1 | 176 | Mean Difference (IV, Fixed, 95% CI) | 5.0 [‐4.98, 14.98] |
| 2 Lequesne Index (0‐24) | 1 | Mean Difference (IV, Fixed, 95% CI) | Subtotals only | |
| 2.1 1 to 4 weeks post‐injection | 0 | 0 | Mean Difference (IV, Fixed, 95% CI) | 0.0 [0.0, 0.0] |
| 2.2 5 to 13 weeks post‐injection | 0 | 0 | Mean Difference (IV, Fixed, 95% CI) | 0.0 [0.0, 0.0] |
| 2.3 14 to 26 weeks post‐injection | 1 | 180 | Mean Difference (IV, Fixed, 95% CI) | 1.0 [‐0.37, 2.37] |
| 3 Number of clinical failures | 1 | Risk Ratio (M‐H, Fixed, 95% CI) | Subtotals only | |
| 3.1 14 to 26 weeks post‐injection | 1 | 176 | Risk Ratio (M‐H, Fixed, 95% CI) | 0.32 [0.07, 1.54] |
| 3.2 45 to 52 weeks post‐injection | 1 | 136 | Risk Ratio (M‐H, Fixed, 95% CI) | 0.86 [0.58, 1.28] |
| 4 Number of survivors (patients not requiring additional treatment for study knee) (45 to 52 weeks post‐injectio | 1 | Risk Ratio (M‐H, Fixed, 95% CI) | Subtotals only | |
| 5 Safety: number of patients withdrawn due to adverse events (45 to 52 weeks post‐injection) | 1 | Risk Ratio (M‐H, Fixed, 95% CI) | Subtotals only | |
| 6 Safety: number of adverse events related to treatment (45 to 52 weeks post‐ injection) | 1 | Risk Ratio (M‐H, Fixed, 95% CI) | Subtotals only | |
| 7 Safety: number of patients reporting adverse events (45 to 52 weeks post‐ injection) | 1 | Risk Ratio (M‐H, Fixed, 95% CI) | Subtotals only |
3.1. Analysis.

Comparison 3 Artzal versus Hylan G‐F 20 (Also see Hylan G‐F 20 versus hyaluronan, NRD‐101 versus Artz, SLM‐10 versus Artz), Outcome 1 Pain on weight bearing (0‐100 mm VAS).
3.2. Analysis.
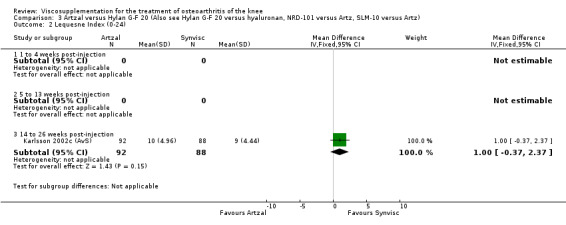
Comparison 3 Artzal versus Hylan G‐F 20 (Also see Hylan G‐F 20 versus hyaluronan, NRD‐101 versus Artz, SLM‐10 versus Artz), Outcome 2 Lequesne Index (0‐24).
3.3. Analysis.
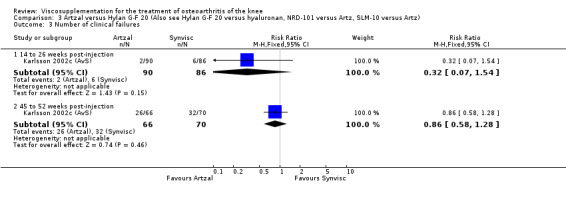
Comparison 3 Artzal versus Hylan G‐F 20 (Also see Hylan G‐F 20 versus hyaluronan, NRD‐101 versus Artz, SLM‐10 versus Artz), Outcome 3 Number of clinical failures.
3.4. Analysis.

Comparison 3 Artzal versus Hylan G‐F 20 (Also see Hylan G‐F 20 versus hyaluronan, NRD‐101 versus Artz, SLM‐10 versus Artz), Outcome 4 Number of survivors (patients not requiring additional treatment for study knee) (45 to 52 weeks post‐injectio.
3.5. Analysis.
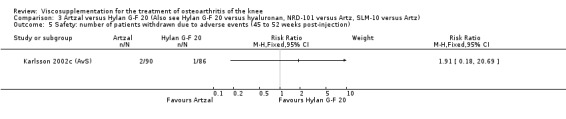
Comparison 3 Artzal versus Hylan G‐F 20 (Also see Hylan G‐F 20 versus hyaluronan, NRD‐101 versus Artz, SLM‐10 versus Artz), Outcome 5 Safety: number of patients withdrawn due to adverse events (45 to 52 weeks post‐injection).
3.6. Analysis.
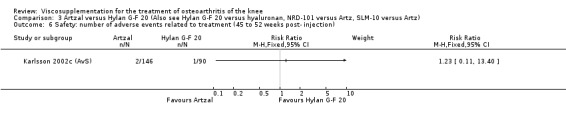
Comparison 3 Artzal versus Hylan G‐F 20 (Also see Hylan G‐F 20 versus hyaluronan, NRD‐101 versus Artz, SLM‐10 versus Artz), Outcome 6 Safety: number of adverse events related to treatment (45 to 52 weeks post‐ injection).
3.7. Analysis.
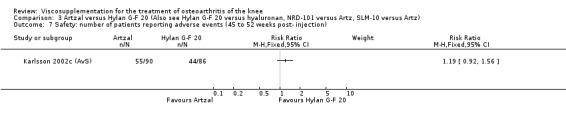
Comparison 3 Artzal versus Hylan G‐F 20 (Also see Hylan G‐F 20 versus hyaluronan, NRD‐101 versus Artz, SLM‐10 versus Artz), Outcome 7 Safety: number of patients reporting adverse events (45 to 52 weeks post‐ injection).
Comparison 4. BioHy (Arthrease, Euflexxa) versus placebo.
| Outcome or subgroup title | No. of studies | No. of participants | Statistical method | Effect size |
|---|---|---|---|---|
| 1 Safety: total withdrawals overall | 1 | Risk Ratio (M‐H, Fixed, 95% CI) | Subtotals only | |
| 1.1 14 to 26 weeks post‐injection | 1 | 49 | Risk Ratio (M‐H, Fixed, 95% CI) | 0.72 [0.18, 2.89] |
| 2 Safety: number of adverse events for injection site pain | 1 | Risk Ratio (M‐H, Fixed, 95% CI) | Subtotals only | |
| 2.1 14 to 26 weeks post‐injection | 1 | 49 | Risk Ratio (M‐H, Fixed, 95% CI) | 1.57 [0.95, 2.59] |
4.1. Analysis.
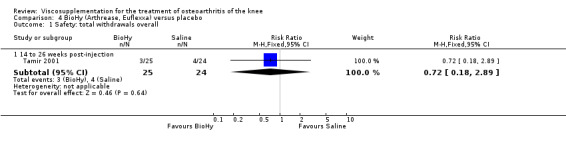
Comparison 4 BioHy (Arthrease, Euflexxa) versus placebo, Outcome 1 Safety: total withdrawals overall.
4.2. Analysis.

Comparison 4 BioHy (Arthrease, Euflexxa) versus placebo, Outcome 2 Safety: number of adverse events for injection site pain.
Comparison 5. BioHy (Arthrease, Euflexxa) versus Hylan G‐F 20 (Synvisc).
| Outcome or subgroup title | No. of studies | No. of participants | Statistical method | Effect size |
|---|---|---|---|---|
| 1 WOMAC pain (0‐100 mm VAS) | 1 | Mean Difference (IV, Fixed, 95% CI) | Subtotals only | |
| 1.1 1 to 4 weeks post‐injection | 1 | 321 | Mean Difference (IV, Fixed, 95% CI) | ‐3.70 [‐8.13, 0.73] |
| 1.2 5 to 13 weeks post‐injection | 1 | 321 | Mean Difference (IV, Fixed, 95% CI) | ‐3.80 [‐8.10, 0.50] |
| 2 WOMAC physical function (0‐100 mm VAS) | 1 | Mean Difference (IV, Fixed, 95% CI) | Subtotals only | |
| 2.1 1 to 4 weeks post‐injection | 1 | 317 | Mean Difference (IV, Fixed, 95% CI) | ‐5.10 [‐9.54, ‐0.66] |
| 2.2 5 to 13 weeks post‐injection | 1 | 315 | Mean Difference (IV, Fixed, 95% CI) | ‐5.40 [‐9.83, ‐0.97] |
| 3 WOMAC stiffness (0‐100 mm VAS) | 1 | Mean Difference (IV, Fixed, 95% CI) | Subtotals only | |
| 3.1 1 to 4 weeks post‐injection | 1 | 317 | Mean Difference (IV, Fixed, 95% CI) | ‐3.0 [‐7.44, 1.44] |
| 3.2 5 to 13 weeks post‐injection | 1 | 315 | Mean Difference (IV, Fixed, 95% CI) | ‐3.80 [‐8.23, 0.63] |
| 4 WOMAC pain (number of patients symptom free: VAS score below 20 mm) | 1 | Risk Ratio (M‐H, Fixed, 95% CI) | Subtotals only | |
| 4.1 5 to 13 weeks post‐injection | 1 | 321 | Risk Ratio (M‐H, Fixed, 95% CI) | 1.21 [1.00, 1.46] |
| 5 WOMAC function (number of patients symptom free: VAS score below 20 mm) | 1 | Risk Ratio (M‐H, Fixed, 95% CI) | Subtotals only | |
| 5.1 5 to 13 weeks post‐injection | 1 | 315 | Risk Ratio (M‐H, Fixed, 95% CI) | 1.36 [1.11, 1.66] |
| 6 Patient assessment of treatment (number of patients very satisfied or satisfied) | 1 | Risk Ratio (M‐H, Fixed, 95% CI) | Subtotals only | |
| 6.1 5 to 13 weeks post‐injection | 1 | 315 | Risk Ratio (M‐H, Fixed, 95% CI) | 1.07 [0.96, 1.21] |
| 7 Rescue medication usage (number of patients using acetaminophen) | 1 | Risk Ratio (M‐H, Fixed, 95% CI) | Subtotals only | |
| 7.1 1 to 4 weeks post‐injection | 1 | 314 | Risk Ratio (M‐H, Fixed, 95% CI) | 0.72 [0.57, 0.91] |
| 7.2 5 to 13 weeks post‐injection | 1 | 309 | Risk Ratio (M‐H, Fixed, 95% CI) | 0.71 [0.56, 0.89] |
| 7.3 During the trial | 1 | 320 | Risk Ratio (M‐H, Fixed, 95% CI) | 0.83 [0.71, 0.97] |
| 8 Safety: total withdrawals overall | 1 | Risk Ratio (M‐H, Fixed, 95% CI) | Subtotals only | |
| 9 Safety: withdrawals due to adverse events | 1 | Risk Ratio (M‐H, Fixed, 95% CI) | Subtotals only | |
| 10 Safety: withdrawals due to lack of efficacy | 1 | Risk Ratio (M‐H, Fixed, 95% CI) | Subtotals only | |
| 11 Safety: number of patients with serious adverse events | 1 | Risk Ratio (M‐H, Fixed, 95% CI) | Subtotals only | |
| 12 Safety: number of patients with joint effusion | 1 | Risk Ratio (M‐H, Fixed, 95% CI) | Subtotals only | |
| 13 Safety: number of patients reporting adverse events | 1 | Risk Ratio (M‐H, Fixed, 95% CI) | Subtotals only |
5.1. Analysis.

Comparison 5 BioHy (Arthrease, Euflexxa) versus Hylan G‐F 20 (Synvisc), Outcome 1 WOMAC pain (0‐100 mm VAS).
5.2. Analysis.
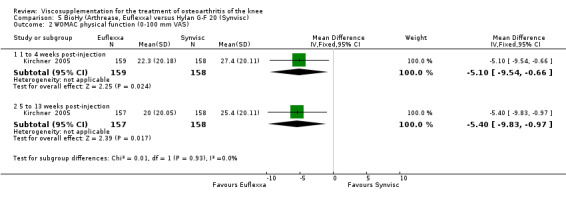
Comparison 5 BioHy (Arthrease, Euflexxa) versus Hylan G‐F 20 (Synvisc), Outcome 2 WOMAC physical function (0‐100 mm VAS).
5.3. Analysis.
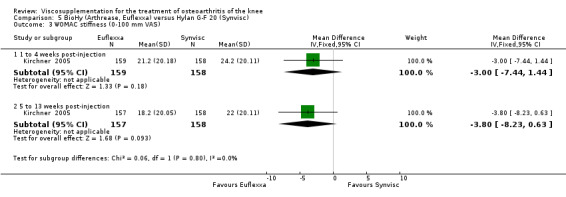
Comparison 5 BioHy (Arthrease, Euflexxa) versus Hylan G‐F 20 (Synvisc), Outcome 3 WOMAC stiffness (0‐100 mm VAS).
5.4. Analysis.
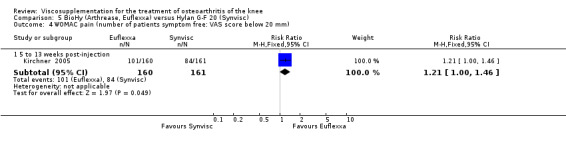
Comparison 5 BioHy (Arthrease, Euflexxa) versus Hylan G‐F 20 (Synvisc), Outcome 4 WOMAC pain (number of patients symptom free: VAS score below 20 mm).
5.5. Analysis.
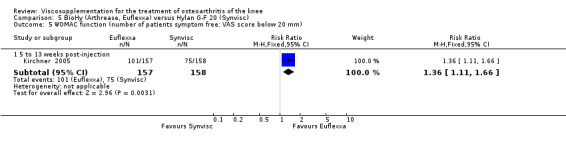
Comparison 5 BioHy (Arthrease, Euflexxa) versus Hylan G‐F 20 (Synvisc), Outcome 5 WOMAC function (number of patients symptom free: VAS score below 20 mm).
5.6. Analysis.

Comparison 5 BioHy (Arthrease, Euflexxa) versus Hylan G‐F 20 (Synvisc), Outcome 6 Patient assessment of treatment (number of patients very satisfied or satisfied).
5.7. Analysis.
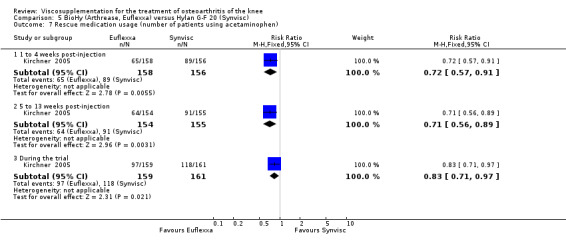
Comparison 5 BioHy (Arthrease, Euflexxa) versus Hylan G‐F 20 (Synvisc), Outcome 7 Rescue medication usage (number of patients using acetaminophen).
5.8. Analysis.

Comparison 5 BioHy (Arthrease, Euflexxa) versus Hylan G‐F 20 (Synvisc), Outcome 8 Safety: total withdrawals overall.
5.9. Analysis.
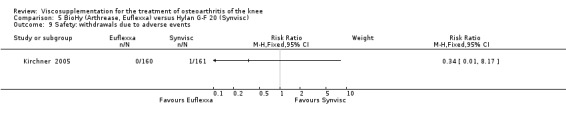
Comparison 5 BioHy (Arthrease, Euflexxa) versus Hylan G‐F 20 (Synvisc), Outcome 9 Safety: withdrawals due to adverse events.
5.10. Analysis.
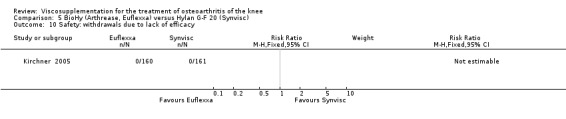
Comparison 5 BioHy (Arthrease, Euflexxa) versus Hylan G‐F 20 (Synvisc), Outcome 10 Safety: withdrawals due to lack of efficacy.
5.11. Analysis.

Comparison 5 BioHy (Arthrease, Euflexxa) versus Hylan G‐F 20 (Synvisc), Outcome 11 Safety: number of patients with serious adverse events.
5.12. Analysis.
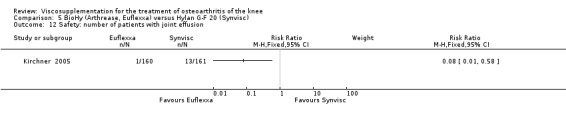
Comparison 5 BioHy (Arthrease, Euflexxa) versus Hylan G‐F 20 (Synvisc), Outcome 12 Safety: number of patients with joint effusion.
5.13. Analysis.
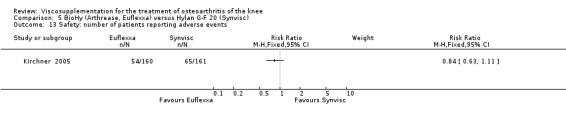
Comparison 5 BioHy (Arthrease, Euflexxa) versus Hylan G‐F 20 (Synvisc), Outcome 13 Safety: number of patients reporting adverse events.
Comparison 6. Durolane versus placebo.
| Outcome or subgroup title | No. of studies | No. of participants | Statistical method | Effect size |
|---|---|---|---|---|
| 1 Responder: reduction in the WOMAC pain score of at least 40% with an absolute improvement of at least 5 points | 2 | Risk Ratio (M‐H, Fixed, 95% CI) | Subtotals only | |
| 1.1 Week 2 | 1 | 346 | Risk Ratio (M‐H, Fixed, 95% CI) | 0.80 [0.59, 1.09] |
| 1.2 Week 6 | 1 | 346 | Risk Ratio (M‐H, Fixed, 95% CI) | 1.23 [0.91, 1.66] |
| 1.3 Week 13 | 1 | 346 | Risk Ratio (M‐H, Fixed, 95% CI) | 0.91 [0.68, 1.23] |
| 1.4 Week 26 | 1 | 346 | Risk Ratio (M‐H, Fixed, 95% CI) | 0.90 [0.66, 1.24] |
| 2 Responder: patients only with knee OA, reduction in WOMAC pain score of at least 40%, abs improvement 5 points | 1 | Risk Ratio (M‐H, Fixed, 95% CI) | Subtotals only | |
| 2.1 Week 2 | 1 | 216 | Risk Ratio (M‐H, Fixed, 95% CI) | 0.97 [0.67, 1.40] |
| 2.2 Week 6 | 1 | 216 | Risk Ratio (M‐H, Fixed, 95% CI) | 1.53 [1.05, 2.23] |
| 2.3 Week 13 | 1 | 216 | Risk Ratio (M‐H, Fixed, 95% CI) | 1.08 [0.74, 1.56] |
| 2.4 Week 26 | 1 | 216 | Risk Ratio (M‐H, Fixed, 95% CI) | 0.96 [0.65, 1.42] |
| 3 WOMAC pain (change from baseline; 0 to 20 Likert) | 2 | Mean Difference (IV, Fixed, 95% CI) | Subtotals only | |
| 3.1 Week 2 | 1 | 346 | Mean Difference (IV, Fixed, 95% CI) | 0.74 [0.02, 1.46] |
| 3.2 Week 6 | 1 | 346 | Mean Difference (IV, Fixed, 95% CI) | 0.24 [‐0.57, 1.05] |
| 3.3 Week 13 | 1 | 346 | Mean Difference (IV, Fixed, 95% CI) | 0.55 [‐0.30, 1.40] |
| 3.4 Week 26 | 1 | 346 | Mean Difference (IV, Fixed, 95% CI) | 0.39 [‐0.47, 1.25] |
| 4 WOMAC stiffness (change from baseline; 0 to 8 Likert) | 2 | Mean Difference (IV, Fixed, 95% CI) | Subtotals only | |
| 4.1 Week 2 | 1 | 346 | Mean Difference (IV, Fixed, 95% CI) | 0.51 [0.16, 0.86] |
| 4.2 Week 6 | 1 | 346 | Mean Difference (IV, Fixed, 95% CI) | 0.16 [‐0.20, 0.52] |
| 4.3 Week 13 | 1 | 346 | Mean Difference (IV, Fixed, 95% CI) | 0.34 [‐0.06, 0.74] |
| 4.4 Week 26 | 1 | 346 | Mean Difference (IV, Fixed, 95% CI) | 0.35 [‐0.04, 0.74] |
| 5 WOMAC physical function (change from baseline; 0 to 68 Likert) | 1 | Mean Difference (IV, Fixed, 95% CI) | Subtotals only | |
| 5.1 Week 2 | 1 | 346 | Mean Difference (IV, Fixed, 95% CI) | 2.15 [‐0.14, 4.44] |
| 5.2 Week 6 | 1 | 346 | Mean Difference (IV, Fixed, 95% CI) | 1.0 [‐1.58, 3.58] |
| 5.3 Week 13 | 1 | 346 | Mean Difference (IV, Fixed, 95% CI) | 1.74 [‐0.97, 4.45] |
| 5.4 Week 26 | 1 | 346 | Mean Difference (IV, Fixed, 95% CI) | 1.60 [‐1.11, 4.31] |
| 6 Safety: total withdrawals overall | 1 | Risk Ratio (M‐H, Fixed, 95% CI) | Subtotals only | |
| 7 Safety: withdrawals due to inefficacy | 1 | Risk Ratio (M‐H, Fixed, 95% CI) | Subtotals only | |
| 8 Safety: withdrawals due to adverse events | 1 | Risk Ratio (M‐H, Fixed, 95% CI) | Subtotals only | |
| 9 Safety: number of patients affected by device‐related adverse events | 1 | Risk Ratio (M‐H, Fixed, 95% CI) | Subtotals only | |
| 10 Safety: number of patients with adverse events related to injection only | 1 | Risk Ratio (M‐H, Fixed, 95% CI) | Subtotals only | |
| 11 Safety: number of patients with non‐serious treatment‐related adverse events | 1 | Risk Ratio (M‐H, Fixed, 95% CI) | Subtotals only | |
| 12 Safety: number of patients with non‐serious adverse events | 1 | Risk Ratio (M‐H, Fixed, 95% CI) | Subtotals only | |
| 13 Safety: number of patients with treated unrelated adverse events | 1 | Risk Ratio (M‐H, Fixed, 95% CI) | Subtotals only | |
| 14 Safety: number of patients with serious treatment‐unrelated adverse events | 1 | Risk Ratio (M‐H, Fixed, 95% CI) | Subtotals only |
6.1. Analysis.

Comparison 6 Durolane versus placebo, Outcome 1 Responder: reduction in the WOMAC pain score of at least 40% with an absolute improvement of at least 5 points.
6.2. Analysis.
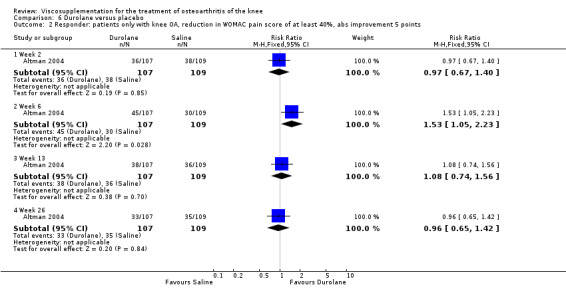
Comparison 6 Durolane versus placebo, Outcome 2 Responder: patients only with knee OA, reduction in WOMAC pain score of at least 40%, abs improvement 5 points.
6.3. Analysis.
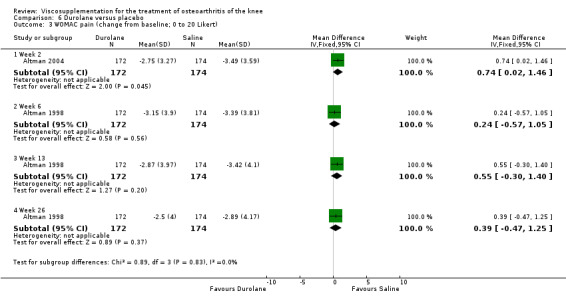
Comparison 6 Durolane versus placebo, Outcome 3 WOMAC pain (change from baseline; 0 to 20 Likert).
6.4. Analysis.
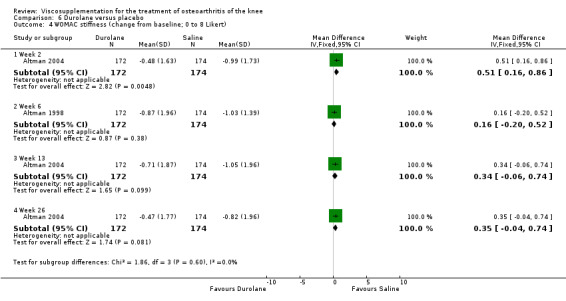
Comparison 6 Durolane versus placebo, Outcome 4 WOMAC stiffness (change from baseline; 0 to 8 Likert).
6.5. Analysis.
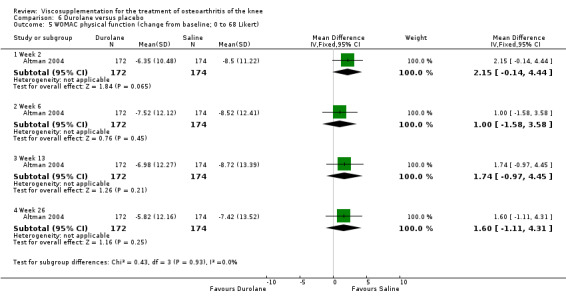
Comparison 6 Durolane versus placebo, Outcome 5 WOMAC physical function (change from baseline; 0 to 68 Likert).
6.6. Analysis.
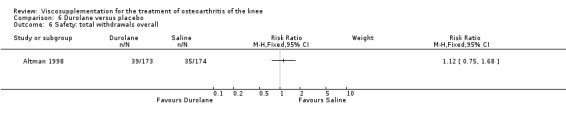
Comparison 6 Durolane versus placebo, Outcome 6 Safety: total withdrawals overall.
6.7. Analysis.

Comparison 6 Durolane versus placebo, Outcome 7 Safety: withdrawals due to inefficacy.
6.8. Analysis.
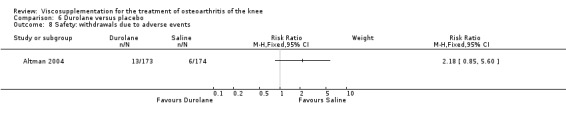
Comparison 6 Durolane versus placebo, Outcome 8 Safety: withdrawals due to adverse events.
6.9. Analysis.

Comparison 6 Durolane versus placebo, Outcome 9 Safety: number of patients affected by device‐related adverse events.
6.10. Analysis.
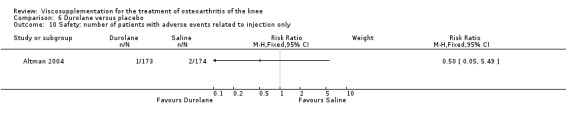
Comparison 6 Durolane versus placebo, Outcome 10 Safety: number of patients with adverse events related to injection only.
6.11. Analysis.
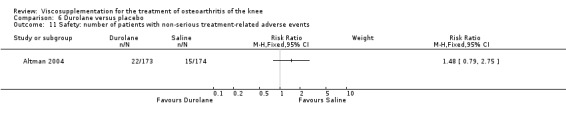
Comparison 6 Durolane versus placebo, Outcome 11 Safety: number of patients with non‐serious treatment‐related adverse events.
6.12. Analysis.
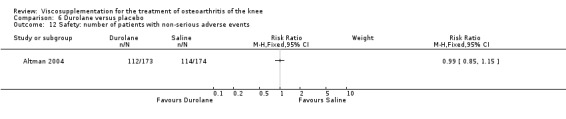
Comparison 6 Durolane versus placebo, Outcome 12 Safety: number of patients with non‐serious adverse events.
6.13. Analysis.

Comparison 6 Durolane versus placebo, Outcome 13 Safety: number of patients with treated unrelated adverse events.
6.14. Analysis.

Comparison 6 Durolane versus placebo, Outcome 14 Safety: number of patients with serious treatment‐unrelated adverse events.
Comparison 7. Fermathron versus Hyalart.
| Outcome or subgroup title | No. of studies | No. of participants | Statistical method | Effect size |
|---|---|---|---|---|
| 1 Pain (0‐100 mm VAS) | 1 | Mean Difference (IV, Fixed, 95% CI) | Subtotals only | |
| 1.1 1 to 4 weeks post‐injection | 1 | 233 | Mean Difference (IV, Fixed, 95% CI) | 2.30 [‐2.84, 7.44] |
| 1.2 5 to13 weeks post‐injection | 1 | 233 | Mean Difference (IV, Fixed, 95% CI) | 0.80 [‐4.51, 6.11] |
| 2 Lequesne Index (0‐24) | 1 | Mean Difference (IV, Fixed, 95% CI) | Subtotals only | |
| 2.1 1 to 4 weeks post‐injection | 1 | 233 | Mean Difference (IV, Fixed, 95% CI) | 0.46 [‐0.59, 1.51] |
| 2.2 5 to 13 weeks post‐injection | 1 | 233 | Mean Difference (IV, Fixed, 95% CI) | 0.55 [‐0.48, 1.58] |
| 3 Patient global assessment (number of patients much better/better) | 1 | Risk Ratio (M‐H, Fixed, 95% CI) | Subtotals only | |
| 3.1 5 to 13 weeks post‐injection | 1 | 252 | Risk Ratio (M‐H, Fixed, 95% CI) | 0.96 [0.82, 1.13] |
| 4 Safety: number of related adverse events | 1 | Risk Ratio (M‐H, Fixed, 95% CI) | Subtotals only | |
| 4.1 5 to 13 weeks post‐injection | 1 | 233 | Risk Ratio (M‐H, Fixed, 95% CI) | 1.47 [0.84, 2.59] |
7.1. Analysis.
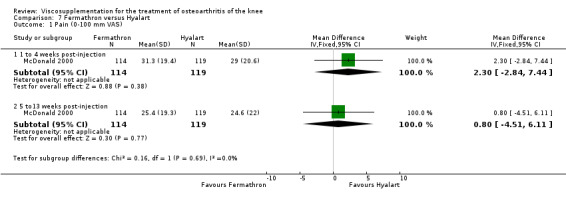
Comparison 7 Fermathron versus Hyalart, Outcome 1 Pain (0‐100 mm VAS).
7.2. Analysis.
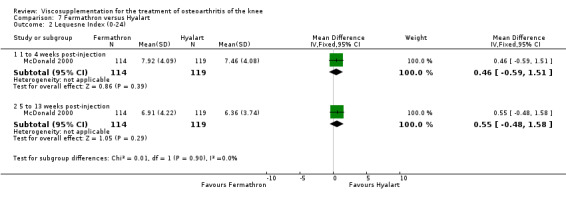
Comparison 7 Fermathron versus Hyalart, Outcome 2 Lequesne Index (0‐24).
7.3. Analysis.
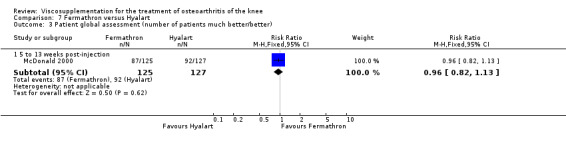
Comparison 7 Fermathron versus Hyalart, Outcome 3 Patient global assessment (number of patients much better/better).
7.4. Analysis.
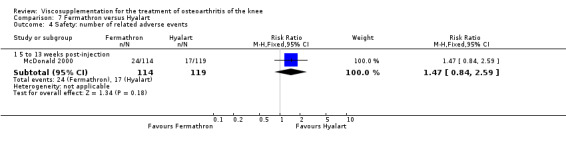
Comparison 7 Fermathron versus Hyalart, Outcome 4 Safety: number of related adverse events.
Comparison 8. Hyalgan versus placebo.
| Outcome or subgroup title | No. of studies | No. of participants | Statistical method | Effect size |
|---|---|---|---|---|
| 1 Pain on weight bearing (walking) (0‐100 mm VAS) | 14 | Mean Difference (IV, Random, 95% CI) | Subtotals only | |
| 1.1 1 to 4 weeks post‐injection | 14 | 1398 | Mean Difference (IV, Random, 95% CI) | ‐6.20 [‐11.02, ‐1.38] |
| 1.2 5 to 13 weeks post‐injection | 10 | 1095 | Mean Difference (IV, Random, 95% CI) | ‐9.04 [‐14.10, ‐3.98] |
| 1.3 14 to 26 weeks post‐injection | 4 | 878 | Mean Difference (IV, Random, 95% CI) | ‐4.57 [‐8.72, ‐0.42] |
| 1.4 45 to 52 weeks post‐injection | 3 | 527 | Mean Difference (IV, Random, 95% CI) | ‐2.60 [‐7.40, 2.19] |
| 2 Pain spontaneous (0‐100 mm VAS) | 2 | Mean Difference (IV, Fixed, 95% CI) | Subtotals only | |
| 2.1 1 to 4 weeks post‐injection | 2 | 73 | Mean Difference (IV, Fixed, 95% CI) | ‐23.88 [‐33.50, ‐14.25] |
| 2.2 5 to 13 weeks post‐injection | 2 | 73 | Mean Difference (IV, Fixed, 95% CI) | ‐21.03 [‐30.26, ‐11.80] |
| 3 Pain at rest (0‐100 mm VAS) | 9 | Mean Difference (IV, Random, 95% CI) | Subtotals only | |
| 3.1 1 to 4 weeks post‐injection | 9 | 400 | Mean Difference (IV, Random, 95% CI) | ‐6.37 [‐11.57, ‐1.18] |
| 3.2 5 to 13 weeks post‐injection | 5 | 155 | Mean Difference (IV, Random, 95% CI) | ‐9.65 [‐14.18, ‐5.13] |
| 3.3 45 to 52 weeks post‐injection | 2 | 120 | Mean Difference (IV, Random, 95% CI) | 1.61 [‐5.28, 8.51] |
| 4 Pain at night (0‐100 mm VAS) | 2 | Mean Difference (IV, Random, 95% CI) | Subtotals only | |
| 4.1 1 to 4 weeks post‐injection | 2 | 84 | Mean Difference (IV, Random, 95% CI) | ‐4.55 [‐12.49, 3.39] |
| 5 WOMAC pain (0‐100 mm VAS) | 1 | Mean Difference (IV, Fixed, 95% CI) | Subtotals only | |
| 5.1 1 to 4 weeks post‐injection | 1 | 189 | Mean Difference (IV, Fixed, 95% CI) | ‐2.67 [‐6.84, 1.50] |
| 5.2 5 to 13 weeks post‐injection | 1 | 177 | Mean Difference (IV, Fixed, 95% CI) | ‐1.49 [‐5.75, 2.77] |
| 5.3 14 to 26 weeks post‐injection | 1 | 176 | Mean Difference (IV, Fixed, 95% CI) | ‐5.66 [‐10.06, ‐1.26] |
| 6 Number of joints improved for walking pain | 2 | Risk Ratio (M‐H, Fixed, 95% CI) | Subtotals only | |
| 6.1 End of treatment | 1 | 37 | Risk Ratio (M‐H, Fixed, 95% CI) | 1.68 [1.02, 2.78] |
| 6.2 1 week post‐injection | 1 | 38 | Risk Ratio (M‐H, Fixed, 95% CI) | 3.6 [1.48, 8.78] |
| 6.3 5 to 13 weeks post‐injection | 1 | 37 | Risk Ratio (M‐H, Fixed, 95% CI) | 2.30 [1.26, 4.19] |
| 7 Number of joints improved for pain under load | 2 | Risk Ratio (M‐H, Fixed, 95% CI) | Subtotals only | |
| 7.1 End of treatment | 1 | 37 | Risk Ratio (M‐H, Fixed, 95% CI) | 2.68 [1.37, 5.25] |
| 7.2 1 week post‐injection | 1 | 38 | Risk Ratio (M‐H, Fixed, 95% CI) | 3.6 [1.48, 8.78] |
| 7.3 5 to 13 weeks post‐injection | 1 | 37 | Risk Ratio (M‐H, Fixed, 95% CI) | 4.03 [1.67, 9.69] |
| 8 Number of knee joints without rest pain | 1 | Risk Ratio (M‐H, Fixed, 95% CI) | Subtotals only | |
| 8.1 1 to 4 weeks post‐injection | 1 | 24 | Risk Ratio (M‐H, Fixed, 95% CI) | 1.2 [0.50, 2.88] |
| 8.2 5 to 13 weeks post‐injection | 1 | 24 | Risk Ratio (M‐H, Fixed, 95% CI) | 2.5 [0.60, 10.46] |
| 9 Number of knee joints without night pain | 1 | Risk Ratio (M‐H, Fixed, 95% CI) | Subtotals only | |
| 9.1 1 to 4 weeks post‐injection | 1 | 24 | Risk Ratio (M‐H, Fixed, 95% CI) | 1.4 [0.61, 3.19] |
| 9.2 5 to 13 weeks post‐injection | 1 | 24 | Risk Ratio (M‐H, Fixed, 95% CI) | 1.4 [0.61, 3.19] |
| 10 Number of joints with improvement in pain on touch | 1 | Risk Ratio (M‐H, Fixed, 95% CI) | Subtotals only | |
| 11 Number of patients with moderate/marked pain | 1 | Risk Ratio (M‐H, Fixed, 95% CI) | Subtotals only | |
| 11.1 14 to 26 weeks post‐injection | 1 | 220 | Risk Ratio (M‐H, Fixed, 95% CI) | 0.74 [0.53, 1.04] |
| 12 Pain (number of patients improved) | 1 | Risk Ratio (M‐H, Fixed, 95% CI) | Subtotals only | |
| 12.1 5 to 13 weeks post‐injection | 1 | 408 | Risk Ratio (M‐H, Fixed, 95% CI) | 1.19 [0.93, 1.52] |
| 12.2 32 weeks post‐injection | 1 | 408 | Risk Ratio (M‐H, Fixed, 95% CI) | 1.36 [1.06, 1.75] |
| 13 WOMAC function (0‐100 mm VAS) | 1 | Mean Difference (IV, Fixed, 95% CI) | Subtotals only | |
| 13.1 1 to 4 weeks post‐injection | 1 | 189 | Mean Difference (IV, Fixed, 95% CI) | ‐1.30 [‐5.52, 2.92] |
| 13.2 5 to 13 weeks post‐injection | 1 | 177 | Mean Difference (IV, Fixed, 95% CI) | ‐1.06 [‐5.37, 3.25] |
| 13.3 14 to 26 weeks post‐injection | 1 | 176 | Mean Difference (IV, Fixed, 95% CI) | ‐4.05 [‐8.38, 0.28] |
| 14 Lequesne Index (0‐24) | 6 | Mean Difference (IV, Fixed, 95% CI) | Subtotals only | |
| 14.1 1 to 4 weeks post‐injection | 6 | 300 | Mean Difference (IV, Fixed, 95% CI) | ‐1.50 [‐2.36, ‐0.65] |
| 14.2 5 to 13 weeks post‐injection | 5 | 201 | Mean Difference (IV, Fixed, 95% CI) | ‐2.34 [‐3.41, ‐1.27] |
| 14.3 14 to 26 weeks post‐injection | 1 | 81 | Mean Difference (IV, Fixed, 95% CI) | ‐1.40 [‐3.40, 0.60] |
| 14.4 45 to 52 weeks post‐injection | 1 | 94 | Mean Difference (IV, Fixed, 95% CI) | ‐1.11 [‐2.70, 0.48] |
| 15 Flexion (degrees) | 1 | Mean Difference (IV, Fixed, 95% CI) | Subtotals only | |
| 15.1 1 to 4 weeks post‐injection | 1 | 35 | Mean Difference (IV, Fixed, 95% CI) | 3.5 [‐4.11, 11.11] |
| 15.2 5 to 13 weeks post‐injection | 1 | 35 | Mean Difference (IV, Fixed, 95% CI) | 7.60 [0.46, 14.74] |
| 16 Synovial fluid volume (ml) | 3 | Mean Difference (IV, Fixed, 95% CI) | Subtotals only | |
| 16.1 1 to 4 weeks post‐injection | 3 | 159 | Mean Difference (IV, Fixed, 95% CI) | ‐0.76 [‐3.49, 1.98] |
| 16.2 5 to 13 weeks post‐injection | 2 | 64 | Mean Difference (IV, Fixed, 95% CI) | ‐2.89 [‐6.51, 0.73] |
| 17 Joint space width (mm) | 1 | Mean Difference (IV, Fixed, 95% CI) | Subtotals only | |
| 17.1 45 to 52 weeks post‐injection (after three courses of treatment) | 1 | 273 | Mean Difference (IV, Fixed, 95% CI) | 0.40 [0.03, 0.77] |
| 18 Patient global assessment (number of patients improved) | 7 | Risk Ratio (M‐H, Fixed, 95% CI) | Subtotals only | |
| 18.1 1 to 4 weeks post‐injection (number of patients improved (much better/better or excellent/good)) | 3 | 99 | Risk Ratio (M‐H, Fixed, 95% CI) | 1.45 [0.97, 2.15] |
| 18.2 5 to 13 weeks post‐injection (number of patients improved (excellent/very good/good/better/somewhat better) | 2 | 75 | Risk Ratio (M‐H, Fixed, 95% CI) | 2.44 [1.43, 4.16] |
| 18.3 14 to 26 weeks post‐injection (number of patients improved (better/somewhat/much; excellent/fair) | 3 | 363 | Risk Ratio (M‐H, Fixed, 95% CI) | 1.24 [1.03, 1.50] |
| 18.4 45 to 52 weeks post‐injection (number of patients rating treatment effective) | 1 | 95 | Risk Ratio (M‐H, Fixed, 95% CI) | 1.17 [0.85, 1.62] |
| 19 Patient global assessment (number of joints fairly good/good/very good) | 2 | Risk Ratio (M‐H, Fixed, 95% CI) | Subtotals only | |
| 19.1 5 to 13 weeks post‐injection | 2 | 61 | Risk Ratio (M‐H, Fixed, 95% CI) | 2.12 [1.22, 3.70] |
| 20 Safety: total withdrawals overall | 12 | Risk Ratio (M‐H, Fixed, 95% CI) | Subtotals only | |
| 20.1 5 to 13 weeks post‐injection | 5 | 200 | Risk Ratio (M‐H, Fixed, 95% CI) | 0.60 [0.11, 3.23] |
| 20.2 14 to 26 weeks post‐injection | 4 | 723 | Risk Ratio (M‐H, Fixed, 95% CI) | 1.11 [0.87, 1.41] |
| 20.3 45 to 52 weeks post‐injection | 3 | 581 | Risk Ratio (M‐H, Fixed, 95% CI) | 1.13 [0.81, 1.56] |
| 21 Safety: withdrawals due to lack of efficacy | 4 | Risk Ratio (M‐H, Fixed, 95% CI) | Subtotals only | |
| 21.1 During treatment phase | 1 | 110 | Risk Ratio (M‐H, Fixed, 95% CI) | 1.0 [0.06, 15.59] |
| 21.2 14 to 26 weeks post‐injection | 3 | 632 | Risk Ratio (M‐H, Fixed, 95% CI) | 0.80 [0.47, 1.36] |
| 22 Safety: withdrawals due to painful injection | 1 | Risk Ratio (M‐H, Fixed, 95% CI) | Subtotals only | |
| 22.1 During treatment phase | 1 | 110 | Risk Ratio (M‐H, Fixed, 95% CI) | 2.0 [0.19, 21.42] |
| 23 Safety: number of patients with local adverse reaction and study drug discontinued | 4 | Risk Ratio (M‐H, Fixed, 95% CI) | Subtotals only | |
| 24 Safety: number of patients with local adverse reaction but study drug continued | 6 | Risk Ratio (M‐H, Fixed, 95% CI) | Subtotals only | |
| 25 Safety: number of patients discontinued due to adverse events | 2 | Risk Ratio (M‐H, Fixed, 95% CI) | Subtotals only | |
| 26 Safety: number of patients with serious or severe adverse events | 4 | Risk Ratio (M‐H, Fixed, 95% CI) | Subtotals only | |
| 26.1 14 to 26 weeks post‐injection | 2 | 300 | Risk Ratio (M‐H, Fixed, 95% CI) | 1.67 [0.41, 6.85] |
| 26.2 45 to 52 weeks post‐injection | 2 | 518 | Risk Ratio (M‐H, Fixed, 95% CI) | 1.85 [1.00, 3.43] |
| 27 Safety: number of knee joints with local adverse reaction | 2 | Risk Ratio (M‐H, Fixed, 95% CI) | Subtotals only | |
| 28 Safety: number of patients with injection site pain or painful intra‐articular injection | 3 | Risk Ratio (M‐H, Fixed, 95% CI) | Subtotals only | |
| 29 Safety: number of patients with local joint pain or swelling | 1 | Risk Ratio (M‐H, Fixed, 95% CI) | Subtotals only | |
| 29.1 14 to 26 weeks post‐injection | 1 | 332 | Risk Ratio (M‐H, Fixed, 95% CI) | 0.98 [0.56, 1.71] |
| 30 Safety: number of patients with local skin rash or ecchymosis | 1 | Risk Ratio (M‐H, Fixed, 95% CI) | Subtotals only | |
| 30.1 14 to 26 weeks post‐injection | 1 | 332 | Risk Ratio (M‐H, Fixed, 95% CI) | 0.91 [0.54, 1.52] |
| 31 Safety: number of patients with gastrointestinal complaints | 1 | Risk Ratio (M‐H, Fixed, 95% CI) | Subtotals only | |
| 31.1 14 to 26 weeks post‐injection | 1 | 332 | Risk Ratio (M‐H, Fixed, 95% CI) | 0.83 [0.61, 1.14] |
| 32 Safety: number of patients with pruritis (local) | 1 | Risk Ratio (M‐H, Fixed, 95% CI) | Subtotals only | |
| 32.1 14 to 26 weeks post‐injection | 1 | 332 | Risk Ratio (M‐H, Fixed, 95% CI) | 1.76 [0.71, 4.35] |
| 33 Safety: number of patients with treatment related adverse events | 5 | Risk Ratio (M‐H, Fixed, 95% CI) | Subtotals only | |
| 33.1 5 to 13 weeks post‐injection | 1 | 40 | Risk Ratio (M‐H, Fixed, 95% CI) | 0.0 [0.0, 0.0] |
| 33.2 14 to 26 weeks post‐injection | 3 | 238 | Risk Ratio (M‐H, Fixed, 95% CI) | 2.19 [1.18, 4.07] |
| 33.3 45 to 52 weeks post‐injection | 1 | 63 | Risk Ratio (M‐H, Fixed, 95% CI) | 7.68 [0.41, 142.77] |
| 34 Safety: number of patients reporting adverse events | 1 | Risk Ratio (M‐H, Fixed, 95% CI) | Subtotals only | |
| 34.1 14 to 26 weeks post‐injection | 1 | 80 | Risk Ratio (M‐H, Fixed, 95% CI) | 0.73 [0.42, 1.25] |
| 35 Number of patients with none/slight/mild pain | 1 | Risk Ratio (M‐H, Fixed, 95% CI) | Subtotals only | |
| 35.1 14 to 26 weeks post‐injection | 1 | 220 | Risk Ratio (M‐H, Fixed, 95% CI) | 1.22 [0.98, 1.52] |
| 36 Joint space width (mm) (after three courses of treatment and stratified subgroups) | 2 | Mean Difference (IV, Fixed, 95% CI) | Subtotals only | |
| 36.1 45 to 52 weeks post‐injection | 2 | 273 | Mean Difference (IV, Fixed, 95% CI) | 0.14 [‐0.14, 0.42] |
8.1. Analysis.
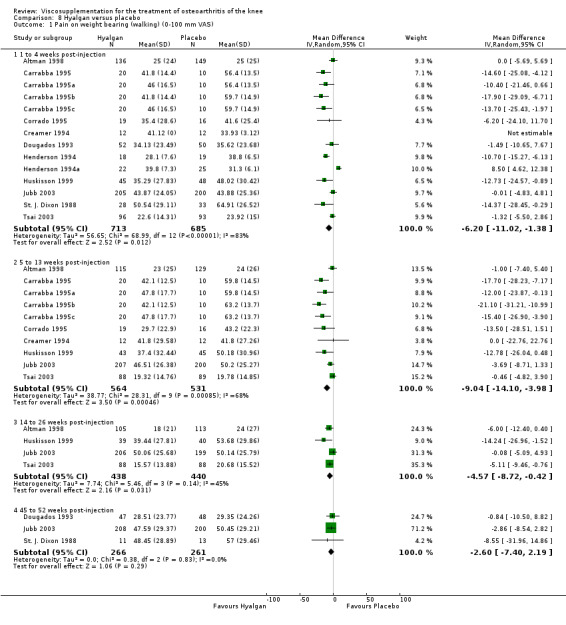
Comparison 8 Hyalgan versus placebo, Outcome 1 Pain on weight bearing (walking) (0‐100 mm VAS).
8.2. Analysis.
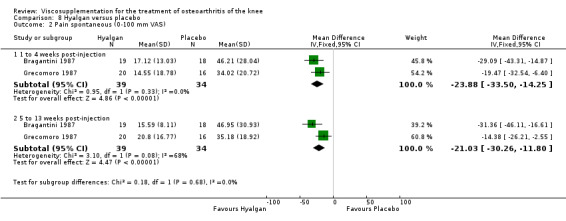
Comparison 8 Hyalgan versus placebo, Outcome 2 Pain spontaneous (0‐100 mm VAS).
8.3. Analysis.
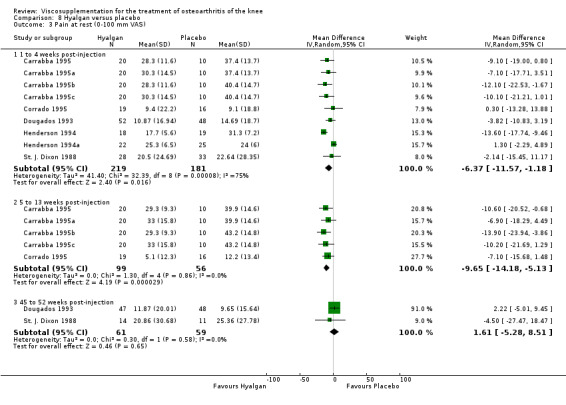
Comparison 8 Hyalgan versus placebo, Outcome 3 Pain at rest (0‐100 mm VAS).
8.4. Analysis.

Comparison 8 Hyalgan versus placebo, Outcome 4 Pain at night (0‐100 mm VAS).
8.5. Analysis.
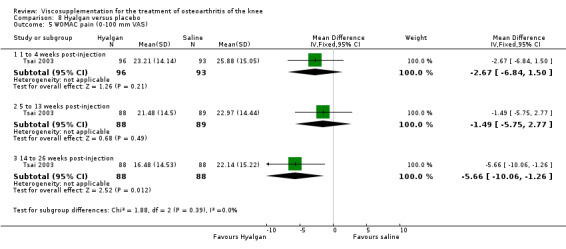
Comparison 8 Hyalgan versus placebo, Outcome 5 WOMAC pain (0‐100 mm VAS).
8.6. Analysis.
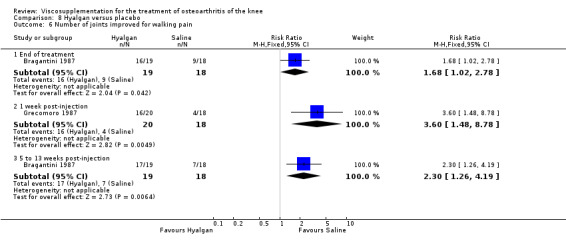
Comparison 8 Hyalgan versus placebo, Outcome 6 Number of joints improved for walking pain.
8.7. Analysis.
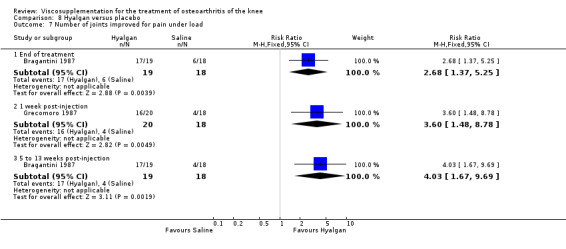
Comparison 8 Hyalgan versus placebo, Outcome 7 Number of joints improved for pain under load.
8.8. Analysis.

Comparison 8 Hyalgan versus placebo, Outcome 8 Number of knee joints without rest pain.
8.9. Analysis.
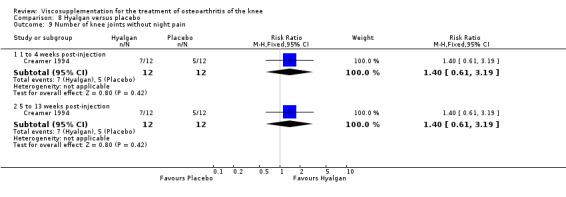
Comparison 8 Hyalgan versus placebo, Outcome 9 Number of knee joints without night pain.
8.10. Analysis.

Comparison 8 Hyalgan versus placebo, Outcome 10 Number of joints with improvement in pain on touch.
8.11. Analysis.

Comparison 8 Hyalgan versus placebo, Outcome 11 Number of patients with moderate/marked pain.
8.12. Analysis.

Comparison 8 Hyalgan versus placebo, Outcome 12 Pain (number of patients improved).
8.13. Analysis.

Comparison 8 Hyalgan versus placebo, Outcome 13 WOMAC function (0‐100 mm VAS).
8.14. Analysis.
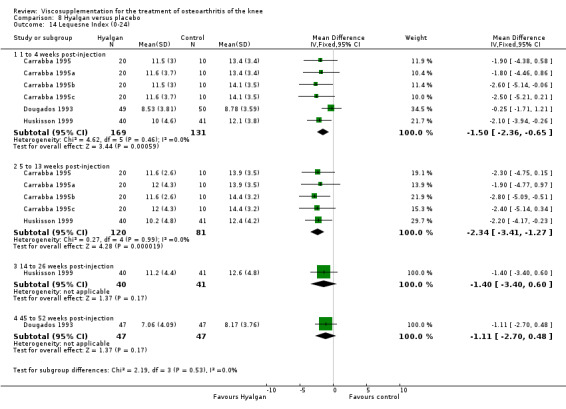
Comparison 8 Hyalgan versus placebo, Outcome 14 Lequesne Index (0‐24).
8.15. Analysis.
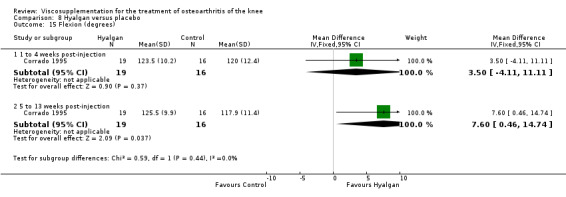
Comparison 8 Hyalgan versus placebo, Outcome 15 Flexion (degrees).
8.16. Analysis.
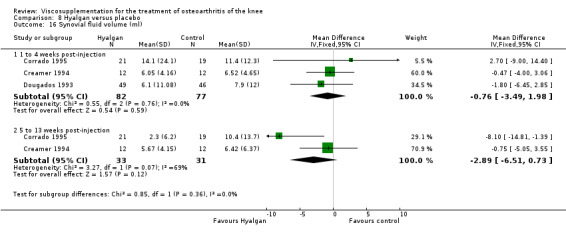
Comparison 8 Hyalgan versus placebo, Outcome 16 Synovial fluid volume (ml).
8.17. Analysis.
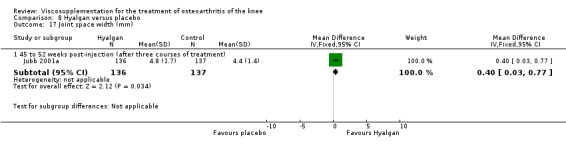
Comparison 8 Hyalgan versus placebo, Outcome 17 Joint space width (mm).
8.18. Analysis.

Comparison 8 Hyalgan versus placebo, Outcome 18 Patient global assessment (number of patients improved).
8.19. Analysis.
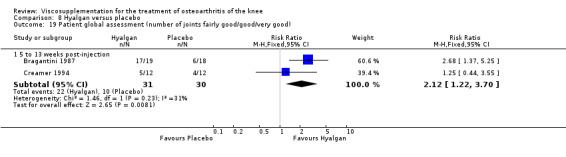
Comparison 8 Hyalgan versus placebo, Outcome 19 Patient global assessment (number of joints fairly good/good/very good).
8.20. Analysis.
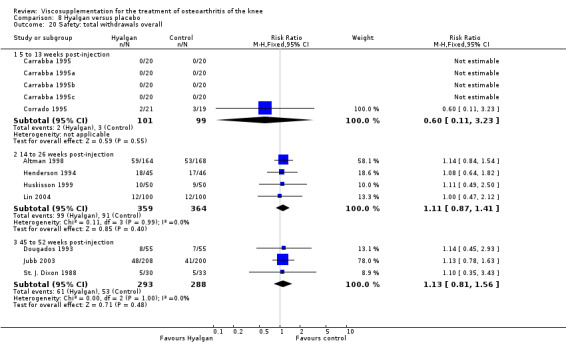
Comparison 8 Hyalgan versus placebo, Outcome 20 Safety: total withdrawals overall.
8.21. Analysis.

Comparison 8 Hyalgan versus placebo, Outcome 21 Safety: withdrawals due to lack of efficacy.
8.22. Analysis.
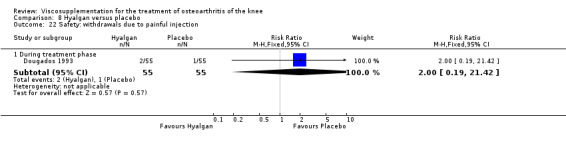
Comparison 8 Hyalgan versus placebo, Outcome 22 Safety: withdrawals due to painful injection.
8.23. Analysis.
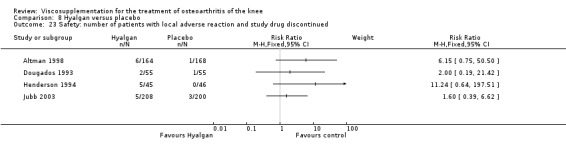
Comparison 8 Hyalgan versus placebo, Outcome 23 Safety: number of patients with local adverse reaction and study drug discontinued.
8.24. Analysis.
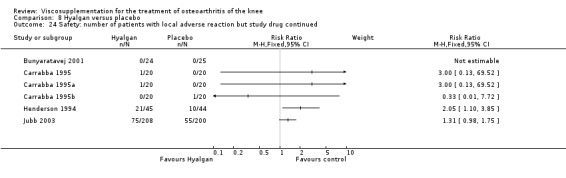
Comparison 8 Hyalgan versus placebo, Outcome 24 Safety: number of patients with local adverse reaction but study drug continued.
8.25. Analysis.
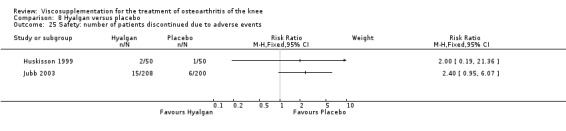
Comparison 8 Hyalgan versus placebo, Outcome 25 Safety: number of patients discontinued due to adverse events.
8.26. Analysis.
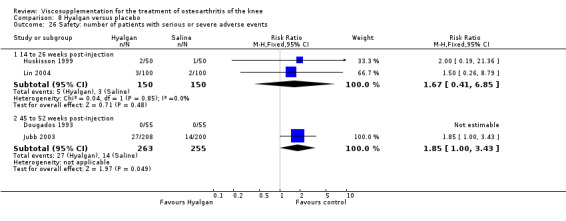
Comparison 8 Hyalgan versus placebo, Outcome 26 Safety: number of patients with serious or severe adverse events.
8.27. Analysis.
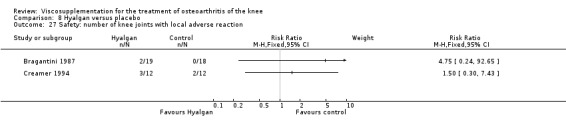
Comparison 8 Hyalgan versus placebo, Outcome 27 Safety: number of knee joints with local adverse reaction.
8.28. Analysis.
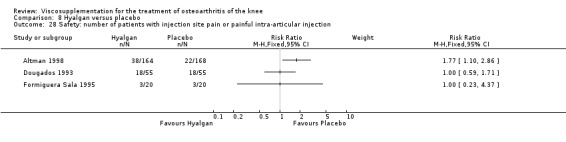
Comparison 8 Hyalgan versus placebo, Outcome 28 Safety: number of patients with injection site pain or painful intra‐articular injection.
8.29. Analysis.

Comparison 8 Hyalgan versus placebo, Outcome 29 Safety: number of patients with local joint pain or swelling.
8.30. Analysis.
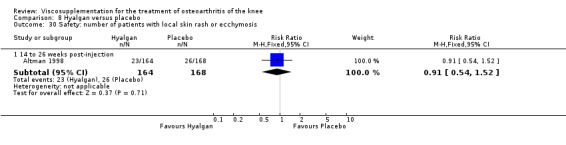
Comparison 8 Hyalgan versus placebo, Outcome 30 Safety: number of patients with local skin rash or ecchymosis.
8.31. Analysis.

Comparison 8 Hyalgan versus placebo, Outcome 31 Safety: number of patients with gastrointestinal complaints.
8.32. Analysis.
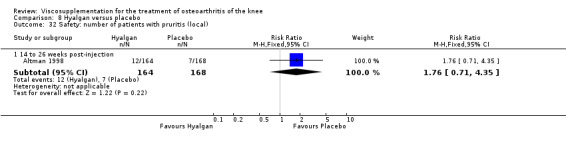
Comparison 8 Hyalgan versus placebo, Outcome 32 Safety: number of patients with pruritis (local).
8.33. Analysis.
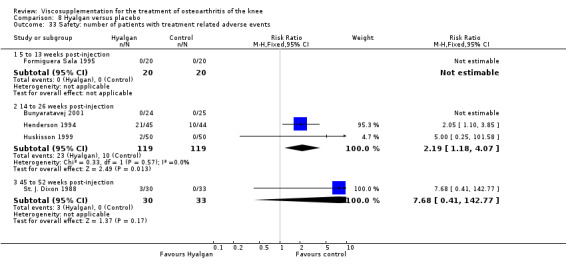
Comparison 8 Hyalgan versus placebo, Outcome 33 Safety: number of patients with treatment related adverse events.
8.34. Analysis.

Comparison 8 Hyalgan versus placebo, Outcome 34 Safety: number of patients reporting adverse events.
8.35. Analysis.
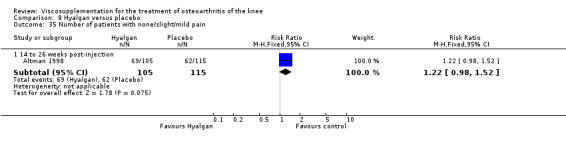
Comparison 8 Hyalgan versus placebo, Outcome 35 Number of patients with none/slight/mild pain.
8.36. Analysis.

Comparison 8 Hyalgan versus placebo, Outcome 36 Joint space width (mm) (after three courses of treatment and stratified subgroups).
Comparison 9. Hyalgan versus arthroscopy.
| Outcome or subgroup title | No. of studies | No. of participants | Statistical method | Effect size |
|---|---|---|---|---|
| 1 Pain (0‐10 cm VAS) | 1 | Mean Difference (IV, Fixed, 95% CI) | Subtotals only | |
| 1.1 Pre‐trial | 1 | 33 | Mean Difference (IV, Fixed, 95% CI) | 0.10 [‐1.39, 1.59] |
| 1.2 1 week post‐injection | 1 | 30 | Mean Difference (IV, Fixed, 95% CI) | 1.20 [‐0.88, 3.28] |
| 1.3 5 to 12 weeks post‐injection | 1 | 31 | Mean Difference (IV, Fixed, 95% CI) | 0.0 [‐2.51, 2.51] |
| 1.4 14 to 26 weeks post‐injection | 1 | 28 | Mean Difference (IV, Fixed, 95% CI) | ‐0.90 [‐3.46, 1.66] |
| 1.5 45 to 52 weeks post‐injection | 1 | 25 | Mean Difference (IV, Fixed, 95% CI) | 0.0 [‐2.47, 2.47] |
| 2 Knee Society Function scale | 1 | Mean Difference (IV, Fixed, 95% CI) | Subtotals only | |
| 2.1 Pre‐trial | 1 | 33 | Mean Difference (IV, Fixed, 95% CI) | 22.40 [6.27, 38.53] |
| 2.2 1 week post‐injection | 1 | 30 | Mean Difference (IV, Fixed, 95% CI) | 16.9 [‐6.32, 40.12] |
| 2.3 5 to 13 weeks post‐injection | 1 | 31 | Mean Difference (IV, Fixed, 95% CI) | 16.20 [‐6.50, 38.90] |
| 2.4 14 to 26 weeks post‐injection | 1 | 28 | Mean Difference (IV, Fixed, 95% CI) | 23.5 [1.68, 45.32] |
| 2.5 45 to 52 weeks post ‐injection | 1 | 25 | Mean Difference (IV, Fixed, 95% CI) | 23.9 [‐1.45, 49.25] |
| 3 Lequesne Index (0‐24) | 1 | Mean Difference (IV, Fixed, 95% CI) | Subtotals only | |
| 3.1 Pre‐trial | 1 | 33 | Mean Difference (IV, Fixed, 95% CI) | ‐1.90 [‐4.84, 1.04] |
| 3.2 1 week post‐injection | 1 | 30 | Mean Difference (IV, Fixed, 95% CI) | 0.60 [‐3.72, 4.92] |
| 3.3 5 to 13 weeks post‐injection | 1 | 31 | Mean Difference (IV, Fixed, 95% CI) | ‐0.60 [‐5.00, 3.80] |
| 3.4 14 to 26 weeks post‐injection | 1 | 28 | Mean Difference (IV, Fixed, 95% CI) | ‐3.0 [‐7.58, 1.58] |
| 3.5 45 to 52 weeks post‐injection | 1 | 25 | Mean Difference (IV, Fixed, 95% CI) | ‐2.90 [‐8.10, 2.30] |
| 4 Clinical outcome (number of patients requiring further intervention) | 1 | Risk Ratio (M‐H, Fixed, 95% CI) | Subtotals only | |
| 4.1 45 to 52 weeks post‐injection | 1 | 32 | Risk Ratio (M‐H, Fixed, 95% CI) | 2.06 [0.64, 6.57] |
| 5 Safety: total withdrawals overall | 1 | Risk Ratio (M‐H, Fixed, 95% CI) | Subtotals only | |
| 5.1 45 to 52 weeks post‐injection | 1 | 38 | Risk Ratio (M‐H, Fixed, 95% CI) | 0.5 [0.10, 2.41] |
| 6 Safety: number of patients with pain at injection site | 1 | Risk Ratio (M‐H, Fixed, 95% CI) | Subtotals only |
9.1. Analysis.

Comparison 9 Hyalgan versus arthroscopy, Outcome 1 Pain (0‐10 cm VAS).
9.2. Analysis.
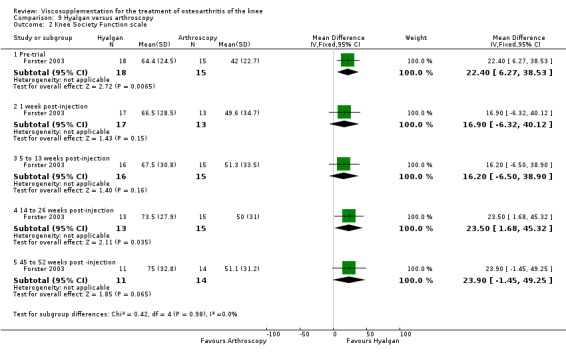
Comparison 9 Hyalgan versus arthroscopy, Outcome 2 Knee Society Function scale.
9.3. Analysis.
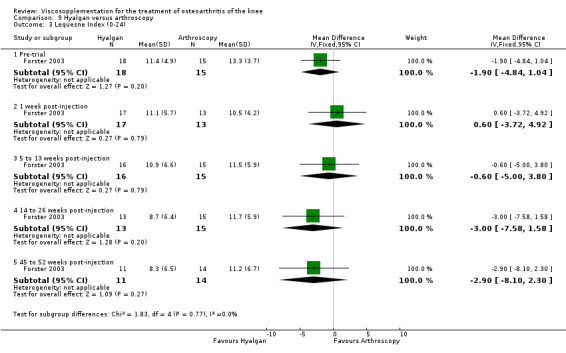
Comparison 9 Hyalgan versus arthroscopy, Outcome 3 Lequesne Index (0‐24).
9.4. Analysis.
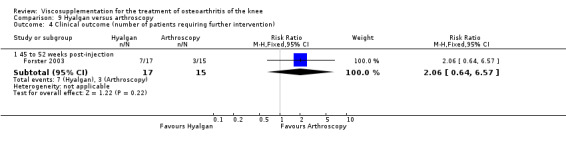
Comparison 9 Hyalgan versus arthroscopy, Outcome 4 Clinical outcome (number of patients requiring further intervention).
9.5. Analysis.

Comparison 9 Hyalgan versus arthroscopy, Outcome 5 Safety: total withdrawals overall.
9.6. Analysis.

Comparison 9 Hyalgan versus arthroscopy, Outcome 6 Safety: number of patients with pain at injection site.
Comparison 10. Hyalgan versus NSAID.
| Outcome or subgroup title | No. of studies | No. of participants | Statistical method | Effect size |
|---|---|---|---|---|
| 1 Pain after 50 foot walk (0‐100 mm VAS) | 1 | Mean Difference (IV, Fixed, 95% CI) | Subtotals only | |
| 1.1 1 to 4 weeks post‐injection | 1 | 279 | Mean Difference (IV, Fixed, 95% CI) | 0.0 [‐5.99, 5.99] |
| 1.2 5 to 13 weeks post‐injection | 1 | 240 | Mean Difference (IV, Fixed, 95% CI) | 2.0 [‐4.33, 8.33] |
| 1.3 14 to 26 weeks post‐injection | 1 | 216 | Mean Difference (IV, Fixed, 95% CI) | ‐3.0 [‐9.15, 3.15] |
| 2 Number of patients with moderate or marked pain | 1 | Risk Ratio (M‐H, Fixed, 95% CI) | Subtotals only | |
| 2.1 14 to 26 weeks post‐injection | 1 | 218 | Risk Ratio (M‐H, Fixed, 95% CI) | 0.90 [0.63, 1.28] |
| 3 Number of patients with none/slight/mild pain | 1 | Risk Ratio (M‐H, Fixed, 95% CI) | Subtotals only | |
| 3.1 14 to 26 weeks post‐injection | 1 | 218 | Risk Ratio (M‐H, Fixed, 95% CI) | 1.06 [0.87, 1.30] |
| 4 Safety: total withdrawals overall | 1 | Risk Ratio (M‐H, Fixed, 95% CI) | Subtotals only | |
| 4.1 14 to 26 weeks post‐injection | 1 | 327 | Risk Ratio (M‐H, Fixed, 95% CI) | 1.17 [0.86, 1.60] |
| 5 Safety: withdrawals due to lack of efficacy | 1 | Risk Ratio (M‐H, Fixed, 95% CI) | Subtotals only | |
| 5.1 14 to 26 weeks post‐injection | 1 | 327 | Risk Ratio (M‐H, Fixed, 95% CI) | 1.69 [0.80, 3.58] |
| 6 Safety: number of patients withdrawn due to gastrointestinal events | 1 | Risk Ratio (M‐H, Fixed, 95% CI) | Subtotals only | |
| 6.1 14 to 26 weeks post‐injection | 1 | 327 | Risk Ratio (M‐H, Fixed, 95% CI) | 0.28 [0.10, 0.84] |
| 7 Safety: number of patients withdrawn due to injection site pain | 1 | Risk Ratio (M‐H, Fixed, 95% CI) | Subtotals only | |
| 7.1 14 to 26 weeks post‐injection | 1 | 327 | Risk Ratio (M‐H, Fixed, 95% CI) | 5.96 [0.73, 48.99] |
| 8 Safety: number of patients with injection site pain | 1 | Risk Ratio (M‐H, Fixed, 95% CI) | Subtotals only | |
| 8.1 14 to 26 weeks post‐injection | 1 | 327 | Risk Ratio (M‐H, Fixed, 95% CI) | 2.70 [1.52, 4.79] |
| 9 Safety: number of patients with local joint pain or swelling | 1 | Risk Ratio (M‐H, Fixed, 95% CI) | Subtotals only | |
| 9.1 14 to 26 weeks post‐injection | 1 | 327 | Risk Ratio (M‐H, Fixed, 95% CI) | 2.09 [1.01, 4.29] |
| 10 Safety: number of patients with local skin rash | 1 | Risk Ratio (M‐H, Fixed, 95% CI) | Subtotals only | |
| 10.1 14 to 26 weeks post‐injection | 1 | 327 | Risk Ratio (M‐H, Fixed, 95% CI) | 0.79 [0.48, 1.30] |
| 11 Safety: number of patients with gastrointestinal complaints | 1 | Risk Ratio (M‐H, Fixed, 95% CI) | Subtotals only | |
| 11.1 14 to 26 weeks post‐injection | 1 | 327 | Risk Ratio (M‐H, Fixed, 95% CI) | 0.70 [0.52, 0.95] |
| 12 Safety: number of patients with pruritis (local) | 1 | Risk Ratio (M‐H, Fixed, 95% CI) | Subtotals only | |
| 12.1 14 to 26 weeks post‐injection | 1 | 327 | Risk Ratio (M‐H, Fixed, 95% CI) | 1.70 [0.69, 4.22] |
10.1. Analysis.
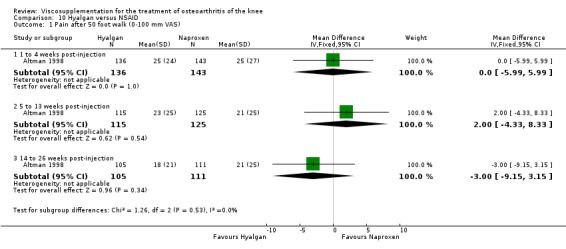
Comparison 10 Hyalgan versus NSAID, Outcome 1 Pain after 50 foot walk (0‐100 mm VAS).
10.2. Analysis.

Comparison 10 Hyalgan versus NSAID, Outcome 2 Number of patients with moderate or marked pain.
10.3. Analysis.
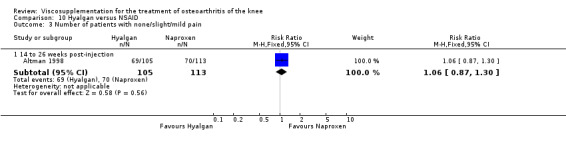
Comparison 10 Hyalgan versus NSAID, Outcome 3 Number of patients with none/slight/mild pain.
10.4. Analysis.
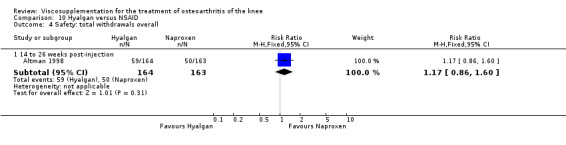
Comparison 10 Hyalgan versus NSAID, Outcome 4 Safety: total withdrawals overall.
10.5. Analysis.
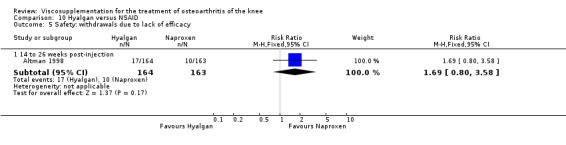
Comparison 10 Hyalgan versus NSAID, Outcome 5 Safety: withdrawals due to lack of efficacy.
10.6. Analysis.
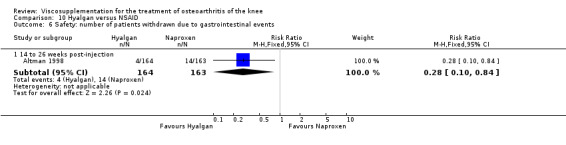
Comparison 10 Hyalgan versus NSAID, Outcome 6 Safety: number of patients withdrawn due to gastrointestinal events.
10.7. Analysis.
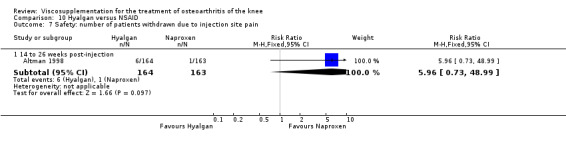
Comparison 10 Hyalgan versus NSAID, Outcome 7 Safety: number of patients withdrawn due to injection site pain.
10.8. Analysis.
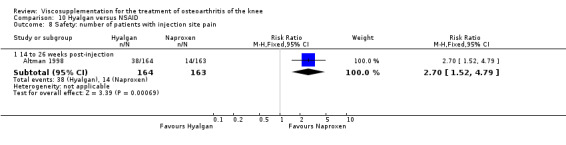
Comparison 10 Hyalgan versus NSAID, Outcome 8 Safety: number of patients with injection site pain.
10.9. Analysis.
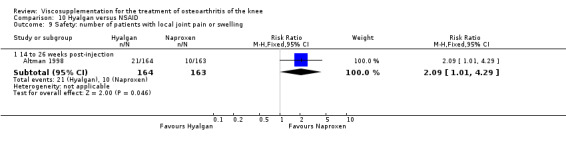
Comparison 10 Hyalgan versus NSAID, Outcome 9 Safety: number of patients with local joint pain or swelling.
10.10. Analysis.

Comparison 10 Hyalgan versus NSAID, Outcome 10 Safety: number of patients with local skin rash.
10.11. Analysis.
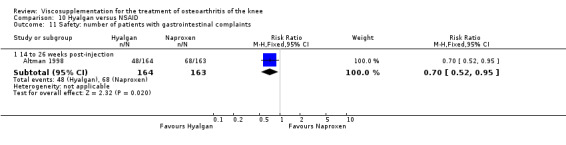
Comparison 10 Hyalgan versus NSAID, Outcome 11 Safety: number of patients with gastrointestinal complaints.
10.12. Analysis.

Comparison 10 Hyalgan versus NSAID, Outcome 12 Safety: number of patients with pruritis (local).
Comparison 11. Hyalgan versus methylprednisolone acetate.
| Outcome or subgroup title | No. of studies | No. of participants | Statistical method | Effect size |
|---|---|---|---|---|
| 1 Spontaneous pain intensity (0‐100 mm VAS) | 3 | Mean Difference (IV, Fixed, 95% CI) | Subtotals only | |
| 1.1 1 to 4 weeks post‐injection | 3 | 170 | Mean Difference (IV, Fixed, 95% CI) | ‐4.90 [‐9.91, 0.10] |
| 1.2 5 to 13 weeks post‐injection | 3 | 170 | Mean Difference (IV, Fixed, 95% CI) | ‐7.73 [‐12.81, ‐2.64] |
| 1.3 45 to 52 weeks post‐injection | 1 | 32 | Mean Difference (IV, Fixed, 95% CI) | 2.5 [‐14.98, 19.98] |
| 2 Number of joints with moderate or severe walking pain | 1 | Risk Ratio (M‐H, Fixed, 95% CI) | Subtotals only | |
| 2.1 1 to 4 weeks post‐injection | 1 | 40 | Risk Ratio (M‐H, Fixed, 95% CI) | 1.22 [0.65, 2.29] |
| 2.2 5 to 13 weeks post‐injection | 1 | 40 | Risk Ratio (M‐H, Fixed, 95% CI) | 0.8 [0.40, 1.60] |
| 2.3 45 to 52 weeks post‐injection | 1 | 32 | Risk Ratio (M‐H, Fixed, 95% CI) | 1.04 [0.67, 1.60] |
| 3 Number of patients with moderate or severe pain under load | 2 | Risk Ratio (M‐H, Fixed, 95% CI) | Subtotals only | |
| 3.1 1 to 4 weeks post‐injection | 2 | 130 | Risk Ratio (M‐H, Fixed, 95% CI) | 0.95 [0.71, 1.27] |
| 3.2 5 to 13 weeks post‐injection | 2 | 129 | Risk Ratio (M‐H, Fixed, 95% CI) | 0.62 [0.45, 0.85] |
| 4 Number of joints with moderate or severe pain under load | 1 | Risk Ratio (M‐H, Fixed, 95% CI) | Subtotals only | |
| 4.1 1 to 4 weeks post‐injection | 1 | 40 | Risk Ratio (M‐H, Fixed, 95% CI) | 1.0 [0.47, 2.14] |
| 4.2 5 to 13 weeks post‐injection | 1 | 40 | Risk Ratio (M‐H, Fixed, 95% CI) | 0.86 [0.35, 2.10] |
| 4.3 45 to 52 weeks post‐injection | 1 | 32 | Risk Ratio (M‐H, Fixed, 95% CI) | 0.82 [0.46, 1.49] |
| 5 Number of patients with at least moderate or greater night pain | 2 | Risk Ratio (M‐H, Fixed, 95% CI) | Subtotals only | |
| 5.1 1 to 4 weeks post‐injection | 2 | 130 | Risk Ratio (M‐H, Fixed, 95% CI) | 1.2 [0.38, 3.80] |
| 5.2 5 to 13 weeks post‐injection | 2 | 129 | Risk Ratio (M‐H, Fixed, 95% CI) | 0.14 [0.02, 1.13] |
| 6 Number of patients with moderate or greater rest pain | 2 | Risk Ratio (M‐H, Fixed, 95% CI) | Subtotals only | |
| 6.1 1 to 4 weeks post‐injection | 2 | 130 | Risk Ratio (M‐H, Fixed, 95% CI) | 0.68 [0.38, 1.24] |
| 6.2 5 to 13 weeks post‐injection | 2 | 129 | Risk Ratio (M‐H, Fixed, 95% CI) | 0.39 [0.19, 0.78] |
| 7 Function: range of motion (flexion in degrees) | 2 | Mean Difference (IV, Fixed, 95% CI) | Subtotals only | |
| 7.1 1 to 4 weeks post‐injection | 2 | 130 | Mean Difference (IV, Fixed, 95% CI) | 5.93 [0.71, 11.14] |
| 7.2 5 to 13 weeks post‐injection | 2 | 130 | Mean Difference (IV, Fixed, 95% CI) | 5.41 [0.54, 10.28] |
| 7.3 45 to 52 weeks post‐injection | 1 | 32 | Mean Difference (IV, Fixed, 95% CI) | 1.5 [‐12.92, 15.92] |
| 8 Patient global (number of patients very good or good, excellent or /good) | 3 | Risk Ratio (M‐H, Fixed, 95% CI) | Subtotals only | |
| 8.1 1 to 4 weeks post‐injection | 3 | 213 | Risk Ratio (M‐H, Fixed, 95% CI) | 0.94 [0.75, 1.18] |
| 8.2 5 to 13 weeks post‐injection | 2 | 130 | Risk Ratio (M‐H, Fixed, 95% CI) | 1.86 [1.26, 2.75] |
| 8.3 14 to 26 weeks post‐injection | 1 | 70 | Risk Ratio (M‐H, Fixed, 95% CI) | 1.05 [0.81, 1.36] |
| 9 Safety: total withdrawals overall | 4 | Risk Ratio (M‐H, Fixed, 95% CI) | Subtotals only | |
| 9.1 1 to 4 weeks post‐injection | 1 | 99 | Risk Ratio (M‐H, Fixed, 95% CI) | 0.54 [0.21, 1.38] |
| 9.2 5 to 13 weeks post‐injection | 2 | 130 | Risk Ratio (M‐H, Fixed, 95% CI) | 3.0 [0.13, 71.74] |
| 9.3 14 to 26 weeks post‐injection | 1 | 99 | Risk Ratio (M‐H, Fixed, 95% CI) | 1.81 [0.67, 4.91] |
| 9.4 45 to 52 weeks post‐injection | 1 | 40 | Risk Ratio (M‐H, Fixed, 95% CI) | 1.67 [0.46, 6.06] |
| 10 Safety: number of patients withdrawn due to lack of efficacy | 1 | Risk Ratio (M‐H, Fixed, 95% CI) | Subtotals only | |
| 10.1 5 to 13 weeks post‐injection | 1 | 90 | Risk Ratio (M‐H, Fixed, 95% CI) | 3.0 [0.13, 71.74] |
| 11 Safety: number of patients withdrawn due to adverse events | 1 | Risk Ratio (M‐H, Fixed, 95% CI) | Subtotals only | |
| 11.1 After first injection | 1 | 99 | Risk Ratio (M‐H, Fixed, 95% CI) | 0.30 [0.01, 7.24] |
| 12 Safety: number of patients with local or systemic reactions | 2 | Risk Ratio (M‐H, Fixed, 95% CI) | Subtotals only | |
| 12.1 5 to 13 weeks post‐injection | 2 | 130 | Risk Ratio (M‐H, Fixed, 95% CI) | 3.0 [0.13, 71.74] |
| 13 Safety: number of joints with local reactions but continued in trial | 1 | Risk Ratio (M‐H, Fixed, 95% CI) | Subtotals only | |
| 13.1 1 to 4 weeks post‐injection | 1 | 40 | Risk Ratio (M‐H, Fixed, 95% CI) | 1.33 [0.34, 5.21] |
11.1. Analysis.
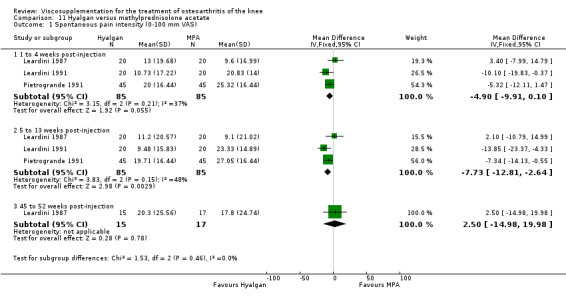
Comparison 11 Hyalgan versus methylprednisolone acetate, Outcome 1 Spontaneous pain intensity (0‐100 mm VAS).
11.2. Analysis.
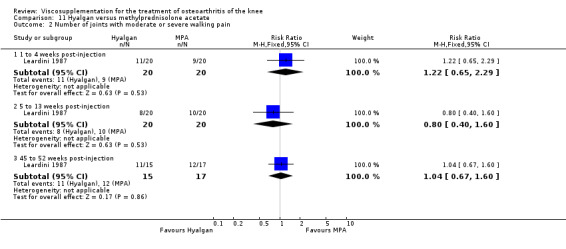
Comparison 11 Hyalgan versus methylprednisolone acetate, Outcome 2 Number of joints with moderate or severe walking pain.
11.3. Analysis.
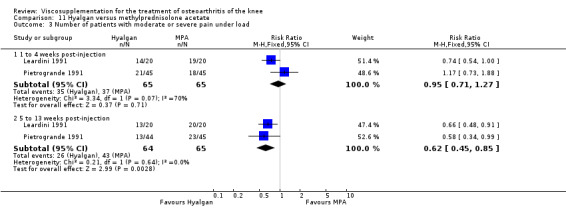
Comparison 11 Hyalgan versus methylprednisolone acetate, Outcome 3 Number of patients with moderate or severe pain under load.
11.4. Analysis.
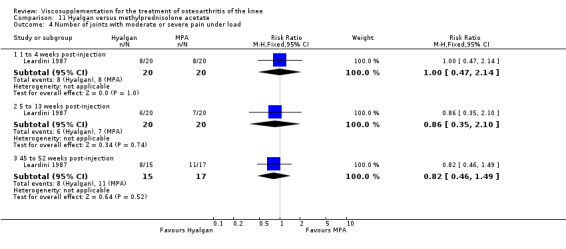
Comparison 11 Hyalgan versus methylprednisolone acetate, Outcome 4 Number of joints with moderate or severe pain under load.
11.5. Analysis.
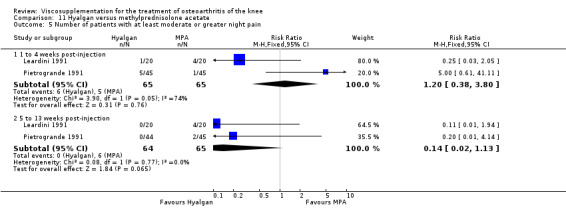
Comparison 11 Hyalgan versus methylprednisolone acetate, Outcome 5 Number of patients with at least moderate or greater night pain.
11.6. Analysis.
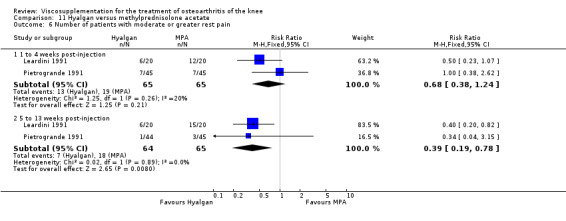
Comparison 11 Hyalgan versus methylprednisolone acetate, Outcome 6 Number of patients with moderate or greater rest pain.
11.7. Analysis.
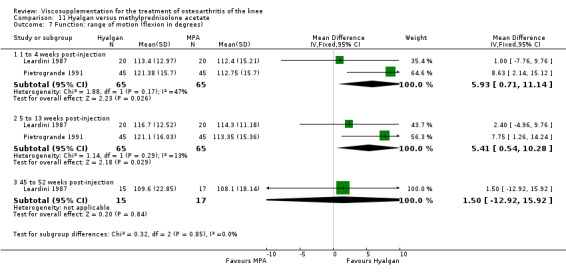
Comparison 11 Hyalgan versus methylprednisolone acetate, Outcome 7 Function: range of motion (flexion in degrees).
11.8. Analysis.
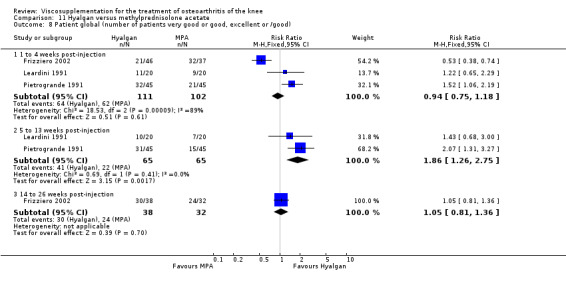
Comparison 11 Hyalgan versus methylprednisolone acetate, Outcome 8 Patient global (number of patients very good or good, excellent or /good).
11.9. Analysis.
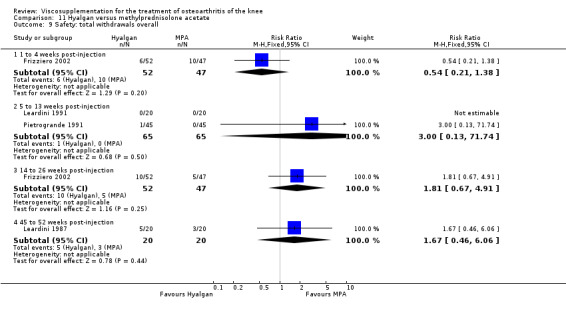
Comparison 11 Hyalgan versus methylprednisolone acetate, Outcome 9 Safety: total withdrawals overall.
11.10. Analysis.
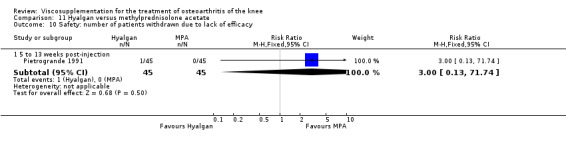
Comparison 11 Hyalgan versus methylprednisolone acetate, Outcome 10 Safety: number of patients withdrawn due to lack of efficacy.
11.11. Analysis.
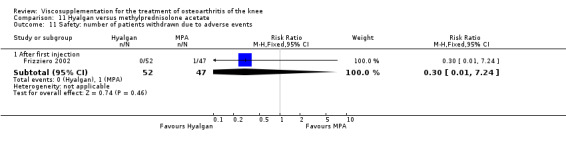
Comparison 11 Hyalgan versus methylprednisolone acetate, Outcome 11 Safety: number of patients withdrawn due to adverse events.
11.12. Analysis.
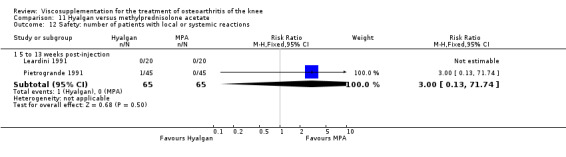
Comparison 11 Hyalgan versus methylprednisolone acetate, Outcome 12 Safety: number of patients with local or systemic reactions.
11.13. Analysis.
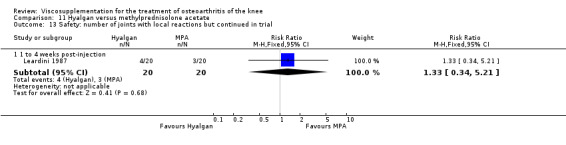
Comparison 11 Hyalgan versus methylprednisolone acetate, Outcome 13 Safety: number of joints with local reactions but continued in trial.
Comparison 12. Hyalgan versus triamcinolone hexacetonide.
| Outcome or subgroup title | No. of studies | No. of participants | Statistical method | Effect size |
|---|---|---|---|---|
| 1 Pain on nominated activity (0‐100 mm VAS) | 1 | Mean Difference (IV, Fixed, 95% CI) | Subtotals only | |
| 1.1 End of treatment (week 4) | 1 | 56 | Mean Difference (IV, Fixed, 95% CI) | ‐0.20 [‐17.39, 16.99] |
| 1.2 14 to 26 weeks post‐injection | 1 | 20 | Mean Difference (IV, Fixed, 95% CI) | ‐10.0 [‐31.83, 11.83] |
| 2 Pain at rest (0‐100 mm VAS) | 1 | Mean Difference (IV, Fixed, 95% CI) | Subtotals only | |
| 2.1 End of treatment (week 4) | 1 | 56 | Mean Difference (IV, Fixed, 95% CI) | ‐0.70 [‐18.17, 16.77] |
| 2.2 14 to 26 weeks post‐injection | 1 | 20 | Mean Difference (IV, Fixed, 95% CI) | ‐20.40 [‐43.92, 3.12] |
| 3 Pain at night (0‐100 mm VAS) | 1 | Mean Difference (IV, Fixed, 95% CI) | Subtotals only | |
| 3.1 End of treatment (week 4) | 1 | 56 | Mean Difference (IV, Fixed, 95% CI) | ‐7.10 [‐24.30, 10.10] |
| 3.2 14 to 26 weeks post‐injection | 1 | 20 | Mean Difference (IV, Fixed, 95% CI) | ‐20.70 [‐37.74, ‐3.66] |
| 4 Safety: total withdrawals overall | 1 | Risk Ratio (M‐H, Fixed, 95% CI) | Subtotals only | |
| 4.1 End of treatment (week 4) | 1 | 63 | Risk Ratio (M‐H, Fixed, 95% CI) | 0.73 [0.18, 2.99] |
| 4.2 14 to 26 weeks post‐injection | 1 | 63 | Risk Ratio (M‐H, Fixed, 95% CI) | 0.80 [0.56, 1.14] |
| 5 Safety: wIthdrawals due to lack efficacy | 1 | Risk Ratio (M‐H, Fixed, 95% CI) | Subtotals only | |
| 5.1 End of treatment (week 4) | 1 | 63 | Risk Ratio (M‐H, Fixed, 95% CI) | 4.85 [0.24, 97.11] |
| 5.2 14 to 26 week post‐injection | 1 | 63 | Risk Ratio (M‐H, Fixed, 95% CI) | 0.89 [0.49, 1.65] |
| 6 Safety: wIthdrawals due to adverse events | 1 | Risk Ratio (M‐H, Fixed, 95% CI) | Subtotals only | |
| 6.1 End of treatment (week 4) | 1 | 63 | Risk Ratio (M‐H, Fixed, 95% CI) | 0.97 [0.06, 14.82] |
| 6.2 14 to 26 weeks post‐injection | 1 | 63 | Risk Ratio (M‐H, Fixed, 95% CI) | 0.78 [0.23, 2.62] |
12.1. Analysis.
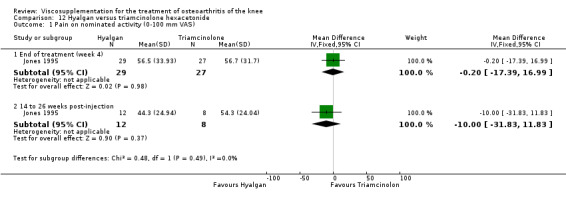
Comparison 12 Hyalgan versus triamcinolone hexacetonide, Outcome 1 Pain on nominated activity (0‐100 mm VAS).
12.2. Analysis.

Comparison 12 Hyalgan versus triamcinolone hexacetonide, Outcome 2 Pain at rest (0‐100 mm VAS).
12.3. Analysis.
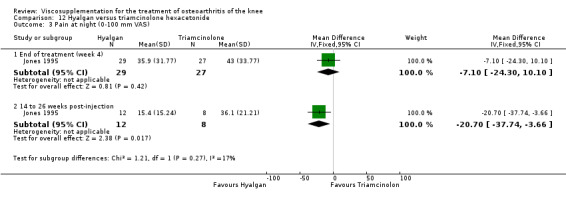
Comparison 12 Hyalgan versus triamcinolone hexacetonide, Outcome 3 Pain at night (0‐100 mm VAS).
12.4. Analysis.
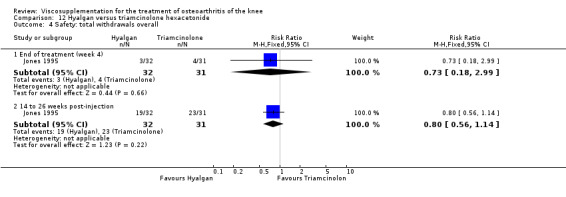
Comparison 12 Hyalgan versus triamcinolone hexacetonide, Outcome 4 Safety: total withdrawals overall.
12.5. Analysis.

Comparison 12 Hyalgan versus triamcinolone hexacetonide, Outcome 5 Safety: wIthdrawals due to lack efficacy.
12.6. Analysis.
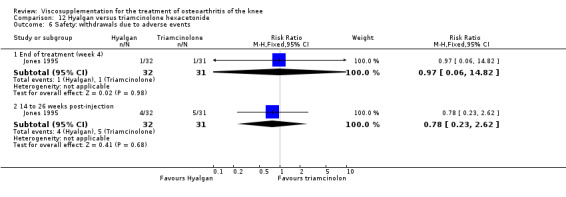
Comparison 12 Hyalgan versus triamcinolone hexacetonide, Outcome 6 Safety: wIthdrawals due to adverse events.
Comparison 13. Hyalgan versus mucopolysaccharide polysulfuric acid ester.
| Outcome or subgroup title | No. of studies | No. of participants | Statistical method | Effect size |
|---|---|---|---|---|
| 1 Pain (0‐30) change | 1 | Mean Difference (IV, Fixed, 95% CI) | Subtotals only | |
| 1.1 End of treatment at week 6 | 1 | 59 | Mean Difference (IV, Fixed, 95% CI) | 4.0 [0.98, 7.02] |
| 2 Function (0‐30) change | 1 | Mean Difference (IV, Fixed, 95% CI) | Subtotals only | |
| 2.1 End of treatment at week 6 | 1 | 59 | Mean Difference (IV, Fixed, 95% CI) | 0.60 [‐1.95, 3.15] |
| 3 Range of motion (0‐10) change | 1 | Mean Difference (IV, Fixed, 95% CI) | Subtotals only | |
| 3.1 End of treatment at week 6 | 1 | 59 | Mean Difference (IV, Fixed, 95% CI) | 0.3 [‐0.06, 0.66] |
| 4 Total Larson rating score (0‐77) change | 1 | Mean Difference (IV, Fixed, 95% CI) | Subtotals only | |
| 4.1 End of treatment at week 6 | 1 | 59 | Mean Difference (IV, Fixed, 95% CI) | 5.9 [1.31, 10.49] |
| 5 Patient global (number of patients symptom free or markedly improved) | 1 | Risk Ratio (M‐H, Fixed, 95% CI) | Subtotals only | |
| 5.1 14 to 26 weeks post‐injection | 1 | 57 | Risk Ratio (M‐H, Fixed, 95% CI) | 1.65 [1.03, 2.66] |
| 6 Safety: total withdrawals overall | 1 | Risk Ratio (M‐H, Fixed, 95% CI) | Subtotals only | |
| 6.1 14 to 26 weeks post‐injection | 1 | 60 | Risk Ratio (M‐H, Fixed, 95% CI) | 0.41 [0.04, 4.27] |
| 7 Safety: adverse events due to study medication | 1 | Risk Ratio (M‐H, Fixed, 95% CI) | Subtotals only | |
| 7.1 14 to 26 weeks post‐injection | 1 | 60 | Risk Ratio (M‐H, Fixed, 95% CI) | 2.45 [0.54, 11.19] |
13.1. Analysis.

Comparison 13 Hyalgan versus mucopolysaccharide polysulfuric acid ester, Outcome 1 Pain (0‐30) change.
13.2. Analysis.
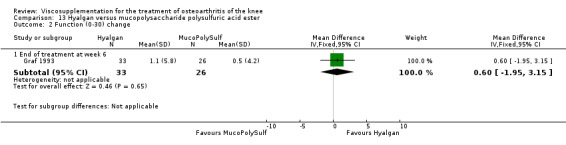
Comparison 13 Hyalgan versus mucopolysaccharide polysulfuric acid ester, Outcome 2 Function (0‐30) change.
13.3. Analysis.
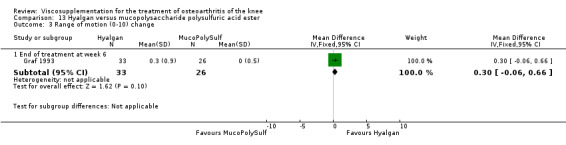
Comparison 13 Hyalgan versus mucopolysaccharide polysulfuric acid ester, Outcome 3 Range of motion (0‐10) change.
13.4. Analysis.
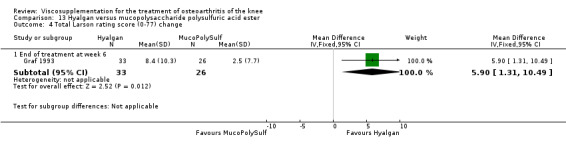
Comparison 13 Hyalgan versus mucopolysaccharide polysulfuric acid ester, Outcome 4 Total Larson rating score (0‐77) change.
13.5. Analysis.

Comparison 13 Hyalgan versus mucopolysaccharide polysulfuric acid ester, Outcome 5 Patient global (number of patients symptom free or markedly improved).
13.6. Analysis.
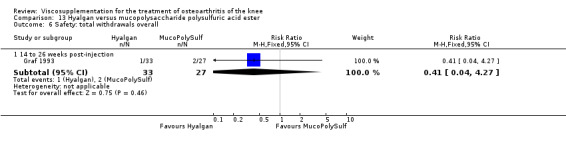
Comparison 13 Hyalgan versus mucopolysaccharide polysulfuric acid ester, Outcome 6 Safety: total withdrawals overall.
13.7. Analysis.

Comparison 13 Hyalgan versus mucopolysaccharide polysulfuric acid ester, Outcome 7 Safety: adverse events due to study medication.
Comparison 14. (Hyalgan plus exercise plus ultrasound) versus control warmup exercise.
| Outcome or subgroup title | No. of studies | No. of participants | Statistical method | Effect size |
|---|---|---|---|---|
| 1 Pain (0‐10 cm VAS) | 1 | Mean Difference (IV, Fixed, 95% CI) | Subtotals only | |
| 1.1 End of treatment | 1 | 66 | Mean Difference (IV, Fixed, 95% CI) | ‐2.40 [‐3.08, ‐1.72] |
| 1.2 One‐year follow‐up | 1 | 60 | Mean Difference (IV, Fixed, 95% CI) | ‐4.6 [‐5.32, ‐3.88] |
| 2 Lequesne Index (0‐26) | 1 | Mean Difference (IV, Fixed, 95% CI) | Subtotals only | |
| 2.1 End of treatment | 1 | 66 | Mean Difference (IV, Fixed, 95% CI) | ‐2.90 [‐3.41, ‐2.39] |
| 2.2 One‐year follow‐up | 1 | 60 | Mean Difference (IV, Fixed, 95% CI) | ‐5.60 [‐6.38, ‐4.82] |
| 3 Range of motion (degrees) | 1 | Mean Difference (IV, Fixed, 95% CI) | Subtotals only | |
| 3.1 End of treatment | 1 | 66 | Mean Difference (IV, Fixed, 95% CI) | 22.0 [16.42, 27.58] |
| 3.2 One‐year follow‐up | 1 | 60 | Mean Difference (IV, Fixed, 95% CI) | 26.0 [17.14, 34.86] |
| 4 Ambulation speed (metres per minute) | 1 | Mean Difference (IV, Fixed, 95% CI) | Subtotals only | |
| 4.1 End of treatment | 1 | 66 | Mean Difference (IV, Fixed, 95% CI) | 19.80 [18.17, 21.43] |
| 4.2 One‐year follow‐up | 1 | 60 | Mean Difference (IV, Fixed, 95% CI) | 29.20 [26.18, 32.22] |
| 5 Safety: total withdrawals overall | 1 | Risk Ratio (M‐H, Fixed, 95% CI) | Subtotals only | |
| 5.1 During treatment | 1 | 70 | Risk Ratio (M‐H, Fixed, 95% CI) | 0.33 [0.04, 3.05] |
| 5.2 Overall | 1 | 70 | Risk Ratio (M‐H, Fixed, 95% CI) | 0.43 [0.12, 1.52] |
14.1. Analysis.
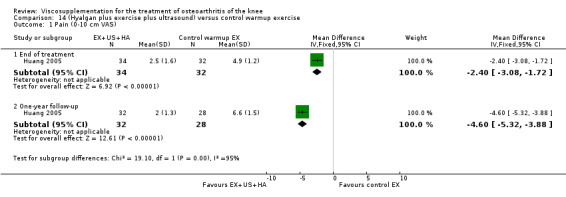
Comparison 14 (Hyalgan plus exercise plus ultrasound) versus control warmup exercise, Outcome 1 Pain (0‐10 cm VAS).
14.2. Analysis.
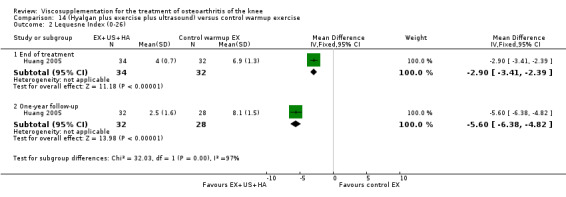
Comparison 14 (Hyalgan plus exercise plus ultrasound) versus control warmup exercise, Outcome 2 Lequesne Index (0‐26).
14.3. Analysis.

Comparison 14 (Hyalgan plus exercise plus ultrasound) versus control warmup exercise, Outcome 3 Range of motion (degrees).
14.4. Analysis.
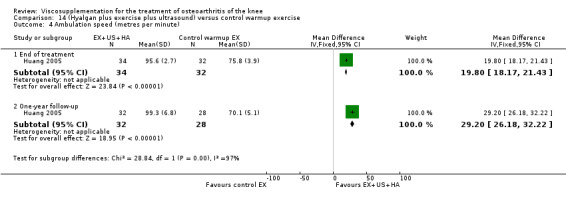
Comparison 14 (Hyalgan plus exercise plus ultrasound) versus control warmup exercise, Outcome 4 Ambulation speed (metres per minute).
14.5. Analysis.
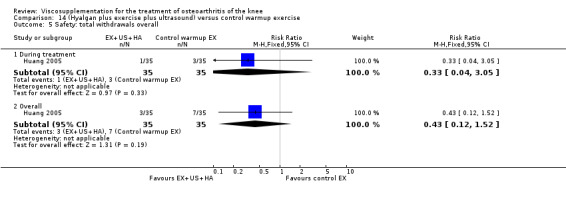
Comparison 14 (Hyalgan plus exercise plus ultrasound) versus control warmup exercise, Outcome 5 Safety: total withdrawals overall.
Comparison 15. (Hyalgan plus exercise plus ultrasound) versus exercise.
| Outcome or subgroup title | No. of studies | No. of participants | Statistical method | Effect size |
|---|---|---|---|---|
| 1 Pain (0‐10 cm VAS) | 1 | Mean Difference (IV, Fixed, 95% CI) | Subtotals only | |
| 1.1 End of treatment | 1 | 64 | Mean Difference (IV, Fixed, 95% CI) | ‐1.60 [‐2.18, ‐1.02] |
| 1.2 One‐year follow‐up | 1 | 58 | Mean Difference (IV, Fixed, 95% CI) | ‐1.9 [‐2.60, ‐1.20] |
| 2 Lequesne Index (0‐26) | 1 | Mean Difference (IV, Fixed, 95% CI) | Subtotals only | |
| 2.1 End of treatment | 1 | 64 | Mean Difference (IV, Fixed, 95% CI) | ‐2.10 [‐2.50, ‐1.70] |
| 2.2 One‐year follow‐up | 1 | 58 | Mean Difference (IV, Fixed, 95% CI) | ‐3.30 [‐4.19, ‐2.41] |
| 3 Range of motion (degrees) | 1 | Mean Difference (IV, Fixed, 95% CI) | Subtotals only | |
| 3.1 End of treatment | 1 | 64 | Mean Difference (IV, Fixed, 95% CI) | 12.0 [4.51, 19.49] |
| 3.2 One‐year follow‐up | 1 | 58 | Mean Difference (IV, Fixed, 95% CI) | 14.0 [5.76, 22.24] |
| 4 Ambulation speed (metres per minute) | 1 | Mean Difference (IV, Fixed, 95% CI) | Subtotals only | |
| 4.1 End of treatment | 1 | 64 | Mean Difference (IV, Fixed, 95% CI) | 12.70 [10.60, 14.80] |
| 4.2 One‐year follow‐up | 1 | 58 | Mean Difference (IV, Fixed, 95% CI) | 14.0 [10.57, 17.43] |
| 5 Safety: total withdrawals overall | 1 | Risk Ratio (M‐H, Fixed, 95% CI) | Subtotals only | |
| 5.1 During treatment | 1 | 70 | Risk Ratio (M‐H, Fixed, 95% CI) | 0.2 [0.02, 1.63] |
| 5.2 Overall | 1 | 70 | Risk Ratio (M‐H, Fixed, 95% CI) | 0.33 [0.10, 1.13] |
15.1. Analysis.

Comparison 15 (Hyalgan plus exercise plus ultrasound) versus exercise, Outcome 1 Pain (0‐10 cm VAS).
15.2. Analysis.

Comparison 15 (Hyalgan plus exercise plus ultrasound) versus exercise, Outcome 2 Lequesne Index (0‐26).
15.3. Analysis.
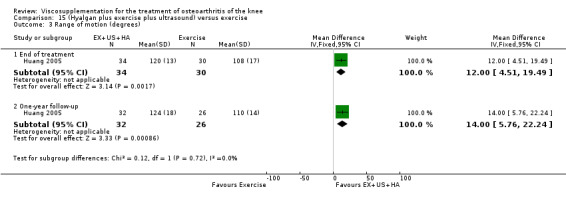
Comparison 15 (Hyalgan plus exercise plus ultrasound) versus exercise, Outcome 3 Range of motion (degrees).
15.4. Analysis.

Comparison 15 (Hyalgan plus exercise plus ultrasound) versus exercise, Outcome 4 Ambulation speed (metres per minute).
15.5. Analysis.
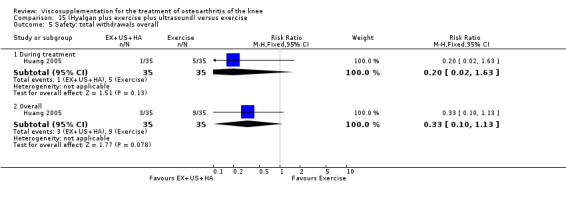
Comparison 15 (Hyalgan plus exercise plus ultrasound) versus exercise, Outcome 5 Safety: total withdrawals overall.
Comparison 16. (Hyalgan plus exercise plus ultrasound) versus (exercise plus ultrasound).
| Outcome or subgroup title | No. of studies | No. of participants | Statistical method | Effect size |
|---|---|---|---|---|
| 1 Pain (0‐10 cm VAS) | 1 | Mean Difference (IV, Fixed, 95% CI) | Subtotals only | |
| 1.1 End of treatment | 1 | 66 | Mean Difference (IV, Fixed, 95% CI) | ‐0.5 [‐1.32, 0.32] |
| 1.2 One‐year follow‐up | 1 | 61 | Mean Difference (IV, Fixed, 95% CI) | ‐0.60 [‐1.31, 0.11] |
| 2 Lequesne Index (0‐26) | 1 | Mean Difference (IV, Fixed, 95% CI) | Subtotals only | |
| 2.1 End of treatment | 1 | 66 | Mean Difference (IV, Fixed, 95% CI) | ‐0.40 [‐0.85, 0.05] |
| 2.2 One‐year follow‐up | 1 | 61 | Mean Difference (IV, Fixed, 95% CI) | ‐0.80 [‐1.58, ‐0.02] |
| 3 Range of motion (degrees) | 1 | Mean Difference (IV, Fixed, 95% CI) | Subtotals only | |
| 3.1 End of treatment | 1 | 66 | Mean Difference (IV, Fixed, 95% CI) | 6.0 [‐0.79, 12.79] |
| 3.2 One‐year follow‐up | 1 | 61 | Mean Difference (IV, Fixed, 95% CI) | 6.00 [‐2.05, 14.05] |
| 4 Ambulation speed (metres per minute) | 1 | Mean Difference (IV, Fixed, 95% CI) | Subtotals only | |
| 4.1 End of treatment | 1 | 66 | Mean Difference (IV, Fixed, 95% CI) | 5.40 [3.99, 6.81] |
| 4.2 One‐year follow‐up | 1 | 61 | Mean Difference (IV, Fixed, 95% CI) | 5.0 [1.58, 8.42] |
| 5 Safety: total withdrawals overall | 1 | Risk Ratio (M‐H, Fixed, 95% CI) | Subtotals only | |
| 5.1 During treatment | 1 | 70 | Risk Ratio (M‐H, Fixed, 95% CI) | 0.33 [0.04, 3.05] |
| 5.2 Overall | 1 | 70 | Risk Ratio (M‐H, Fixed, 95% CI) | 0.5 [0.14, 1.84] |
16.1. Analysis.

Comparison 16 (Hyalgan plus exercise plus ultrasound) versus (exercise plus ultrasound), Outcome 1 Pain (0‐10 cm VAS).
16.2. Analysis.
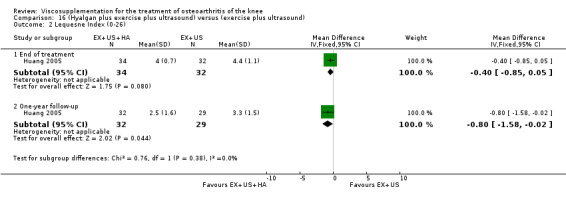
Comparison 16 (Hyalgan plus exercise plus ultrasound) versus (exercise plus ultrasound), Outcome 2 Lequesne Index (0‐26).
16.3. Analysis.
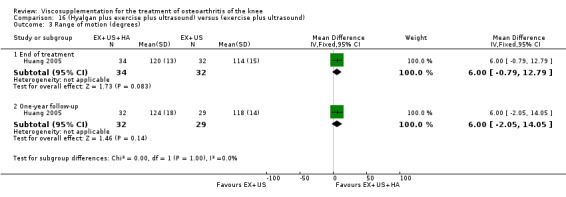
Comparison 16 (Hyalgan plus exercise plus ultrasound) versus (exercise plus ultrasound), Outcome 3 Range of motion (degrees).
16.4. Analysis.
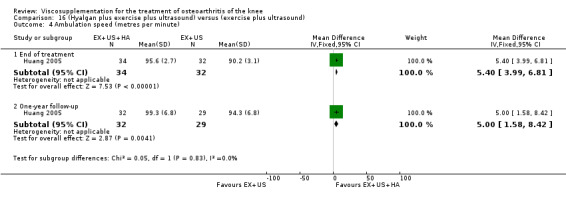
Comparison 16 (Hyalgan plus exercise plus ultrasound) versus (exercise plus ultrasound), Outcome 4 Ambulation speed (metres per minute).
16.5. Analysis.
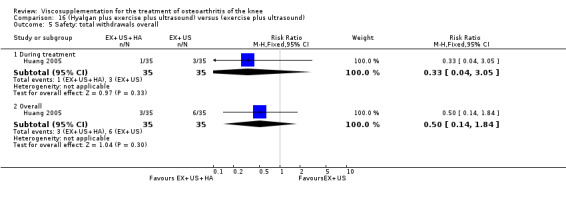
Comparison 16 (Hyalgan plus exercise plus ultrasound) versus (exercise plus ultrasound), Outcome 5 Safety: total withdrawals overall.
Comparison 17. Hyalgan versus conventional therapy (three courses of treatment).
| Outcome or subgroup title | No. of studies | No. of participants | Statistical method | Effect size |
|---|---|---|---|---|
| 1 Pain overall (0‐100 mm VAS) | 1 | Mean Difference (IV, Fixed, 95% CI) | Subtotals only | |
| 1.1 45 to 52 weeks post‐injection | 1 | 36 | Mean Difference (IV, Fixed, 95% CI) | ‐14.40 [‐31.86, 3.06] |
| 2 Lequesne Index (0‐24) | 1 | Mean Difference (IV, Fixed, 95% CI) | Subtotals only | |
| 2.1 45 to 52 weeks post‐injection | 1 | 36 | Mean Difference (IV, Fixed, 95% CI) | ‐0.90 [‐3.81, 2.01] |
| 3 Joint space width (mm) | 1 | Mean Difference (IV, Fixed, 95% CI) | Subtotals only | |
| 3.1 45 to 52 weeks post‐injection | 1 | 36 | Mean Difference (IV, Fixed, 95% CI) | 1.1 [‐0.01, 2.21] |
| 4 Quality of life (AIMS: total of 12 items) | 1 | Mean Difference (IV, Fixed, 95% CI) | Subtotals only | |
| 4.1 45 to 52 weeks post‐injection | 1 | 36 | Mean Difference (IV, Fixed, 95% CI) | ‐0.20 [‐0.98, 0.58] |
| 5 Arthroscopy overall assessment (0‐100 mm VAS) | 1 | Mean Difference (IV, Fixed, 95% CI) | Subtotals only | |
| 5.1 45 to 52 weeks post‐injection | 1 | 36 | Mean Difference (IV, Fixed, 95% CI) | ‐22.30 [‐40.52, ‐4.08] |
| 6 SFA scoring (0‐100 mm VAS) | 1 | Mean Difference (IV, Fixed, 95% CI) | Subtotals only | |
| 6.1 45 to 52 weeks post‐injection | 1 | 36 | Mean Difference (IV, Fixed, 95% CI) | ‐18.2 [‐31.27, ‐5.13] |
| 7 Safety: total withdrawals | 1 | Risk Ratio (M‐H, Fixed, 95% CI) | Subtotals only | |
| 7.1 45 to 52 weeks post‐injection | 1 | 39 | Risk Ratio (M‐H, Fixed, 95% CI) | 0.48 [0.05, 4.82] |
17.1. Analysis.
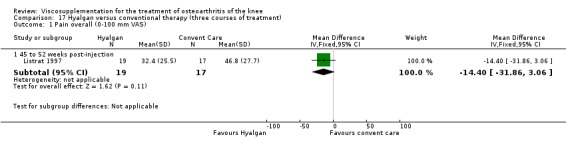
Comparison 17 Hyalgan versus conventional therapy (three courses of treatment), Outcome 1 Pain overall (0‐100 mm VAS).
17.2. Analysis.
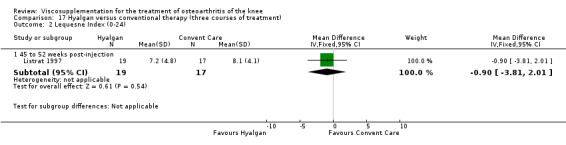
Comparison 17 Hyalgan versus conventional therapy (three courses of treatment), Outcome 2 Lequesne Index (0‐24).
17.3. Analysis.
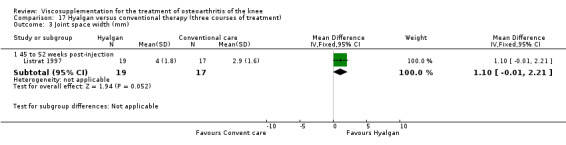
Comparison 17 Hyalgan versus conventional therapy (three courses of treatment), Outcome 3 Joint space width (mm).
17.4. Analysis.
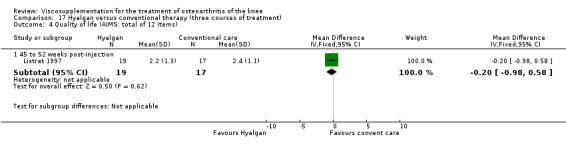
Comparison 17 Hyalgan versus conventional therapy (three courses of treatment), Outcome 4 Quality of life (AIMS: total of 12 items).
17.5. Analysis.
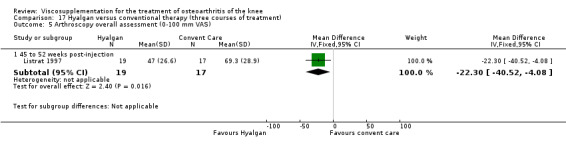
Comparison 17 Hyalgan versus conventional therapy (three courses of treatment), Outcome 5 Arthroscopy overall assessment (0‐100 mm VAS).
17.6. Analysis.
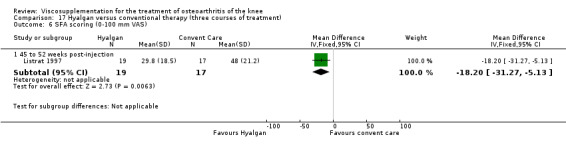
Comparison 17 Hyalgan versus conventional therapy (three courses of treatment), Outcome 6 SFA scoring (0‐100 mm VAS).
17.7. Analysis.
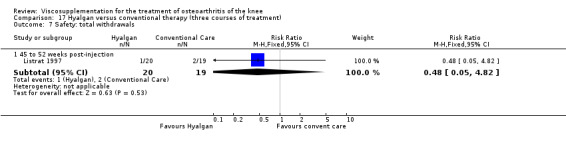
Comparison 17 Hyalgan versus conventional therapy (three courses of treatment), Outcome 7 Safety: total withdrawals.
Comparison 18. Hyalgan versus Hylan G‐F 20.
| Outcome or subgroup title | No. of studies | No. of participants | Statistical method | Effect size |
|---|---|---|---|---|
| 1 Safety: number of patients with local reaction (acute inflammation and pain) | 1 | Risk Ratio (M‐H, Fixed, 95% CI) | Subtotals only |
18.1. Analysis.

Comparison 18 Hyalgan versus Hylan G‐F 20, Outcome 1 Safety: number of patients with local reaction (acute inflammation and pain).
Comparison 19. Hyalgan versus Hyalgan.
| Outcome or subgroup title | No. of studies | No. of participants | Statistical method | Effect size |
|---|---|---|---|---|
| 1 Patient global (number of patients assessing response as satisfactory) | 1 | Risk Ratio (M‐H, Fixed, 95% CI) | Subtotals only | |
| 1.1 45 to 52 weeks post‐injection | 1 | 159 | Risk Ratio (M‐H, Fixed, 95% CI) | 0.85 [0.70, 1.03] |
19.1. Analysis.

Comparison 19 Hyalgan versus Hyalgan, Outcome 1 Patient global (number of patients assessing response as satisfactory).
Comparison 20. Hylan G‐F 20 versus placebo.
| Outcome or subgroup title | No. of studies | No. of participants | Statistical method | Effect size |
|---|---|---|---|---|
| 1 Pain on weight bearing (0‐100 mm VAS) | 6 | Mean Difference (IV, Random, 95% CI) | Subtotals only | |
| 1.1 1 to 4 weeks post‐injection | 6 | 481 | Mean Difference (IV, Random, 95% CI) | ‐12.54 [‐20.39, ‐4.69] |
| 1.2 5 to 13 weeks post‐injection | 5 | 385 | Mean Difference (IV, Random, 95% CI) | ‐22.46 [‐35.24, ‐9.68] |
| 1.3 14 to 26 weeks post‐injection | 4 | 301 | Mean Difference (IV, Random, 95% CI) | ‐20.70 [‐35.56, ‐5.83] |
| 2 Pain walking (0‐100 mm VAS) | 2 | Mean Difference (IV, Fixed, 95% CI) | Subtotals only | |
| 2.1 1 to 4 weeks post‐injection | 2 | 124 | Mean Difference (IV, Fixed, 95% CI) | ‐3.96 [‐9.01, 1.10] |
| 2.2 5 to 13 weeks post‐injection | 1 | 30 | Mean Difference (IV, Fixed, 95% CI) | ‐13.80 [‐19.74, ‐7.86] |
| 3 WOMAC pain | 3 | Std. Mean Difference (IV, Fixed, 95% CI) | Subtotals only | |
| 3.1 1 to 4 weeks post‐injection | 2 | 60 | Std. Mean Difference (IV, Fixed, 95% CI) | ‐1.26 [‐1.86, ‐0.66] |
| 3.2 5 to 13 weeks post‐injection | 3 | 170 | Std. Mean Difference (IV, Fixed, 95% CI) | ‐0.69 [‐1.02, ‐0.36] |
| 3.3 14 to 26 weeks post‐injection | 1 | 30 | Std. Mean Difference (IV, Fixed, 95% CI) | ‐1.09 [‐1.92, ‐0.25] |
| 4 Pain at night (0‐100 mm VAS) | 6 | Mean Difference (IV, Fixed, 95% CI) | Subtotals only | |
| 4.1 1 to 4 weeks post‐injection | 6 | 391 | Mean Difference (IV, Fixed, 95% CI) | ‐8.03 [‐11.95, ‐4.12] |
| 4.2 5 to 13 weeks post‐injection | 5 | 295 | Mean Difference (IV, Fixed, 95% CI) | ‐14.47 [‐18.57, ‐10.38] |
| 4.3 14 to 26 weeks post‐injection | 3 | 182 | Mean Difference (IV, Fixed, 95% CI) | ‐17.12 [‐23.22, ‐11.02] |
| 5 Pain at rest (0‐100 mm VAS) | 2 | Mean Difference (IV, Fixed, 95% CI) | Subtotals only | |
| 5.1 1 to 4 weeks post‐injection | 2 | 124 | Mean Difference (IV, Fixed, 95% CI) | ‐9.44 [‐14.07, ‐4.82] |
| 5.2 5 to 13 weeks post‐injection | 1 | 30 | Mean Difference (IV, Fixed, 95% CI) | ‐18.67 [‐23.32, ‐14.02] |
| 6 Pain overall (0‐100 mm VAS) | 1 | Mean Difference (IV, Fixed, 95% CI) | Subtotals only | |
| 6.1 1 to 4 weeks post‐injection | 1 | 94 | Mean Difference (IV, Fixed, 95% CI) | ‐2.0 [‐13.09, 9.09] |
| 7 WOMAC physical function | 3 | Mean Difference (IV, Fixed, 95% CI) | Subtotals only | |
| 7.1 1 to 4 weeks post‐injection | 2 | 60 | Mean Difference (IV, Fixed, 95% CI) | ‐7.09 [‐10.62, ‐3.56] |
| 7.2 5 to 13 weeks post‐injection | 3 | 170 | Mean Difference (IV, Fixed, 95% CI) | ‐11.91 [‐15.06, ‐8.76] |
| 7.3 14 to 26 weeks post‐injection | 1 | 30 | Mean Difference (IV, Fixed, 95% CI) | ‐17.0 [‐26.90, ‐7.10] |
| 8 Lequesne Index (0‐24) | 2 | Mean Difference (IV, Fixed, 95% CI) | Subtotals only | |
| 8.1 5 to 13 weeks post‐injection | 1 | 110 | Mean Difference (IV, Fixed, 95% CI) | ‐1.60 [‐2.98, ‐0.22] |
| 8.2 14 to 26 weeks post‐injection | 1 | 154 | Mean Difference (IV, Fixed, 95% CI) | 0.10 [‐1.38, 1.58] |
| 9 Function: improvment in most painful knee movement (0‐100 mm VAS) | 4 | Mean Difference (IV, Fixed, 95% CI) | Subtotals only | |
| 9.1 1 to 4 weeks post‐injection | 4 | 267 | Mean Difference (IV, Fixed, 95% CI) | 19.29 [12.26, 26.31] |
| 9.2 5 to 13 weeks post‐injection | 4 | 263 | Mean Difference (IV, Fixed, 95% CI) | 33.25 [26.18, 40.31] |
| 10 15 metre walking time | 1 | Mean Difference (IV, Fixed, 95% CI) | Subtotals only | |
| 10.1 1 to 4 weeks post‐injection | 1 | 30 | Mean Difference (IV, Fixed, 95% CI) | 0.80 [‐0.61, 2.21] |
| 10.2 5 to 13 weeks post‐injection | 1 | 30 | Mean Difference (IV, Fixed, 95% CI) | ‐0.87 [‐2.52, 0.78] |
| 11 WOMAC stiffness (2 to 10 Likert) | 2 | Mean Difference (IV, Fixed, 95% CI) | Subtotals only | |
| 11.1 1 to 4 weeks post‐injection | 2 | 60 | Mean Difference (IV, Fixed, 95% CI) | ‐1.08 [‐1.73, ‐0.44] |
| 11.2 5 to 13 weeks post‐injection | 2 | 60 | Mean Difference (IV, Fixed, 95% CI) | ‐1.34 [‐2.13, ‐0.55] |
| 11.3 14 to 26 weeks post‐injection | 1 | 39 | Mean Difference (IV, Fixed, 95% CI) | ‐1.0 [‐1.89, ‐0.11] |
| 12 Patient global assessment (0‐100 mm VAS; where 100 is worst severity) | 1 | Mean Difference (IV, Fixed, 95% CI) | Subtotals only | |
| 12.1 1 to 4 weeks post‐injection | 1 | 30 | Mean Difference (IV, Fixed, 95% CI) | ‐20.0 [‐33.16, ‐6.84] |
| 12.2 5 to 13 weeks post‐injection | 1 | 30 | Mean Difference (IV, Fixed, 95% CI) | ‐20.0 [‐30.57, ‐9.43] |
| 12.3 14 to 26 weeks post injection | 1 | 30 | Mean Difference (IV, Fixed, 95% CI) | 0.0 [‐12.68, 12.68] |
| 13 Patient global assessment (number of patients good or very good) 5 to 13 weeks post‐injection | 1 | Risk Ratio (M‐H, Fixed, 95% CI) | Subtotals only | |
| 14 Patient global evaluation of efficacy due to treatment | 5 | Std. Mean Difference (IV, Fixed, 95% CI) | Subtotals only | |
| 14.1 1 to 4 weeks post‐injection | 5 | 298 | Std. Mean Difference (IV, Fixed, 95% CI) | 0.70 [0.46, 0.93] |
| 14.2 5 to 13 weeks post‐injection | 5 | 295 | Std. Mean Difference (IV, Fixed, 95% CI) | 1.23 [0.97, 1.48] |
| 15 Physician global assessment (0‐100 mm VAS; where 100 is worst severity) | 1 | Mean Difference (IV, Fixed, 95% CI) | Subtotals only | |
| 15.1 1 to 4 weeks post‐injection | 1 | 30 | Mean Difference (IV, Fixed, 95% CI) | ‐20.0 [‐37.64, ‐2.36] |
| 15.2 5 to 13 weeks post‐injection | 1 | 30 | Mean Difference (IV, Fixed, 95% CI) | ‐20.0 [‐36.10, ‐3.90] |
| 15.3 14 to 26 weeks post injection | 1 | 30 | Mean Difference (IV, Fixed, 95% CI) | ‐10.00 [‐26.38, 6.38] |
| 16 Number of survivors (patients not requiring additional treatment for study knee) | 1 | Risk Ratio (M‐H, Fixed, 95% CI) | Subtotals only | |
| 16.1 45 to 52 weeks post‐injection | 1 | 152 | Risk Ratio (M‐H, Fixed, 95% CI) | 1.33 [0.87, 2.01] |
| 17 Number of clinical failures | 1 | Risk Ratio (M‐H, Fixed, 95% CI) | Subtotals only | |
| 17.1 14 to 26 weeks post‐injection | 1 | 152 | Risk Ratio (M‐H, Fixed, 95% CI) | 0.66 [0.23, 1.87] |
| 17.2 45 to 52 weeks post‐injection | 1 | 118 | Risk Ratio (M‐H, Fixed, 95% CI) | 0.84 [0.59, 1.22] |
| 18 Need for paracetamol (pill count) | 1 | Mean Difference (IV, Fixed, 95% CI) | Subtotals only | |
| 18.1 1 to 4 weeks post‐injection | 1 | 30 | Mean Difference (IV, Fixed, 95% CI) | 0.0 [0.0, 0.0] |
| 18.2 5 to 13 weeks post‐injection | 1 | 30 | Mean Difference (IV, Fixed, 95% CI) | 0.0 [0.0, 0.0] |
| 19 Safety: total withdrawals overall | 6 | Risk Ratio (M‐H, Fixed, 95% CI) | Subtotals only | |
| 19.1 1 to 4 weeks post‐injection | 1 | 94 | Risk Ratio (M‐H, Fixed, 95% CI) | 0.70 [0.12, 3.97] |
| 19.2 5 to 13 weeks post‐injection | 4 | 329 | Risk Ratio (M‐H, Fixed, 95% CI) | 1.40 [0.64, 3.06] |
| 19.3 14 to 26 weeks post‐injection | 1 | 52 | Risk Ratio (M‐H, Fixed, 95% CI) | 0.63 [0.24, 1.66] |
| 20 Safety: number of patients withdrawn due to noncomplinance | 1 | Risk Ratio (M‐H, Fixed, 95% CI) | Subtotals only | |
| 21 Safety: number of patients with local reaction | 6 | Risk Ratio (M‐H, Random, 95% CI) | Subtotals only | |
| 22 Safety: number of patients with local adverse reactions but study drug continued | 1 | Risk Ratio (M‐H, Fixed, 95% CI) | Subtotals only | |
| 22.1 1 to 4 weeks post‐injection | 1 | 30 | Risk Ratio (M‐H, Fixed, 95% CI) | 3.0 [0.13, 68.26] |
| 23 Safety: number of patients with one or more probable or possible related systemic adverse events | 1 | Risk Ratio (M‐H, Fixed, 95% CI) | Subtotals only | |
| 23.1 5 to 13 weeks post‐injection | 1 | 104 | Risk Ratio (M‐H, Fixed, 95% CI) | 1.98 [0.79, 4.96] |
| 24 Safety: number of patients reporting systemic reactions | 3 | Risk Ratio (M‐H, Fixed, 95% CI) | Subtotals only | |
| 24.1 5 to 13 weeks post‐injection | 3 | 219 | Risk Ratio (M‐H, Fixed, 95% CI) | 7.36 [0.39, 139.44] |
20.1. Analysis.
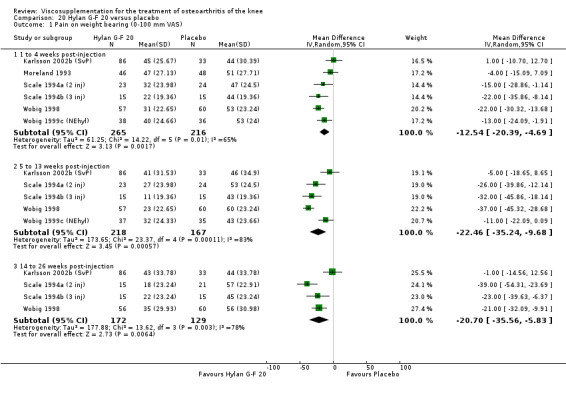
Comparison 20 Hylan G‐F 20 versus placebo, Outcome 1 Pain on weight bearing (0‐100 mm VAS).
20.2. Analysis.
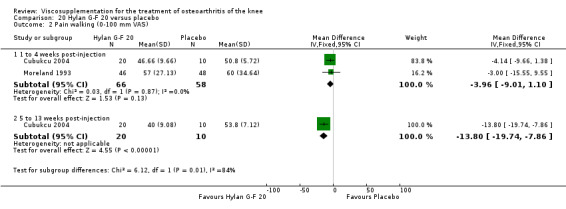
Comparison 20 Hylan G‐F 20 versus placebo, Outcome 2 Pain walking (0‐100 mm VAS).
20.3. Analysis.
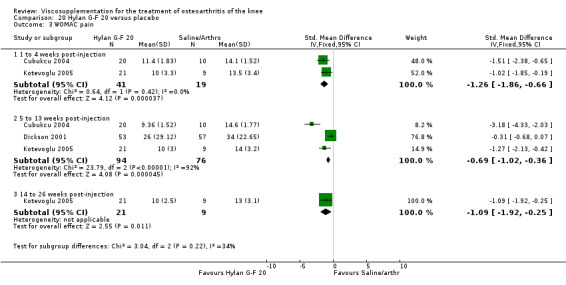
Comparison 20 Hylan G‐F 20 versus placebo, Outcome 3 WOMAC pain.
20.4. Analysis.
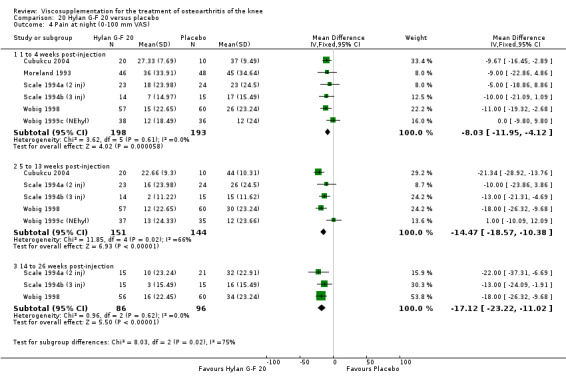
Comparison 20 Hylan G‐F 20 versus placebo, Outcome 4 Pain at night (0‐100 mm VAS).
20.5. Analysis.

Comparison 20 Hylan G‐F 20 versus placebo, Outcome 5 Pain at rest (0‐100 mm VAS).
20.6. Analysis.
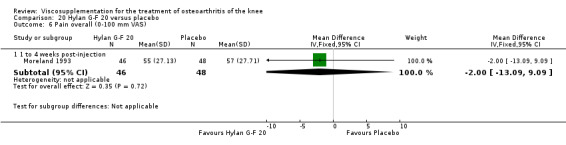
Comparison 20 Hylan G‐F 20 versus placebo, Outcome 6 Pain overall (0‐100 mm VAS).
20.7. Analysis.
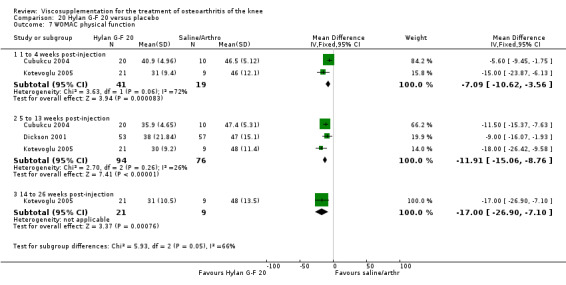
Comparison 20 Hylan G‐F 20 versus placebo, Outcome 7 WOMAC physical function.
20.8. Analysis.

Comparison 20 Hylan G‐F 20 versus placebo, Outcome 8 Lequesne Index (0‐24).
20.9. Analysis.
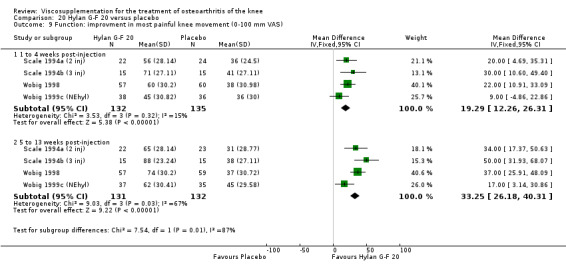
Comparison 20 Hylan G‐F 20 versus placebo, Outcome 9 Function: improvment in most painful knee movement (0‐100 mm VAS).
20.10. Analysis.

Comparison 20 Hylan G‐F 20 versus placebo, Outcome 10 15 metre walking time.
20.11. Analysis.
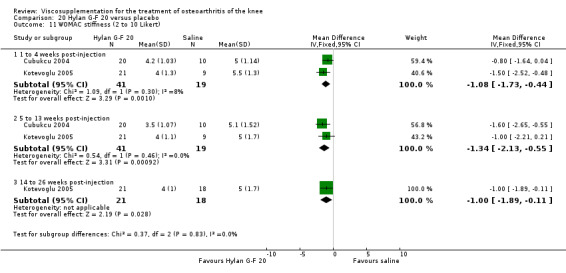
Comparison 20 Hylan G‐F 20 versus placebo, Outcome 11 WOMAC stiffness (2 to 10 Likert).
20.12. Analysis.

Comparison 20 Hylan G‐F 20 versus placebo, Outcome 12 Patient global assessment (0‐100 mm VAS; where 100 is worst severity).
20.13. Analysis.
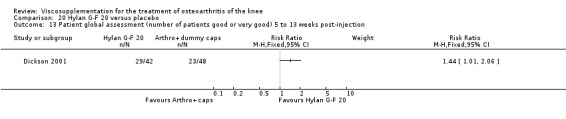
Comparison 20 Hylan G‐F 20 versus placebo, Outcome 13 Patient global assessment (number of patients good or very good) 5 to 13 weeks post‐injection.
20.14. Analysis.
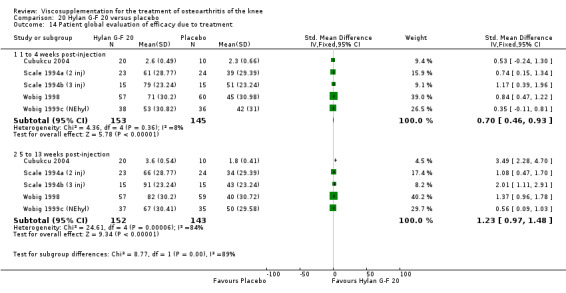
Comparison 20 Hylan G‐F 20 versus placebo, Outcome 14 Patient global evaluation of efficacy due to treatment.
20.15. Analysis.
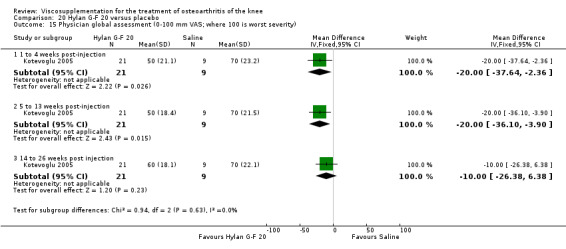
Comparison 20 Hylan G‐F 20 versus placebo, Outcome 15 Physician global assessment (0‐100 mm VAS; where 100 is worst severity).
20.16. Analysis.

Comparison 20 Hylan G‐F 20 versus placebo, Outcome 16 Number of survivors (patients not requiring additional treatment for study knee).
20.17. Analysis.
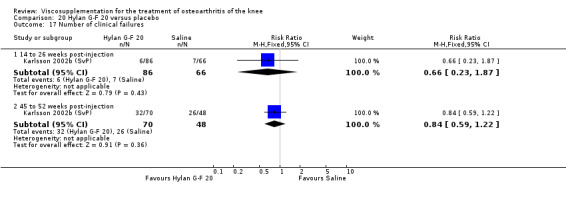
Comparison 20 Hylan G‐F 20 versus placebo, Outcome 17 Number of clinical failures.
20.18. Analysis.

Comparison 20 Hylan G‐F 20 versus placebo, Outcome 18 Need for paracetamol (pill count).
20.19. Analysis.
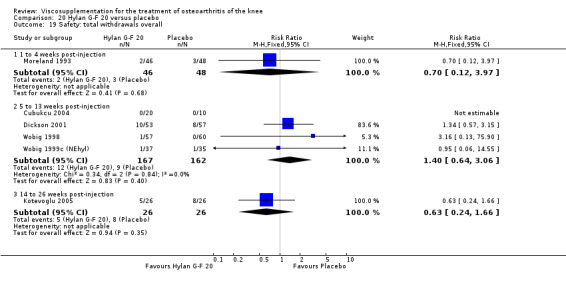
Comparison 20 Hylan G‐F 20 versus placebo, Outcome 19 Safety: total withdrawals overall.
20.20. Analysis.

Comparison 20 Hylan G‐F 20 versus placebo, Outcome 20 Safety: number of patients withdrawn due to noncomplinance.
20.21. Analysis.

Comparison 20 Hylan G‐F 20 versus placebo, Outcome 21 Safety: number of patients with local reaction.
20.22. Analysis.

Comparison 20 Hylan G‐F 20 versus placebo, Outcome 22 Safety: number of patients with local adverse reactions but study drug continued.
20.23. Analysis.

Comparison 20 Hylan G‐F 20 versus placebo, Outcome 23 Safety: number of patients with one or more probable or possible related systemic adverse events.
20.24. Analysis.
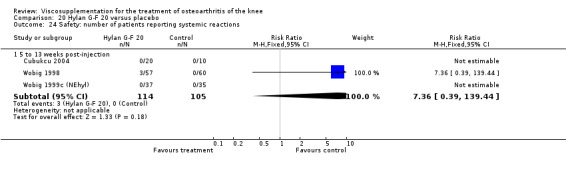
Comparison 20 Hylan G‐F 20 versus placebo, Outcome 24 Safety: number of patients reporting systemic reactions.
Comparison 21. Hylan G‐F 20 versus NSAID.
| Outcome or subgroup title | No. of studies | No. of participants | Statistical method | Effect size |
|---|---|---|---|---|
| 1 Pain on motion (0‐100 mm VAS) | 1 | Mean Difference (IV, Fixed, 95% CI) | Subtotals only | |
| 1.1 5 to 13 weeks post‐injection | 1 | 57 | Mean Difference (IV, Fixed, 95% CI) | ‐6.0 [‐17.09, 5.09] |
| 1.2 14 to 26 weeks post‐injection | 1 | 58 | Mean Difference (IV, Fixed, 95% CI) | ‐10.00 [‐24.55, 0.55] |
| 2 WOMAC pain (0‐100 mm VAS) | 1 | Mean Difference (IV, Fixed, 95% CI) | Subtotals only | |
| 2.1 5 to 13 weeks post‐injection | 1 | 108 | Mean Difference (IV, Fixed, 95% CI) | ‐12.0 [‐23.09, ‐0.91] |
| 3 Pain at rest (0‐100 mm VAS) | 1 | Mean Difference (IV, Fixed, 95% CI) | Subtotals only | |
| 3.1 5 to 13 weeks post‐injection | 1 | 57 | Mean Difference (IV, Fixed, 95% CI) | ‐3.0 [‐14.09, 8.09] |
| 3.2 14 to 26 weeks post‐injection | 1 | 58 | Mean Difference (IV, Fixed, 95% CI) | ‐3.0 [‐12.80, 6.80] |
| 4 Pain at night (0‐100 mm VAS) | 1 | Mean Difference (IV, Fixed, 95% CI) | Subtotals only | |
| 4.1 5 to 13 weeks post‐injection | 1 | 57 | Mean Difference (IV, Fixed, 95% CI) | ‐5.00 [‐19.55, 5.55] |
| 4.2 14 to 26 weeks post‐injection | 1 | 58 | Mean Difference (IV, Fixed, 95% CI) | ‐1.00 [‐15.55, 9.55] |
| 5 Pain overall (0‐100 mm VAS) | 1 | Mean Difference (IV, Fixed, 95% CI) | Subtotals only | |
| 5.1 5 to 13 weeks post‐injection | 1 | 57 | Mean Difference (IV, Fixed, 95% CI) | ‐5.0 [‐18.86, 8.86] |
| 5.2 14 to 26 weeks post‐injection | 1 | 58 | Mean Difference (IV, Fixed, 95% CI) | ‐5.0 [‐16.09, 6.09] |
| 6 WOMAC function (0‐100 mm VAS) | 1 | Mean Difference (IV, Fixed, 95% CI) | Subtotals only | |
| 6.1 5 to 13 weeks post‐injection | 1 | 108 | Mean Difference (IV, Fixed, 95% CI) | ‐4.0 [‐11.07, 3.07] |
| 7 Lequesne Index (0‐24) | 1 | Mean Difference (IV, Fixed, 95% CI) | Subtotals only | |
| 7.1 5 to 13 weeks post‐injection | 1 | 108 | Mean Difference (IV, Fixed, 95% CI) | ‐1.0 [‐2.39, 0.39] |
| 8 Patient overall assessment of treatment (number of patients excellent, very good, good) | 2 | Risk Ratio (M‐H, Fixed, 95% CI) | Subtotals only | |
| 8.1 5 to 13 weeks post‐injection (numbe of patients very good or good) | 1 | 84 | Risk Ratio (M‐H, Fixed, 95% CI) | 0.83 [0.65, 1.06] |
| 8.2 14 to 26 weeks post‐injection (number of patients excellent/very good/good) | 1 | 58 | Risk Ratio (M‐H, Fixed, 95% CI) | 1.63 [0.96, 2.76] |
| 9 Safety: total withdrawals overall | 2 | Risk Ratio (M‐H, Fixed, 95% CI) | Subtotals only | |
| 9.1 5 to 13 weeks post‐injection | 1 | 108 | Risk Ratio (M‐H, Fixed, 95% CI) | 0.80 [0.38, 1.66] |
| 9.2 14 to 26 weeks post‐injection | 1 | 65 | Risk Ratio (M‐H, Fixed, 95% CI) | 1.46 [0.36, 6.02] |
| 10 Safety: number of patients with local reactions | 1 | Risk Ratio (M‐H, Fixed, 95% CI) | Subtotals only | |
| 10.1 5 to 13 weeks post‐injection | 1 | 102 | Risk Ratio (M‐H, Fixed, 95% CI) | 1.82 [0.57, 5.84] |
| 11 Safety: number of patients with probable or possible related systemic adverse events | 1 | Risk Ratio (M‐H, Fixed, 95% CI) | Subtotals only | |
| 11.1 5 to 13 weeks post‐injection | 1 | 102 | Risk Ratio (M‐H, Fixed, 95% CI) | 0.46 [0.25, 0.83] |
| 12 Safety: withdrawals due to adverse events | 1 | Risk Ratio (M‐H, Fixed, 95% CI) | Subtotals only | |
| 12.1 14 to 26 weeks post‐injection | 1 | 65 | Risk Ratio (M‐H, Fixed, 95% CI) | 3.28 [0.14, 77.69] |
21.1. Analysis.
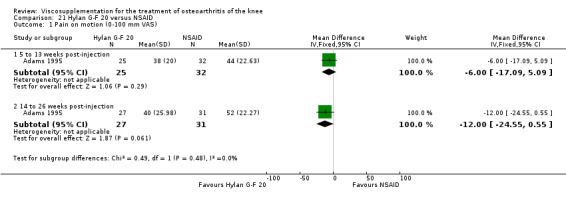
Comparison 21 Hylan G‐F 20 versus NSAID, Outcome 1 Pain on motion (0‐100 mm VAS).
21.2. Analysis.
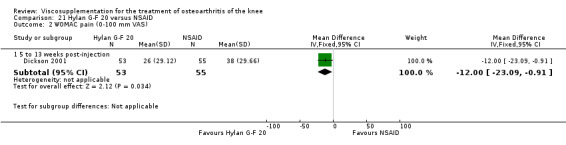
Comparison 21 Hylan G‐F 20 versus NSAID, Outcome 2 WOMAC pain (0‐100 mm VAS).
21.3. Analysis.
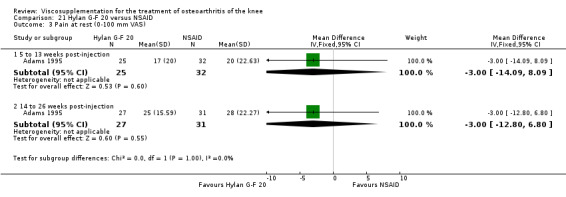
Comparison 21 Hylan G‐F 20 versus NSAID, Outcome 3 Pain at rest (0‐100 mm VAS).
21.4. Analysis.
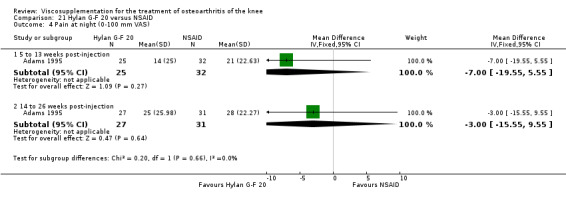
Comparison 21 Hylan G‐F 20 versus NSAID, Outcome 4 Pain at night (0‐100 mm VAS).
21.5. Analysis.
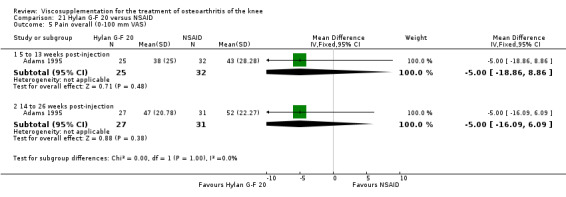
Comparison 21 Hylan G‐F 20 versus NSAID, Outcome 5 Pain overall (0‐100 mm VAS).
21.6. Analysis.
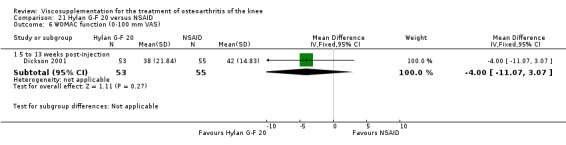
Comparison 21 Hylan G‐F 20 versus NSAID, Outcome 6 WOMAC function (0‐100 mm VAS).
21.7. Analysis.
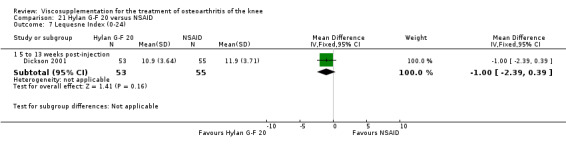
Comparison 21 Hylan G‐F 20 versus NSAID, Outcome 7 Lequesne Index (0‐24).
21.8. Analysis.
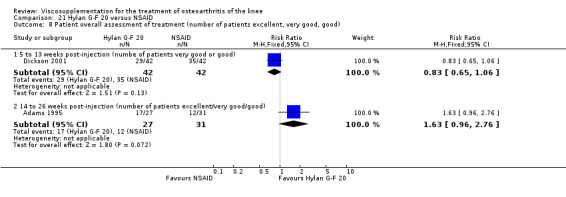
Comparison 21 Hylan G‐F 20 versus NSAID, Outcome 8 Patient overall assessment of treatment (number of patients excellent, very good, good).
21.9. Analysis.
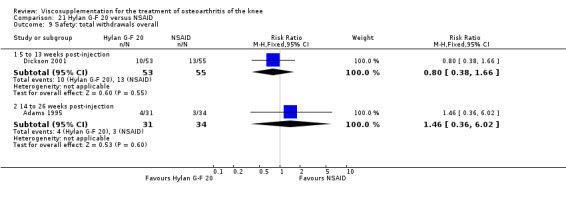
Comparison 21 Hylan G‐F 20 versus NSAID, Outcome 9 Safety: total withdrawals overall.
21.10. Analysis.

Comparison 21 Hylan G‐F 20 versus NSAID, Outcome 10 Safety: number of patients with local reactions.
21.11. Analysis.
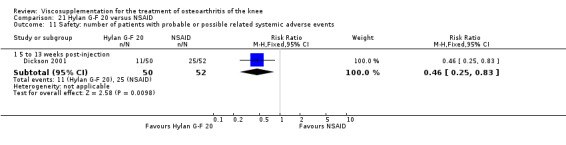
Comparison 21 Hylan G‐F 20 versus NSAID, Outcome 11 Safety: number of patients with probable or possible related systemic adverse events.
21.12. Analysis.
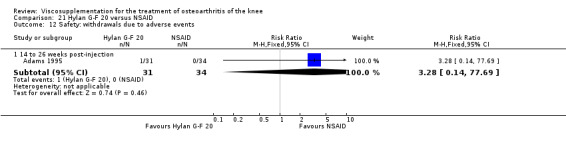
Comparison 21 Hylan G‐F 20 versus NSAID, Outcome 12 Safety: withdrawals due to adverse events.
Comparison 22. (Hylan G‐F 20 + NSAID + arthrocentesis) versus (NSAID + arthrocentesis).
| Outcome or subgroup title | No. of studies | No. of participants | Statistical method | Effect size |
|---|---|---|---|---|
| 1 Pain on motion (0‐100 mm VAS) | 1 | Mean Difference (IV, Fixed, 95% CI) | Subtotals only | |
| 1.1 5 to 13 weeks post‐injection | 1 | 64 | Mean Difference (IV, Fixed, 95% CI) | ‐10.0 [‐21.09, 1.09] |
| 1.2 14 to 26 weeks post‐injection | 1 | 63 | Mean Difference (IV, Fixed, 95% CI) | ‐15.0 [‐26.09, ‐3.91] |
| 2 Pain at rest (0‐100 mm VAS) | 1 | Mean Difference (IV, Fixed, 95% CI) | Subtotals only | |
| 2.1 5 to 13 weeks post‐injection | 1 | 64 | Mean Difference (IV, Fixed, 95% CI) | ‐6.00 [‐17.09, 5.09] |
| 2.2 14 to 26 weeks post‐injection | 1 | 63 | Mean Difference (IV, Fixed, 95% CI) | ‐11.0 [‐19.31, ‐2.69] |
| 3 Pain at night (0‐100 mm VAS) | 1 | Mean Difference (IV, Fixed, 95% CI) | Subtotals only | |
| 3.1 5 to 13 weeks post‐injection | 1 | 64 | Mean Difference (IV, Fixed, 95% CI) | ‐11.0 [‐22.09, 0.09] |
| 3.2 14 to 26 weeks post‐injection | 1 | 63 | Mean Difference (IV, Fixed, 95% CI) | ‐19.0 [‐30.09, ‐7.91] |
| 4 Pain overall (0‐100 mm VAS) | 1 | Mean Difference (IV, Fixed, 95% CI) | Subtotals only | |
| 4.1 5 to 13 weeks post‐injection | 1 | 64 | Mean Difference (IV, Fixed, 95% CI) | ‐10.00 [‐24.55, 0.55] |
| 4.2 14 to 26 weeks post‐injection | 1 | 63 | Mean Difference (IV, Fixed, 95% CI) | ‐15.0 [‐26.09, ‐3.91] |
| 5 Patient overall assessment of treatment (number of patients excellent, very good, or good) | 1 | Risk Ratio (M‐H, Fixed, 95% CI) | Subtotals only | |
| 5.1 14 to 26 weeks post‐injection | 1 | 59 | Risk Ratio (M‐H, Fixed, 95% CI) | 1.12 [0.73, 1.70] |
| 6 Safety: total withdrawals overall | 1 | Risk Ratio (M‐H, Fixed, 95% CI) | Subtotals only | |
| 6.1 14 to 26 weeks post‐injection | 1 | 71 | Risk Ratio (M‐H, Fixed, 95% CI) | 1.53 [0.40, 5.93] |
22.1. Analysis.
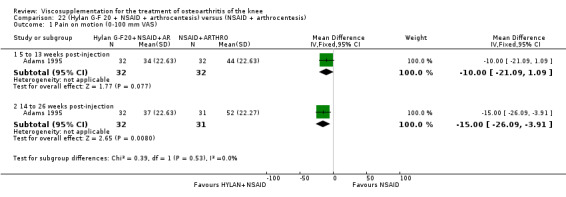
Comparison 22 (Hylan G‐F 20 + NSAID + arthrocentesis) versus (NSAID + arthrocentesis), Outcome 1 Pain on motion (0‐100 mm VAS).
22.2. Analysis.

Comparison 22 (Hylan G‐F 20 + NSAID + arthrocentesis) versus (NSAID + arthrocentesis), Outcome 2 Pain at rest (0‐100 mm VAS).
22.3. Analysis.

Comparison 22 (Hylan G‐F 20 + NSAID + arthrocentesis) versus (NSAID + arthrocentesis), Outcome 3 Pain at night (0‐100 mm VAS).
22.4. Analysis.

Comparison 22 (Hylan G‐F 20 + NSAID + arthrocentesis) versus (NSAID + arthrocentesis), Outcome 4 Pain overall (0‐100 mm VAS).
22.5. Analysis.
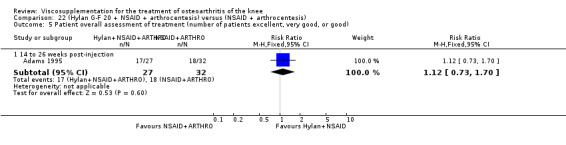
Comparison 22 (Hylan G‐F 20 + NSAID + arthrocentesis) versus (NSAID + arthrocentesis), Outcome 5 Patient overall assessment of treatment (number of patients excellent, very good, or good).
22.6. Analysis.
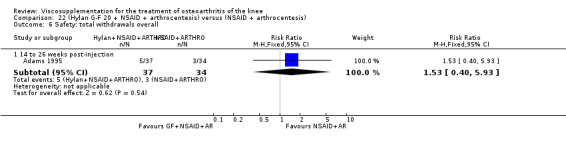
Comparison 22 (Hylan G‐F 20 + NSAID + arthrocentesis) versus (NSAID + arthrocentesis), Outcome 6 Safety: total withdrawals overall.
Comparison 23. Hylan G‐F 20 versus betamethasone.
| Outcome or subgroup title | No. of studies | No. of participants | Statistical method | Effect size |
|---|---|---|---|---|
| 1 Safety: total withdrawals overall | 1 | Risk Ratio (M‐H, Fixed, 95% CI) | Subtotals only | |
| 2 Safety: wIthdrawals due to lack of efficacy | 1 | Risk Ratio (M‐H, Fixed, 95% CI) | Subtotals only | |
| 3 Safety: wIthdrawals due to acute local reaction | 1 | Risk Ratio (M‐H, Fixed, 95% CI) | Subtotals only |
23.1. Analysis.
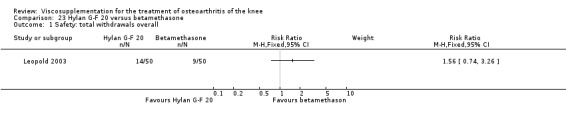
Comparison 23 Hylan G‐F 20 versus betamethasone, Outcome 1 Safety: total withdrawals overall.
23.2. Analysis.

Comparison 23 Hylan G‐F 20 versus betamethasone, Outcome 2 Safety: wIthdrawals due to lack of efficacy.
23.3. Analysis.
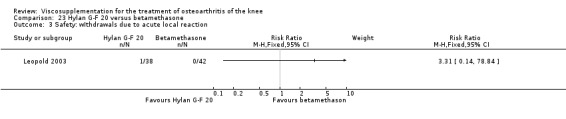
Comparison 23 Hylan G‐F 20 versus betamethasone, Outcome 3 Safety: wIthdrawals due to acute local reaction.
Comparison 24. Hylan G‐F 20 versus triamcinolone hexacetonide.
| Outcome or subgroup title | No. of studies | No. of participants | Statistical method | Effect size |
|---|---|---|---|---|
| 1 WOMAC pain walking on a flat surface (Question 1: 0‐4 Likert) | 1 | Mean Difference (IV, Fixed, 95% CI) | Subtotals only | |
| 1.1 5 to 13 weeks post‐injection | 1 | 215 | Mean Difference (IV, Fixed, 95% CI) | ‐0.40 [‐0.65, ‐0.15] |
| 1.2 14 to 26 weeks post‐injection | 1 | 215 | Mean Difference (IV, Fixed, 95% CI) | ‐0.40 [‐0.68, ‐0.12] |
| 2 WOMAC physical function subscale (0‐68 Likert) | 1 | Mean Difference (IV, Fixed, 95% CI) | Subtotals only | |
| 2.1 5 to 13 weeks post‐injection | 1 | 215 | Mean Difference (IV, Fixed, 95% CI) | ‐5.0 [‐8.86, ‐1.14] |
| 2.2 14 to 26 weeks post‐injection | 1 | 215 | Mean Difference (IV, Fixed, 95% CI) | ‐5.20 [‐9.10, ‐1.30] |
| 3 WOMAC total score (0‐96 Likert) | 1 | Mean Difference (IV, Fixed, 95% CI) | Subtotals only | |
| 3.1 5 to 13 weeks post‐injection | 1 | 215 | Mean Difference (IV, Fixed, 95% CI) | ‐7.40 [‐12.74, ‐2.06] |
| 3.2 14 to 26 weeks post‐injection | 1 | 215 | Mean Difference (IV, Fixed, 95% CI) | ‐7.30 [‐12.76, ‐1.84] |
| 4 Patient global overall assessment (0‐100 mm VAS) | 1 | Mean Difference (IV, Fixed, 95% CI) | Subtotals only | |
| 4.1 5 to 13 weeks post‐injection | 1 | 215 | Mean Difference (IV, Fixed, 95% CI) | ‐13.40 [‐20.03, ‐6.77] |
| 4.2 14 to 26 weeks post‐injection | 1 | 215 | Mean Difference (IV, Fixed, 95% CI) | ‐15.10 [‐22.17, ‐8.03] |
| 5 Number of responders (greater than or equal to one category on WOMAC pain Q1) | 1 | Risk Ratio (M‐H, Fixed, 95% CI) | Subtotals only | |
| 5.1 1 to 4 weeks post‐injection | 1 | 215 | Risk Ratio (M‐H, Fixed, 95% CI) | 1.21 [0.96, 1.53] |
| 5.2 5 to 13 weeks post‐injection | 1 | 215 | Risk Ratio (M‐H, Fixed, 95% CI) | 1.44 [1.09, 1.90] |
| 5.3 14 to 26 weeks post‐injection | 1 | 215 | Risk Ratio (M‐H, Fixed, 95% CI) | 1.44 [1.00, 2.09] |
| 6 Analgesic usage | 1 | Risk Ratio (M‐H, Fixed, 95% CI) | Subtotals only | |
| 6.1 From week 0 to prior to week 12 | 1 | 215 | Risk Ratio (M‐H, Fixed, 95% CI) | 1.01 [0.97, 1.06] |
| 6.2 From week 12 prior to week 26 | 1 | 153 | Risk Ratio (M‐H, Fixed, 95% CI) | 0.84 [0.64, 1.11] |
| 7 Safety: total withdrawals overall | 1 | Risk Ratio (M‐H, Fixed, 95% CI) | Subtotals only | |
| 8 Safety: withdrawals due to adverse event | 1 | Risk Ratio (M‐H, Fixed, 95% CI) | Subtotals only | |
| 9 Safety: withdrawals due to lack of efficacy | 1 | Risk Ratio (M‐H, Fixed, 95% CI) | Subtotals only |
24.1. Analysis.
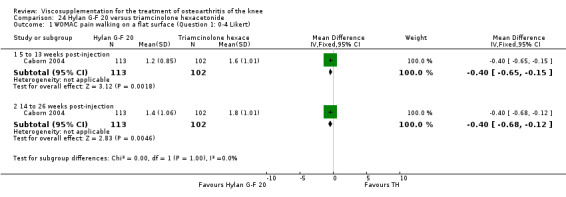
Comparison 24 Hylan G‐F 20 versus triamcinolone hexacetonide, Outcome 1 WOMAC pain walking on a flat surface (Question 1: 0‐4 Likert).
24.2. Analysis.

Comparison 24 Hylan G‐F 20 versus triamcinolone hexacetonide, Outcome 2 WOMAC physical function subscale (0‐68 Likert).
24.3. Analysis.
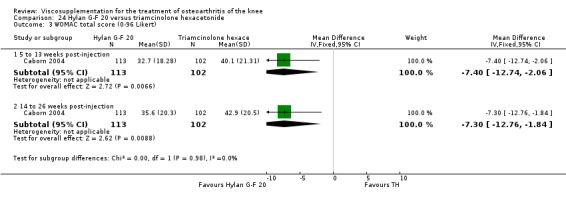
Comparison 24 Hylan G‐F 20 versus triamcinolone hexacetonide, Outcome 3 WOMAC total score (0‐96 Likert).
24.4. Analysis.
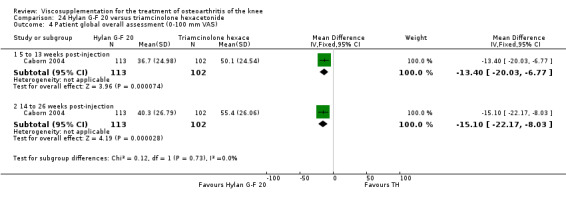
Comparison 24 Hylan G‐F 20 versus triamcinolone hexacetonide, Outcome 4 Patient global overall assessment (0‐100 mm VAS).
24.5. Analysis.
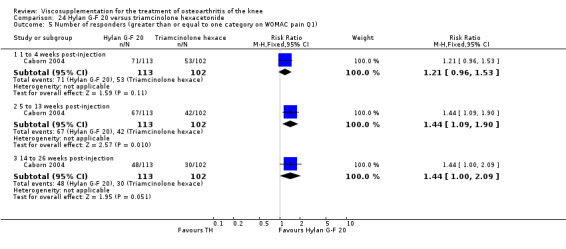
Comparison 24 Hylan G‐F 20 versus triamcinolone hexacetonide, Outcome 5 Number of responders (greater than or equal to one category on WOMAC pain Q1).
24.6. Analysis.
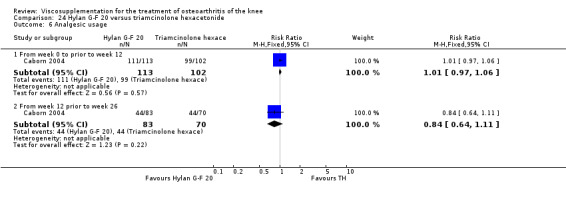
Comparison 24 Hylan G‐F 20 versus triamcinolone hexacetonide, Outcome 6 Analgesic usage.
24.7. Analysis.
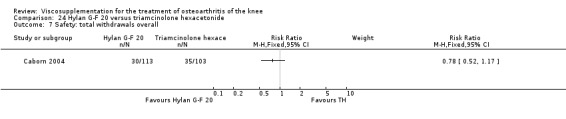
Comparison 24 Hylan G‐F 20 versus triamcinolone hexacetonide, Outcome 7 Safety: total withdrawals overall.
24.8. Analysis.

Comparison 24 Hylan G‐F 20 versus triamcinolone hexacetonide, Outcome 8 Safety: withdrawals due to adverse event.
24.9. Analysis.
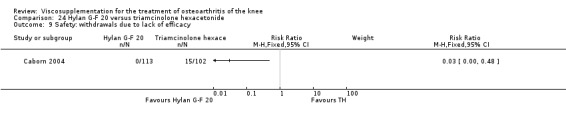
Comparison 24 Hylan G‐F 20 versus triamcinolone hexacetonide, Outcome 9 Safety: withdrawals due to lack of efficacy.
Comparison 25. Hylan G‐F 20 versus physical therapy.
| Outcome or subgroup title | No. of studies | No. of participants | Statistical method | Effect size |
|---|---|---|---|---|
| 1 Spontaneous pain (0‐100 mm VAS) | 1 | Mean Difference (IV, Fixed, 95% CI) | Subtotals only | |
| 1.1 1 to 4 weeks post‐injection | 1 | 40 | Mean Difference (IV, Fixed, 95% CI) | 20.5 [10.21, 30.79] |
| 1.2 5 to 13 weeks post‐injection | 1 | 40 | Mean Difference (IV, Fixed, 95% CI) | ‐4.0 [‐14.48, 6.48] |
| 1.3 14 to 26 weeks post‐injection | 1 | 40 | Mean Difference (IV, Fixed, 95% CI) | 2.20 [‐8.23, 12.63] |
| 1.4 37 weeks post‐injection | 1 | 40 | Mean Difference (IV, Fixed, 95% CI) | 1.0 [‐9.15, 11.15] |
| 1.5 45 to 52 weeks post‐injection | 1 | 40 | Mean Difference (IV, Fixed, 95% CI) | ‐10.5 [‐21.47, 0.47] |
| 2 WOMAC pain | 1 | Mean Difference (IV, Fixed, 95% CI) | Subtotals only | |
| 2.1 1 to 4 weeks post‐injection | 1 | 40 | Mean Difference (IV, Fixed, 95% CI) | ‐3.0 [‐4.85, ‐1.15] |
| 2.2 5 to 13 weeks post‐injection | 1 | 40 | Mean Difference (IV, Fixed, 95% CI) | ‐3.10 [‐5.12, ‐1.08] |
| 2.3 14 to 26 weeks post‐injection | 1 | 40 | Mean Difference (IV, Fixed, 95% CI) | ‐0.90 [‐3.33, 1.53] |
| 2.4 37 weeks post‐injection | 1 | 40 | Mean Difference (IV, Fixed, 95% CI) | ‐1.90 [‐3.71, ‐0.09] |
| 2.5 45 to 52 weeks post‐injection | 1 | 40 | Mean Difference (IV, Fixed, 95% CI) | ‐5.30 [‐7.50, ‐3.10] |
| 3 WOMAC physical function | 1 | Mean Difference (IV, Fixed, 95% CI) | Subtotals only | |
| 3.1 1 to 4 weeks post‐injection | 1 | 40 | Mean Difference (IV, Fixed, 95% CI) | 2.5 [‐6.35, 11.35] |
| 3.2 5 to 13 weeks post‐injection | 1 | 40 | Mean Difference (IV, Fixed, 95% CI) | 2.80 [‐5.75, 11.35] |
| 3.3 14 to 26 weeks post‐injection | 1 | 40 | Mean Difference (IV, Fixed, 95% CI) | 0.0 [‐9.30, 9.30] |
| 3.4 37 weeks post‐injection | 1 | 40 | Mean Difference (IV, Fixed, 95% CI) | 0.40 [‐6.88, 7.68] |
| 3.5 45 to 52 weeks post‐injection | 1 | 40 | Mean Difference (IV, Fixed, 95% CI) | 0.70 [‐6.84, 8.24] |
| 4 SF‐36 pain | 1 | Mean Difference (IV, Fixed, 95% CI) | Subtotals only | |
| 4.1 1 to 4 weeks post‐injection | 1 | 40 | Mean Difference (IV, Fixed, 95% CI) | 0.30 [‐11.18, 11.78] |
| 4.2 5 to 13 weeks post‐injection | 1 | 40 | Mean Difference (IV, Fixed, 95% CI) | 2.60 [‐9.69, 14.89] |
| 4.3 14 to 26 weeks post‐injection | 1 | 40 | Mean Difference (IV, Fixed, 95% CI) | 1.10 [‐13.22, 15.42] |
| 4.4 37 weeks post‐injection | 1 | 40 | Mean Difference (IV, Fixed, 95% CI) | ‐7.5 [‐17.09, 2.09] |
| 4.5 45 to 52 weeks post‐injection | 1 | 40 | Mean Difference (IV, Fixed, 95% CI) | ‐3.5 [‐15.18, 8.18] |
| 5 SF‐36 physical functioning | 1 | Mean Difference (IV, Fixed, 95% CI) | Subtotals only | |
| 5.1 1 to 4 weeks post‐injection | 1 | 40 | Mean Difference (IV, Fixed, 95% CI) | 3.5 [‐12.00, 19.00] |
| 5.2 5 to 13 weeks post‐injection | 1 | 40 | Mean Difference (IV, Fixed, 95% CI) | 8.20 [‐4.48, 20.88] |
| 5.3 14 to 26 weeks post‐injection | 1 | 40 | Mean Difference (IV, Fixed, 95% CI) | 1.70 [‐13.64, 17.04] |
| 5.4 37 weeks post‐injection | 1 | 40 | Mean Difference (IV, Fixed, 95% CI) | ‐4.20 [‐17.28, 8.88] |
| 5.5 45 to 52 weeks post‐injection | 1 | 40 | Mean Difference (IV, Fixed, 95% CI) | 1.0 [‐14.09, 16.09] |
25.1. Analysis.
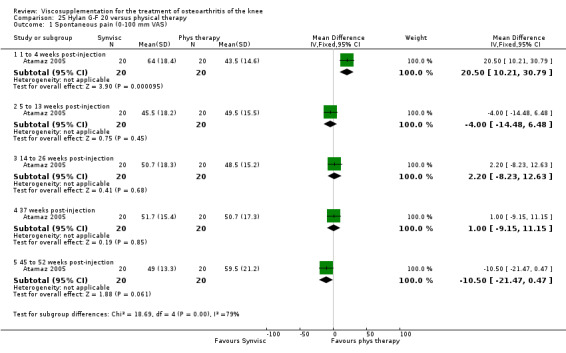
Comparison 25 Hylan G‐F 20 versus physical therapy, Outcome 1 Spontaneous pain (0‐100 mm VAS).
25.2. Analysis.
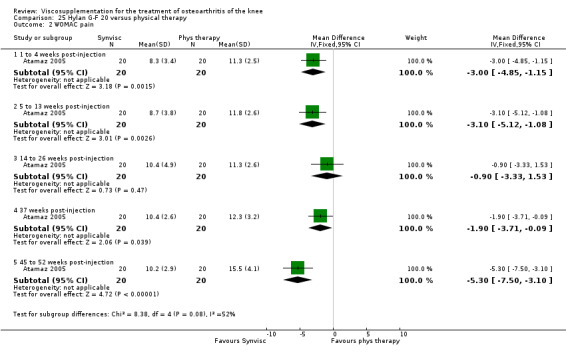
Comparison 25 Hylan G‐F 20 versus physical therapy, Outcome 2 WOMAC pain.
25.3. Analysis.
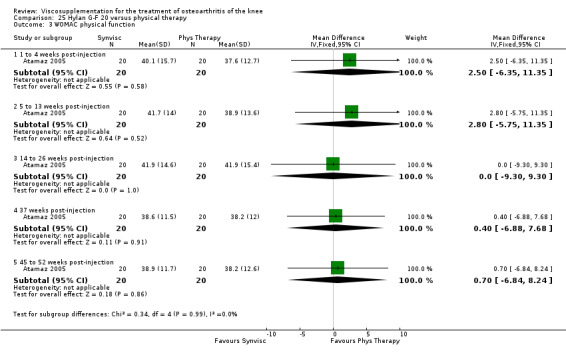
Comparison 25 Hylan G‐F 20 versus physical therapy, Outcome 3 WOMAC physical function.
25.4. Analysis.
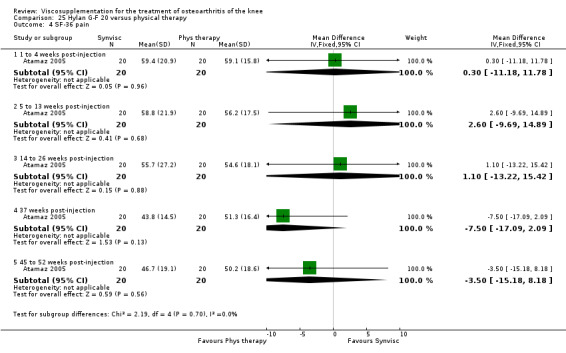
Comparison 25 Hylan G‐F 20 versus physical therapy, Outcome 4 SF‐36 pain.
25.5. Analysis.
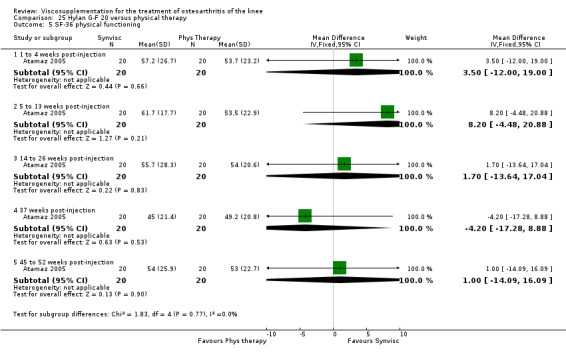
Comparison 25 Hylan G‐F 20 versus physical therapy, Outcome 5 SF‐36 physical functioning.
Comparison 26. (Hylan G‐F 20 + physiotherapy) versus physiotherapy.
| Outcome or subgroup title | No. of studies | No. of participants | Statistical method | Effect size |
|---|---|---|---|---|
| 1 Lequesne Index (0‐24) | 1 | Mean Difference (IV, Fixed, 95% CI) | Subtotals only | |
| 1.1 End of treatment | 1 | 21 | Mean Difference (IV, Fixed, 95% CI) | ‐0.70 [‐3.25, 1.85] |
| 1.2 5 to 13 weeks post‐injection | 1 | 21 | Mean Difference (IV, Fixed, 95% CI) | ‐0.80 [‐3.95, 2.35] |
| 2 Safety: total withdrawls overall | 1 | Risk Ratio (M‐H, Fixed, 95% CI) | Subtotals only | |
| 2.1 5 to 13 weeks post‐injection | 1 | 30 | Risk Ratio (M‐H, Fixed, 95% CI) | 0.5 [0.15, 1.64] |
| 3 Safety: number of patients with adverse events | 1 | Risk Ratio (M‐H, Fixed, 95% CI) | Subtotals only | |
| 3.1 End of treatment | 1 | 21 | Risk Ratio (M‐H, Fixed, 95% CI) | 0.0 [0.0, 0.0] |
26.1. Analysis.

Comparison 26 (Hylan G‐F 20 + physiotherapy) versus physiotherapy, Outcome 1 Lequesne Index (0‐24).
26.2. Analysis.

Comparison 26 (Hylan G‐F 20 + physiotherapy) versus physiotherapy, Outcome 2 Safety: total withdrawls overall.
26.3. Analysis.
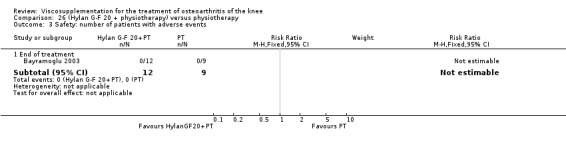
Comparison 26 (Hylan G‐F 20 + physiotherapy) versus physiotherapy, Outcome 3 Safety: number of patients with adverse events.
Comparison 27. Hylan G‐F 20 versus progressive knee exercises.
| Outcome or subgroup title | No. of studies | No. of participants | Statistical method | Effect size |
|---|---|---|---|---|
| 1 Pain during activity | 2 | Mean Difference (IV, Fixed, 95% CI) | Subtotals only | |
| 1.1 1 to 4 weeks post‐injection | 1 | 105 | Mean Difference (IV, Fixed, 95% CI) | 1.90 [0.19, 3.61] |
| 1.2 5 to 13 weeks post‐injection | 1 | 105 | Mean Difference (IV, Fixed, 95% CI) | 1.70 [0.17, 3.23] |
| 1.3 14 to 26 weeks post‐injection | 1 | 105 | Mean Difference (IV, Fixed, 95% CI) | 2.5 [0.85, 4.15] |
| 1.4 45 to 52 weeks post‐injection | 1 | 99 | Mean Difference (IV, Fixed, 95% CI) | ‐1.70 [‐3.42, 0.02] |
| 1.5 74 weeks post‐injection | 1 | 84 | Mean Difference (IV, Fixed, 95% CI) | 0.80 [‐0.66, 2.26] |
| 2 Pain at rest | 1 | Mean Difference (IV, Fixed, 95% CI) | Subtotals only | |
| 2.1 1 to 4 weeks post‐injection | 1 | 105 | Mean Difference (IV, Fixed, 95% CI) | 0.90 [‐0.45, 2.25] |
| 2.2 5 to 13 weeks post‐injection | 1 | 105 | Mean Difference (IV, Fixed, 95% CI) | 0.0 [‐1.24, 1.24] |
| 2.3 14 to 26 weeks post‐injection | 1 | 105 | Mean Difference (IV, Fixed, 95% CI) | 0.40 [‐0.96, 1.76] |
| 2.4 45 to 52 weeks post‐injection | 1 | 99 | Mean Difference (IV, Fixed, 95% CI) | ‐1.20 [‐2.61, 0.21] |
| 2.5 74 weeks post‐injection | 1 | 84 | Mean Difference (IV, Fixed, 95% CI) | 0.5 [‐0.69, 1.69] |
| 3 Pain during climbing stairs | 1 | Mean Difference (IV, Fixed, 95% CI) | Subtotals only | |
| 3.1 1 to 4 weeks post‐injection | 1 | 105 | Mean Difference (IV, Fixed, 95% CI) | 0.20 [‐0.34, 0.74] |
| 3.2 5 to 13 weeks post‐injection | 1 | 105 | Mean Difference (IV, Fixed, 95% CI) | 0.10 [‐0.44, 0.64] |
| 3.3 14 to 26 weeks post‐injection | 1 | 105 | Mean Difference (IV, Fixed, 95% CI) | 0.0 [‐0.54, 0.54] |
| 3.4 45 to 52 weeks post‐injection | 1 | 99 | Mean Difference (IV, Fixed, 95% CI) | ‐0.10 [‐0.65, 0.45] |
| 3.5 74 weeks post‐injection | 1 | 84 | Mean Difference (IV, Fixed, 95% CI) | 0.20 [‐0.42, 0.82] |
| 4 Pain during transfer activity | 1 | Mean Difference (IV, Fixed, 95% CI) | Subtotals only | |
| 4.1 1 to 4 weeks post‐injection | 1 | 105 | Mean Difference (IV, Fixed, 95% CI) | ‐0.30 [‐0.80, 0.20] |
| 4.2 5 to 13 weeks post‐injection | 1 | 105 | Mean Difference (IV, Fixed, 95% CI) | ‐0.20 [‐0.66, 0.26] |
| 4.3 14 to 26 weeks post‐injection | 1 | 105 | Mean Difference (IV, Fixed, 95% CI) | 0.0 [‐0.46, 0.46] |
| 4.4 45 to 52 weeks post‐injection | 1 | 99 | Mean Difference (IV, Fixed, 95% CI) | ‐0.5 [‐0.95, ‐0.05] |
| 4.5 74 weeks post‐injection | 1 | 84 | Mean Difference (IV, Fixed, 95% CI) | ‐0.10 [‐0.68, 0.48] |
| 5 Walking distance | 1 | Mean Difference (IV, Fixed, 95% CI) | Subtotals only | |
| 5.1 1 to 4 weeks post‐injection | 1 | 105 | Mean Difference (IV, Fixed, 95% CI) | 0.90 [0.01, 1.79] |
| 5.2 5 to 13 weeks post‐injection | 1 | 105 | Mean Difference (IV, Fixed, 95% CI) | 0.40 [‐0.34, 1.14] |
| 5.3 14 to 26 weeks post‐injection | 1 | 105 | Mean Difference (IV, Fixed, 95% CI) | 0.70 [‐0.21, 1.61] |
| 5.4 45 to 52 weeks post‐injection | 1 | 99 | Mean Difference (IV, Fixed, 95% CI) | ‐0.30 [‐1.31, 0.71] |
| 5.5 74 weeks post‐injection | 1 | 84 | Mean Difference (IV, Fixed, 95% CI) | 0.10 [‐1.04, 1.24] |
| 6 Range of motion (degrees) | 1 | Mean Difference (IV, Fixed, 95% CI) | Subtotals only | |
| 6.1 1 to 4 weeks post‐injection | 1 | 105 | Mean Difference (IV, Fixed, 95% CI) | ‐0.80 [‐5.03, 3.43] |
| 6.2 5 to 13 weeks post‐injection | 1 | 105 | Mean Difference (IV, Fixed, 95% CI) | ‐0.80 [‐4.84, 3.24] |
| 6.3 14 to 26 weeks post‐injection | 1 | 105 | Mean Difference (IV, Fixed, 95% CI) | 0.0 [‐3.84, 3.84] |
| 6.4 45 to 52 weeks post‐injection | 1 | 99 | Mean Difference (IV, Fixed, 95% CI) | ‐0.60 [‐4.57, 3.37] |
| 6.5 74 weeks post‐injection | 1 | 84 | Mean Difference (IV, Fixed, 95% CI) | 0.70 [‐4.05, 5.45] |
| 7 Hospital for Special Surgery Knee Score (100 points) | 1 | Mean Difference (IV, Fixed, 95% CI) | Subtotals only | |
| 7.1 1 to 4 weeks post‐injection | 1 | 105 | Mean Difference (IV, Fixed, 95% CI) | 1.50 [‐3.09, 6.09] |
| 7.2 5 to 13 weeks post‐injection | 1 | 105 | Mean Difference (IV, Fixed, 95% CI) | 0.68 [‐3.50, 4.86] |
| 7.3 14 to 26 weeks post‐injection | 1 | 105 | Mean Difference (IV, Fixed, 95% CI) | 2.70 [‐1.78, 7.18] |
| 7.4 45 to 52 weeks post‐injection | 1 | 99 | Mean Difference (IV, Fixed, 95% CI) | ‐3.96 [‐8.95, 1.03] |
| 7.5 74 weeks post‐injection | 1 | 84 | Mean Difference (IV, Fixed, 95% CI) | 0.5 [‐4.11, 5.11] |
| 8 Safety: total withdrawals overall | 1 | Risk Ratio (M‐H, Fixed, 95% CI) | Subtotals only |
27.1. Analysis.
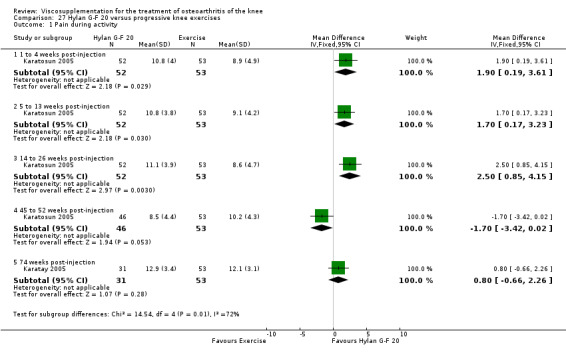
Comparison 27 Hylan G‐F 20 versus progressive knee exercises, Outcome 1 Pain during activity.
27.2. Analysis.
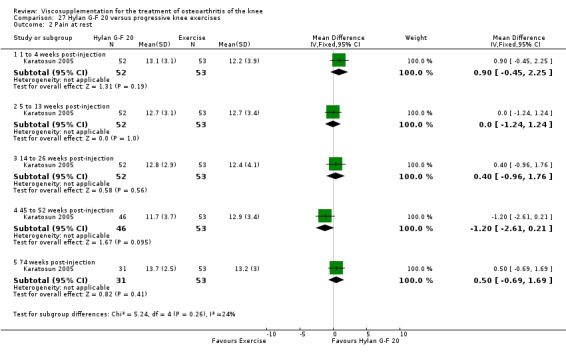
Comparison 27 Hylan G‐F 20 versus progressive knee exercises, Outcome 2 Pain at rest.
27.3. Analysis.
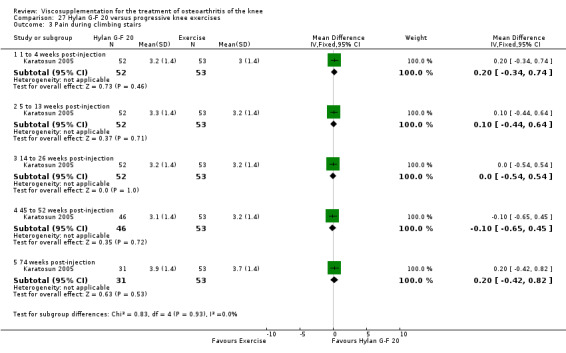
Comparison 27 Hylan G‐F 20 versus progressive knee exercises, Outcome 3 Pain during climbing stairs.
27.4. Analysis.
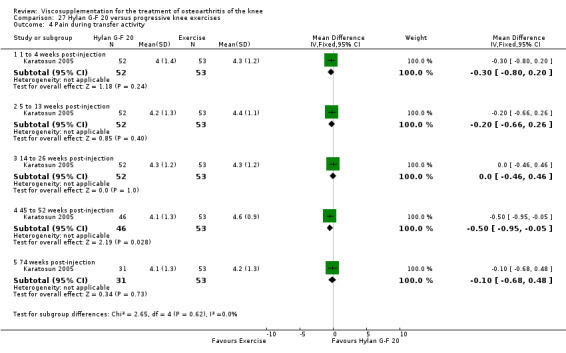
Comparison 27 Hylan G‐F 20 versus progressive knee exercises, Outcome 4 Pain during transfer activity.
27.5. Analysis.
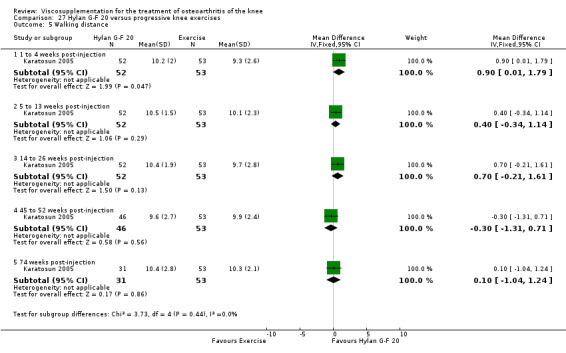
Comparison 27 Hylan G‐F 20 versus progressive knee exercises, Outcome 5 Walking distance.
27.6. Analysis.

Comparison 27 Hylan G‐F 20 versus progressive knee exercises, Outcome 6 Range of motion (degrees).
27.7. Analysis.

Comparison 27 Hylan G‐F 20 versus progressive knee exercises, Outcome 7 Hospital for Special Surgery Knee Score (100 points).
27.8. Analysis.
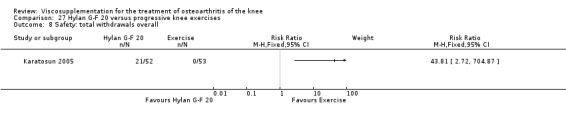
Comparison 27 Hylan G‐F 20 versus progressive knee exercises, Outcome 8 Safety: total withdrawals overall.
Comparison 28. Hylan G‐F 20 versus appropriate care.
| Outcome or subgroup title | No. of studies | No. of participants | Statistical method | Effect size |
|---|---|---|---|---|
| 1 WOMAC pain (0‐20 Likert) | 1 | Mean Difference (IV, Fixed, 95% CI) | Subtotals only | |
| 1.1 45 to 52 weeks post‐injection | 1 | 254 | Mean Difference (IV, Fixed, 95% CI) | ‐3.16 [‐4.17, ‐2.15] |
| 2 WOMAC pain (0‐100 mm VAS) | 1 | Mean Difference (IV, Fixed, 95% CI) | Subtotals only | |
| 2.1 36 weeks post‐injection | 1 | 497 | Mean Difference (IV, Fixed, 95% CI) | ‐12.70 [‐16.41, ‐8.99] |
| 3 Pain on walking (0‐100 mm VAS) | 1 | Mean Difference (IV, Fixed, 95% CI) | Subtotals only | |
| 3.1 36 weeks post‐injection | 1 | 506 | Mean Difference (IV, Fixed, 95% CI) | ‐12.10 [‐16.05, ‐8.15] |
| 4 WOMAC function (0‐68 Likert) | 1 | Mean Difference (IV, Fixed, 95% CI) | Subtotals only | |
| 4.1 45 to 52 weeks post‐injection | 1 | 231 | Mean Difference (IV, Fixed, 95% CI) | ‐9.61 [‐13.09, ‐6.13] |
| 5 WOMAC function (0‐100 mm VAS) | 1 | Mean Difference (IV, Fixed, 95% CI) | Subtotals only | |
| 5.1 36 weeks post‐injection | 1 | 498 | Mean Difference (IV, Fixed, 95% CI) | ‐13.20 [‐17.02, ‐9.38] |
| 6 Lequesne Index (0‐24) | 1 | Mean Difference (IV, Fixed, 95% CI) | Subtotals only | |
| 6.1 36 weeks post‐injection | 1 | 506 | Mean Difference (IV, Fixed, 95% CI) | ‐2.20 [‐2.98, ‐1.42] |
| 7 WOMAC total score (0‐100 mm VAS) | 1 | Mean Difference (IV, Fixed, 95% CI) | Subtotals only | |
| 7.1 36 weeks post‐injection | 1 | 495 | Mean Difference (IV, Fixed, 95% CI) | ‐13.20 [‐16.92, ‐9.48] |
| 8 Patient global assessment (number of patients improved in study knee) | 1 | Risk Ratio (M‐H, Fixed, 95% CI) | Subtotals only | |
| 9 Patient global evaluation of effectiveness (good or satisfactory) | 1 | Risk Ratio (M‐H, Fixed, 95% CI) | Subtotals only | |
| 9.1 36 weeks post‐injection | 1 | 506 | Risk Ratio (M‐H, Fixed, 95% CI) | 1.44 [1.25, 1.66] |
| 10 Number of responders (20% decrease in pain on walking) | 1 | Risk Ratio (M‐H, Fixed, 95% CI) | Subtotals only | |
| 10.1 36 weeks post‐injection | 1 | 506 | Risk Ratio (M‐H, Fixed, 95% CI) | 1.30 [1.18, 1.43] |
| 11 Safety: total withdrawals overall | 2 | Risk Ratio (M‐H, Random, 95% CI) | Subtotals only | |
| 12 Safety: wIthdrawals due to lack of effectiveness | 1 | Risk Ratio (M‐H, Fixed, 95% CI) | Subtotals only | |
| 13 Safety: wIthdrawals due to adverse events | 1 | Risk Ratio (M‐H, Fixed, 95% CI) | Subtotals only | |
| 14 Safety: number of patients reporting mild, moderate or severe side effects at month 12 | 1 | Risk Ratio (M‐H, Fixed, 95% CI) | Subtotals only | |
| 15 Safety: total number of patients reporting side effects from baseline | 2 | Risk Ratio (M‐H, Random, 95% CI) | Subtotals only | |
| 16 Safety: number of patients with gastrointestinal adverse events | 2 | Risk Ratio (M‐H, Fixed, 95% CI) | Subtotals only |
28.1. Analysis.

Comparison 28 Hylan G‐F 20 versus appropriate care, Outcome 1 WOMAC pain (0‐20 Likert).
28.2. Analysis.
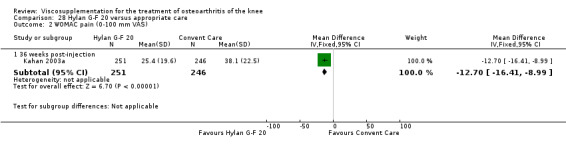
Comparison 28 Hylan G‐F 20 versus appropriate care, Outcome 2 WOMAC pain (0‐100 mm VAS).
28.3. Analysis.
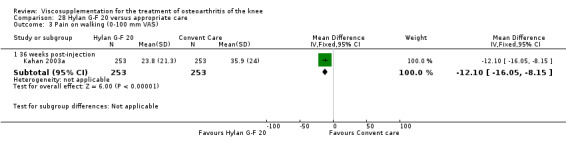
Comparison 28 Hylan G‐F 20 versus appropriate care, Outcome 3 Pain on walking (0‐100 mm VAS).
28.4. Analysis.

Comparison 28 Hylan G‐F 20 versus appropriate care, Outcome 4 WOMAC function (0‐68 Likert).
28.5. Analysis.

Comparison 28 Hylan G‐F 20 versus appropriate care, Outcome 5 WOMAC function (0‐100 mm VAS).
28.6. Analysis.
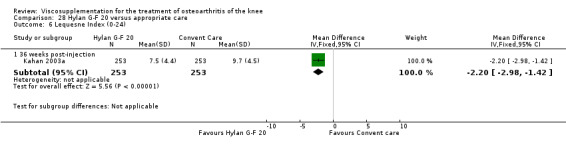
Comparison 28 Hylan G‐F 20 versus appropriate care, Outcome 6 Lequesne Index (0‐24).
28.7. Analysis.
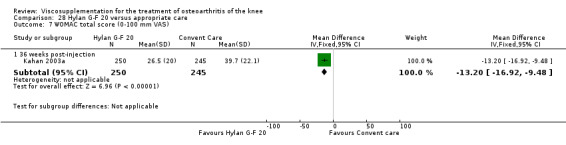
Comparison 28 Hylan G‐F 20 versus appropriate care, Outcome 7 WOMAC total score (0‐100 mm VAS).
28.8. Analysis.

Comparison 28 Hylan G‐F 20 versus appropriate care, Outcome 8 Patient global assessment (number of patients improved in study knee).
28.9. Analysis.
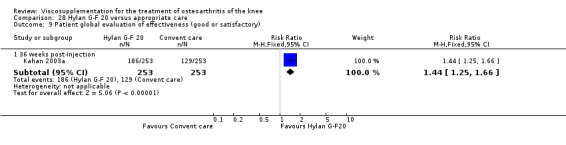
Comparison 28 Hylan G‐F 20 versus appropriate care, Outcome 9 Patient global evaluation of effectiveness (good or satisfactory).
28.10. Analysis.

Comparison 28 Hylan G‐F 20 versus appropriate care, Outcome 10 Number of responders (20% decrease in pain on walking).
28.11. Analysis.
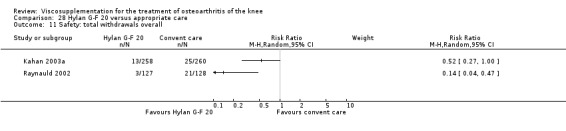
Comparison 28 Hylan G‐F 20 versus appropriate care, Outcome 11 Safety: total withdrawals overall.
28.12. Analysis.

Comparison 28 Hylan G‐F 20 versus appropriate care, Outcome 12 Safety: wIthdrawals due to lack of effectiveness.
28.13. Analysis.

Comparison 28 Hylan G‐F 20 versus appropriate care, Outcome 13 Safety: wIthdrawals due to adverse events.
28.14. Analysis.
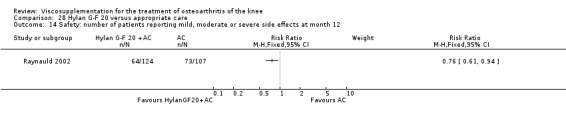
Comparison 28 Hylan G‐F 20 versus appropriate care, Outcome 14 Safety: number of patients reporting mild, moderate or severe side effects at month 12.
28.15. Analysis.

Comparison 28 Hylan G‐F 20 versus appropriate care, Outcome 15 Safety: total number of patients reporting side effects from baseline.
28.16. Analysis.
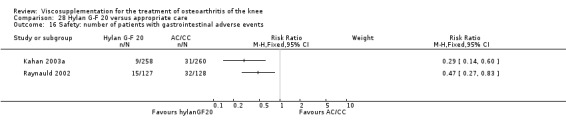
Comparison 28 Hylan G‐F 20 versus appropriate care, Outcome 16 Safety: number of patients with gastrointestinal adverse events.
Comparison 29. Hylan G‐F 20 versus gaseous oxygen.
| Outcome or subgroup title | No. of studies | No. of participants | Statistical method | Effect size |
|---|---|---|---|---|
| 1 Pain under load (0‐100 mm VAS) | 1 | Mean Difference (IV, Fixed, 95% CI) | Subtotals only | |
| 1.1 End of treatment | 1 | 109 | Mean Difference (IV, Fixed, 95% CI) | 9.14 [‐2.23, 20.51] |
| 1.2 5 to 13 weeks post‐injection | 1 | 109 | Mean Difference (IV, Fixed, 95% CI) | 12.83 [1.96, 23.70] |
| 1.3 14 to 26 weeks post‐injection | 1 | 109 | Mean Difference (IV, Fixed, 95% CI) | 8.02 [‐2.91, 18.95] |
| 1.4 45 to 52 weeks post‐injection | 1 | 109 | Mean Difference (IV, Fixed, 95% CI) | 6.52 [‐3.76, 16.80] |
| 2 Pain at rest (0‐100 mm VAS) | 1 | Mean Difference (IV, Fixed, 95% CI) | Subtotals only | |
| 2.1 End of treatment | 1 | 109 | Mean Difference (IV, Fixed, 95% CI) | 1.41 [‐7.83, 10.65] |
| 2.2 5 to 13 weeks post‐injection | 1 | 109 | Mean Difference (IV, Fixed, 95% CI) | 6.90 [‐3.10, 16.90] |
| 2.3 14 to 26 weeks post‐injection | 1 | 109 | Mean Difference (IV, Fixed, 95% CI) | 2.94 [‐8.08, 13.96] |
| 2.4 45 to 52 weeks post‐injection | 1 | 109 | Mean Difference (IV, Fixed, 95% CI) | 0.09 [‐9.04, 9.22] |
| 3 WOMAC pain (0‐20 Likert) | 1 | Mean Difference (IV, Fixed, 95% CI) | Subtotals only | |
| 3.1 End of treatment | 1 | 109 | Mean Difference (IV, Fixed, 95% CI) | 1.30 [‐0.15, 2.75] |
| 3.2 5 to 13 weeks post‐injection | 1 | 109 | Mean Difference (IV, Fixed, 95% CI) | 1.40 [‐0.10, 2.90] |
| 3.3 14 to 26 weeks post‐injection | 1 | 109 | Mean Difference (IV, Fixed, 95% CI) | 0.60 [‐1.04, 2.24] |
| 3.4 45 to 52 weeks post‐injection | 1 | 109 | Mean Difference (IV, Fixed, 95% CI) | 0.80 [‐0.72, 2.32] |
| 4 WOMAC physical function (0‐68 Likert) | 1 | Mean Difference (IV, Fixed, 95% CI) | Subtotals only | |
| 4.1 End of treatment | 1 | 109 | Mean Difference (IV, Fixed, 95% CI) | 3.30 [‐1.83, 8.43] |
| 4.2 5 to 13 weeks post‐injection | 1 | 109 | Mean Difference (IV, Fixed, 95% CI) | 2.80 [‐2.29, 7.89] |
| 4.3 14 to 26 weeks post‐injection | 1 | 109 | Mean Difference (IV, Fixed, 95% CI) | 4.1 [‐1.51, 9.71] |
| 4.4 45 to 52 weeks post‐injection | 1 | 109 | Mean Difference (IV, Fixed, 95% CI) | 4.0 [‐1.63, 9.63] |
| 5 WOMAC stiffness (0‐8 Likert) | 1 | Mean Difference (IV, Fixed, 95% CI) | Subtotals only | |
| 5.1 End of treatment | 1 | 109 | Mean Difference (IV, Fixed, 95% CI) | 0.20 [‐0.54, 0.94] |
| 5.2 5 to 13 weeks post‐injection | 1 | 109 | Mean Difference (IV, Fixed, 95% CI) | 0.50 [‐0.18, 1.18] |
| 5.3 14 to 26 weeks post‐injection | 1 | 109 | Mean Difference (IV, Fixed, 95% CI) | 0.90 [0.19, 1.61] |
| 5.4 45 to 52 weeks post‐injection | 1 | 109 | Mean Difference (IV, Fixed, 95% CI) | 0.50 [‐0.25, 1.25] |
| 6 Safety: total number of withdrawals | 1 | Risk Ratio (M‐H, Fixed, 95% CI) | Subtotals only | |
| 7 Safety: number of patients having total knee replacements | 1 | Risk Ratio (M‐H, Fixed, 95% CI) | Subtotals only |
29.1. Analysis.
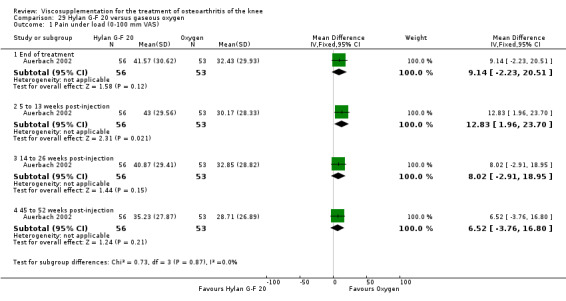
Comparison 29 Hylan G‐F 20 versus gaseous oxygen, Outcome 1 Pain under load (0‐100 mm VAS).
29.2. Analysis.
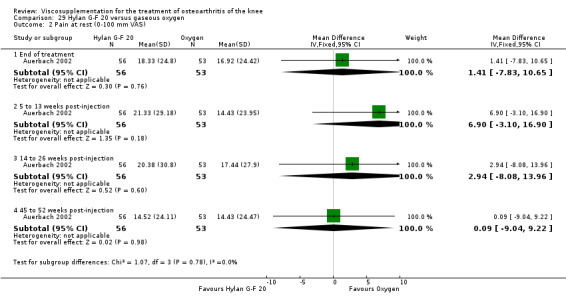
Comparison 29 Hylan G‐F 20 versus gaseous oxygen, Outcome 2 Pain at rest (0‐100 mm VAS).
29.3. Analysis.
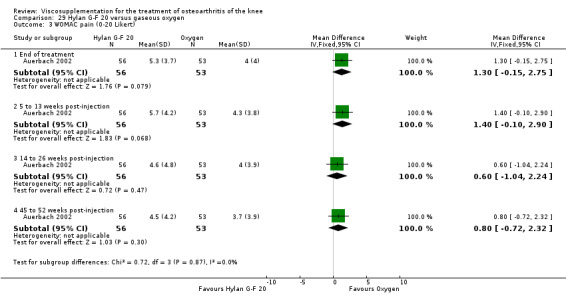
Comparison 29 Hylan G‐F 20 versus gaseous oxygen, Outcome 3 WOMAC pain (0‐20 Likert).
29.4. Analysis.
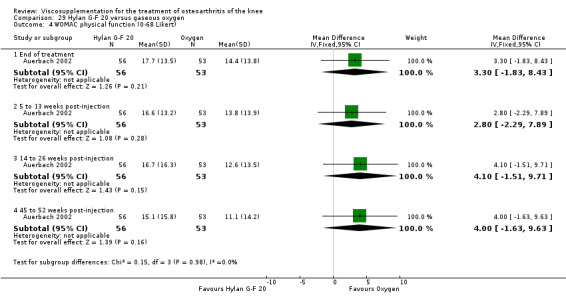
Comparison 29 Hylan G‐F 20 versus gaseous oxygen, Outcome 4 WOMAC physical function (0‐68 Likert).
29.5. Analysis.
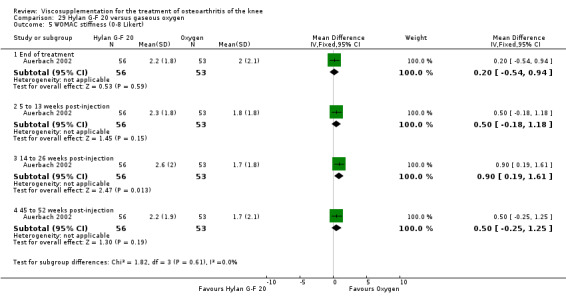
Comparison 29 Hylan G‐F 20 versus gaseous oxygen, Outcome 5 WOMAC stiffness (0‐8 Likert).
29.6. Analysis.

Comparison 29 Hylan G‐F 20 versus gaseous oxygen, Outcome 6 Safety: total number of withdrawals.
29.7. Analysis.

Comparison 29 Hylan G‐F 20 versus gaseous oxygen, Outcome 7 Safety: number of patients having total knee replacements.
Comparison 30. Hylan G‐F 20 versus hyaluronan (Also see Artzal, BioHy (Arthrease), Hyalgan and Orthovisc versus Hylan G‐F 20).
| Outcome or subgroup title | No. of studies | No. of participants | Statistical method | Effect size |
|---|---|---|---|---|
| 1 Pain on weight bearing (0‐100 mm VAS) | 3 | Mean Difference (IV, Fixed, 95% CI) | Subtotals only | |
| 1.1 1 to 4 weeks post‐injection | 3 | 326 | Mean Difference (IV, Fixed, 95% CI) | ‐2.06 [‐7.45, 3.32] |
| 1.2 5 to 13 weeks post‐injection | 3 | 322 | Mean Difference (IV, Fixed, 95% CI) | ‐6.59 [‐12.46, ‐0.73] |
| 1.3 14 to 26 weeks post‐injection | 1 | 176 | Mean Difference (IV, Fixed, 95% CI) | ‐5.0 [‐14.98, 4.98] |
| 2 Pain at night (0‐100 mm VAS) | 2 | Mean Difference (IV, Fixed, 95% CI) | Subtotals only | |
| 2.1 1 to 4 weeks post‐injection | 2 | 150 | Mean Difference (IV, Fixed, 95% CI) | ‐7.07 [‐13.41, ‐0.73] |
| 2.2 5 to 13 weeks post‐injection | 2 | 146 | Mean Difference (IV, Fixed, 95% CI) | ‐3.50 [‐11.34, 4.34] |
| 2.3 14 to 26 weeks post‐injection | 0 | 0 | Mean Difference (IV, Fixed, 95% CI) | 0.0 [0.0, 0.0] |
| 3 Function: improvement in knee movement (0‐100 mm VAS) | 2 | Mean Difference (IV, Fixed, 95% CI) | Subtotals only | |
| 3.1 1 to 4 weeks post‐injection | 2 | 150 | Mean Difference (IV, Fixed, 95% CI) | ‐0.50 [‐10.30, 9.30] |
| 3.2 5 to 13 weeks post‐injection | 2 | 146 | Mean Difference (IV, Fixed, 95% CI) | 12.50 [2.70, 22.30] |
| 4 Patient global evaluation of treatment efficacy (improvement: 0‐100 mm VAS) | 2 | Mean Difference (IV, Fixed, 95% CI) | Subtotals only | |
| 4.1 1 to 4 weeks post‐injection | 2 | 150 | Mean Difference (IV, Fixed, 95% CI) | 2.00 [‐7.80, 11.80] |
| 4.2 5 to 13 weeks post‐injection | 2 | 146 | Mean Difference (IV, Fixed, 95% CI) | 9.50 [‐0.30, 19.30] |
| 5 Safety: total withdrawals overall | 2 | Risk Ratio (M‐H, Fixed, 95% CI) | Subtotals only | |
| 5.1 5 to 13 weeks post‐injection | 2 | 146 | Risk Ratio (M‐H, Fixed, 95% CI) | 0.98 [0.17, 5.55] |
| 6 Safety: number of patients with local reactions | 2 | Risk Ratio (M‐H, Fixed, 95% CI) | Subtotals only | |
| 6.1 5 to 13 weeks post‐injection | 2 | 146 | Risk Ratio (M‐H, Fixed, 95% CI) | 2.91 [0.47, 17.86] |
30.1. Analysis.

Comparison 30 Hylan G‐F 20 versus hyaluronan (Also see Artzal, BioHy (Arthrease), Hyalgan and Orthovisc versus Hylan G‐F 20), Outcome 1 Pain on weight bearing (0‐100 mm VAS).
30.2. Analysis.
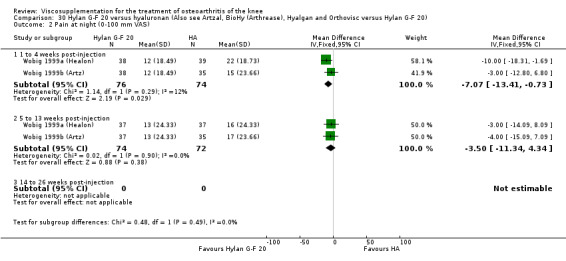
Comparison 30 Hylan G‐F 20 versus hyaluronan (Also see Artzal, BioHy (Arthrease), Hyalgan and Orthovisc versus Hylan G‐F 20), Outcome 2 Pain at night (0‐100 mm VAS).
30.3. Analysis.
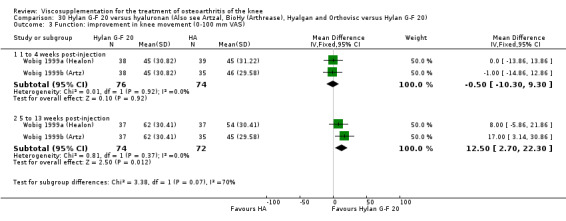
Comparison 30 Hylan G‐F 20 versus hyaluronan (Also see Artzal, BioHy (Arthrease), Hyalgan and Orthovisc versus Hylan G‐F 20), Outcome 3 Function: improvement in knee movement (0‐100 mm VAS).
30.4. Analysis.
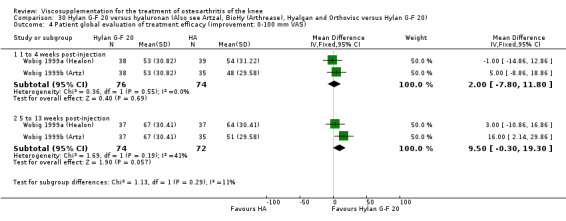
Comparison 30 Hylan G‐F 20 versus hyaluronan (Also see Artzal, BioHy (Arthrease), Hyalgan and Orthovisc versus Hylan G‐F 20), Outcome 4 Patient global evaluation of treatment efficacy (improvement: 0‐100 mm VAS).
30.5. Analysis.
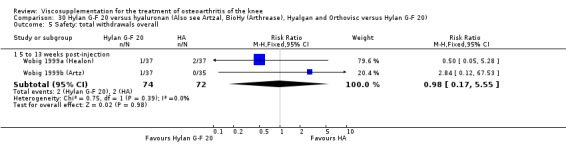
Comparison 30 Hylan G‐F 20 versus hyaluronan (Also see Artzal, BioHy (Arthrease), Hyalgan and Orthovisc versus Hylan G‐F 20), Outcome 5 Safety: total withdrawals overall.
30.6. Analysis.
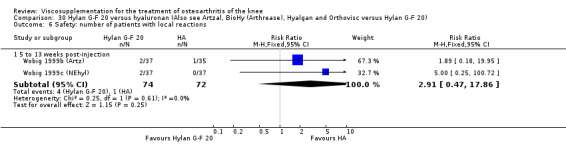
Comparison 30 Hylan G‐F 20 versus hyaluronan (Also see Artzal, BioHy (Arthrease), Hyalgan and Orthovisc versus Hylan G‐F 20), Outcome 6 Safety: number of patients with local reactions.
Comparison 31. NRD‐101 (Suvenyl) versus placebo (saline plus oral placebo).
31.1. Analysis.

Comparison 31 NRD‐101 (Suvenyl) versus placebo (saline plus oral placebo), Outcome 1 Pain (0‐100 mm VAS) change between baseline and 45 to 52 weeks post‐injection.
31.2. Analysis.
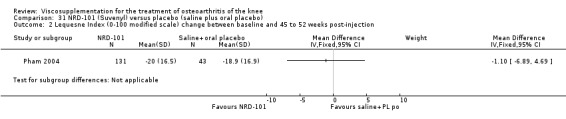
Comparison 31 NRD‐101 (Suvenyl) versus placebo (saline plus oral placebo), Outcome 2 Lequesne Index (0‐100 modified scale) change between baseline and 45 to 52 weeks post‐injection.
31.3. Analysis.

Comparison 31 NRD‐101 (Suvenyl) versus placebo (saline plus oral placebo), Outcome 3 Patient global assessment (0‐100 mm VAS) change between baseline and 45 to 52 weeks post‐injection.
31.4. Analysis.
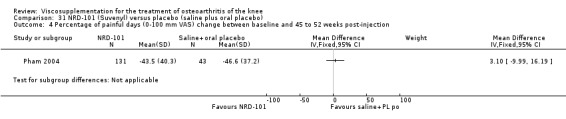
Comparison 31 NRD‐101 (Suvenyl) versus placebo (saline plus oral placebo), Outcome 4 Percentage of painful days (0‐100 mm VAS) change between baseline and 45 to 52 weeks post‐injection.
31.5. Analysis.
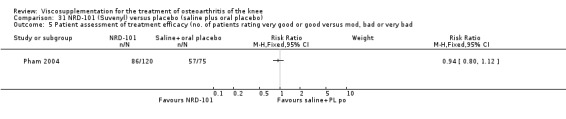
Comparison 31 NRD‐101 (Suvenyl) versus placebo (saline plus oral placebo), Outcome 5 Patient assessment of treatment efficacy (no. of patients rating very good or good versus mod, bad or very bad.
31.6. Analysis.

Comparison 31 NRD‐101 (Suvenyl) versus placebo (saline plus oral placebo), Outcome 6 Joint space width (percentage of progressors: joint space narrowing greater than 0.5 mm).
31.7. Analysis.
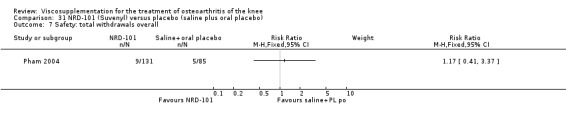
Comparison 31 NRD‐101 (Suvenyl) versus placebo (saline plus oral placebo), Outcome 7 Safety: total withdrawals overall.
31.8. Analysis.
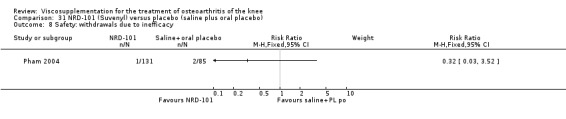
Comparison 31 NRD‐101 (Suvenyl) versus placebo (saline plus oral placebo), Outcome 8 Safety: withdrawals due to inefficacy.
31.9. Analysis.
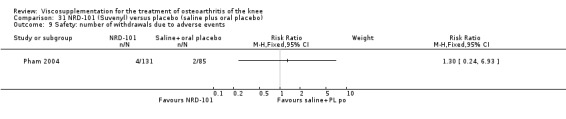
Comparison 31 NRD‐101 (Suvenyl) versus placebo (saline plus oral placebo), Outcome 9 Safety: number of withdrawals due to adverse events.
31.10. Analysis.
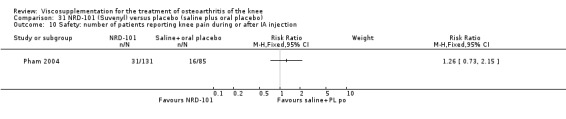
Comparison 31 NRD‐101 (Suvenyl) versus placebo (saline plus oral placebo), Outcome 10 Safety: number of patients reporting knee pain during or after IA injection.
31.11. Analysis.

Comparison 31 NRD‐101 (Suvenyl) versus placebo (saline plus oral placebo), Outcome 11 Safety: number of patients reporting diarrhoea.
Comparison 32. NRD‐101 (Suvenyl) versus Diacerein.
32.1. Analysis.
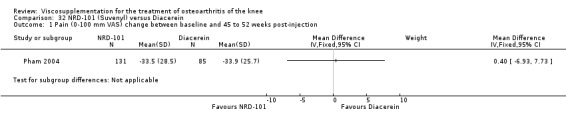
Comparison 32 NRD‐101 (Suvenyl) versus Diacerein, Outcome 1 Pain (0‐100 mm VAS) change between baseline and 45 to 52 weeks post‐injection.
32.2. Analysis.

Comparison 32 NRD‐101 (Suvenyl) versus Diacerein, Outcome 2 Lequesne Index (0‐100 modified scale) change between baseline and 45 to 52 weeks post‐injection.
32.3. Analysis.

Comparison 32 NRD‐101 (Suvenyl) versus Diacerein, Outcome 3 Patient global assessment (0‐100 mm VAS) change between baseline and 45 to 52 weeks post‐injection.
32.4. Analysis.
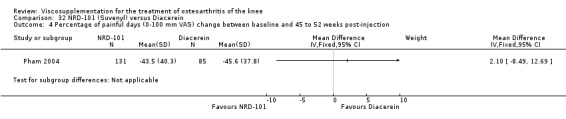
Comparison 32 NRD‐101 (Suvenyl) versus Diacerein, Outcome 4 Percentage of painful days (0‐100 mm VAS) change between baseline and 45 to 52 weeks post‐injection.
32.5. Analysis.
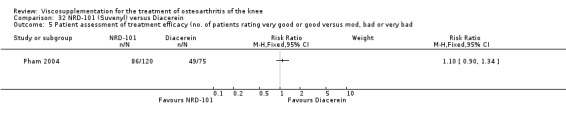
Comparison 32 NRD‐101 (Suvenyl) versus Diacerein, Outcome 5 Patient assessment of treatment efficacy (no. of patients rating very good or good versus mod, bad or very bad.
32.6. Analysis.

Comparison 32 NRD‐101 (Suvenyl) versus Diacerein, Outcome 6 Joint space width (percentage progressors: joint space narrowing greater than 0.5 mm).
32.7. Analysis.
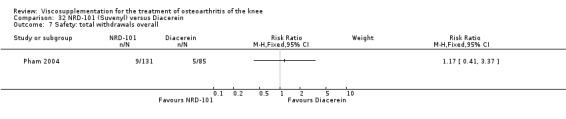
Comparison 32 NRD‐101 (Suvenyl) versus Diacerein, Outcome 7 Safety: total withdrawals overall.
32.8. Analysis.
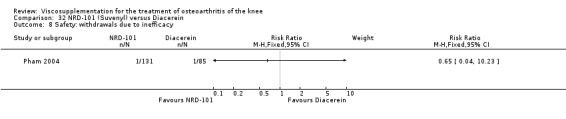
Comparison 32 NRD‐101 (Suvenyl) versus Diacerein, Outcome 8 Safety: withdrawals due to inefficacy.
32.9. Analysis.
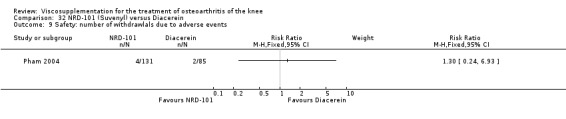
Comparison 32 NRD‐101 (Suvenyl) versus Diacerein, Outcome 9 Safety: number of withdrawlals due to adverse events.
32.10. Analysis.

Comparison 32 NRD‐101 (Suvenyl) versus Diacerein, Outcome 10 Safety: number of patients reporting knee pain during or after IA injection.
32.11. Analysis.

Comparison 32 NRD‐101 (Suvenyl) versus Diacerein, Outcome 11 Safety: number of patients reporting diarrhoea.
Comparison 33. NRD‐101 (Suvenyl) versus Artz (end of treatment).
| Outcome or subgroup title | No. of studies | No. of participants | Statistical method | Effect size |
|---|---|---|---|---|
| 1 Spontaneous pain (number of patients improved) | 1 | Risk Ratio (M‐H, Fixed, 95% CI) | Subtotals only | |
| 2 Pain during the night (number of patients improved) | 1 | Risk Ratio (M‐H, Fixed, 95% CI) | Subtotals only | |
| 3 Pressure pain (number of patients improved) | 1 | Risk Ratio (M‐H, Fixed, 95% CI) | Subtotals only | |
| 4 Passive movement pain (number of patients improved) | 1 | Risk Ratio (M‐H, Fixed, 95% CI) | Subtotals only | |
| 5 Passive flexion (degrees) | 1 | Mean Difference (IV, Fixed, 95% CI) | Subtotals only | |
| 6 Passive extension (degrees) | 1 | Mean Difference (IV, Fixed, 95% CI) | Subtotals only | |
| 7 Patient global assessment | 1 | Risk Ratio (M‐H, Fixed, 95% CI) | Subtotals only | |
| 8 Safety: total withdrawals overall | 1 | Risk Ratio (M‐H, Fixed, 95% CI) | Subtotals only | |
| 9 Safety: number of adverse events | 1 | Risk Ratio (M‐H, Fixed, 95% CI) | Subtotals only |
33.1. Analysis.
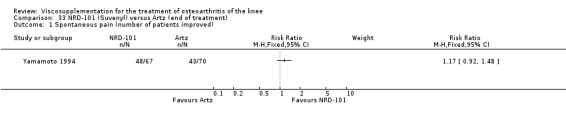
Comparison 33 NRD‐101 (Suvenyl) versus Artz (end of treatment), Outcome 1 Spontaneous pain (number of patients improved).
33.2. Analysis.

Comparison 33 NRD‐101 (Suvenyl) versus Artz (end of treatment), Outcome 2 Pain during the night (number of patients improved).
33.3. Analysis.

Comparison 33 NRD‐101 (Suvenyl) versus Artz (end of treatment), Outcome 3 Pressure pain (number of patients improved).
33.4. Analysis.
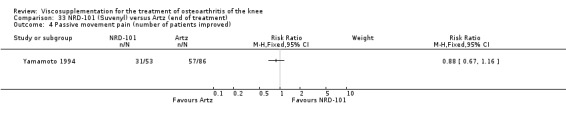
Comparison 33 NRD‐101 (Suvenyl) versus Artz (end of treatment), Outcome 4 Passive movement pain (number of patients improved).
33.5. Analysis.

Comparison 33 NRD‐101 (Suvenyl) versus Artz (end of treatment), Outcome 5 Passive flexion (degrees).
33.6. Analysis.
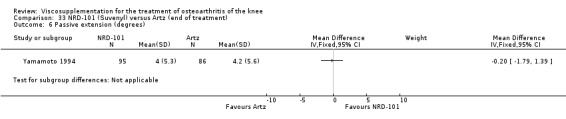
Comparison 33 NRD‐101 (Suvenyl) versus Artz (end of treatment), Outcome 6 Passive extension (degrees).
33.7. Analysis.
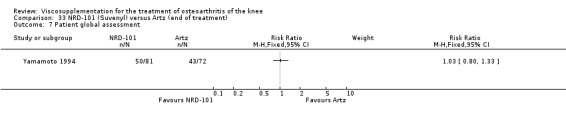
Comparison 33 NRD‐101 (Suvenyl) versus Artz (end of treatment), Outcome 7 Patient global assessment.
33.8. Analysis.
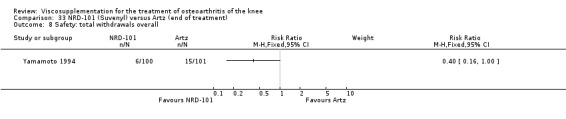
Comparison 33 NRD‐101 (Suvenyl) versus Artz (end of treatment), Outcome 8 Safety: total withdrawals overall.
33.9. Analysis.
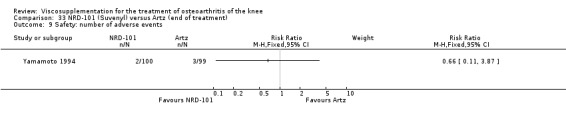
Comparison 33 NRD‐101 (Suvenyl) versus Artz (end of treatment), Outcome 9 Safety: number of adverse events.
Comparison 34. Orthovisc versus placebo.
| Outcome or subgroup title | No. of studies | No. of participants | Statistical method | Effect size |
|---|---|---|---|---|
| 1 WOMAC pain (5 to 25 Likert) | 3 | Mean Difference (IV, Fixed, 95% CI) | Subtotals only | |
| 1.1 1 to 4 weeks post‐injection | 3 | 110 | Mean Difference (IV, Fixed, 95% CI) | ‐2.40 [‐2.85, ‐1.95] |
| 1.2 5 to 13 weeks post‐injection | 2 | 69 | Mean Difference (IV, Fixed, 95% CI) | ‐5.40 [‐6.92, ‐3.89] |
| 1.3 14 to 26 weeks post‐injection | 2 | 69 | Mean Difference (IV, Fixed, 95% CI) | ‐4.63 [‐6.08, ‐3.18] |
| 1.4 45 to 52 weeks post‐injection | 1 | 40 | Mean Difference (IV, Fixed, 95% CI) | ‐5.30 [‐7.02, ‐3.58] |
| 2 WOMAC pain (number of patients who improved) | 1 | Risk Ratio (M‐H, Fixed, 95% CI) | Subtotals only | |
| 3 WOMAC pain (number of patients who achieved greater than 5 unit improvement (relative to baseline score)) | 1 | Risk Ratio (M‐H, Fixed, 95% CI) | Subtotals only | |
| 3.1 14 to 26 weeks post‐injection | 1 | 135 | Risk Ratio (M‐H, Fixed, 95% CI) | 1.42 [1.00, 2.02] |
| 4 Number of patients with a 20% improvement from baseline in WOMAC pain score | 2 | Risk Ratio (M‐H, Random, 95% CI) | Subtotals only | |
| 4.1 5 to 13 weeks post‐injection | 2 | 394 | Risk Ratio (M‐H, Random, 95% CI) | 1.15 [0.91, 1.44] |
| 4.2 14 to 26 weeks post‐injection | 2 | 394 | Risk Ratio (M‐H, Random, 95% CI) | 1.09 [0.94, 1.26] |
| 5 Number of patients with a 40% improvement from baseline in WOMAC pain score | 2 | Risk Ratio (M‐H, Fixed, 95% CI) | Subtotals only | |
| 5.1 5 to 13 weeks post‐injection | 2 | 394 | Risk Ratio (M‐H, Fixed, 95% CI) | 1.30 [1.08, 1.57] |
| 5.2 14 to 26 weeks post‐injection | 2 | 394 | Risk Ratio (M‐H, Fixed, 95% CI) | 1.22 [1.00, 1.49] |
| 6 Number of patients with a 50% improvement from baseline in WOMAC pain score | 2 | Risk Ratio (M‐H, Fixed, 95% CI) | Subtotals only | |
| 6.1 5 to 13 weeks post‐injection | 2 | 394 | Risk Ratio (M‐H, Fixed, 95% CI) | 1.22 [0.99, 1.50] |
| 6.2 14 to 26 weeks post‐injection | 2 | 394 | Risk Ratio (M‐H, Fixed, 95% CI) | 1.22 [0.97, 1.54] |
| 7 WOMAC pain on standing (0 to 100 mm VAS; change from baseline) | 2 | Mean Difference (IV, Fixed, 95% CI) | Subtotals only | |
| 7.1 5 to 13 weeks post‐injection | 2 | 294 | Mean Difference (IV, Fixed, 95% CI) | ‐2.80 [‐9.76, 4.15] |
| 7.2 14 to 26 weeks post‐injection | 2 | 294 | Mean Difference (IV, Fixed, 95% CI) | ‐2.92 [‐10.22, 4.37] |
| 8 WOMAC physical function (17 to 85 Likert) | 3 | Mean Difference (IV, Fixed, 95% CI) | Subtotals only | |
| 8.1 1 to 4 weeks post‐injection | 3 | 110 | Mean Difference (IV, Fixed, 95% CI) | ‐7.20 [‐8.84, ‐5.56] |
| 8.2 5 to 13 weeks post‐injection | 2 | 69 | Mean Difference (IV, Fixed, 95% CI) | ‐12.87 [‐18.60, ‐7.14] |
| 8.3 14 to 26 weeks post‐injection | 2 | 69 | Mean Difference (IV, Fixed, 95% CI) | ‐10.88 [‐16.97, ‐4.79] |
| 8.4 45 to 52 weeks post‐injection | 1 | 40 | Mean Difference (IV, Fixed, 95% CI) | ‐7.10 [‐15.42, 1.22] |
| 9 Range of motion: flexion (degrees) | 1 | Mean Difference (IV, Fixed, 95% CI) | Subtotals only | |
| 9.1 1 to 4 weeks post‐injection | 1 | 41 | Mean Difference (IV, Fixed, 95% CI) | 4.0 [2.02, 5.98] |
| 10 25 metre walking time (sec) | 1 | Mean Difference (IV, Fixed, 95% CI) | Subtotals only | |
| 10.1 1 to 4 weeks post‐injection | 1 | 41 | Mean Difference (IV, Fixed, 95% CI) | 0.40 [‐0.40, 1.20] |
| 11 Knee circumference (mm) | 1 | Mean Difference (IV, Fixed, 95% CI) | Subtotals only | |
| 11.1 1 to 4 weeks post‐injection | 1 | 41 | Mean Difference (IV, Fixed, 95% CI) | ‐0.30 [‐0.73, 0.13] |
| 12 WOMAC stiffness (2 to 10 Likert) | 2 | Mean Difference (IV, Random, 95% CI) | Subtotals only | |
| 12.1 1 to 4 weeks post‐injection | 2 | 70 | Mean Difference (IV, Random, 95% CI) | ‐0.93 [‐2.89, 1.02] |
| 12.2 5 to 13 weeks post‐injection | 1 | 29 | Mean Difference (IV, Random, 95% CI) | ‐1.5 [‐2.84, ‐0.16] |
| 12.3 14 to 26 weeks post‐injection | 1 | 29 | Mean Difference (IV, Random, 95% CI) | ‐1.5 [‐2.71, ‐0.29] |
| 13 WOMAC total score (0 to 100 mm VAS; change from baseline) | 2 | Mean Difference (IV, Fixed, 95% CI) | Subtotals only | |
| 13.1 5 to 13 weeks post‐injection | 2 | 336 | Mean Difference (IV, Fixed, 95% CI) | ‐7.80 [‐34.64, 19.04] |
| 13.2 14 to 26 weeks post‐injection | 2 | 336 | Mean Difference (IV, Fixed, 95% CI) | ‐4.38 [‐31.35, 22.60] |
| 14 Patient global assessment (0 to 100 mm VAS; where 100 is worst severity) | 1 | Mean Difference (IV, Fixed, 95% CI) | Subtotals only | |
| 14.1 1 to 4 weeks post‐injection | 1 | 29 | Mean Difference (IV, Fixed, 95% CI) | ‐20.0 [‐33.22, ‐6.78] |
| 14.2 5 to 13 weeks post‐injection | 1 | 29 | Mean Difference (IV, Fixed, 95% CI) | ‐20.0 [‐30.63, ‐9.37] |
| 14.3 14 to 26 weeks post‐injection | 1 | 29 | Mean Difference (IV, Fixed, 95% CI) | 0.0 [‐12.77, 12.77] |
| 15 Patient global assessment (0 to 100 mm VAS; change from baseline) | 2 | Mean Difference (IV, Fixed, 95% CI) | Subtotals only | |
| 15.1 5 to 13 weeks post‐injection | 2 | 336 | Mean Difference (IV, Fixed, 95% CI) | ‐3.81 [‐10.11, 2.49] |
| 15.2 14 to 26 weeks post‐injection | 2 | 336 | Mean Difference (IV, Fixed, 95% CI) | ‐3.67 [‐10.07, 2.73] |
| 16 Patient global assessment (number patients rating treatment as effective or very effective) | 1 | Risk Ratio (M‐H, Fixed, 95% CI) | Subtotals only | |
| 16.1 5 to 13 weeks post‐injection | 1 | 30 | Risk Ratio (M‐H, Fixed, 95% CI) | 2.2 [1.01, 4.79] |
| 17 Physician global assessment (0 to 100 mm VAS; where 100 is worst severity) | 1 | Mean Difference (IV, Fixed, 95% CI) | Subtotals only | |
| 17.1 1 to 4 weeks post‐injection | 1 | 29 | Mean Difference (IV, Fixed, 95% CI) | 0.0 [‐17.62, 17.62] |
| 17.2 5 to 13 weeks post‐injection | 1 | 29 | Mean Difference (IV, Fixed, 95% CI) | 0.0 [‐16.67, 16.67] |
| 17.3 14 to 26 weeks post‐injection | 1 | 29 | Mean Difference (IV, Fixed, 95% CI) | ‐10.0 [‐26.50, 6.50] |
| 18 Physician global assessment (0 to 100 VAS; change from baseline) | 2 | Mean Difference (IV, Fixed, 95% CI) | Subtotals only | |
| 18.1 5 to 13 weeks post‐injection | 2 | 336 | Mean Difference (IV, Fixed, 95% CI) | ‐4.22 [‐9.48, 1.04] |
| 18.2 14 to 26 weeks post‐injection | 2 | 336 | Mean Difference (IV, Fixed, 95% CI) | ‐4.08 [‐9.28, 1.12] |
| 19 Synovial fluid effusion volume (ml) | 1 | Mean Difference (IV, Fixed, 95% CI) | Subtotals only | |
| 19.1 1 to 4 weeks post‐injection | 1 | 41 | Mean Difference (IV, Fixed, 95% CI) | ‐4.0 [‐5.66, ‐2.34] |
| 20 Interleukin 6 level in the synovial fluid (pg/ml) | 1 | Mean Difference (IV, Fixed, 95% CI) | Subtotals only | |
| 20.1 1 to 4 weeks post‐injection | 1 | 41 | Mean Difference (IV, Fixed, 95% CI) | ‐11.90 [‐14.09, ‐9.71] |
| 21 Interleukin 8 level in the synovial fluid (pg/ml) | 1 | Mean Difference (IV, Fixed, 95% CI) | Subtotals only | |
| 21.1 1 to 4 weeks post‐injection | 1 | 43 | Mean Difference (IV, Fixed, 95% CI) | ‐4.80 [‐6.54, ‐3.06] |
| 22 Tumor necrosis factor alpha levels in synovial fluid | 1 | Mean Difference (IV, Fixed, 95% CI) | Subtotals only | |
| 22.1 1 to 4 weeks post‐injection | 1 | 41 | Mean Difference (IV, Fixed, 95% CI) | ‐9.30 [‐21.53, 2.93] |
| 23 Safety: total withdrawals overall | 5 | Risk Ratio (M‐H, Fixed, 95% CI) | Subtotals only | |
| 24 Safety: withdrawals due to lack of efficacy | 4 | Risk Ratio (M‐H, Fixed, 95% CI) | Subtotals only | |
| 25 Safety: number of patients with treatment related adverse events | 1 | Risk Ratio (M‐H, Fixed, 95% CI) | Subtotals only | |
| 26 Safety: number of patients withdrawn due to noncompliance | 1 | Risk Ratio (M‐H, Fixed, 95% CI) | Subtotals only | |
| 27 Safety: number of patients with reported musculoskeletal adverse events | 3 | Risk Ratio (M‐H, Fixed, 95% CI) | Subtotals only | |
| 28 Safety: number of patients with general body adverse events | 3 | Risk Ratio (M‐H, Fixed, 95% CI) | Subtotals only | |
| 29 Safety: number of patients with local skin rash | 3 | Risk Ratio (M‐H, Fixed, 95% CI) | Subtotals only | |
| 30 Safety: number patients with gastrointestinal complaints | 3 | Risk Ratio (M‐H, Fixed, 95% CI) | Subtotals only | |
| 31 Safety: number of patients with reported respiratory adverse events | 3 | Risk Ratio (M‐H, Fixed, 95% CI) | Subtotals only | |
| 32 Safety: number of patients with nervous system adverse events | 3 | Risk Ratio (M‐H, Fixed, 95% CI) | Subtotals only | |
| 33 Safety: number of patients with urinary adverse events | 1 | Risk Ratio (M‐H, Fixed, 95% CI) | Subtotals only | |
| 34 Safety: number of patients withdrawn due to local adverse events | 1 | Risk Ratio (M‐H, Fixed, 95% CI) | Subtotals only |
34.1. Analysis.
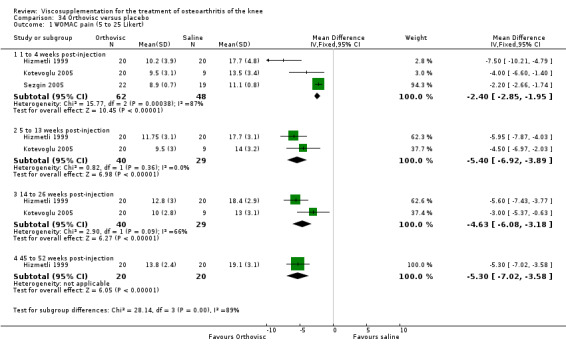
Comparison 34 Orthovisc versus placebo, Outcome 1 WOMAC pain (5 to 25 Likert).
34.2. Analysis.

Comparison 34 Orthovisc versus placebo, Outcome 2 WOMAC pain (number of patients who improved).
34.3. Analysis.
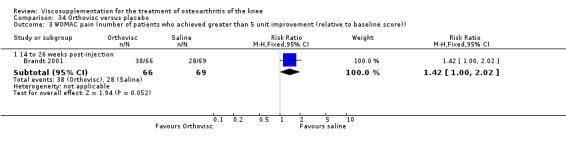
Comparison 34 Orthovisc versus placebo, Outcome 3 WOMAC pain (number of patients who achieved greater than 5 unit improvement (relative to baseline score)).
34.4. Analysis.
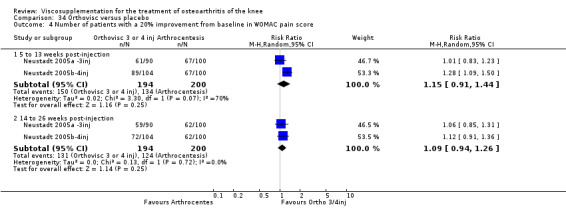
Comparison 34 Orthovisc versus placebo, Outcome 4 Number of patients with a 20% improvement from baseline in WOMAC pain score.
34.5. Analysis.
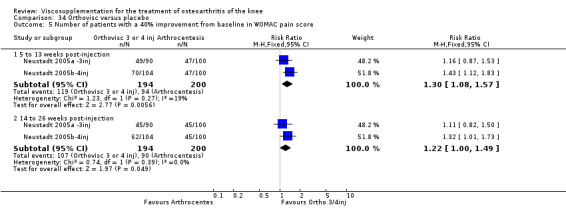
Comparison 34 Orthovisc versus placebo, Outcome 5 Number of patients with a 40% improvement from baseline in WOMAC pain score.
34.6. Analysis.
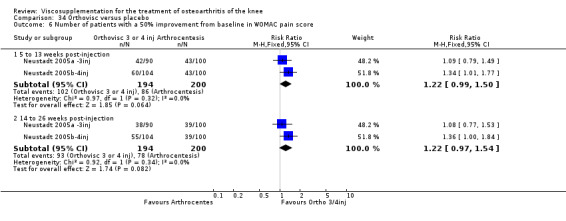
Comparison 34 Orthovisc versus placebo, Outcome 6 Number of patients with a 50% improvement from baseline in WOMAC pain score.
34.7. Analysis.

Comparison 34 Orthovisc versus placebo, Outcome 7 WOMAC pain on standing (0 to 100 mm VAS; change from baseline).
34.8. Analysis.

Comparison 34 Orthovisc versus placebo, Outcome 8 WOMAC physical function (17 to 85 Likert).
34.9. Analysis.

Comparison 34 Orthovisc versus placebo, Outcome 9 Range of motion: flexion (degrees).
34.10. Analysis.
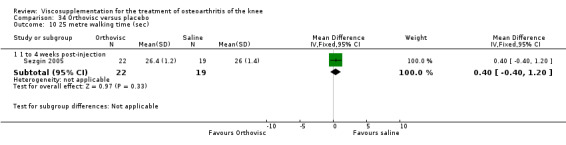
Comparison 34 Orthovisc versus placebo, Outcome 10 25 metre walking time (sec).
34.11. Analysis.

Comparison 34 Orthovisc versus placebo, Outcome 11 Knee circumference (mm).
34.12. Analysis.
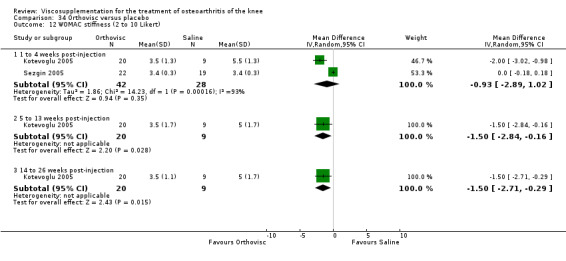
Comparison 34 Orthovisc versus placebo, Outcome 12 WOMAC stiffness (2 to 10 Likert).
34.13. Analysis.
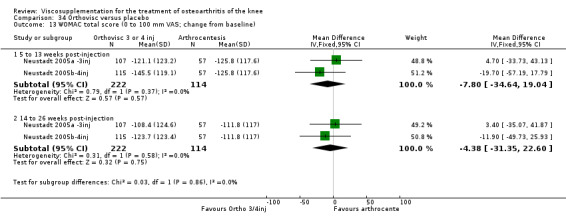
Comparison 34 Orthovisc versus placebo, Outcome 13 WOMAC total score (0 to 100 mm VAS; change from baseline).
34.14. Analysis.

Comparison 34 Orthovisc versus placebo, Outcome 14 Patient global assessment (0 to 100 mm VAS; where 100 is worst severity).
34.15. Analysis.
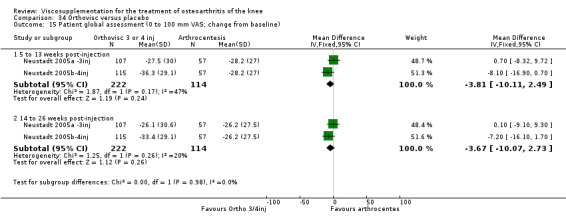
Comparison 34 Orthovisc versus placebo, Outcome 15 Patient global assessment (0 to 100 mm VAS; change from baseline).
34.16. Analysis.
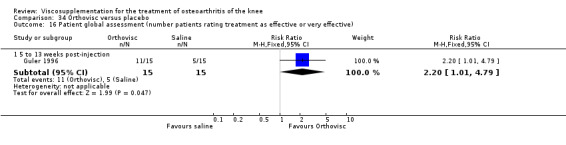
Comparison 34 Orthovisc versus placebo, Outcome 16 Patient global assessment (number patients rating treatment as effective or very effective).
34.17. Analysis.

Comparison 34 Orthovisc versus placebo, Outcome 17 Physician global assessment (0 to 100 mm VAS; where 100 is worst severity).
34.18. Analysis.
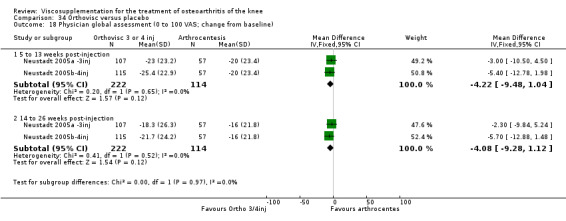
Comparison 34 Orthovisc versus placebo, Outcome 18 Physician global assessment (0 to 100 VAS; change from baseline).
34.19. Analysis.
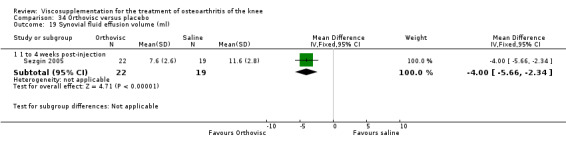
Comparison 34 Orthovisc versus placebo, Outcome 19 Synovial fluid effusion volume (ml).
34.20. Analysis.

Comparison 34 Orthovisc versus placebo, Outcome 20 Interleukin 6 level in the synovial fluid (pg/ml).
34.21. Analysis.
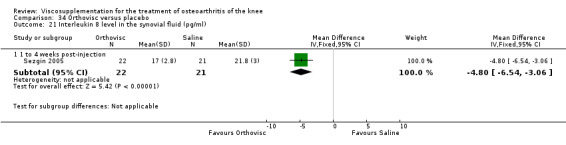
Comparison 34 Orthovisc versus placebo, Outcome 21 Interleukin 8 level in the synovial fluid (pg/ml).
34.22. Analysis.
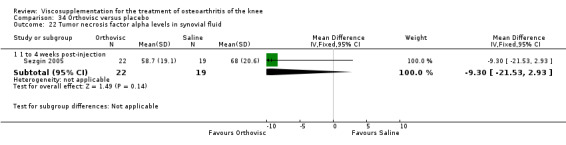
Comparison 34 Orthovisc versus placebo, Outcome 22 Tumor necrosis factor alpha levels in synovial fluid.
34.23. Analysis.
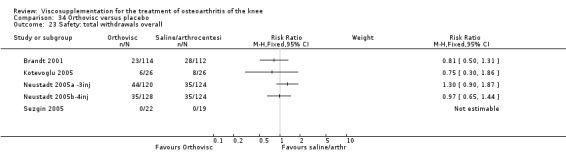
Comparison 34 Orthovisc versus placebo, Outcome 23 Safety: total withdrawals overall.
34.24. Analysis.

Comparison 34 Orthovisc versus placebo, Outcome 24 Safety: withdrawals due to lack of efficacy.
34.25. Analysis.
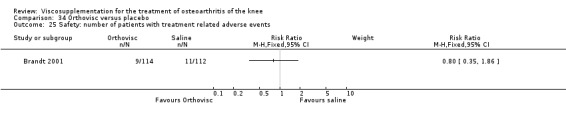
Comparison 34 Orthovisc versus placebo, Outcome 25 Safety: number of patients with treatment related adverse events.
34.26. Analysis.
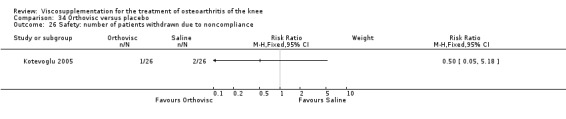
Comparison 34 Orthovisc versus placebo, Outcome 26 Safety: number of patients withdrawn due to noncompliance.
34.27. Analysis.
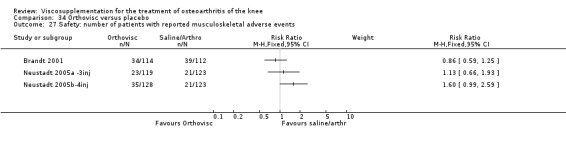
Comparison 34 Orthovisc versus placebo, Outcome 27 Safety: number of patients with reported musculoskeletal adverse events.
34.28. Analysis.
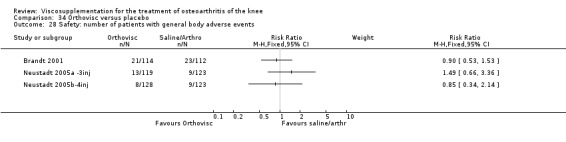
Comparison 34 Orthovisc versus placebo, Outcome 28 Safety: number of patients with general body adverse events.
34.29. Analysis.
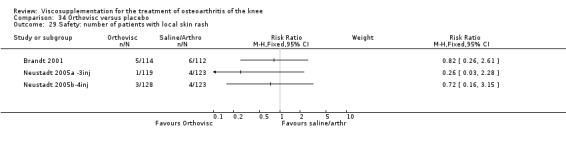
Comparison 34 Orthovisc versus placebo, Outcome 29 Safety: number of patients with local skin rash.
34.30. Analysis.

Comparison 34 Orthovisc versus placebo, Outcome 30 Safety: number patients with gastrointestinal complaints.
34.31. Analysis.
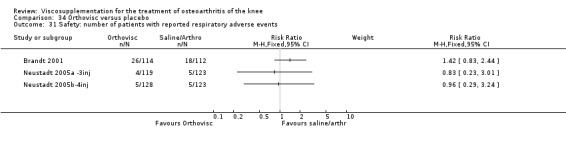
Comparison 34 Orthovisc versus placebo, Outcome 31 Safety: number of patients with reported respiratory adverse events.
34.32. Analysis.
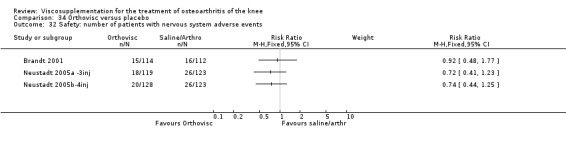
Comparison 34 Orthovisc versus placebo, Outcome 32 Safety: number of patients with nervous system adverse events.
34.33. Analysis.

Comparison 34 Orthovisc versus placebo, Outcome 33 Safety: number of patients with urinary adverse events.
34.34. Analysis.
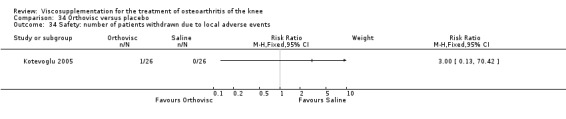
Comparison 34 Orthovisc versus placebo, Outcome 34 Safety: number of patients withdrawn due to local adverse events.
Comparison 35. Orthovisc versus betamethasone.
| Outcome or subgroup title | No. of studies | No. of participants | Statistical method | Effect size |
|---|---|---|---|---|
| 1 WOMAC function (0‐100 mm VAS) | 1 | Mean Difference (IV, Fixed, 95% CI) | Subtotals only | |
| 1.1 1 to 4 weeks post‐injection | 1 | 40 | Mean Difference (IV, Fixed, 95% CI) | 3.00 [‐2.39, 8.39] |
| 1.2 5 to 13 weeks post‐injection | 1 | 40 | Mean Difference (IV, Fixed, 95% CI) | ‐9.0 [‐14.15, ‐3.85] |
| 2 Flexion (degrees) | 1 | Mean Difference (IV, Fixed, 95% CI) | Subtotals only | |
| 2.1 1 to 4 weeks post‐injection | 1 | 40 | Mean Difference (IV, Fixed, 95% CI) | ‐4.90 [‐14.69, 4.89] |
| 2.2 5 to 13 weeks post‐injection | 1 | 40 | Mean Difference (IV, Fixed, 95% CI) | ‐7.05 [‐15.48, 1.38] |
| 3 Patient global assessment (number of patients good or very good) | 1 | Risk Ratio (M‐H, Fixed, 95% CI) | Subtotals only | |
| 3.1 1 to 4 weeks post‐injection | 1 | 40 | Risk Ratio (M‐H, Fixed, 95% CI) | 0.83 [0.47, 1.47] |
| 3.2 5 to 13 weeks post‐injection | 1 | 40 | Risk Ratio (M‐H, Fixed, 95% CI) | 1.88 [1.04, 3.39] |
| 4 Safety: total withdrawals overall | 1 | Risk Ratio (M‐H, Fixed, 95% CI) | Subtotals only | |
| 5 Safety: number of patients withdrawn due to adverse events | 1 | Risk Ratio (M‐H, Fixed, 95% CI) | Subtotals only | |
| 6 Safety: number of patients with local adverse events | 1 | Risk Ratio (M‐H, Fixed, 95% CI) | Subtotals only | |
| 7 Safety: number of patients with systemic adverse events | 1 | Risk Ratio (M‐H, Fixed, 95% CI) | Subtotals only |
35.1. Analysis.
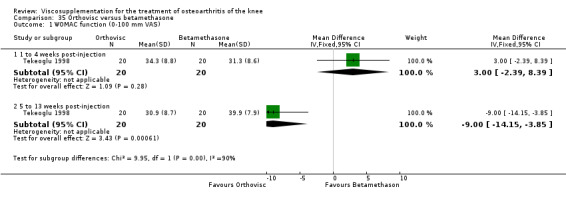
Comparison 35 Orthovisc versus betamethasone, Outcome 1 WOMAC function (0‐100 mm VAS).
35.2. Analysis.
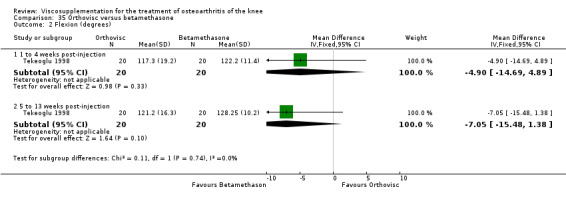
Comparison 35 Orthovisc versus betamethasone, Outcome 2 Flexion (degrees).
35.3. Analysis.
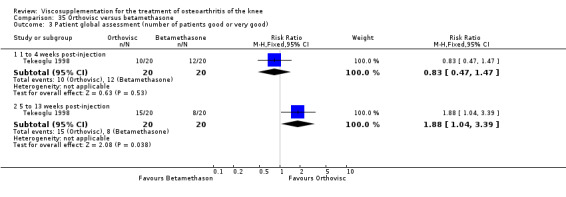
Comparison 35 Orthovisc versus betamethasone, Outcome 3 Patient global assessment (number of patients good or very good).
35.4. Analysis.

Comparison 35 Orthovisc versus betamethasone, Outcome 4 Safety: total withdrawals overall.
35.5. Analysis.
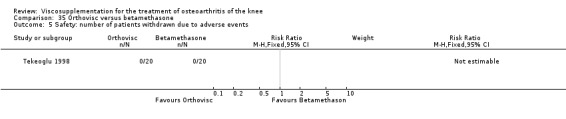
Comparison 35 Orthovisc versus betamethasone, Outcome 5 Safety: number of patients withdrawn due to adverse events.
35.6. Analysis.

Comparison 35 Orthovisc versus betamethasone, Outcome 6 Safety: number of patients with local adverse events.
35.7. Analysis.

Comparison 35 Orthovisc versus betamethasone, Outcome 7 Safety: number of patients with systemic adverse events.
Comparison 36. Orthovisc versus 6‐methylprednisolone acetate.
| Outcome or subgroup title | No. of studies | No. of participants | Statistical method | Effect size |
|---|---|---|---|---|
| 1 Pain on weight bearing (0‐100 mm VAS) | 1 | Mean Difference (IV, Fixed, 95% CI) | Subtotals only | |
| 1.1 1 to 4 weeks post‐injection | 1 | 55 | Mean Difference (IV, Fixed, 95% CI) | 5.03 [‐4.94, 15.00] |
| 1.2 5 to 13 weeks post‐injection | 1 | 55 | Mean Difference (IV, Fixed, 95% CI) | ‐15.64 [‐24.51, ‐6.77] |
| 1.3 14 to 26 weeks post‐injection | 1 | 55 | Mean Difference (IV, Fixed, 95% CI) | ‐15.40 [‐25.91, ‐4.89] |
| 2 Pain at rest (0‐100 mm VAS) | 1 | Mean Difference (IV, Fixed, 95% CI) | Subtotals only | |
| 2.1 1 to 4 weeks post‐injection | 1 | 55 | Mean Difference (IV, Fixed, 95% CI) | 3.53 [‐2.09, 9.15] |
| 2.2 5 to 13 weeks post‐injection | 1 | 55 | Mean Difference (IV, Fixed, 95% CI) | ‐7.70 [‐13.50, ‐1.90] |
| 2.3 14 to 26 weeks post‐injection | 1 | 55 | Mean Difference (IV, Fixed, 95% CI) | ‐2.90 [‐9.47, 3.67] |
| 3 Pain on walking (0‐100 mm VAS) | 1 | Mean Difference (IV, Fixed, 95% CI) | Subtotals only | |
| 3.1 1 to 4 weeks post‐injection | 1 | 55 | Mean Difference (IV, Fixed, 95% CI) | ‐0.40 [‐11.46, 10.66] |
| 3.2 5 to 13 weeks post‐injection | 1 | 55 | Mean Difference (IV, Fixed, 95% CI) | ‐18.43 [‐29.19, ‐7.67] |
| 3.3 14 to 26 weeks post‐injection | 1 | 55 | Mean Difference (IV, Fixed, 95% CI) | ‐14.90 [‐25.91, ‐3.89] |
| 4 Lequesne Index (0‐24) | 1 | Mean Difference (IV, Fixed, 95% CI) | Subtotals only | |
| 4.1 1 to 4 weeks post‐injection | 1 | 55 | Mean Difference (IV, Fixed, 95% CI) | ‐0.10 [‐0.91, 0.71] |
| 4.2 5 to 13 weeks post‐injection | 1 | 55 | Mean Difference (IV, Fixed, 95% CI) | ‐1.40 [‐2.13, ‐0.67] |
| 4.3 14 to 26 weeks post‐injection | 1 | 55 | Mean Difference (IV, Fixed, 95% CI) | ‐1.14 [‐2.16, ‐0.12] |
| 5 Flexion (active range in degrees) | 1 | Mean Difference (IV, Fixed, 95% CI) | Subtotals only | |
| 5.1 1 to 4 weeks post‐injection | 1 | 55 | Mean Difference (IV, Fixed, 95% CI) | 2.16 [‐2.58, 6.90] |
| 5.2 5 to 13 weeks post‐injection | 1 | 55 | Mean Difference (IV, Fixed, 95% CI) | 2.36 [‐1.82, 6.54] |
| 5.3 14 to 26 weeks post‐injection | 1 | 55 | Mean Difference (IV, Fixed, 95% CI) | 5.0 [0.19, 9.81] |
| 6 Safety: total withdrawals overall | 1 | Risk Ratio (M‐H, Fixed, 95% CI) | Subtotals only | |
| 7 Safety: number of patients withdrawn due to increased pain | 1 | Risk Ratio (M‐H, Fixed, 95% CI) | Subtotals only | |
| 8 Safety: number of patients reporting musculoskeletal adverse events | 1 | Risk Ratio (M‐H, Fixed, 95% CI) | Subtotals only | |
| 9 Safety: number of patients reporting skin adverse events | 1 | Risk Ratio (M‐H, Fixed, 95% CI) | Subtotals only | |
| 10 Safety: number of patients reporting gastrointestinal adverse events | 1 | Risk Ratio (M‐H, Fixed, 95% CI) | Subtotals only | |
| 11 Safety: number of patients reporting general adverse events | 1 | Risk Ratio (M‐H, Fixed, 95% CI) | Subtotals only | |
| 12 Safety: number of patients reporting knee pain after injection | 1 | Risk Ratio (M‐H, Fixed, 95% CI) | Subtotals only |
36.1. Analysis.
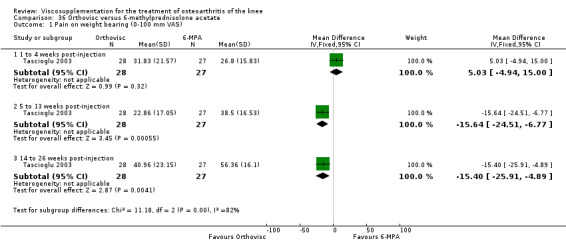
Comparison 36 Orthovisc versus 6‐methylprednisolone acetate, Outcome 1 Pain on weight bearing (0‐100 mm VAS).
36.2. Analysis.

Comparison 36 Orthovisc versus 6‐methylprednisolone acetate, Outcome 2 Pain at rest (0‐100 mm VAS).
36.3. Analysis.

Comparison 36 Orthovisc versus 6‐methylprednisolone acetate, Outcome 3 Pain on walking (0‐100 mm VAS).
36.4. Analysis.
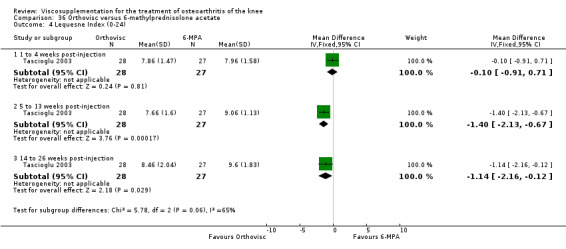
Comparison 36 Orthovisc versus 6‐methylprednisolone acetate, Outcome 4 Lequesne Index (0‐24).
36.5. Analysis.
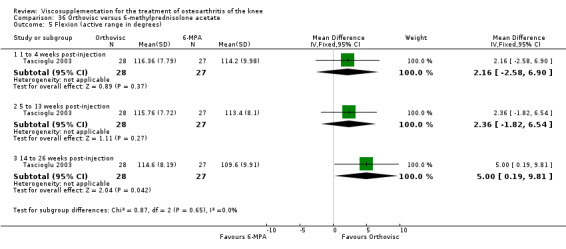
Comparison 36 Orthovisc versus 6‐methylprednisolone acetate, Outcome 5 Flexion (active range in degrees).
36.6. Analysis.
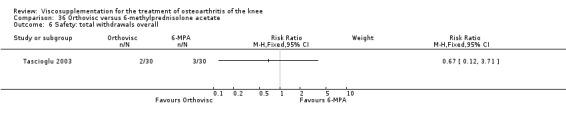
Comparison 36 Orthovisc versus 6‐methylprednisolone acetate, Outcome 6 Safety: total withdrawals overall.
36.7. Analysis.

Comparison 36 Orthovisc versus 6‐methylprednisolone acetate, Outcome 7 Safety: number of patients withdrawn due to increased pain.
36.8. Analysis.

Comparison 36 Orthovisc versus 6‐methylprednisolone acetate, Outcome 8 Safety: number of patients reporting musculoskeletal adverse events.
36.9. Analysis.

Comparison 36 Orthovisc versus 6‐methylprednisolone acetate, Outcome 9 Safety: number of patients reporting skin adverse events.
36.10. Analysis.

Comparison 36 Orthovisc versus 6‐methylprednisolone acetate, Outcome 10 Safety: number of patients reporting gastrointestinal adverse events.
36.11. Analysis.

Comparison 36 Orthovisc versus 6‐methylprednisolone acetate, Outcome 11 Safety: number of patients reporting general adverse events.
36.12. Analysis.
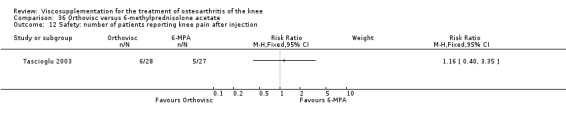
Comparison 36 Orthovisc versus 6‐methylprednisolone acetate, Outcome 12 Safety: number of patients reporting knee pain after injection.
Comparison 37. Orthovisc versus (Orthovisc plus triamcinolone acetonide).
| Outcome or subgroup title | No. of studies | No. of participants | Statistical method | Effect size |
|---|---|---|---|---|
| 1 Pain (0‐100 mm VAS) | 1 | Mean Difference (IV, Fixed, 95% CI) | Subtotals only | |
| 1.1 1 to 4 weeks post‐injection | 1 | 40 | Mean Difference (IV, Fixed, 95% CI) | 13.0 [3.77, 22.23] |
| 1.2 5 to 13 weeks post‐injection | 1 | 40 | Mean Difference (IV, Fixed, 95% CI) | ‐2.0 [‐11.36, 7.36] |
| 1.3 14 to 26 weeks post‐injection | 1 | 40 | Mean Difference (IV, Fixed, 95% CI) | 5.0 [‐3.99, 13.99] |
| 1.4 34 weeks post‐injection | 1 | 40 | Mean Difference (IV, Fixed, 95% CI) | 2.0 [‐8.62, 12.62] |
| 1.5 45 to 52 weeks post‐injection | 1 | 40 | Mean Difference (IV, Fixed, 95% CI) | ‐0.60 [‐11.61, 10.41] |
| 2 WOMAC pain (0‐20 Likert) | 1 | Mean Difference (IV, Fixed, 95% CI) | Subtotals only | |
| 2.1 1 to 4 weeks post‐injection | 1 | 40 | Mean Difference (IV, Fixed, 95% CI) | 0.80 [‐1.64, 3.24] |
| 2.2 5 to 13 weeks post‐injection | 1 | 40 | Mean Difference (IV, Fixed, 95% CI) | ‐1.10 [‐3.54, 1.34] |
| 2.3 14 to 26 weeks post‐injection | 1 | 40 | Mean Difference (IV, Fixed, 95% CI) | ‐1.20 [‐4.13, 1.73] |
| 2.4 34 weeks post‐injection | 1 | 40 | Mean Difference (IV, Fixed, 95% CI) | ‐0.10 [‐2.99, 2.79] |
| 2.5 45 to 52 weeks post‐injection | 1 | 40 | Mean Difference (IV, Fixed, 95% CI) | 0.10 [‐3.03, 3.23] |
| 3 WOMAC physical function (0‐68 Likert) | 1 | Mean Difference (IV, Fixed, 95% CI) | Subtotals only | |
| 3.1 1 to 4 weeks post‐injection | 1 | 40 | Mean Difference (IV, Fixed, 95% CI) | 5.0 [‐3.41, 13.41] |
| 3.2 5 to 13 weeks post‐injection | 1 | 40 | Mean Difference (IV, Fixed, 95% CI) | 6.80 [‐0.62, 14.22] |
| 3.3 14 to 26 weeks post‐injection | 1 | 40 | Mean Difference (IV, Fixed, 95% CI) | 5.30 [‐1.98, 12.58] |
| 3.4 34 weeks post‐injection | 1 | 40 | Mean Difference (IV, Fixed, 95% CI) | 4.30 [‐1.73, 10.33] |
| 3.5 45 to 52 weeks post‐injection | 1 | 40 | Mean Difference (IV, Fixed, 95% CI) | 3.10 [‐4.32, 10.52] |
| 4 50 foot walking time (seconds) | 1 | Mean Difference (IV, Fixed, 95% CI) | Subtotals only | |
| 4.1 1 to 4 weeks post‐injection | 1 | 40 | Mean Difference (IV, Fixed, 95% CI) | 0.10 [‐3.06, 3.26] |
| 4.2 5 to 13 weeks post‐injection | 1 | 40 | Mean Difference (IV, Fixed, 95% CI) | 0.20 [‐3.16, 3.56] |
| 4.3 14 to 26 weeks post‐injection | 1 | 40 | Mean Difference (IV, Fixed, 95% CI) | ‐0.20 [‐3.32, 2.92] |
| 4.4 34 weeks post‐injection | 1 | 40 | Mean Difference (IV, Fixed, 95% CI) | ‐1.0 [‐2.95, 0.95] |
| 4.5 45 to 52 weeks post‐injection | 1 | 40 | Mean Difference (IV, Fixed, 95% CI) | ‐0.20 [‐3.50, 3.10] |
| 5 Range of motion (degrees) | 1 | Mean Difference (IV, Fixed, 95% CI) | Subtotals only | |
| 5.1 1 to 4 weeks post‐injection | 1 | 40 | Mean Difference (IV, Fixed, 95% CI) | ‐3.0 [‐10.55, 4.55] |
| 5.2 5 to 13 weeks post‐injection | 1 | 40 | Mean Difference (IV, Fixed, 95% CI) | ‐4.90 [‐12.00, 2.20] |
| 5.3 14 to 26 weeks post‐injection | 1 | 40 | Mean Difference (IV, Fixed, 95% CI) | ‐4.20 [‐11.66, 3.26] |
| 5.4 34 weeks post‐injection | 1 | 40 | Mean Difference (IV, Fixed, 95% CI) | ‐4.30 [‐12.53, 3.93] |
| 5.5 45 to 52 weeks post‐injection | 1 | 40 | Mean Difference (IV, Fixed, 95% CI) | ‐4.5 [‐12.50, 3.50] |
| 6 WOMAC stiffness (0‐8 Likert) | 1 | Mean Difference (IV, Fixed, 95% CI) | Subtotals only | |
| 6.1 1 to 4 weeks post‐injection | 1 | 40 | Mean Difference (IV, Fixed, 95% CI) | 0.80 [0.02, 1.58] |
| 6.2 5 to 13 weeks post‐injection | 1 | 40 | Mean Difference (IV, Fixed, 95% CI) | 0.20 [‐0.59, 0.99] |
| 6.3 14 to 26 weeks post‐injection | 1 | 40 | Mean Difference (IV, Fixed, 95% CI) | 0.40 [‐0.23, 1.03] |
| 6.4 34 weeks post‐injection | 1 | 40 | Mean Difference (IV, Fixed, 95% CI) | 0.80 [0.12, 1.48] |
| 6.5 45 to 52 weeks post‐injection | 1 | 40 | Mean Difference (IV, Fixed, 95% CI) | 0.80 [0.06, 1.54] |
| 7 WOMAC total score (0‐96 Likert) | 1 | Mean Difference (IV, Fixed, 95% CI) | Subtotals only | |
| 7.1 1 to 4 weeks post‐injection | 1 | 40 | Mean Difference (IV, Fixed, 95% CI) | 6.80 [‐3.31, 16.91] |
| 7.2 5 to 13 weeks post‐injection | 1 | 40 | Mean Difference (IV, Fixed, 95% CI) | 5.90 [‐3.58, 15.38] |
| 7.3 14 to 26 weeks post‐injection | 1 | 40 | Mean Difference (IV, Fixed, 95% CI) | 4.5 [‐4.84, 13.84] |
| 7.4 34 weeks post‐injection | 1 | 40 | Mean Difference (IV, Fixed, 95% CI) | 4.90 [‐2.99, 12.79] |
| 7.5 45 to 52 weeks post‐injection | 1 | 40 | Mean Difference (IV, Fixed, 95% CI) | 3.90 [‐5.24, 13.04] |
| 8 Safety: total withdrawals overall | 1 | Risk Ratio (M‐H, Fixed, 95% CI) | Subtotals only | |
| 9 Safety: withdrawals due to lack of efficacy | 1 | Risk Ratio (M‐H, Fixed, 95% CI) | Subtotals only | |
| 10 Safety: number of patients reporting adverse events (local reactions) | 1 | Risk Ratio (M‐H, Fixed, 95% CI) | Subtotals only |
37.1. Analysis.
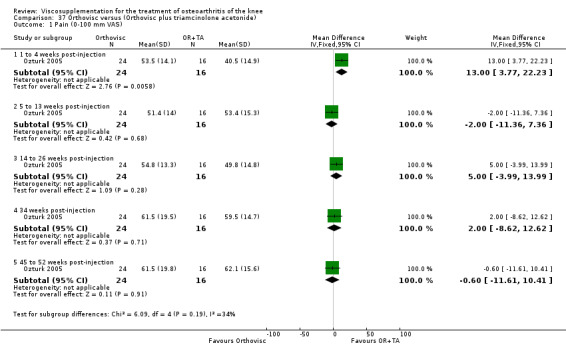
Comparison 37 Orthovisc versus (Orthovisc plus triamcinolone acetonide), Outcome 1 Pain (0‐100 mm VAS).
37.2. Analysis.
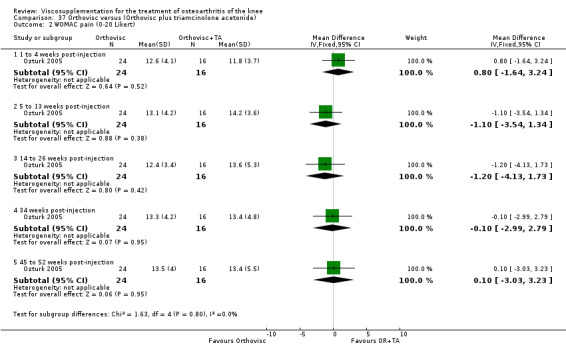
Comparison 37 Orthovisc versus (Orthovisc plus triamcinolone acetonide), Outcome 2 WOMAC pain (0‐20 Likert).
37.3. Analysis.
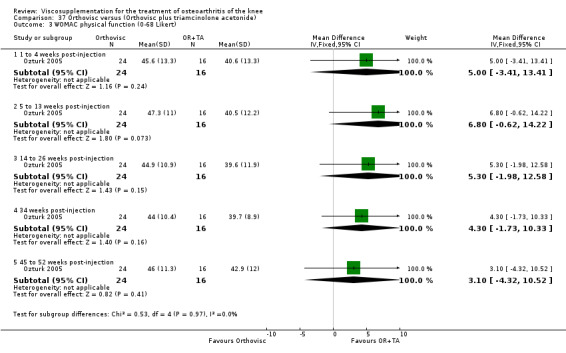
Comparison 37 Orthovisc versus (Orthovisc plus triamcinolone acetonide), Outcome 3 WOMAC physical function (0‐68 Likert).
37.4. Analysis.

Comparison 37 Orthovisc versus (Orthovisc plus triamcinolone acetonide), Outcome 4 50 foot walking time (seconds).
37.5. Analysis.

Comparison 37 Orthovisc versus (Orthovisc plus triamcinolone acetonide), Outcome 5 Range of motion (degrees).
37.6. Analysis.
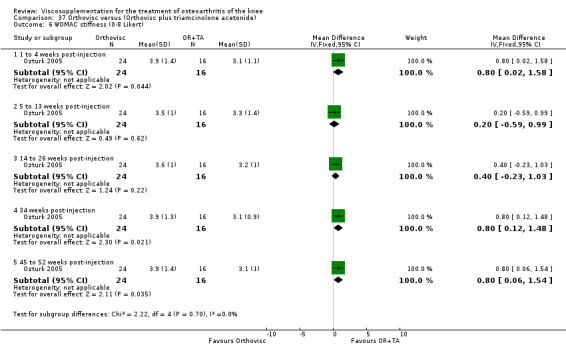
Comparison 37 Orthovisc versus (Orthovisc plus triamcinolone acetonide), Outcome 6 WOMAC stiffness (0‐8 Likert).
37.7. Analysis.
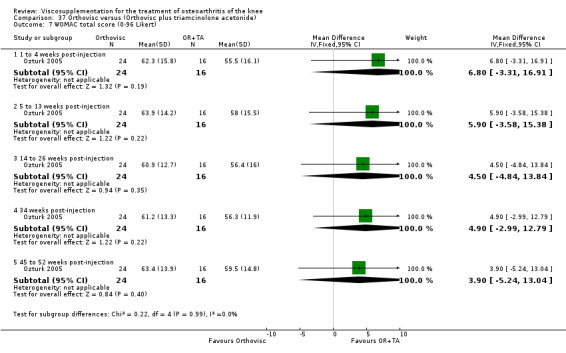
Comparison 37 Orthovisc versus (Orthovisc plus triamcinolone acetonide), Outcome 7 WOMAC total score (0‐96 Likert).
37.8. Analysis.
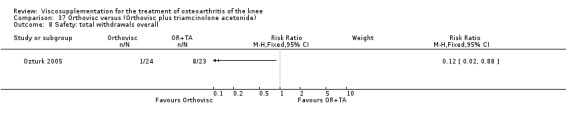
Comparison 37 Orthovisc versus (Orthovisc plus triamcinolone acetonide), Outcome 8 Safety: total withdrawals overall.
37.9. Analysis.
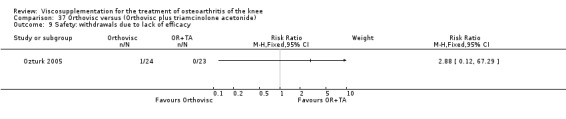
Comparison 37 Orthovisc versus (Orthovisc plus triamcinolone acetonide), Outcome 9 Safety: withdrawals due to lack of efficacy.
37.10. Analysis.

Comparison 37 Orthovisc versus (Orthovisc plus triamcinolone acetonide), Outcome 10 Safety: number of patients reporting adverse events (local reactions).
Comparison 38. Orthovisc versus (Orthovisc plus lidocaine trigger point injection)(1 week post‐injection).
| Outcome or subgroup title | No. of studies | No. of participants | Statistical method | Effect size |
|---|---|---|---|---|
| 1 Pain at rest (0 to 4 point scale) | 1 | Mean Difference (IV, Fixed, 95% CI) | Subtotals only | |
| 2 Pain/restrictions walking (0 to 4 point scale) | 1 | Mean Difference (IV, Fixed, 95% CI) | Subtotals only | |
| 3 Pain/restrictions going up or down stairs (0 to 4 point scale) | 1 | Mean Difference (IV, Fixed, 95% CI) | Subtotals only | |
| 4 Range of motion (degrees) | 1 | Mean Difference (IV, Fixed, 95% CI) | Subtotals only | |
| 5 Safety: total withdrawals overall | 1 | Risk Ratio (M‐H, Fixed, 95% CI) | Subtotals only |
38.1. Analysis.
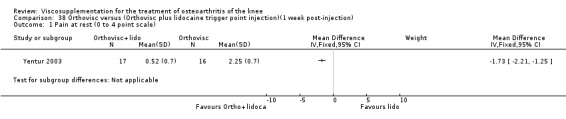
Comparison 38 Orthovisc versus (Orthovisc plus lidocaine trigger point injection)(1 week post‐injection), Outcome 1 Pain at rest (0 to 4 point scale).
38.2. Analysis.
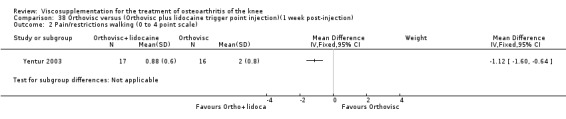
Comparison 38 Orthovisc versus (Orthovisc plus lidocaine trigger point injection)(1 week post‐injection), Outcome 2 Pain/restrictions walking (0 to 4 point scale).
38.3. Analysis.
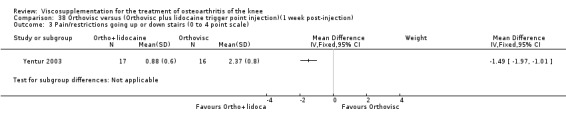
Comparison 38 Orthovisc versus (Orthovisc plus lidocaine trigger point injection)(1 week post‐injection), Outcome 3 Pain/restrictions going up or down stairs (0 to 4 point scale).
38.4. Analysis.
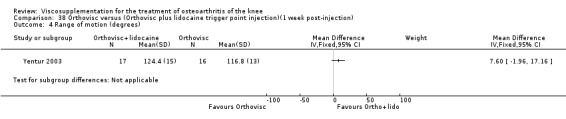
Comparison 38 Orthovisc versus (Orthovisc plus lidocaine trigger point injection)(1 week post‐injection), Outcome 4 Range of motion (degrees).
38.5. Analysis.
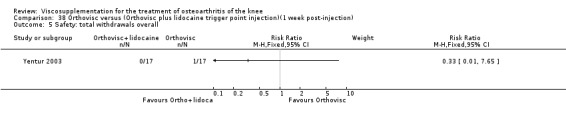
Comparison 38 Orthovisc versus (Orthovisc plus lidocaine trigger point injection)(1 week post‐injection), Outcome 5 Safety: total withdrawals overall.
Comparison 39. Orthovisc versus physical therapy.
| Outcome or subgroup title | No. of studies | No. of participants | Statistical method | Effect size |
|---|---|---|---|---|
| 1 Spontaneous pain (0‐100 mm VAS) | 1 | Mean Difference (IV, Fixed, 95% CI) | Subtotals only | |
| 1.1 1 to 4 weeks post‐injection | 1 | 40 | Mean Difference (IV, Fixed, 95% CI) | ‐0.60 [‐11.52, 10.32] |
| 1.2 5 to 13 weeks post‐injection | 1 | 40 | Mean Difference (IV, Fixed, 95% CI) | 8.90 [‐2.40, 20.20] |
| 1.3 14 to 26 weeks post‐injection | 1 | 40 | Mean Difference (IV, Fixed, 95% CI) | 17.70 [3.70, 31.70] |
| 1.4 37 weeks post‐injection | 1 | 40 | Mean Difference (IV, Fixed, 95% CI) | 1.50 [‐11.15, 14.15] |
| 1.5 45 to 52 weeks post‐injection | 1 | 40 | Mean Difference (IV, Fixed, 95% CI) | ‐2.80 [‐16.51, 10.91] |
| 2 WOMAC pain | 1 | Mean Difference (IV, Fixed, 95% CI) | Subtotals only | |
| 2.1 1 to 4 weeks post‐injection | 1 | 40 | Mean Difference (IV, Fixed, 95% CI) | ‐2.0 [‐3.61, ‐0.39] |
| 2.2 5 to 13 weeks post‐injection | 1 | 40 | Mean Difference (IV, Fixed, 95% CI) | ‐0.60 [‐2.15, 0.95] |
| 2.3 14 to 26 weeks post‐injection | 1 | 40 | Mean Difference (IV, Fixed, 95% CI) | 0.60 [‐1.91, 3.11] |
| 2.4 37 weeks post‐injection | 1 | 40 | Mean Difference (IV, Fixed, 95% CI) | ‐1.90 [‐4.08, 0.28] |
| 2.5 45 to 52 weeks post‐injection | 1 | 40 | Mean Difference (IV, Fixed, 95% CI) | ‐4.30 [‐6.66, ‐1.94] |
| 3 WOMAC physical function | 1 | Mean Difference (IV, Fixed, 95% CI) | Subtotals only | |
| 3.1 1 to 4 weeks post‐injection | 1 | 40 | Mean Difference (IV, Fixed, 95% CI) | ‐2.40 [‐9.91, 5.11] |
| 3.2 5 to 13 weeks post‐injection | 1 | 40 | Mean Difference (IV, Fixed, 95% CI) | ‐2.70 [‐10.59, 5.19] |
| 3.3 14 to 26 weeks post‐injection | 1 | 40 | Mean Difference (IV, Fixed, 95% CI) | ‐0.10 [‐9.02, 8.82] |
| 3.4 37 weeks post‐injection | 1 | 40 | Mean Difference (IV, Fixed, 95% CI) | 1.40 [‐5.98, 8.78] |
| 3.5 45 to 52 weeks post‐injection | 1 | 40 | Mean Difference (IV, Fixed, 95% CI) | ‐0.60 [‐8.73, 7.53] |
| 4 SF‐36 pain | 1 | Mean Difference (IV, Fixed, 95% CI) | Subtotals only | |
| 4.1 1 to 4 weeks post‐injection | 1 | 40 | Mean Difference (IV, Fixed, 95% CI) | ‐11.60 [‐23.79, 0.59] |
| 4.2 5 to 13 weeks post‐injection | 1 | 40 | Mean Difference (IV, Fixed, 95% CI) | ‐28.20 [‐38.98, ‐17.42] |
| 4.3 14 to 26 weeks post‐injection | 1 | 40 | Mean Difference (IV, Fixed, 95% CI) | ‐18.70 [‐31.67, ‐5.73] |
| 4.4 37 weeks post‐injection | 1 | 40 | Mean Difference (IV, Fixed, 95% CI) | ‐6.0 [‐15.77, 3.77] |
| 4.5 45 to 52 weeks post‐injection | 1 | 40 | Mean Difference (IV, Fixed, 95% CI) | ‐12.5 [‐25.03, 0.03] |
| 5 SF‐36 physical functioning | 1 | Mean Difference (IV, Fixed, 95% CI) | Subtotals only | |
| 5.1 1 to 4 weeks post‐injection | 1 | 40 | Mean Difference (IV, Fixed, 95% CI) | 0.5 [‐11.73, 12.73] |
| 5.2 5 to 13 weeks post‐injection | 1 | 40 | Mean Difference (IV, Fixed, 95% CI) | ‐12.0 [‐23.25, ‐0.75] |
| 5.3 14 to 26 weeks post‐injection | 1 | 40 | Mean Difference (IV, Fixed, 95% CI) | ‐9.5 [‐23.39, 4.39] |
| 5.4 37 weeks post‐injection | 1 | 40 | Mean Difference (IV, Fixed, 95% CI) | 0.0 [‐11.50, 11.50] |
| 5.5 45 to 52 weeks post‐injection | 1 | 40 | Mean Difference (IV, Fixed, 95% CI) | ‐22.0 [‐33.76, ‐10.24] |
39.1. Analysis.

Comparison 39 Orthovisc versus physical therapy, Outcome 1 Spontaneous pain (0‐100 mm VAS).
39.2. Analysis.
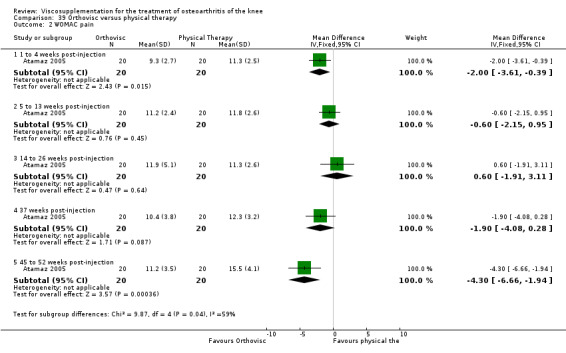
Comparison 39 Orthovisc versus physical therapy, Outcome 2 WOMAC pain.
39.3. Analysis.
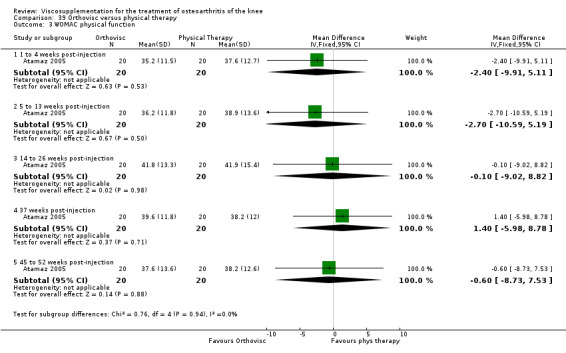
Comparison 39 Orthovisc versus physical therapy, Outcome 3 WOMAC physical function.
39.4. Analysis.

Comparison 39 Orthovisc versus physical therapy, Outcome 4 SF‐36 pain.
39.5. Analysis.
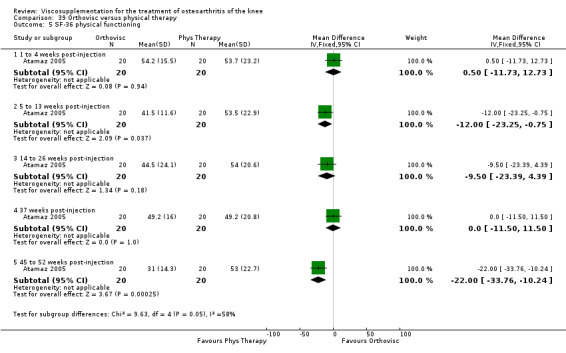
Comparison 39 Orthovisc versus physical therapy, Outcome 5 SF‐36 physical functioning.
Comparison 40. (Orthovisc + physiotherapy) versus physiotherapy.
| Outcome or subgroup title | No. of studies | No. of participants | Statistical method | Effect size |
|---|---|---|---|---|
| 1 Activity pain (0‐100 mm VAS) | 1 | Mean Difference (IV, Fixed, 95% CI) | Subtotals only | |
| 1.1 1 to 4 weeks post‐injection | 1 | 40 | Mean Difference (IV, Fixed, 95% CI) | ‐1.70 [‐7.22, 3.82] |
| 1.2 5 to 13 weeks post‐injection | 1 | 40 | Mean Difference (IV, Fixed, 95% CI) | ‐6.5 [‐11.93, ‐1.07] |
| 2 Spontaneous pain (0‐100 mm VAS) | 1 | Mean Difference (IV, Fixed, 95% CI) | Subtotals only | |
| 2.1 1 to 4 weeks post‐injection | 1 | 40 | Mean Difference (IV, Fixed, 95% CI) | 0.40 [‐3.23, 4.03] |
| 2.2 5 to 13 weeks post‐injection | 1 | 40 | Mean Difference (IV, Fixed, 95% CI) | ‐4.1 [‐7.43, ‐0.77] |
| 3 Night pain (0‐100 mm VAS) | 1 | Mean Difference (IV, Fixed, 95% CI) | Subtotals only | |
| 3.1 1 to 4 weeks post‐injection | 1 | 40 | Mean Difference (IV, Fixed, 95% CI) | ‐0.20 [‐4.35, 3.95] |
| 3.2 5 to 13 weeks post‐injection | 1 | 40 | Mean Difference (IV, Fixed, 95% CI) | ‐3.30 [‐6.83, 0.23] |
| 4 Lequesne (0‐24) | 1 | Mean Difference (IV, Fixed, 95% CI) | Subtotals only | |
| 4.1 End of treatment | 1 | 25 | Mean Difference (IV, Fixed, 95% CI) | ‐0.20 [‐2.98, 2.58] |
| 4.2 5 to 13 weeks post‐injection | 1 | 25 | Mean Difference (IV, Fixed, 95% CI) | ‐1.80 [‐5.14, 1.54] |
| 5 25 m walk time (sec) | 1 | Mean Difference (IV, Fixed, 95% CI) | Subtotals only | |
| 5.1 1 to 4 weeks post‐injection | 1 | 40 | Mean Difference (IV, Fixed, 95% CI) | 0.75 [‐1.09, 2.59] |
| 5.2 5 to 13 weeks post‐injection | 1 | 40 | Mean Difference (IV, Fixed, 95% CI) | ‐1.15 [‐2.83, 0.53] |
| 6 Flexion (degrees) | 1 | Mean Difference (IV, Fixed, 95% CI) | Subtotals only | |
| 6.1 1 to 4 weeks post ‐injection | 1 | 40 | Mean Difference (IV, Fixed, 95% CI) | 0.0 [0.0, 0.0] |
| 6.2 5 to 13 weeks post‐injection | 1 | 40 | Mean Difference (IV, Fixed, 95% CI) | 0.0 [0.0, 0.0] |
| 7 Patient global assessment (number of patients evaluating treatment as effective or very effective) | 1 | Risk Ratio (M‐H, Fixed, 95% CI) | Subtotals only | |
| 7.1 5 to 13 weeks post‐injection | 1 | 40 | Risk Ratio (M‐H, Fixed, 95% CI) | 1.58 [1.09, 2.30] |
| 8 Safety: total withdrawals overall | 2 | Risk Ratio (M‐H, Fixed, 95% CI) | Subtotals only | |
| 8.1 5 to 13 weeks post‐injection | 2 | 71 | Risk Ratio (M‐H, Fixed, 95% CI) | 0.07 [0.00, 1.18] |
| 9 Safety: number of patients with local reactions | 2 | Risk Ratio (M‐H, Fixed, 95% CI) | Subtotals only | |
| 9.1 End of treatment | 1 | 25 | Risk Ratio (M‐H, Fixed, 95% CI) | 0.0 [0.0, 0.0] |
| 9.2 1 to 4 weeks post‐injection | 1 | 40 | Risk Ratio (M‐H, Fixed, 95% CI) | 5.0 [0.26, 98.00] |
| 10 Safety: number of patients withdrawn due to adverse events | 2 | Risk Ratio (M‐H, Fixed, 95% CI) | Subtotals only | |
| 10.1 End of treatment | 1 | 25 | Risk Ratio (M‐H, Fixed, 95% CI) | 0.0 [0.0, 0.0] |
| 10.2 5 to 13 weeks post‐injection | 1 | 40 | Risk Ratio (M‐H, Fixed, 95% CI) | 0.0 [0.0, 0.0] |
| 11 Safety: number of patients with systemic adverse events | 2 | Risk Ratio (M‐H, Fixed, 95% CI) | Subtotals only | |
| 11.1 End of treatment | 1 | 25 | Risk Ratio (M‐H, Fixed, 95% CI) | 0.0 [0.0, 0.0] |
| 11.2 5 to 13 weeks post‐injection | 1 | 40 | Risk Ratio (M‐H, Fixed, 95% CI) | 0.0 [0.0, 0.0] |
40.1. Analysis.
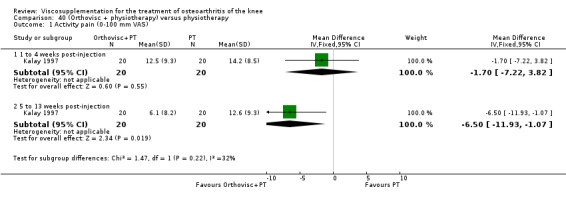
Comparison 40 (Orthovisc + physiotherapy) versus physiotherapy, Outcome 1 Activity pain (0‐100 mm VAS).
40.2. Analysis.
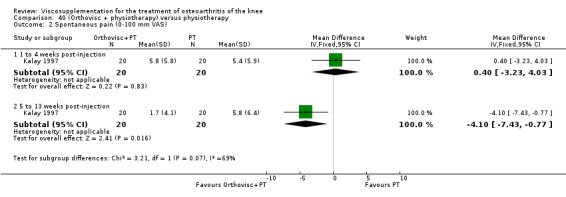
Comparison 40 (Orthovisc + physiotherapy) versus physiotherapy, Outcome 2 Spontaneous pain (0‐100 mm VAS).
40.3. Analysis.
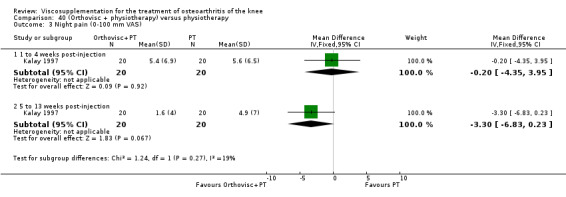
Comparison 40 (Orthovisc + physiotherapy) versus physiotherapy, Outcome 3 Night pain (0‐100 mm VAS).
40.4. Analysis.

Comparison 40 (Orthovisc + physiotherapy) versus physiotherapy, Outcome 4 Lequesne (0‐24).
40.5. Analysis.
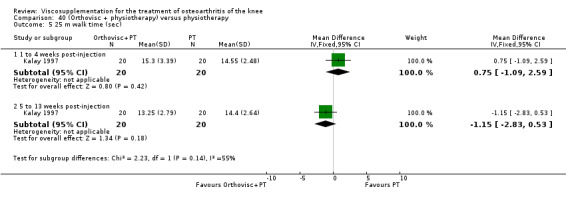
Comparison 40 (Orthovisc + physiotherapy) versus physiotherapy, Outcome 5 25 m walk time (sec).
40.6. Analysis.
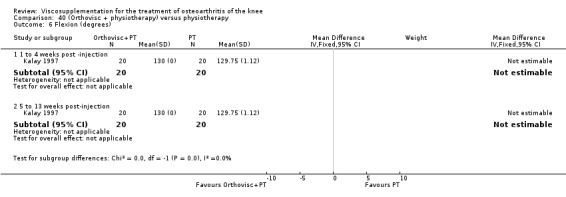
Comparison 40 (Orthovisc + physiotherapy) versus physiotherapy, Outcome 6 Flexion (degrees).
40.7. Analysis.
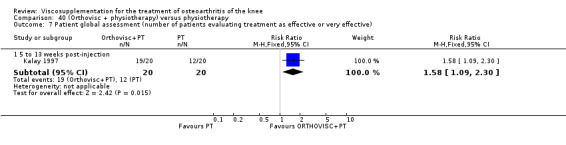
Comparison 40 (Orthovisc + physiotherapy) versus physiotherapy, Outcome 7 Patient global assessment (number of patients evaluating treatment as effective or very effective).
40.8. Analysis.
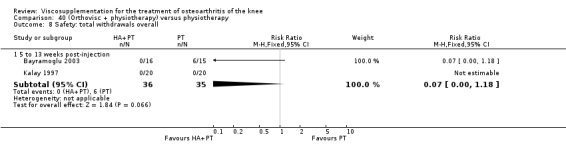
Comparison 40 (Orthovisc + physiotherapy) versus physiotherapy, Outcome 8 Safety: total withdrawals overall.
40.9. Analysis.
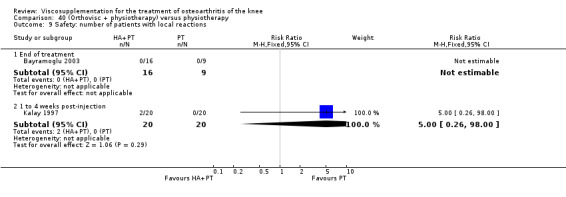
Comparison 40 (Orthovisc + physiotherapy) versus physiotherapy, Outcome 9 Safety: number of patients with local reactions.
40.10. Analysis.
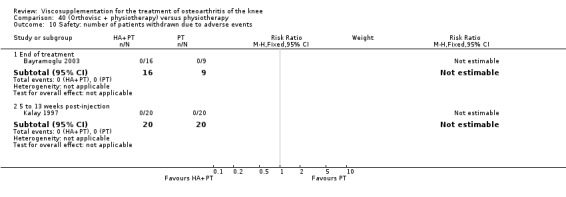
Comparison 40 (Orthovisc + physiotherapy) versus physiotherapy, Outcome 10 Safety: number of patients withdrawn due to adverse events.
40.11. Analysis.
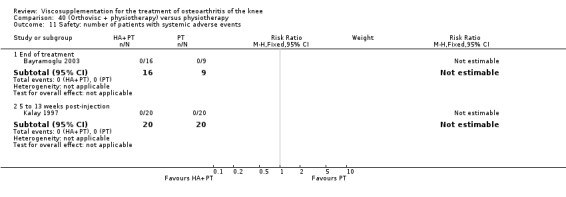
Comparison 40 (Orthovisc + physiotherapy) versus physiotherapy, Outcome 11 Safety: number of patients with systemic adverse events.
Comparison 41. (Orthovisc + physiotherapy) versus (Hylan G‐F 20 + physiotherapy).
| Outcome or subgroup title | No. of studies | No. of participants | Statistical method | Effect size |
|---|---|---|---|---|
| 1 Lequesne Index (0‐24) | 1 | Mean Difference (IV, Fixed, 95% CI) | Subtotals only | |
| 1.1 End of treatment | 1 | 28 | Mean Difference (IV, Fixed, 95% CI) | 0.5 [‐1.58, 2.58] |
| 1.2 5 to 13 weeks post‐injection | 1 | 28 | Mean Difference (IV, Fixed, 95% CI) | ‐1.0 [‐3.30, 1.30] |
41.1. Analysis.
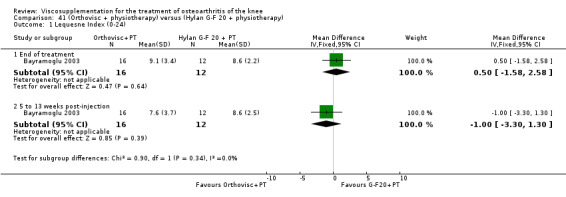
Comparison 41 (Orthovisc + physiotherapy) versus (Hylan G‐F 20 + physiotherapy), Outcome 1 Lequesne Index (0‐24).
Comparison 42. Orthovisc versus hylan G‐F 20.
| Outcome or subgroup title | No. of studies | No. of participants | Statistical method | Effect size |
|---|---|---|---|---|
| 1 WOMAC pain (0‐20 or 5‐25 Likert) | 3 | Std. Mean Difference (IV, Fixed, 95% CI) | Subtotals only | |
| 1.1 1 to 4 weeks post‐injection | 3 | 121 | Std. Mean Difference (IV, Fixed, 95% CI) | 0.07 [‐0.29, 0.43] |
| 1.2 5 to 13 weeks post‐injection | 2 | 81 | Std. Mean Difference (IV, Fixed, 95% CI) | 0.28 [‐0.16, 0.73] |
| 1.3 14 to 26 weeks post‐injection | 2 | 81 | Std. Mean Difference (IV, Fixed, 95% CI) | 0.14 [‐0.29, 0.58] |
| 1.4 37 weeks post‐injection | 1 | 40 | Std. Mean Difference (IV, Fixed, 95% CI) | 0.0 [‐0.62, 0.62] |
| 1.5 45 to 52 weeks post‐injection | 1 | 40 | Std. Mean Difference (IV, Fixed, 95% CI) | 0.30 [‐0.32, 0.93] |
| 2 Spontaneous pain (0‐100 mm VAS) | 1 | Mean Difference (IV, Fixed, 95% CI) | Subtotals only | |
| 2.1 1 to 4 weeks post‐injection | 1 | 40 | Mean Difference (IV, Fixed, 95% CI) | ‐21.1 [‐33.08, ‐9.12] |
| 2.2 5 to 13 weeks post‐injection | 1 | 40 | Mean Difference (IV, Fixed, 95% CI) | 12.90 [0.85, 24.95] |
| 2.3 14 to 26 weeks post‐injection | 1 | 40 | Mean Difference (IV, Fixed, 95% CI) | 15.5 [0.80, 30.20] |
| 2.4 37 weeks post‐injection | 1 | 40 | Mean Difference (IV, Fixed, 95% CI) | 0.5 [‐11.67, 12.67] |
| 2.5 45 to 52 weeks post‐injection | 1 | 40 | Mean Difference (IV, Fixed, 95% CI) | 7.70 [‐3.94, 19.34] |
| 3 SF‐36 pain | 1 | Mean Difference (IV, Fixed, 95% CI) | Subtotals only | |
| 3.1 1 to 4 weeks post‐injection | 1 | 40 | Mean Difference (IV, Fixed, 95% CI) | ‐11.90 [‐25.49, 1.69] |
| 3.2 5 to 13 weeks post‐injection | 1 | 40 | Mean Difference (IV, Fixed, 95% CI) | ‐30.80 [‐43.03, ‐18.57] |
| 3.3 14 to 26 weeks post‐injection | 1 | 40 | Mean Difference (IV, Fixed, 95% CI) | ‐19.80 [‐35.52, ‐4.08] |
| 3.4 37 weeks post‐injection | 1 | 40 | Mean Difference (IV, Fixed, 95% CI) | 1.5 [‐7.67, 10.67] |
| 3.5 45 to 52 weeks post‐injection | 1 | 40 | Mean Difference (IV, Fixed, 95% CI) | ‐9.0 [‐21.67, 3.67] |
| 4 Hospital for Special Surgery Knee Score | 1 | Mean Difference (IV, Fixed, 95% CI) | Subtotals only | |
| 4.1 1 to 4 weeks post‐injection | 1 | 79 | Mean Difference (IV, Fixed, 95% CI) | ‐0.20 [‐4.04, 3.64] |
| 4.2 5 to 13 weeks post‐injection | 1 | 73 | Mean Difference (IV, Fixed, 95% CI) | 1.0 [‐3.04, 5.04] |
| 4.3 14 to 26 weeks post‐injection | 1 | 71 | Mean Difference (IV, Fixed, 95% CI) | ‐1.0 [‐5.65, 3.65] |
| 4.4 45 to 52 weeks post‐injection | 1 | 62 | Mean Difference (IV, Fixed, 95% CI) | ‐0.10 [‐5.99, 5.79] |
| 5 Pain during activity (Hospital for Special Surgery) | 1 | Mean Difference (IV, Fixed, 95% CI) | Subtotals only | |
| 5.1 1 to 4 weeks post‐injection | 1 | 79 | Mean Difference (IV, Fixed, 95% CI) | 0.0 [‐1.71, 1.71] |
| 5.2 5 to 13 weeks post‐injection | 1 | 73 | Mean Difference (IV, Fixed, 95% CI) | 1.0 [‐0.79, 2.79] |
| 5.3 14 to 26 weeks post‐injection | 1 | 71 | Mean Difference (IV, Fixed, 95% CI) | ‐0.10 [‐2.08, 1.88] |
| 5.4 45 to 52 weeks post‐injection | 1 | 62 | Mean Difference (IV, Fixed, 95% CI) | ‐0.30 [‐2.89, 2.29] |
| 6 Pain at rest (Hospital for Special Surgery) | 1 | Mean Difference (IV, Fixed, 95% CI) | Subtotals only | |
| 6.1 1 to 4 weeks post‐injection | 1 | 79 | Mean Difference (IV, Fixed, 95% CI) | 1.10 [0.01, 2.19] |
| 6.2 5 to 13 weeks post‐injection | 1 | 73 | Mean Difference (IV, Fixed, 95% CI) | 0.20 [‐1.15, 1.55] |
| 6.3 14 to 26 weeks post‐injection | 1 | 71 | Mean Difference (IV, Fixed, 95% CI) | ‐0.30 [‐1.75, 1.15] |
| 6.4 45 to 52 weeks post‐injection | 1 | 62 | Mean Difference (IV, Fixed, 95% CI) | 0.30 [‐1.48, 2.08] |
| 7 Pain during climbing stairs (Hospital for Special Surgery) | 1 | Mean Difference (IV, Fixed, 95% CI) | Subtotals only | |
| 7.1 1 to 4 weeks post‐injection | 1 | 79 | Mean Difference (IV, Fixed, 95% CI) | 0.0 [‐0.66, 0.66] |
| 7.2 5 to 13 weeks post‐injection | 1 | 73 | Mean Difference (IV, Fixed, 95% CI) | ‐0.10 [‐0.79, 0.59] |
| 7.3 14 to 26 weeks post‐injection | 1 | 71 | Mean Difference (IV, Fixed, 95% CI) | ‐0.10 [‐0.75, 0.55] |
| 7.4 45 to 52 weeks post‐injection | 1 | 62 | Mean Difference (IV, Fixed, 95% CI) | ‐0.40 [‐1.10, 0.30] |
| 8 Pain during transfer activity (Hospital for Special Surgery) | 1 | Mean Difference (IV, Fixed, 95% CI) | Subtotals only | |
| 8.1 1 to 4 weeks post‐injection | 1 | 79 | Mean Difference (IV, Fixed, 95% CI) | ‐0.20 [‐0.80, 0.40] |
| 8.2 5 to 13 weeks post‐injection | 1 | 73 | Mean Difference (IV, Fixed, 95% CI) | 0.40 [‐0.16, 0.96] |
| 8.3 14 to 26 weeks post‐injection | 1 | 71 | Mean Difference (IV, Fixed, 95% CI) | 0.10 [‐0.55, 0.75] |
| 8.4 45 to 52 weeks post‐injection | 1 | 62 | Mean Difference (IV, Fixed, 95% CI) | 0.20 [‐0.47, 0.87] |
| 9 WOMAC physical function (0‐68 or 17‐85 Likert) | 3 | Std. Mean Difference (IV, Fixed, 95% CI) | Subtotals only | |
| 9.1 1 to 4 weeks post‐injection | 3 | 121 | Std. Mean Difference (IV, Fixed, 95% CI) | 0.07 [‐0.29, 0.43] |
| 9.2 5 to 13 weeks post‐injection | 2 | 81 | Std. Mean Difference (IV, Fixed, 95% CI) | ‐0.13 [‐0.57, 0.31] |
| 9.3 14 to 26 weeks post‐injection | 2 | 81 | Std. Mean Difference (IV, Fixed, 95% CI) | 0.16 [‐0.28, 0.60] |
| 9.4 37 weeks post‐injection | 1 | 40 | Std. Mean Difference (IV, Fixed, 95% CI) | 0.08 [‐0.54, 0.70] |
| 9.5 45 to 52 weeks post‐injection | 1 | 40 | Std. Mean Difference (IV, Fixed, 95% CI) | ‐0.10 [‐0.72, 0.52] |
| 10 SF‐36 physical functioning | 1 | Mean Difference (IV, Fixed, 95% CI) | Subtotals only | |
| 10.1 1 to 4 weeks post‐injection | 1 | 40 | Mean Difference (IV, Fixed, 95% CI) | ‐1.00 [‐16.53, 10.53] |
| 10.2 5 to 13 weeks post‐injection | 1 | 40 | Mean Difference (IV, Fixed, 95% CI) | ‐20.20 [‐29.47, ‐10.93] |
| 10.3 14 to 26 weeks post‐injection | 1 | 40 | Mean Difference (IV, Fixed, 95% CI) | ‐11.20 [‐27.49, 5.09] |
| 10.4 37 weeks post‐injection | 1 | 40 | Mean Difference (IV, Fixed, 95% CI) | 4.20 [‐7.51, 15.91] |
| 10.5 45 to 52 weeks post‐injection | 1 | 40 | Mean Difference (IV, Fixed, 95% CI) | ‐21.00 [‐35.97, ‐10.03] |
| 11 Range of motion (degrees) | 1 | Mean Difference (IV, Fixed, 95% CI) | Subtotals only | |
| 11.1 1 to 4 weeks post‐injection | 1 | 79 | Mean Difference (IV, Fixed, 95% CI) | 2.40 [‐2.69, 7.49] |
| 11.2 5 to 13 weeks post‐injection | 1 | 73 | Mean Difference (IV, Fixed, 95% CI) | 0.90 [‐2.87, 4.67] |
| 11.3 14 to 26 weeks post‐injection | 1 | 71 | Mean Difference (IV, Fixed, 95% CI) | ‐1.80 [‐6.48, 2.88] |
| 11.4 45 to 52 weeks post‐injection | 1 | 62 | Mean Difference (IV, Fixed, 95% CI) | 0.70 [‐4.52, 5.92] |
| 12 Walking distance | 1 | Mean Difference (IV, Fixed, 95% CI) | Subtotals only | |
| 12.1 1 to 4 weeks post‐injection | 1 | 79 | Mean Difference (IV, Fixed, 95% CI) | ‐1.20 [‐2.49, 0.09] |
| 12.2 5 to 13 weeks post‐injection | 1 | 73 | Mean Difference (IV, Fixed, 95% CI) | ‐0.90 [‐2.11, 0.31] |
| 12.3 14 to 26 weeks post‐injection | 1 | 71 | Mean Difference (IV, Fixed, 95% CI) | ‐0.90 [‐2.07, 0.27] |
| 12.4 45 to 52 weeks post‐injection | 1 | 62 | Mean Difference (IV, Fixed, 95% CI) | ‐0.60 [‐1.92, 0.72] |
| 13 Patient global assessment (0‐100 mm VAS where 100 is worst severity) | 1 | Mean Difference (IV, Fixed, 95% CI) | Subtotals only | |
| 13.1 1 to 4 weeks post‐injection | 1 | 41 | Mean Difference (IV, Fixed, 95% CI) | 0.0 [‐8.27, 8.27] |
| 13.2 5 to 13 weeks post‐injection | 1 | 41 | Mean Difference (IV, Fixed, 95% CI) | 0.0 [‐7.41, 7.41] |
| 13.3 14 to 26 weeks post‐injection | 1 | 41 | Mean Difference (IV, Fixed, 95% CI) | 0.0 [‐9.86, 9.86] |
| 14 Physician global assessment (0‐100 mm VAS where 100 is worst severity) | 1 | Mean Difference (IV, Fixed, 95% CI) | Subtotals only | |
| 14.1 1 to 4 weeks post‐injection | 1 | 41 | Mean Difference (IV, Fixed, 95% CI) | 20.0 [7.27, 32.73] |
| 14.2 5 to 13 weeks post‐injection | 1 | 41 | Mean Difference (IV, Fixed, 95% CI) | 20.00 [8.06, 31.94] |
| 14.3 14 to 26 weeks post‐injection | 1 | 41 | Mean Difference (IV, Fixed, 95% CI) | 0.0 [‐11.12, 11.12] |
| 15 WOMAC stiffness (0‐8 or 2‐10 Likert) | 2 | Std. Mean Difference (IV, Fixed, 95% CI) | Subtotals only | |
| 15.1 1 to 4 weeks post‐injection | 2 | 81 | Std. Mean Difference (IV, Fixed, 95% CI) | ‐0.01 [‐0.45, 0.43] |
| 15.2 5 to 13 weeks post‐injection | 1 | 41 | Std. Mean Difference (IV, Fixed, 95% CI) | ‐0.34 [‐0.96, 0.27] |
| 15.3 14 to 26 weeks post‐injection | 1 | 41 | Std. Mean Difference (IV, Fixed, 95% CI) | ‐0.47 [‐1.09, 0.15] |
| 16 Synovial fluid intercellular adhesion molecule‐1 (ICAM‐1) | 1 | Mean Difference (IV, Fixed, 95% CI) | Subtotals only | |
| 16.1 1 to 4 weeks post‐injection | 1 | 40 | Mean Difference (IV, Fixed, 95% CI) | ‐0.60 [‐5.67, 4.47] |
| 17 Synovial fluid vascular cell adhesion molecule‐1 (VCAM‐1) | 1 | Mean Difference (IV, Fixed, 95% CI) | Subtotals only | |
| 17.1 1 to 4 weeks post‐injection | 1 | 40 | Mean Difference (IV, Fixed, 95% CI) | ‐3.0 [‐10.23, 4.23] |
| 18 Safety: total withdrawals overall | 2 | Risk Ratio (M‐H, Fixed, 95% CI) | Subtotals only | |
| 19 Safety: withdrawals due to lack of efficacy | 1 | Risk Ratio (M‐H, Fixed, 95% CI) | Subtotals only | |
| 20 Safety: number of patients with local adverse event | 2 | Risk Ratio (M‐H, Fixed, 95% CI) | Subtotals only | |
| 21 Safety: withdrawals due to noncompliance | 1 | Risk Ratio (M‐H, Fixed, 95% CI) | Subtotals only |
42.1. Analysis.
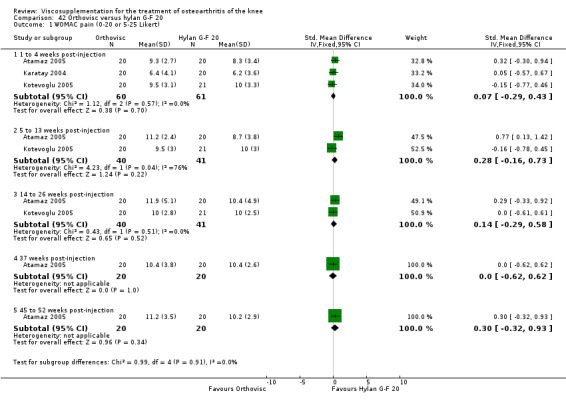
Comparison 42 Orthovisc versus hylan G‐F 20, Outcome 1 WOMAC pain (0‐20 or 5‐25 Likert).
42.2. Analysis.
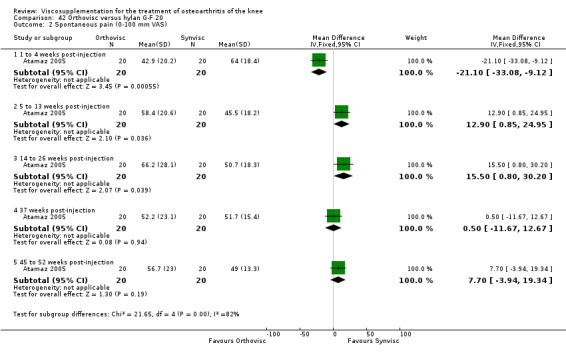
Comparison 42 Orthovisc versus hylan G‐F 20, Outcome 2 Spontaneous pain (0‐100 mm VAS).
42.3. Analysis.
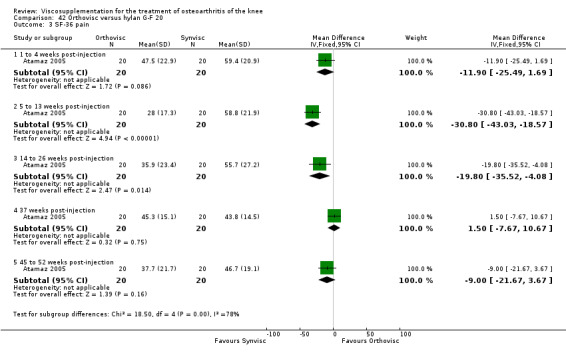
Comparison 42 Orthovisc versus hylan G‐F 20, Outcome 3 SF‐36 pain.
42.4. Analysis.
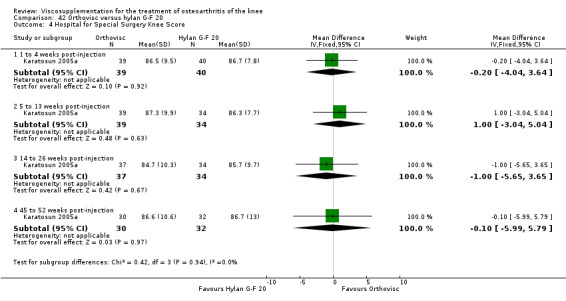
Comparison 42 Orthovisc versus hylan G‐F 20, Outcome 4 Hospital for Special Surgery Knee Score.
42.5. Analysis.
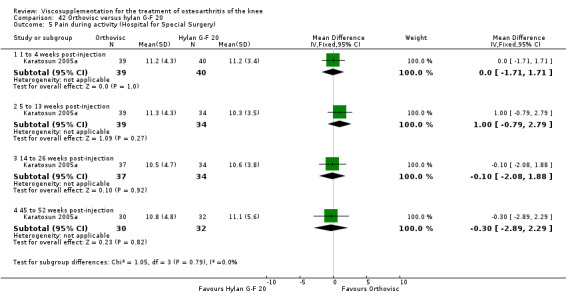
Comparison 42 Orthovisc versus hylan G‐F 20, Outcome 5 Pain during activity (Hospital for Special Surgery).
42.6. Analysis.
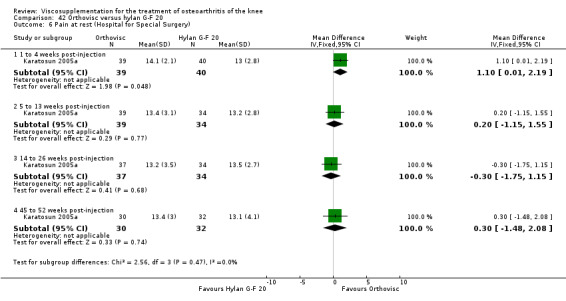
Comparison 42 Orthovisc versus hylan G‐F 20, Outcome 6 Pain at rest (Hospital for Special Surgery).
42.7. Analysis.

Comparison 42 Orthovisc versus hylan G‐F 20, Outcome 7 Pain during climbing stairs (Hospital for Special Surgery).
42.8. Analysis.
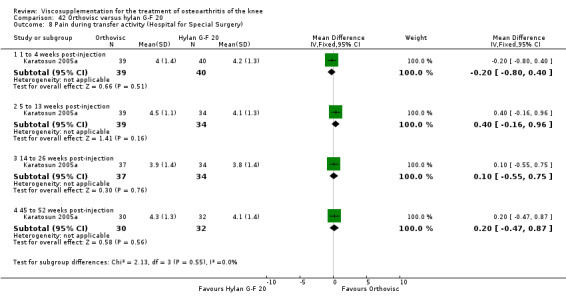
Comparison 42 Orthovisc versus hylan G‐F 20, Outcome 8 Pain during transfer activity (Hospital for Special Surgery).
42.9. Analysis.
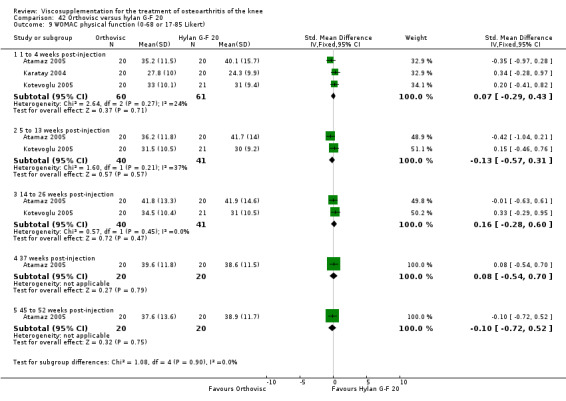
Comparison 42 Orthovisc versus hylan G‐F 20, Outcome 9 WOMAC physical function (0‐68 or 17‐85 Likert).
42.10. Analysis.

Comparison 42 Orthovisc versus hylan G‐F 20, Outcome 10 SF‐36 physical functioning.
42.11. Analysis.
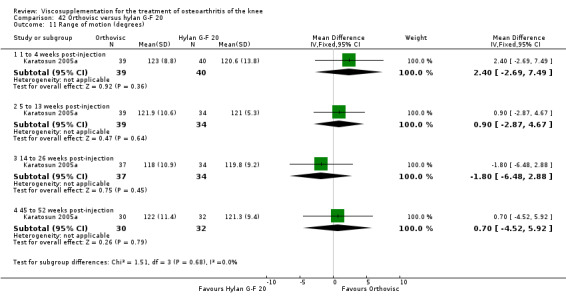
Comparison 42 Orthovisc versus hylan G‐F 20, Outcome 11 Range of motion (degrees).
42.12. Analysis.

Comparison 42 Orthovisc versus hylan G‐F 20, Outcome 12 Walking distance.
42.13. Analysis.
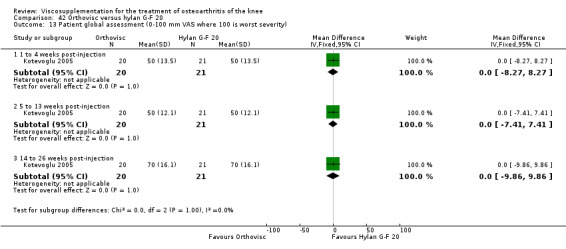
Comparison 42 Orthovisc versus hylan G‐F 20, Outcome 13 Patient global assessment (0‐100 mm VAS where 100 is worst severity).
42.14. Analysis.

Comparison 42 Orthovisc versus hylan G‐F 20, Outcome 14 Physician global assessment (0‐100 mm VAS where 100 is worst severity).
42.15. Analysis.
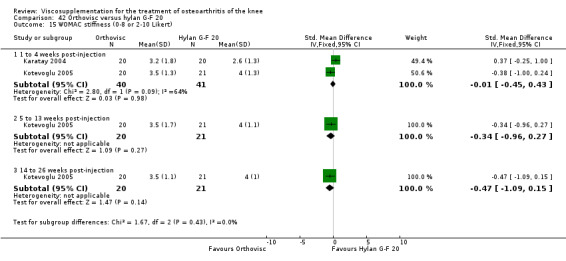
Comparison 42 Orthovisc versus hylan G‐F 20, Outcome 15 WOMAC stiffness (0‐8 or 2‐10 Likert).
42.16. Analysis.
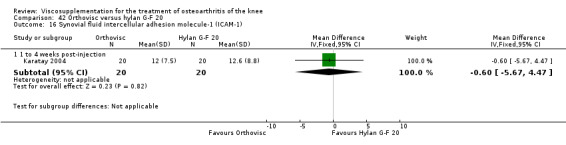
Comparison 42 Orthovisc versus hylan G‐F 20, Outcome 16 Synovial fluid intercellular adhesion molecule‐1 (ICAM‐1).
42.17. Analysis.

Comparison 42 Orthovisc versus hylan G‐F 20, Outcome 17 Synovial fluid vascular cell adhesion molecule‐1 (VCAM‐1).
42.18. Analysis.
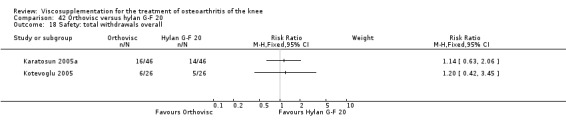
Comparison 42 Orthovisc versus hylan G‐F 20, Outcome 18 Safety: total withdrawals overall.
42.19. Analysis.
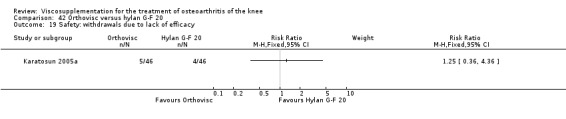
Comparison 42 Orthovisc versus hylan G‐F 20, Outcome 19 Safety: withdrawals due to lack of efficacy.
42.20. Analysis.

Comparison 42 Orthovisc versus hylan G‐F 20, Outcome 20 Safety: number of patients with local adverse event.
42.21. Analysis.
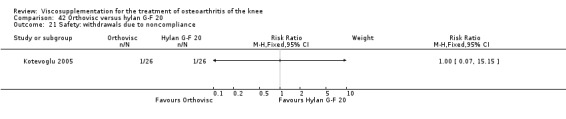
Comparison 42 Orthovisc versus hylan G‐F 20, Outcome 21 Safety: withdrawals due to noncompliance.
Comparison 43. Orthovisc versus Orthovisc.
| Outcome or subgroup title | No. of studies | No. of participants | Statistical method | Effect size |
|---|---|---|---|---|
| 1 WOMAC total score (0 to 100 mm VAS; change from baseline) | 1 | Mean Difference (IV, Fixed, 95% CI) | Subtotals only | |
| 1.1 5 to 13 weeks post‐injection | 1 | 222 | Mean Difference (IV, Fixed, 95% CI) | ‐24.40 [‐56.32, 7.52] |
| 1.2 14 to 26 weeks post‐injection | 1 | 222 | Mean Difference (IV, Fixed, 95% CI) | ‐15.30 [‐47.95, 17.35] |
| 2 Patient global assessment (0 to 100 mm VAS; change from baseline) | 1 | Mean Difference (IV, Fixed, 95% CI) | Subtotals only | |
| 2.1 5 to 13 weeks post‐injection | 1 | 222 | Mean Difference (IV, Fixed, 95% CI) | ‐8.80 [‐16.61, ‐0.99] |
| 2.2 14 to 26 weeks post‐injection | 1 | 222 | Mean Difference (IV, Fixed, 95% CI) | ‐7.30 [‐15.17, 0.57] |
| 3 Physician global assessment (0 to 100 mm VAS; change from baseline) | 1 | Mean Difference (IV, Fixed, 95% CI) | Subtotals only | |
| 3.1 5 to 13 weeks post‐injection | 1 | 222 | Mean Difference (IV, Fixed, 95% CI) | ‐2.40 [‐8.47, 3.67] |
| 3.2 14 to 26 weeks post‐injection | 1 | 222 | Mean Difference (IV, Fixed, 95% CI) | ‐3.40 [‐10.06, 3.26] |
| 4 WOMAC pain on standing (0 to 100 mm VAS; change from baseline) | 1 | Mean Difference (IV, Fixed, 95% CI) | Subtotals only | |
| 4.1 5 to 13 weeks post‐injection | 1 | 194 | Mean Difference (IV, Fixed, 95% CI) | ‐7.5 [‐15.98, 0.98] |
| 4.2 14 to 26 weeks post‐injection | 1 | 194 | Mean Difference (IV, Fixed, 95% CI) | ‐4.0 [‐12.68, 4.68] |
| 5 Number of patients with a 20% improvement from baseline in WOMAC pain score | 1 | Risk Ratio (M‐H, Fixed, 95% CI) | Subtotals only | |
| 5.1 5 to 13 weeks post‐injection | 1 | 194 | Risk Ratio (M‐H, Fixed, 95% CI) | 1.26 [1.07, 1.49] |
| 5.2 14 to 26 weeks post‐injection | 1 | 194 | Risk Ratio (M‐H, Fixed, 95% CI) | 1.06 [0.87, 1.29] |
| 6 Number of patients with a 40% improvement from baseline in WOMAC pain score | 1 | Risk Ratio (M‐H, Fixed, 95% CI) | Subtotals only | |
| 6.1 5 to 13 weeks post‐injection | 1 | 194 | Risk Ratio (M‐H, Fixed, 95% CI) | 1.24 [0.98, 1.56] |
| 6.2 14 to 26 weeks post‐injection | 1 | 194 | Risk Ratio (M‐H, Fixed, 95% CI) | 1.19 [0.92, 1.55] |
| 7 Number of patients with a 50% improvement from baseline in WOMAC pain score | 1 | Risk Ratio (M‐H, Fixed, 95% CI) | Subtotals only | |
| 7.1 5 to 13 weeks post‐injection | 1 | 194 | Risk Ratio (M‐H, Fixed, 95% CI) | 1.24 [0.94, 1.63] |
| 7.2 14 to 26 weeks post‐injection | 1 | 194 | Risk Ratio (M‐H, Fixed, 95% CI) | 1.25 [0.93, 1.69] |
| 8 Safety: total withdrawals overall | 1 | Risk Ratio (M‐H, Fixed, 95% CI) | Subtotals only | |
| 9 Safety: total withdrawals due to lack of efficacy | 1 | Risk Ratio (M‐H, Fixed, 95% CI) | Subtotals only | |
| 10 Safety: number of patients reporting adverse events | 1 | Risk Ratio (M‐H, Fixed, 95% CI) | Subtotals only | |
| 11 Safety: number of patients with gastrointestinal adverse events | 1 | Risk Ratio (M‐H, Fixed, 95% CI) | Subtotals only | |
| 12 Safety: number of patients with general body adverse events | 1 | Risk Ratio (M‐H, Fixed, 95% CI) | Subtotals only | |
| 13 Safety: number of patients with infections | 1 | Risk Ratio (M‐H, Fixed, 95% CI) | Subtotals only | |
| 14 Safety: number of patients with musculoskeletal adverse events | 1 | Risk Ratio (M‐H, Fixed, 95% CI) | Subtotals only | |
| 15 Safety: number of patients with nervous system adverse events | 1 | Risk Ratio (M‐H, Fixed, 95% CI) | Subtotals only | |
| 16 Safety: number of patients with respiratory adverse events | 1 | Risk Ratio (M‐H, Fixed, 95% CI) | Subtotals only | |
| 17 Safety: number of patients with skin adverse events | 1 | Risk Ratio (M‐H, Fixed, 95% CI) | Subtotals only |
43.1. Analysis.

Comparison 43 Orthovisc versus Orthovisc, Outcome 1 WOMAC total score (0 to 100 mm VAS; change from baseline).
43.2. Analysis.
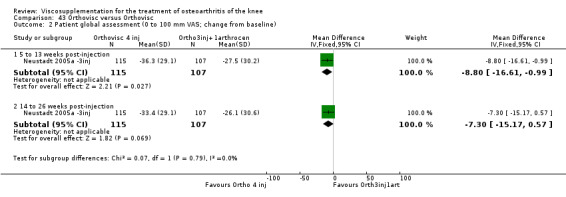
Comparison 43 Orthovisc versus Orthovisc, Outcome 2 Patient global assessment (0 to 100 mm VAS; change from baseline).
43.3. Analysis.
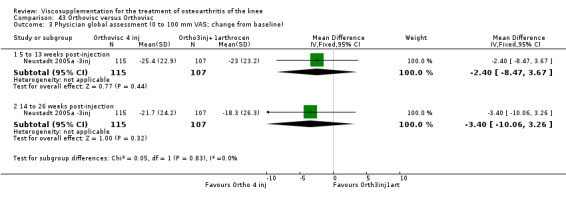
Comparison 43 Orthovisc versus Orthovisc, Outcome 3 Physician global assessment (0 to 100 mm VAS; change from baseline).
43.4. Analysis.

Comparison 43 Orthovisc versus Orthovisc, Outcome 4 WOMAC pain on standing (0 to 100 mm VAS; change from baseline).
43.5. Analysis.

Comparison 43 Orthovisc versus Orthovisc, Outcome 5 Number of patients with a 20% improvement from baseline in WOMAC pain score.
43.6. Analysis.

Comparison 43 Orthovisc versus Orthovisc, Outcome 6 Number of patients with a 40% improvement from baseline in WOMAC pain score.
43.7. Analysis.
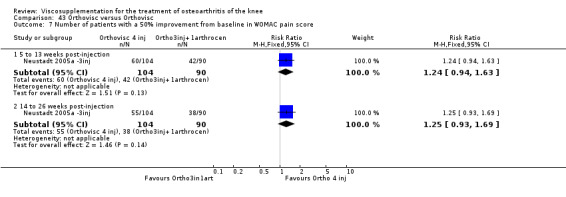
Comparison 43 Orthovisc versus Orthovisc, Outcome 7 Number of patients with a 50% improvement from baseline in WOMAC pain score.
43.8. Analysis.
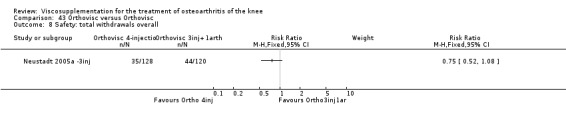
Comparison 43 Orthovisc versus Orthovisc, Outcome 8 Safety: total withdrawals overall.
43.9. Analysis.
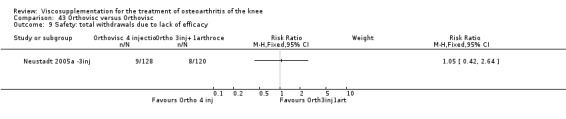
Comparison 43 Orthovisc versus Orthovisc, Outcome 9 Safety: total withdrawals due to lack of efficacy.
43.10. Analysis.
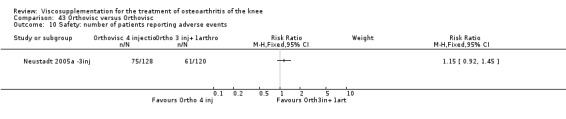
Comparison 43 Orthovisc versus Orthovisc, Outcome 10 Safety: number of patients reporting adverse events.
43.11. Analysis.

Comparison 43 Orthovisc versus Orthovisc, Outcome 11 Safety: number of patients with gastrointestinal adverse events.
43.12. Analysis.
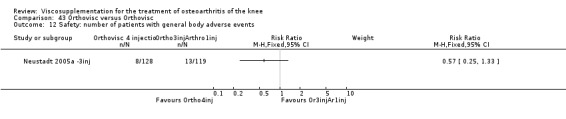
Comparison 43 Orthovisc versus Orthovisc, Outcome 12 Safety: number of patients with general body adverse events.
43.13. Analysis.
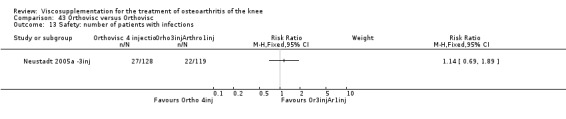
Comparison 43 Orthovisc versus Orthovisc, Outcome 13 Safety: number of patients with infections.
43.14. Analysis.

Comparison 43 Orthovisc versus Orthovisc, Outcome 14 Safety: number of patients with musculoskeletal adverse events.
43.15. Analysis.
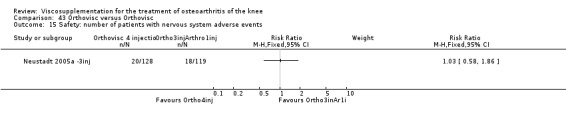
Comparison 43 Orthovisc versus Orthovisc, Outcome 15 Safety: number of patients with nervous system adverse events.
43.16. Analysis.
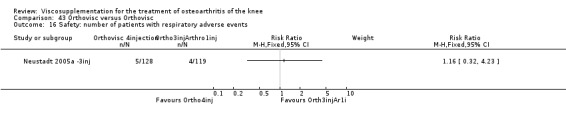
Comparison 43 Orthovisc versus Orthovisc, Outcome 16 Safety: number of patients with respiratory adverse events.
43.17. Analysis.
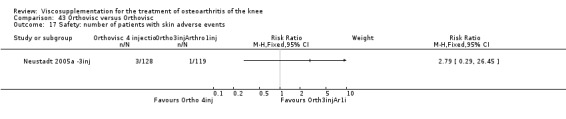
Comparison 43 Orthovisc versus Orthovisc, Outcome 17 Safety: number of patients with skin adverse events.
Comparison 44. Replasyn versus placebo.
| Outcome or subgroup title | No. of studies | No. of participants | Statistical method | Effect size |
|---|---|---|---|---|
| 1 Safety: Number of patients with local adverse reaction but study drug continued | 1 | Risk Ratio (M‐H, Fixed, 95% CI) | Subtotals only |
44.1. Analysis.
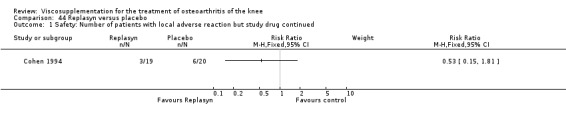
Comparison 44 Replasyn versus placebo, Outcome 1 Safety: Number of patients with local adverse reaction but study drug continued.
Comparison 45. SLM‐10 versus Artz (end of treatment).
| Outcome or subgroup title | No. of studies | No. of participants | Statistical method | Effect size |
|---|---|---|---|---|
| 1 Pain in movement (number of patients improved) | 1 | Risk Ratio (M‐H, Fixed, 95% CI) | Subtotals only | |
| 2 Pain when resting (number of patients improved) | 1 | Risk Ratio (M‐H, Fixed, 95% CI) | Subtotals only | |
| 3 Pressure pain (number of patients improved) | 1 | Risk Ratio (M‐H, Fixed, 95% CI) | Subtotals only | |
| 4 Patient global assessment (number of patients better or much better) | 1 | Risk Ratio (M‐H, Fixed, 95% CI) | Subtotals only | |
| 5 Safety: total withdrawals overall | 1 | Risk Ratio (M‐H, Fixed, 95% CI) | Subtotals only | |
| 6 Safety: local adverse events related to study drug resulting in withdrawals | 1 | Risk Ratio (M‐H, Fixed, 95% CI) | Subtotals only | |
| 7 Safety: local adverse events no specific causal relationship to study drug and continuation in trial | 1 | Risk Ratio (M‐H, Fixed, 95% CI) | Subtotals only |
45.1. Analysis.

Comparison 45 SLM‐10 versus Artz (end of treatment), Outcome 1 Pain in movement (number of patients improved).
45.2. Analysis.

Comparison 45 SLM‐10 versus Artz (end of treatment), Outcome 2 Pain when resting (number of patients improved).
45.3. Analysis.
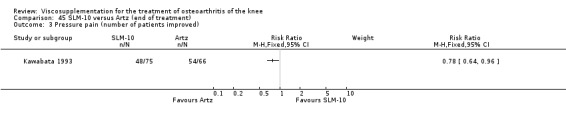
Comparison 45 SLM‐10 versus Artz (end of treatment), Outcome 3 Pressure pain (number of patients improved).
45.4. Analysis.
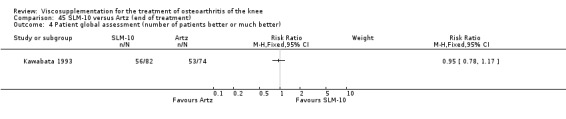
Comparison 45 SLM‐10 versus Artz (end of treatment), Outcome 4 Patient global assessment (number of patients better or much better).
45.5. Analysis.
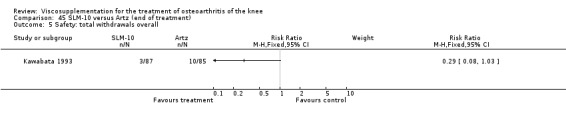
Comparison 45 SLM‐10 versus Artz (end of treatment), Outcome 5 Safety: total withdrawals overall.
45.6. Analysis.
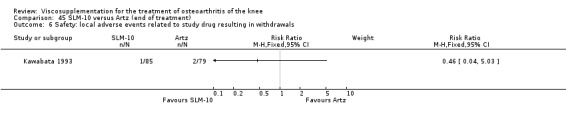
Comparison 45 SLM‐10 versus Artz (end of treatment), Outcome 6 Safety: local adverse events related to study drug resulting in withdrawals.
45.7. Analysis.

Comparison 45 SLM‐10 versus Artz (end of treatment), Outcome 7 Safety: local adverse events no specific causal relationship to study drug and continuation in trial.
Comparison 46. Suplasyn versus placebo: 1 week post‐injection.
| Outcome or subgroup title | No. of studies | No. of participants | Statistical method | Effect size |
|---|---|---|---|---|
| 1 Pain after walking (0‐10 cm VAS) | 1 | Mean Difference (IV, Fixed, 95% CI) | Subtotals only | |
| 2 WOMAC pain (0‐10 cm VAS) | 1 | Mean Difference (IV, Fixed, 95% CI) | Subtotals only | |
| 3 Pain at rest (0‐10 cm VAS) | 1 | Mean Difference (IV, Fixed, 95% CI) | Subtotals only | |
| 4 WOMAC function (0‐10 cm VAS) | 1 | Mean Difference (IV, Fixed, 95% CI) | Subtotals only | |
| 5 Walk time (sec) | 1 | Mean Difference (IV, Fixed, 95% CI) | Subtotals only | |
| 6 Safety: total withdrawals overall | 1 | Risk Ratio (M‐H, Fixed, 95% CI) | Subtotals only |
46.1. Analysis.

Comparison 46 Suplasyn versus placebo: 1 week post‐injection, Outcome 1 Pain after walking (0‐10 cm VAS).
46.2. Analysis.

Comparison 46 Suplasyn versus placebo: 1 week post‐injection, Outcome 2 WOMAC pain (0‐10 cm VAS).
46.3. Analysis.

Comparison 46 Suplasyn versus placebo: 1 week post‐injection, Outcome 3 Pain at rest (0‐10 cm VAS).
46.4. Analysis.
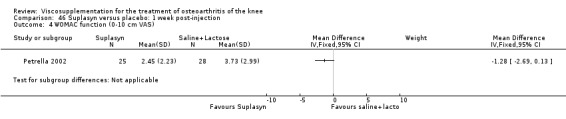
Comparison 46 Suplasyn versus placebo: 1 week post‐injection, Outcome 4 WOMAC function (0‐10 cm VAS).
46.5. Analysis.

Comparison 46 Suplasyn versus placebo: 1 week post‐injection, Outcome 5 Walk time (sec).
46.6. Analysis.

Comparison 46 Suplasyn versus placebo: 1 week post‐injection, Outcome 6 Safety: total withdrawals overall.
Comparison 47. Suplasyn versus NSAID: 1 week post‐injection.
| Outcome or subgroup title | No. of studies | No. of participants | Statistical method | Effect size |
|---|---|---|---|---|
| 1 Pain after walking (0‐10 cm VAS) | 1 | Mean Difference (IV, Random, 95% CI) | Subtotals only | |
| 2 WOMAC pain (0‐10 cm VAS) | 1 | Mean Difference (IV, Fixed, 95% CI) | Subtotals only | |
| 3 Pain at rest (0‐10 cm VAS) | 1 | Mean Difference (IV, Fixed, 95% CI) | Subtotals only | |
| 4 WOMAC function (0‐10 cm VAS) | 1 | Mean Difference (IV, Fixed, 95% CI) | Subtotals only | |
| 5 Walk time (sec) | 1 | Mean Difference (IV, Fixed, 95% CI) | Subtotals only | |
| 6 Safety: total withdrawals overall | 1 | Risk Ratio (M‐H, Fixed, 95% CI) | Subtotals only |
47.1. Analysis.

Comparison 47 Suplasyn versus NSAID: 1 week post‐injection, Outcome 1 Pain after walking (0‐10 cm VAS).
47.2. Analysis.
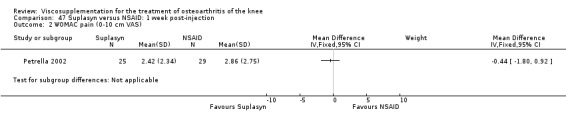
Comparison 47 Suplasyn versus NSAID: 1 week post‐injection, Outcome 2 WOMAC pain (0‐10 cm VAS).
47.3. Analysis.
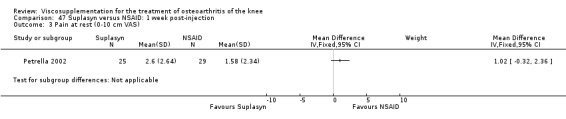
Comparison 47 Suplasyn versus NSAID: 1 week post‐injection, Outcome 3 Pain at rest (0‐10 cm VAS).
47.4. Analysis.

Comparison 47 Suplasyn versus NSAID: 1 week post‐injection, Outcome 4 WOMAC function (0‐10 cm VAS).
47.5. Analysis.
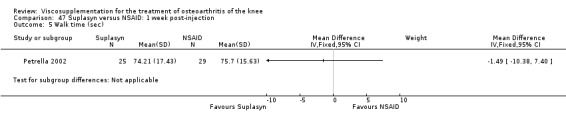
Comparison 47 Suplasyn versus NSAID: 1 week post‐injection, Outcome 5 Walk time (sec).
47.6. Analysis.
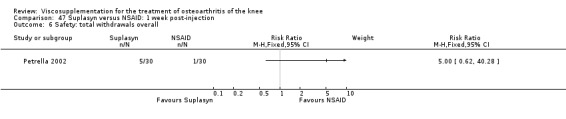
Comparison 47 Suplasyn versus NSAID: 1 week post‐injection, Outcome 6 Safety: total withdrawals overall.
Comparison 48. (Suplasyn + NSAID) versus NSAID: 1 week post‐injection.
| Outcome or subgroup title | No. of studies | No. of participants | Statistical method | Effect size |
|---|---|---|---|---|
| 1 Pain after walking (0‐10 cm VAS) | 1 | Mean Difference (IV, Fixed, 95% CI) | Subtotals only | |
| 2 WOMAC pain (0‐10 cm VAS) | 1 | Mean Difference (IV, Fixed, 95% CI) | Subtotals only | |
| 3 Pain at rest (0‐10 cm VAS) | 1 | Mean Difference (IV, Fixed, 95% CI) | Subtotals only | |
| 4 WOMAC function (0‐10 cm VAS) | 1 | Mean Difference (IV, Fixed, 95% CI) | Subtotals only | |
| 5 Walk time (sec) | 1 | Mean Difference (IV, Fixed, 95% CI) | Subtotals only | |
| 6 Safety: total withdrawals overall | 1 | Risk Ratio (M‐H, Fixed, 95% CI) | Subtotals only |
48.1. Analysis.
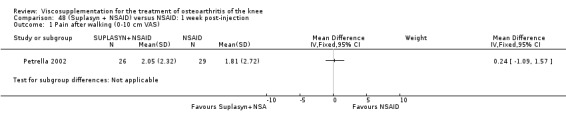
Comparison 48 (Suplasyn + NSAID) versus NSAID: 1 week post‐injection, Outcome 1 Pain after walking (0‐10 cm VAS).
48.2. Analysis.
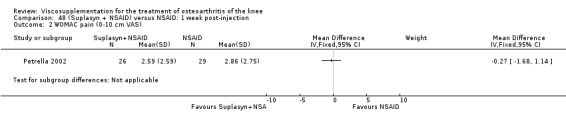
Comparison 48 (Suplasyn + NSAID) versus NSAID: 1 week post‐injection, Outcome 2 WOMAC pain (0‐10 cm VAS).
48.3. Analysis.

Comparison 48 (Suplasyn + NSAID) versus NSAID: 1 week post‐injection, Outcome 3 Pain at rest (0‐10 cm VAS).
48.4. Analysis.

Comparison 48 (Suplasyn + NSAID) versus NSAID: 1 week post‐injection, Outcome 4 WOMAC function (0‐10 cm VAS).
48.5. Analysis.

Comparison 48 (Suplasyn + NSAID) versus NSAID: 1 week post‐injection, Outcome 5 Walk time (sec).
48.6. Analysis.
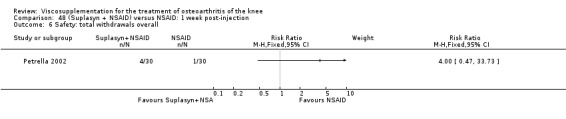
Comparison 48 (Suplasyn + NSAID) versus NSAID: 1 week post‐injection, Outcome 6 Safety: total withdrawals overall.
Comparison 49. Zeel compositum versus Hyalart (end of treatment (5 weeks)).
| Outcome or subgroup title | No. of studies | No. of participants | Statistical method | Effect size |
|---|---|---|---|---|
| 1 Pain during movement (0‐100 mm VAS ) | 1 | Mean Difference (IV, Fixed, 95% CI) | Subtotals only | |
| 2 Pain during the night (0‐100 mm VAS) | 1 | Mean Difference (IV, Fixed, 95% CI) | Subtotals only | |
| 3 Patient global: number of patients with noticeable improvements in symptoms | 1 | Risk Ratio (M‐H, Fixed, 95% CI) | Subtotals only | |
| 4 Patient assessment of improvement (0‐100 mm VAS) | 1 | Mean Difference (IV, Fixed, 95% CI) | Subtotals only | |
| 5 Patient assessment of tolerance (0‐100 mm VAS) | 1 | Mean Difference (IV, Fixed, 95% CI) | Subtotals only | |
| 6 Safety: number of patients with side effects | 1 | Risk Ratio (M‐H, Fixed, 95% CI) | Subtotals only | |
| 7 Safety: number of patients withdrawn due to lack of efficacy | 1 | Risk Ratio (M‐H, Fixed, 95% CI) | Subtotals only |
49.1. Analysis.
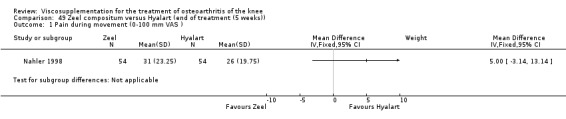
Comparison 49 Zeel compositum versus Hyalart (end of treatment (5 weeks)), Outcome 1 Pain during movement (0‐100 mm VAS ).
49.2. Analysis.

Comparison 49 Zeel compositum versus Hyalart (end of treatment (5 weeks)), Outcome 2 Pain during the night (0‐100 mm VAS).
49.3. Analysis.
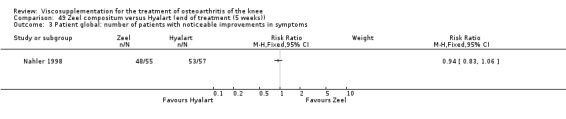
Comparison 49 Zeel compositum versus Hyalart (end of treatment (5 weeks)), Outcome 3 Patient global: number of patients with noticeable improvements in symptoms.
49.4. Analysis.
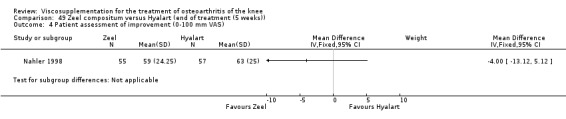
Comparison 49 Zeel compositum versus Hyalart (end of treatment (5 weeks)), Outcome 4 Patient assessment of improvement (0‐100 mm VAS).
49.5. Analysis.
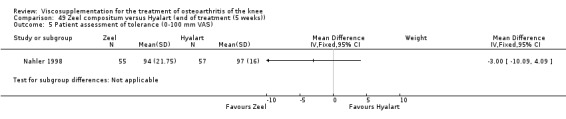
Comparison 49 Zeel compositum versus Hyalart (end of treatment (5 weeks)), Outcome 5 Patient assessment of tolerance (0‐100 mm VAS).
49.6. Analysis.
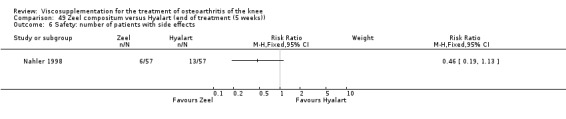
Comparison 49 Zeel compositum versus Hyalart (end of treatment (5 weeks)), Outcome 6 Safety: number of patients with side effects.
49.7. Analysis.
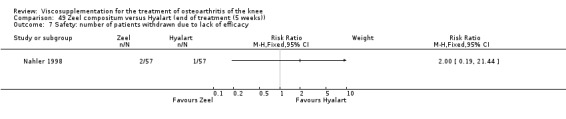
Comparison 49 Zeel compositum versus Hyalart (end of treatment (5 weeks)), Outcome 7 Safety: number of patients withdrawn due to lack of efficacy.
Comparison 50. HA/hylan versus placebo.
| Outcome or subgroup title | No. of studies | No. of participants | Statistical method | Effect size |
|---|---|---|---|---|
| 1 Pain on weight bearing (0‐100 mm VAS) | 27 | Mean Difference (IV, Random, 95% CI) | Subtotals only | |
| 1.1 1 to 4 weeks post‐injection | 27 | 2542 | Mean Difference (IV, Random, 95% CI) | ‐7.70 [‐11.29, ‐4.10] |
| 1.2 5 to 13 weeks post‐injection | 21 | 2090 | Mean Difference (IV, Random, 95% CI) | ‐11.00 [‐17.77, ‐8.23] |
| 1.3 14 to 26 weeks post‐injection | 10 | 1491 | Mean Difference (IV, Random, 95% CI) | ‐9.04 [‐14.83, ‐3.24] |
| 1.4 45 to 52 weeks post‐injection | 3 | 527 | Mean Difference (IV, Random, 95% CI) | ‐2.60 [‐7.40, 2.19] |
| 2 Pain at rest (0‐100 mm VAS) | 12 | Mean Difference (IV, Random, 95% CI) | Subtotals only | |
| 2.1 1 to 4 weeks post‐injection | 12 | 577 | Mean Difference (IV, Random, 95% CI) | ‐5.37 [‐9.90, ‐0.85] |
| 3 WOMAC pain | 9 | Std. Mean Difference (IV, Random, 95% CI) | Subtotals only | |
| 3.1 1 to 4 weeks post‐injection | 7 | 412 | Std. Mean Difference (IV, Random, 95% CI) | ‐1.22 [‐1.93, ‐0.52] |
| 3.2 5 to 13 weeks post‐injection | 7 | 639 | Std. Mean Difference (IV, Random, 95% CI) | ‐1.02 [‐1.57, ‐0.47] |
| 3.3 14 to 26 weeks post‐injection | 4 | 275 | Std. Mean Difference (IV, Random, 95% CI) | ‐1.04 [‐1.75, ‐0.32] |
| 4 WOMAC physical function | 9 | Std. Mean Difference (IV, Random, 95% CI) | Subtotals only | |
| 4.1 1 to 4 weeks post‐injection | 7 | 412 | Std. Mean Difference (IV, Random, 95% CI) | ‐1.02 [‐1.62, ‐0.42] |
| 4.2 5 to 13 weeks post‐injection | 7 | 639 | Std. Mean Difference (IV, Random, 95% CI) | ‐0.85 [‐1.31, ‐0.39] |
| 4.3 14 to 26 weeks post‐injection | 4 | 275 | Std. Mean Difference (IV, Random, 95% CI) | ‐0.80 [‐1.37, ‐0.24] |
| 5 Lequesne Index (0‐24) | 11 | Mean Difference (IV, Fixed, 95% CI) | Subtotals only | |
| 5.1 1 to 4 weeks post‐injection | 7 | 495 | Mean Difference (IV, Fixed, 95% CI) | ‐0.82 [‐1.48, ‐0.16] |
| 5.2 5 to 13 weeks post‐injection | 7 | 506 | Mean Difference (IV, Fixed, 95% CI) | ‐1.38 [‐2.04, ‐0.73] |
| 5.3 14 to 26 weeks post‐injection | 4 | 566 | Mean Difference (IV, Fixed, 95% CI) | 0.06 [‐0.75, 0.87] |
| 5.4 45 to 52 weeks post‐injection | 1 | 94 | Mean Difference (IV, Fixed, 95% CI) | ‐1.11 [‐2.70, 0.48] |
| 6 Patient global assessment (number of patients improved) | 14 | Risk Ratio (M‐H, Random, 95% CI) | Subtotals only | |
| 6.1 1 to 4 weeks post‐injection (much better/better or excellent/good) | 6 | 594 | Risk Ratio (M‐H, Random, 95% CI) | 1.10 [0.89, 1.36] |
| 6.2 5 to 13 weeks post‐injection (excellent/very good/good/better/somewhat better) | 6 | 579 | Risk Ratio (M‐H, Random, 95% CI) | 1.09 [0.87, 1.37] |
| 6.3 14 to 26 weeks post‐injection (better/somewhat/much) | 4 | 552 | Risk Ratio (M‐H, Random, 95% CI) | 1.04 [0.73, 1.47] |
| 6.4 45 to 52 weeks post‐injection (number of patients rating treatment effective or very good or good) | 2 | 290 | Risk Ratio (M‐H, Random, 95% CI) | 1.01 [0.82, 1.23] |
| 7 Flexion (degrees) | 3 | Mean Difference (IV, Fixed, 95% CI) | Subtotals only | |
| 7.1 1 to 4 weeks post‐injection | 3 | 174 | Mean Difference (IV, Fixed, 95% CI) | 3.87 [2.06, 5.68] |
| 7.2 5 to 13 weeks post‐injection | 1 | 35 | Mean Difference (IV, Fixed, 95% CI) | 7.60 [0.46, 14.74] |
| 8 Safety: total withdrawals overall | 25 | Risk Ratio (M‐H, Fixed, 95% CI) | Subtotals only | |
| 8.1 1 to 4 weeks post‐injection | 5 | 525 | Risk Ratio (M‐H, Fixed, 95% CI) | 1.14 [0.61, 2.15] |
| 8.2 5 to 13 weeks post‐injection | 8 | 858 | Risk Ratio (M‐H, Fixed, 95% CI) | 1.11 [0.73, 1.67] |
| 8.3 14 to 26 weeks post‐injection | 9 | 1489 | Risk Ratio (M‐H, Fixed, 95% CI) | 1.00 [0.83, 1.20] |
| 8.4 45 to 52 weeks post‐injection | 3 | 389 | Risk Ratio (M‐H, Fixed, 95% CI) | 1.14 [0.63, 2.08] |
| 9 Safety: number of patients with local adverse reaction and study drug discontinued | 4 | Risk Ratio (M‐H, Fixed, 95% CI) | Subtotals only | |
| 10 Safety: number of patients with local adverse reaction but study drug continued | 4 | Risk Ratio (M‐H, Fixed, 95% CI) | Subtotals only | |
| 11 Safety: number of patients discontinued due to adverse events | 4 | Risk Ratio (M‐H, Fixed, 95% CI) | Subtotals only | |
| 11.1 14 to 26 weeks post‐injection | 3 | 687 | Risk Ratio (M‐H, Fixed, 95% CI) | 1.42 [0.69, 2.93] |
| 11.2 45 to 52 weeks post‐injection | 1 | 216 | Risk Ratio (M‐H, Fixed, 95% CI) | 1.30 [0.24, 6.93] |
| 12 Safety: withdrawals due to lack of efficacy | 6 | Risk Ratio (M‐H, Fixed, 95% CI) | Subtotals only | |
| 12.1 1 to 4 weeks post‐injection | 1 | 41 | Risk Ratio (M‐H, Fixed, 95% CI) | 0.0 [0.0, 0.0] |
| 12.2 14 to 26 weeks post‐injection | 4 | 1005 | Risk Ratio (M‐H, Fixed, 95% CI) | 0.94 [0.63, 1.40] |
| 12.3 45 to 52 weeks post‐injection | 1 | 216 | Risk Ratio (M‐H, Fixed, 95% CI) | 0.32 [0.03, 3.52] |
| 13 Safety: number of adverse events for injection site pain | 2 | Risk Ratio (M‐H, Fixed, 95% CI) | Subtotals only | |
| 13.1 14 to 26 weeks post‐injection | 2 | 381 | Risk Ratio (M‐H, Fixed, 95% CI) | 1.70 [1.19, 2.44] |
| 14 Safety: number of adverse events local skin rash | 2 | Risk Ratio (M‐H, Fixed, 95% CI) | Subtotals only | |
| 14.1 14 to 26 weeks post‐injection | 2 | 558 | Risk Ratio (M‐H, Fixed, 95% CI) | 0.89 [0.55, 1.43] |
| 15 Safety: number of patients with gastrointestinal complaints | 2 | Risk Ratio (M‐H, Fixed, 95% CI) | Subtotals only | |
| 15.1 14 to 26 weeks post‐injection | 2 | 558 | Risk Ratio (M‐H, Fixed, 95% CI) | 1.42 [0.99, 2.03] |
| 16 Safety: number of patients with treatment related adverse events | 4 | Risk Ratio (M‐H, Fixed, 95% CI) | Subtotals only | |
| 16.1 14 to 26 weeks post‐injection | 4 | 464 | Risk Ratio (M‐H, Fixed, 95% CI) | 1.48 [0.91, 2.41] |
| 17 Safety: number of patients with possible study medication related events | 1 | Risk Ratio (M‐H, Fixed, 95% CI) | Subtotals only | |
| 17.1 45 to 52 weeks post‐injection | 1 | 63 | Risk Ratio (M‐H, Fixed, 95% CI) | 7.68 [0.41, 142.77] |
| 18 Safety: number of serious adverse events | 2 | Risk Ratio (M‐H, Fixed, 95% CI) | Subtotals only | |
| 18.1 45 to 52 weeks post‐injection | 2 | 392 | Risk Ratio (M‐H, Fixed, 95% CI) | 0.60 [0.34, 1.07] |
| 19 Safety: number of adverse events probably or possibly related to treatment | 2 | Risk Ratio (M‐H, Fixed, 95% CI) | Subtotals only | |
| 19.1 45 to 52 weeks post‐injection | 2 | 392 | Risk Ratio (M‐H, Fixed, 95% CI) | 0.49 [0.11, 2.20] |
| 20 Safety: number of patients reporting adverse events | 2 | Risk Ratio (M‐H, Fixed, 95% CI) | Subtotals only | |
| 20.1 45 to 52 weeks post‐injection | 2 | 308 | Risk Ratio (M‐H, Fixed, 95% CI) | 1.12 [0.91, 1.39] |
50.1. Analysis.

Comparison 50 HA/hylan versus placebo, Outcome 1 Pain on weight bearing (0‐100 mm VAS).
50.2. Analysis.
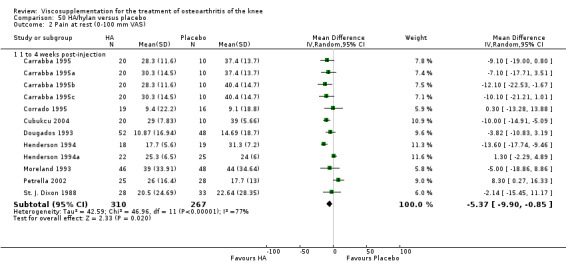
Comparison 50 HA/hylan versus placebo, Outcome 2 Pain at rest (0‐100 mm VAS).
50.3. Analysis.
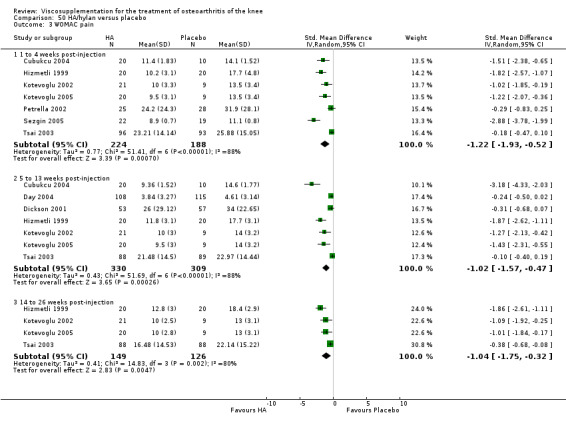
Comparison 50 HA/hylan versus placebo, Outcome 3 WOMAC pain.
50.4. Analysis.

Comparison 50 HA/hylan versus placebo, Outcome 4 WOMAC physical function.
50.5. Analysis.
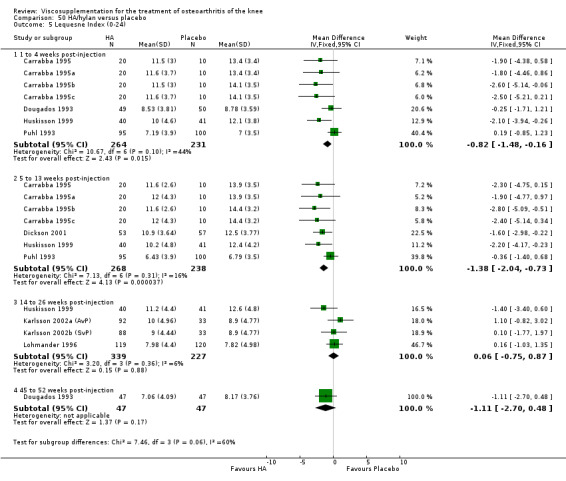
Comparison 50 HA/hylan versus placebo, Outcome 5 Lequesne Index (0‐24).
50.6. Analysis.

Comparison 50 HA/hylan versus placebo, Outcome 6 Patient global assessment (number of patients improved).
50.7. Analysis.
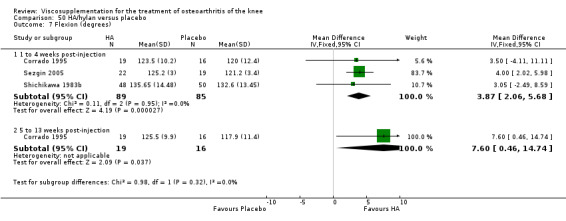
Comparison 50 HA/hylan versus placebo, Outcome 7 Flexion (degrees).
50.8. Analysis.
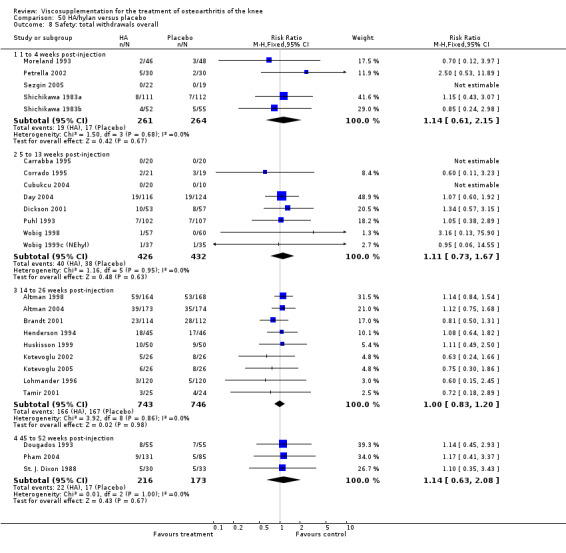
Comparison 50 HA/hylan versus placebo, Outcome 8 Safety: total withdrawals overall.
50.9. Analysis.

Comparison 50 HA/hylan versus placebo, Outcome 9 Safety: number of patients with local adverse reaction and study drug discontinued.
50.10. Analysis.

Comparison 50 HA/hylan versus placebo, Outcome 10 Safety: number of patients with local adverse reaction but study drug continued.
50.11. Analysis.
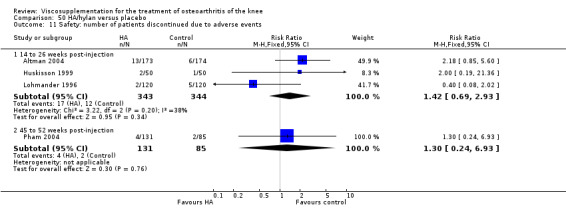
Comparison 50 HA/hylan versus placebo, Outcome 11 Safety: number of patients discontinued due to adverse events.
50.12. Analysis.

Comparison 50 HA/hylan versus placebo, Outcome 12 Safety: withdrawals due to lack of efficacy.
50.13. Analysis.
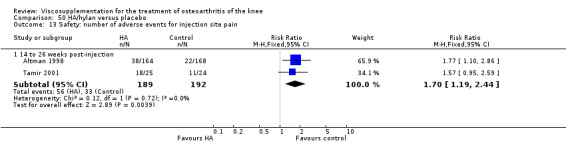
Comparison 50 HA/hylan versus placebo, Outcome 13 Safety: number of adverse events for injection site pain.
50.14. Analysis.
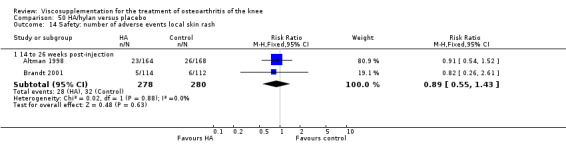
Comparison 50 HA/hylan versus placebo, Outcome 14 Safety: number of adverse events local skin rash.
50.15. Analysis.
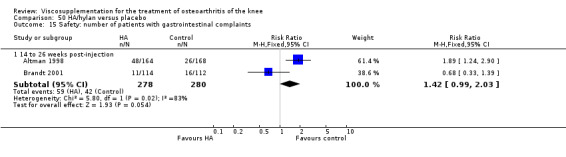
Comparison 50 HA/hylan versus placebo, Outcome 15 Safety: number of patients with gastrointestinal complaints.
50.16. Analysis.

Comparison 50 HA/hylan versus placebo, Outcome 16 Safety: number of patients with treatment related adverse events.
50.17. Analysis.
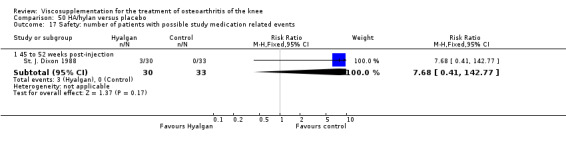
Comparison 50 HA/hylan versus placebo, Outcome 17 Safety: number of patients with possible study medication related events.
50.18. Analysis.
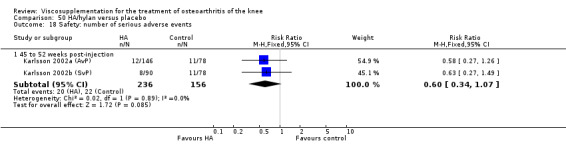
Comparison 50 HA/hylan versus placebo, Outcome 18 Safety: number of serious adverse events.
50.19. Analysis.
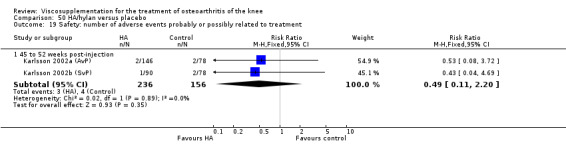
Comparison 50 HA/hylan versus placebo, Outcome 19 Safety: number of adverse events probably or possibly related to treatment.
50.20. Analysis.

Comparison 50 HA/hylan versus placebo, Outcome 20 Safety: number of patients reporting adverse events.
Comparison 51. HA/hylan versus NSAID.
| Outcome or subgroup title | No. of studies | No. of participants | Statistical method | Effect size |
|---|---|---|---|---|
| 1 Pain after walking (0‐100 mm VAS) | 2 | Mean Difference (IV, Random, 95% CI) | Subtotals only | |
| 1.1 1 to 4 weeks post‐injection | 2 | 333 | Mean Difference (IV, Random, 95% CI) | 3.28 [‐6.45, 13.02] |
| 2 Patient general satisfaction wtih treatment (excellent or good vs satisfactory or bad) | 1 | Risk Ratio (M‐H, Fixed, 95% CI) | Subtotals only | |
| 2.1 HA arm versus regular dose celecoxib | 1 | 60 | Risk Ratio (M‐H, Fixed, 95% CI) | 0.62 [0.46, 0.84] |
| 2.2 HA + low dose celecoxib arm versus regular dose celecoxib | 1 | 60 | Risk Ratio (M‐H, Fixed, 95% CI) | 1.03 [0.94, 1.13] |
| 2.3 HA + voluntary dose of celecoxib arm versus regular dose of celecoxib | 1 | 60 | Risk Ratio (M‐H, Fixed, 95% CI) | 1.0 [0.91, 1.10] |
| 3 Safety: total withdrawals overall | 3 | Risk Ratio (M‐H, Fixed, 95% CI) | Subtotals only | |
| 3.1 14 to 26 weeks post‐injection | 2 | 392 | Risk Ratio (M‐H, Fixed, 95% CI) | 1.19 [0.88, 1.61] |
| 3.2 45 to 52 weeks post‐injection | 1 | 216 | Risk Ratio (M‐H, Fixed, 95% CI) | 1.17 [0.41, 3.37] |
| 4 Safety: number of withdrawals due to inefficacy | 2 | Risk Ratio (M‐H, Fixed, 95% CI) | Subtotals only |
51.1. Analysis.
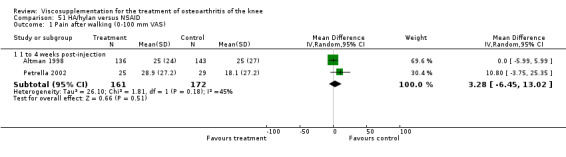
Comparison 51 HA/hylan versus NSAID, Outcome 1 Pain after walking (0‐100 mm VAS).
51.2. Analysis.
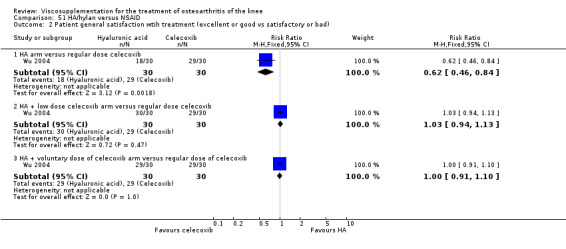
Comparison 51 HA/hylan versus NSAID, Outcome 2 Patient general satisfaction wtih treatment (excellent or good vs satisfactory or bad).
51.3. Analysis.
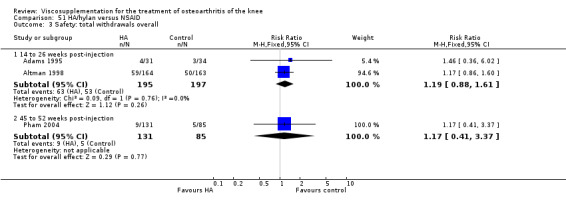
Comparison 51 HA/hylan versus NSAID, Outcome 3 Safety: total withdrawals overall.
51.4. Analysis.
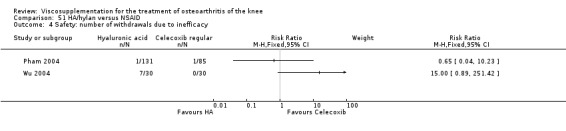
Comparison 51 HA/hylan versus NSAID, Outcome 4 Safety: number of withdrawals due to inefficacy.
Comparison 52. HA/hylan versus Methylprednisolone acetate.
| Outcome or subgroup title | No. of studies | No. of participants | Statistical method | Effect size |
|---|---|---|---|---|
| 1 Function: range of motion (active flexion in degrees) | 3 | Mean Difference (IV, Fixed, 95% CI) | Subtotals only | |
| 1.1 1 to 4 weeks post‐injection | 3 | 185 | Mean Difference (IV, Fixed, 95% CI) | 3.87 [0.36, 7.37] |
| 1.2 5 to 13 weeks post‐injection | 3 | 185 | Mean Difference (IV, Fixed, 95% CI) | 3.66 [0.48, 6.83] |
52.1. Analysis.
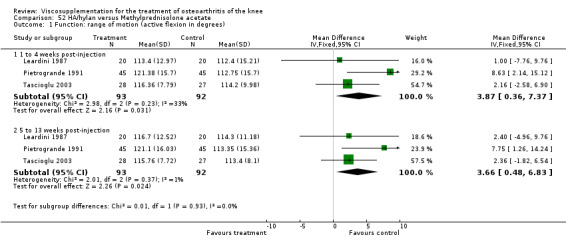
Comparison 52 HA/hylan versus Methylprednisolone acetate, Outcome 1 Function: range of motion (active flexion in degrees).
Comparison 53. HA versus HA.
| Outcome or subgroup title | No. of studies | No. of participants | Statistical method | Effect size |
|---|---|---|---|---|
| 1 Pain in movement (number of patients improved) | 2 | Risk Ratio (M‐H, Fixed, 95% CI) | Subtotals only | |
| 1.1 1 to 4 weeks post‐injection | 2 | 295 | Risk Ratio (M‐H, Fixed, 95% CI) | 0.89 [0.76, 1.03] |
| 2 Pressure pain (number of patients improved) | 2 | Risk Ratio (M‐H, Fixed, 95% CI) | Subtotals only | |
| 2.1 1 to 4 weeks post‐injection | 2 | 319 | Risk Ratio (M‐H, Fixed, 95% CI) | 0.94 [0.80, 1.10] |
| 3 Lequesne Index (0‐24) | 2 | Mean Difference (IV, Fixed, 95% CI) | Subtotals only | |
| 3.1 1 to 4 weeks post‐injection | 1 | 233 | Mean Difference (IV, Fixed, 95% CI) | 0.46 [‐0.59, 1.51] |
| 3.2 5 to 13 weeks post‐injection | 2 | 261 | Mean Difference (IV, Fixed, 95% CI) | 0.29 [‐0.64, 1.23] |
| 4 Patient global assessment | 5 | Risk Ratio (M‐H, Fixed, 95% CI) | Subtotals only | |
| 4.1 1 to 4 weeks post‐injection | 3 | 358 | Risk Ratio (M‐H, Fixed, 95% CI) | 0.98 [0.84, 1.14] |
| 4.2 5 to 13 weeks post‐injection | 2 | 301 | Risk Ratio (M‐H, Fixed, 95% CI) | 0.91 [0.78, 1.05] |
| 4.3 14 to 26 weeks post‐injection | 1 | 49 | Risk Ratio (M‐H, Fixed, 95% CI) | 2.11 [0.67, 6.70] |
| 4.4 45 to 52 weeks post‐injection | 1 | 159 | Risk Ratio (M‐H, Fixed, 95% CI) | 0.85 [0.70, 1.03] |
53.1. Analysis.

Comparison 53 HA versus HA, Outcome 1 Pain in movement (number of patients improved).
53.2. Analysis.
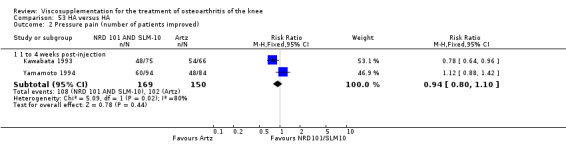
Comparison 53 HA versus HA, Outcome 2 Pressure pain (number of patients improved).
53.3. Analysis.

Comparison 53 HA versus HA, Outcome 3 Lequesne Index (0‐24).
53.4. Analysis.

Comparison 53 HA versus HA, Outcome 4 Patient global assessment.
Characteristics of studies
Characteristics of included studies [ordered by study ID]
Adams 1995.
| Methods | Randomised Controlled Trial 2/3‐arms blinded Hylan G‐F 20 group not blinded Blinded assessor Screen blinded patient Parallel‐group Multicentre No washout Efficacy analysis: Per protocol: n=93 Safety analysis: ITT | |
| Participants | Country: Canada Mean age:61 % Female:65 Mean disease duration:6 y Disease duration statistically significantly longer for NSAID only group Duration:12 wk Telephone follow‐up at 26 weeks Number randomised:102 (NSAID 34, HA 31, NSAID+HA 37) Inclusion: 18‐75 y chronic, idiopathic knee OA on radiographic examination Kellgren and Lawrence Grade 1 to 3 in no more than 2 compartments and not 3 in patellofemoral 4 of 6: ESR<30mm/h, RF<1:160, morning stiffness<=30 min, crepitus on active motion, tenderness of bony margins, MD absence of rheumatoid disease tolerant of NSAID for at least 30 days using joint actively on daily basis score >50/100 on VAS for pain on motion with weight bearing Exclusion: serious systemic disease, depression or neuroses acute synovitis excessive effusion clinically obese varus/valgus of >15 pregnant or not using effective contraception chronic daily steroid therapy surgery or joint injection within previous 3 mths Baseline values: pain on motion NSAID: 63 Hylan G‐F 20: 61 NSAID+Hylan G‐F 20: 60 | |
| Interventions | Usual NSAID‐only + 3 weekly arthrocentesis (NSAID‐only group) Hylan G‐F 20 (2 ml) 3 weekly injections + arthrocentesis (Hylan G‐F only group), Usual NSAID+ Hylan G‐F20 (2 ml) 3 weekly injections + arthrocentesis (Hylan G‐F 20 + NSAID group) Concurrent therapy: acetaminophen usage for analgesia documented in weekly diaries (pill counts). | |
| Outcomes | Pain on motion with weight bearing (100 mm VAS)‐‐‐‐‐‐‐‐‐‐‐‐‐‐‐‐‐ Pain at rest, night, restriction of activity, pt's overall assessment of arthritic pain, pain during 50 foot walk, medial and lateral joint tenderness, evaluator's overall assessment of treatment : 100 mm VAS; level of activity for each of standing, sitting, walking, climbing stairs (1=never able to perform,2=occa‐ sionally able to perform,3=fre‐ quently able to perform); pt. pain severity (1=none, 2=only on starting activity after rest,3=during day when active,4=during day at rest,5=all day and waking pt at night); support used; level of activity for running; 50 foot walk time, evaluator scored effusion, medial and lateral joint tenderness, pain while walking, overall assessment, 50 foot walk time on 100 mm VAS Assessments: Wk 0, 1(baseline), 2,3,7,12,26 | |
| Notes | Jadad's:3/5 R‐2,B‐0,W‐1 13 pts had bilateral OA, both treated but only most painful evaluated for efficacy while both evaluated for safety. Arthrocentesis with removal of effusion if present before treatment. 15% subjects presented wtih an effusion. Incomplete blinding of hylan G‐F 20 only group with instruction to discontinue NSAID therapy may have introduced bias. Work supported by Biomatrix, Inc. | |
| Risk of bias | ||
| Bias | Authors' judgement | Support for judgement |
| Allocation concealment (selection bias) | Low risk | A ‐ Adequate |
Altman 1998.
| Methods | Randomised Controlled Trial Double‐blind Masked observer Parallel‐group Multicentre (n=15) Double‐dummy Stratified by pain severity Placebo and naproxen controlled 2 week washout Both per protocol n=333 (HA 105, PL 115, naproxen 113) and post‐hoc ITT analyses | |
| Participants | Country: United States Mean age:64 % Female:58 Mean disease duration:NR Duration:26 wk Number randomised:495 (HA 164, PL 168, naproxen 163) Inclusion: >= 40 y knee OA (ACR criteria) knee pain >= 1 y knee pain >= 20/100 mm VAS on 50 foot walk pain >= 20 mm on >= 1 WOMAC pain items moderate or marked pain on 6 point categorical scale xray >= 1 osteophyte and Kellgren and Lawrence Grade 2 to 3 no prior IA HA within 1 y no other IA injection within 3 mth Exclusion: NR Baseline values: 50 foot walk pain HA: 54 PL: 55 Naproxen: 54 | |
| Interventions | Hyalgan 2 ml (20 mg) 5 weekly injections in saline vehicle +lidocaine and SF aspiration +oral placebo bid Placebo=lidocaine + SF aspiration + 2 ml saline 5 weekly injections +oral placebo bid naproxen 500 mg bid + lidocaine ( 5 weekly sham injection) + SF aspirated only if effusion Concurrent therapy: acetaminophen 2000 mg daily per‐ mitted, aspirin <= 650 mg permitted | |
| Outcomes | Pain on 50 foot walk on 10 cm VAS immediately after walk‐‐‐‐‐‐‐‐‐‐‐‐‐‐‐‐‐ Pt. and observer global assess‐ ments of knee pain six point categorical scale (none,slight,mild, moderate, marked) 50 foot walk time WOMAC VAS heel to buttock distance (cm) knee range of motion (degrees) by goniometry midpatellar knee circumference synovial effusion (presence/absence) acetaminophen tablet count overall evaluation of treatment by pt. and observer | |
| Notes | Jadad's:4/5 R‐1,B‐2,W‐1 Worse knee selected for study if bilateral. Sponsored by Fidia Pharma‐ ceutical Corporation. R. Fiorentini (Fidia) provided guidance. F. Dosey & F. Patarnello (Fidia) provided statistical support. D. Westcott (Fidia) provided secretarial assistance. Comparison of the decrease from baseline from the HA versus PL revealed a difference of only 1.5 mm, which was not statistically significant, therefore because statistical significance for this ITT analysis was not achieved, the data for all 2o effectiveness variables was analysed only for completers (333/495). | |
| Risk of bias | ||
| Bias | Authors' judgement | Support for judgement |
| Allocation concealment (selection bias) | Unclear risk | B ‐ Unclear |
Altman 2004.
| Methods | Randomised Controlled Trial Double blind Multicentre (n=18) 1 wk washout NSAID | |
| Participants | Country: Canada (6 sites), Sweden (5 sites), United States (7 sites) Mean age: 63.1 % Female: 55 Mean disease duration: 5.75 y Duration: 26 wk Number randomised: 347 (HA 173, PL 174) Inclusion: OA of the knee as defined by the ACR criteria that was refractory to non‐pharmacologic therapies, a WOMAC pain subscale score greater than or equal to 7 in one knee and no greater than 15 in either knee (range 0 to 20 Likert scale), significant knee pain in the signal knee for the majority of the preceding 3 mth, pts had to be normally active and able to walk 50 m unaided Exclusion: Isolated patello‐ femoral OA, use of systemic steroids, glucosamine or chondroitin within the past 3 mth, intra‐articular injection into the knee of corticosteroids in the past 3 mth or intra‐articular HA within the last 9 mth, treatment with oral or topical NSAIDs during the previous wk, use of topical non‐NSAIDs within the previous 3 days, arthroscopy or other surgical procedure within the last 12 mth and anticoagulant treatment (except acetylsalicyclic acid less than or equal to 325 mg per day), presented with a systemic active inflammatory condition or infection, septic knee arthritis within the previous 3 month, significant venous or lymphatic stasis of the legs, active skin disease or infection at the injectione site, or any other medical condition rendering the pt unsuitble for inclusion according to the investigator, pregnant or breast‐feeding women and those of childbearing potential not practicicing adequate contraception Baseline values: WOMAC pain: HA: 9.90, PL 10.42 WOMAC stiffness HA: 3.91, PL 4.30 WOMAC function HA: 30.70 PL: 32.16 Pt global HA: 3.23 PL: 3.17 SF‐36 physical component summary HA: 33.54, PL: 32.91 SF‐36 mental component summary HA: 55.55, PL: 55.92 | |
| Interventions | NASHA (non‐animal stabilized hyaluronic acid) Durolane, a single 3 ml injection containing HA 60 mg in buffered sodium chloride 0.9% (pH 7), Placebo: saline, identifical buffered sodium chloride vehicle Both NASHA and saline supplied in identical 3 ml syringes; an 18‐22 G needle Concurrent therapy: acetaminophen (paracetamol maximum daily dose 4 g) was permitted as rescue medication except during the 48 h period prior to each study visit | |
| Outcomes | Responder (positive response to treatment) was defined as a reduction in the WOMAC pain score of at least 40% with an absolute improvement of at least 5 points compared with baseline for the study knee at the final visit‐‐‐‐‐‐‐‐‐‐‐‐ WOMAC stiffness, WOMC physical function score, pt assessment of global disease status ona 5‐point scale, SF‐36 | |
| Notes | Jadad's: 5/5 R‐2, B‐2, W‐1 This study was supported by Q‐Med AB, Uppsala, Sweden. Formal statistical comparison of groups at baseline not completed, but authors noted there was a trend towards higher WOMAC pain, stiffness and function scores in PL group and also more females than males in the PL group, and also higher incidence of joint effusion in PL group. | |
| Risk of bias | ||
| Bias | Authors' judgement | Support for judgement |
| Allocation concealment (selection bias) | Low risk | A ‐ Adequate |
Ardic 2001.
| Methods | See Cubukcu 2004 | |
| Participants | ||
| Interventions | ||
| Outcomes | ||
| Notes | ||
| Risk of bias | ||
| Bias | Authors' judgement | Support for judgement |
| Allocation concealment (selection bias) | Unclear risk | D ‐ Not used |
Atamaz 2004.
| Methods | See Atamaz 2005 | |
| Participants | ||
| Interventions | ||
| Outcomes | ||
| Notes | ||
| Risk of bias | ||
| Bias | Authors' judgement | Support for judgement |
| Allocation concealment (selection bias) | Unclear risk | D ‐ Not used |
Atamaz 2005.
| Methods | Controlled Trial Single blind Single centre 1 wk washout | |
| Participants | Country: Turkey Mean age: 60.5 % Female: 81.7 Mean disease duration: NR Number enrolled: 85 of whom 3 did not meet inclusion criteria leaving number randomised: 82 (Group 1 ‐ 40; Group 2 ‐ 42) Inclusion: age 40 to 80 y, clinically (criteria of the ACR) and radiological (grade 2 or 3 on Kellgen‐Lawrence) OA of the knee for at least 6 months duration Exclusion: had received intra‐articular injection in the joint and/or attended to physiotherapy on the affected knee within 6 months prior to study, history of allergy or hypersensitive to drugs or eggs, ascertained or suspected pregnancy or lactating, known or suspected joint infection or a specific condition (neoplasm, diabetes mellitus, paresis, osteonecrosis, recent trauma) or poor general health status that would interfere with the functional assessments during the study Baseline values: WOMAC pain OR: 13.4 SY: 12.4 PT: 14.2 Spontaneous pain (VAS) OR: 70.3 SY: 85.0 PT: 93.5 SF‐36 pain OR: 36.4 SY: 25.6 PT: 29.6 WOMAC function OR: 41.5 SY: 58.3 PT: 49.9 SF‐36 physical function OR: 44.5 SY: 35.5 PT: 31.7 15 meter walking time OR: 24.4 SY: 22.8 PT: 22.5 Range of motion OR: 118.6 SY: 123.0 PT: 121.3 Stiffness (minutes) OR: 9.6 SY: 6.5 PT: 10.5 Peripheral measurement of knee (centimetre) OR: 42.6 SY: 41.0 PT: 41.2 | |
| Interventions | Group I: (hyaluronan or hylan G‐F 20): HA intraarticular injection (Orthovisc 15 mg/2 ml) or hylan G‐F 20 (Synvisc 16 mg/2 ml) 3 weekly injections at day 0, 7, 14 and then on 6th month for a total of 4 injections; if effusion present joint was aspirated; all injections given by same physicians using aseptic procedures Group II: Physical therapy five times a week at day 3 weeks with a series of infrared, short‐wave diathermy pulsed patterns and interferential therapy; each of which were continued approximately 20 seconds with a total one hour Concurrent therapy: Paracetamol (to a maxium of 2 g daily) as considered appropriate by the physician | |
| Outcomes | Range of motion (flexion with a goniometer), time to walk a distance of 15 m (seconds), amount of soft tissue swelling and swelling and synovial effusion (measured by a meter on volar patellar area and noted if patellar click sign was present b bimanual examination), spontaneous day pain (100 mm VAS), night pain, pain at rest, pain on movement, pain on touch assessed by a 4‐point scoring system where 0= no pain, 1= slight pain, 2= moderate pain, 3=strong pain, WOMAC OA Index, SF‐36 | |
| Notes | Jadad's: 2/5 R‐1, B‐0, W‐1 No industry funding; supported by University. | |
| Risk of bias | ||
| Bias | Authors' judgement | Support for judgement |
| Allocation concealment (selection bias) | Unclear risk | B ‐ Unclear |
Auerbach 2002.
| Methods | Randomised Controlled Trial | |
| Participants | Country: Germany Mean age: 47 % Female: 51 Disease duration: NR Duration: 1 y Number randomised: 111 (HA 56, O2 53) Inclusion: NR Exclusion: NR Baseline values: Rest pain: GF: 29.03 O2: 28.89 Movement pain: GF: 58.57 O2: 47.40 WOMAC Pain GF: 8.2 O2: 6.8 WOMAC Function GF: 22.5 O2: 20.6 WOMAC Stiffness: GF: 2.7 O2: 2.7 | |
| Interventions | Hylan G‐F 20 3 weekly injections + exercise programme, IA gaseous oxygen + exercise programme | |
| Outcomes | Pain at rest and under strain (100 mm VAS), WOMAC OA Index, Lysholm score, Tegner Activity Index | |
| Notes | Jadad's:2/5 R‐1,B‐0,W‐1 | |
| Risk of bias | ||
| Bias | Authors' judgement | Support for judgement |
| Allocation concealment (selection bias) | Unclear risk | B ‐ Unclear |
Auerbach 2002a.
| Methods | See Auerbach 2002. | |
| Participants | ||
| Interventions | ||
| Outcomes | ||
| Notes | ||
| Risk of bias | ||
| Bias | Authors' judgement | Support for judgement |
| Allocation concealment (selection bias) | Unclear risk | B ‐ Unclear |
Bayramoglu 2003.
| Methods | Randomised Controlled Trial (Pilot study) Parallel‐group Blinded technician (muscle strength) Single centre Per protocol n=37 (OR 16, GF 12, PT 9) | |
| Participants | Country: Turkey Mean age: 62 % Female: 95 Mean disease duration: 5.8 y Duration: 3 mth Number randomised: 46 (OR 16, GF 15, PT 15) Inclusion: presence of definite osteo‐ phytes in medial and/or lateral tibiofemoral compartment, pain and/or difficulty in activities of daily living due to knee OA Exclusion: ia corticosteroid injection into either knee within 3 mth prior to study, uncomplicated knee surgery within 6 mth of study, complicated knee surgery within previous y, bilateral or unilateral TKA, history of avascular necrosis, RA or any other systemic inflam‐ matory arthropathy, periarticular fracture, Paget's disease, villonodular synovitis, joint infection, ochronosis, neuropathic arthropathy, acromegaly, hemochroma‐ tosis, gout or recurrent pseudogout and osteopetrosis Baseline values: Lequesne OR: 12.4 GF: 12.8 PT: 11.6 | |
| Interventions | Orthovisc once per wk for 3 wk plus 3 wk physical therapy programme, Hylan G‐F 20 once per wk for 3 wk plus 3 wk PT, PT alone (deep tissue heating with short‐wave diathermy, TENS and exercises. All groups were to continue resistive exercises at home. | |
| Outcomes | Lequesne Index Range of motion static knee stability in frontal and sagittal planes, existing deformities assessed, x‐ray Kellgren and Lawrence grading, flexor and extensor muscle strength by computerised isokinetic dynamometer | |
| Notes | Jadad's:2/5 R‐1,B‐0,W‐1 From publication, blinded technician only assessed muscle strength outcome. Bilateral OA in 12 OR, 8 GF, 9 PT and injections performed "accordingly". | |
| Risk of bias | ||
| Bias | Authors' judgement | Support for judgement |
| Allocation concealment (selection bias) | Unclear risk | B ‐ Unclear |
Bragantini 1987.
| Methods | Randomised Controlled Trial Single‐blind Parallel‐group Single centre 3 mth washout of IA treatments Per protocol analysis, n=52 | |
| Participants | Country: Italy Mean age:57 % Female:75 Mean disease duration:44% 1‐5 y Duration:60 days Number randomised:55 [57 joints:HA40 20, HA20 19, PL 18] Inclusion: knee OA on basis of clinical & radiological (Kellgren Grade 2 to 4) findings Exclusion: NR | |
| Interventions | Hyalgan 40 mg 3 weekly injections Hyalgan 20 mg 3 weekly injections Placebo = saline 2 ml 3 weekly injections Concurrent therapy: Not reported | |
| Outcomes | Spontaneous pain on 10 cm VAS, walking and under load pain on 1‐5 scale (1=none, 5=severe), pt. and MD global assessment on 1‐5 scale (1=very poor, 5=very good) | |
| Notes | Jadad's:2/5 R‐1,B‐0,W‐1 5 pt had bilateral OA ‐ knees treated at different times. A. Perbellini (Fidia S.p.A.) C. Baggio and E. Palin provided statistical analysis. A. Babolin provided secretarial assistance. | |
| Risk of bias | ||
| Bias | Authors' judgement | Support for judgement |
| Allocation concealment (selection bias) | Unclear risk | B ‐ Unclear |
Brandt 2001.
| Methods | Randomised Controlled Trial Parallel‐group Double blind Masked observer Adverse events monitor Placebo‐controlled Multicentre (n=10) 2 wk washout Per protocol analysis, n=181 Post‐hoc retrospective subgroup effectiveness population, n=135 (OR 66, PL 69) ITT (safety) | |
| Participants | Country: United States Mean age: 66 % Female: 63 Mean disease duration: NR Duration: 27 wk Number randomised: 226 (OR 114, PL 112) Inclusion: idiopathic knee OA Kellgren and Lawrence Grade 2 or 3 significant pain (WOMAC pain >= 13/20) in index knee WOMAC pain <13/20 in contra‐ lateral knee able to walk 50 ft unassisted discontinue anal‐ gesics (2 wk) and NSAIDS for 5 half‐lives not pregnant or planning a pregnancy Exclusion: contralateral knee WOMAC pain score >= 13/20 contralateral knee Kellgren and Lawrence < Grade 4 in either knee initiation of quads exercise within 4 mths oral or IM steroid use within 2 mth IA injection of HA within 21 y allergy to lidocaine clinically signifi‐ cant comorbidity (renal/hepatic) or abnormal lab tests treatment with anticoagulants, immunosuppressives or muscle relaxants inability to tolerate aceta‐ minophen Baseline values: WOMAC pain OR:16.4, PL:16.3 WOMAC stiffness OR: 7.0, PL: 6.8 WOMAC function OR: 54.8,PL:54.5 | |
| Interventions | Orthovisc 15 mg/ml 2 ml once per week 3 weekly injections plus 1% lidocaine HCI 3‐5 ml Placebo: Saline 2 ml 3 weekly injections plus 1% lidocaine HCI 3‐5 ml Concurrent therapy: acetaminophen max of 4 g/day; however not 24 hr before visit | |
| Outcomes | WOMAC pain (5‐25) pain on standing pt and investigator global assessment WOMAC stiffness (2‐10) and function (17‐85) pain after a 50 foot walk (1=none,2=mild,3=moderate,4=severe,5=extreme) time to walk 50' vital signs, labs, MedDRA adverse events | |
| Notes | Jadad's: 4/5 R‐1,B‐2,W‐1 Treated index knee exclusively Bilateral OA in 89 OR and 99 PL pts. Effectiveness population: completed minimum of 15 wks, no major protocol violations, WOMAC pain score for contra‐ lateral knee <12 Severity of contra lateral knee pain confounded out‐ come measure‐ ment in the index knee. Supported in part by a grant from Anika Thera‐ peutics, Inc. Data management and statistical analyses by Boston Bio‐ statistics, Inc. | |
| Risk of bias | ||
| Bias | Authors' judgement | Support for judgement |
| Allocation concealment (selection bias) | Low risk | A ‐ Adequate |
Brown 2003.
| Methods | Randomised Controlled Trial Parallel‐group Unblinded | |
| Participants | Country: England Mean age: NR % Female: NR Mean disease duration: NR Duration: 6 wk (Planned 6 mth) Number randomised: 54 (HA 25, GF 29) Planned: 100 (HA 50, GF 50) Inclusion: knee OA Exclusion: NR Baseline values: NR | |
| Interventions | Hyalgan 5 weekly injections Hylan G‐F 20 3 weekly injections | |
| Outcomes | WOMAC OA Index | |
| Notes | Jadad's:1/5 R‐1,B‐0 ,W‐0 Trial discontinued due to safety concerns with Hylan G‐F 20. | |
| Risk of bias | ||
| Bias | Authors' judgement | Support for judgement |
| Allocation concealment (selection bias) | Unclear risk | B ‐ Unclear |
Bunyaratavej 2001.
| Methods | Randomised Controlled Trial Double‐blind Masked observer Placebo‐controlled Multicentre (n=3) 2 wk washout of NSAIDs | |
| Participants | Countries: Thailand, Hong Kong, Malaysia Mean age: 60 % Female: 78 Mean disease duration: 33 mth Duration: 6 mth Number randomised: 49 (HA 24, PL 25) [59 screened but 10 not eligible] Inclusion: male and female patients between 50 to 75 yr of age mono or bilateral congenital or locally acquired painful OA of the knee pain on movement >40 mm on VAS scale meet clinical and radiological ACR criteria within previous 6 mth Exclusion: patients with rapid, destructive or evolving arthritis requiring surgery within the following few months patients treated with intra‐articular injection (e.g. steroids or chondroprotectives) within previous 3 mth patiens treated with NSAIDs in previous 7 days those with painful knee conditions not due to OA such as Sudeks atrophy, i‐a neoplasm, villonodular synovitis and Paget's disease and those with recent knee trauma pregnant women and women of child bearing age | |
| Interventions | Hyalgan 20 mg/ 2 ml 4 injections (Days 0, 7, 14 and 21) Saline solution 2 ml Concurrent therapy: paracetamol maximum of six 500 mg tablets daily and number taken recorded | |
| Outcomes | Pain on movement (100 mm VAS), day pain (100 mm VAS), night pain, pain on touch, joint circumference (mm), intake of paracetamol tablets (mg/day), overall efficacy judgement by patient and investigator morning stiffness joint extension | |
| Notes | Jadad's: 4/5 R‐1,B‐2,W‐1 If bilateral, only the most severely affected knee was treated. | |
| Risk of bias | ||
| Bias | Authors' judgement | Support for judgement |
| Allocation concealment (selection bias) | Unclear risk | B ‐ Unclear |
Caborn 2003.
| Methods | See Caborn 2004. | |
| Participants | ||
| Interventions | ||
| Outcomes | ||
| Notes | ||
| Risk of bias | ||
| Bias | Authors' judgement | Support for judgement |
| Allocation concealment (selection bias) | Unclear risk | B ‐ Unclear |
Caborn 2004.
| Methods | Randomised Controlled Trial Single‐blind (Blinded evaluator) Parallel‐group Multicentre (n=14) ITT analysis n=215, Safety analysis n=216, Valid for efficacy n=177 | |
| Participants | Country: United States Mean age: 63 % Female: 57 Mean disease duration: NR Duration: 26 wk Number randomised: 218 (HA 113, TH 105) Inclusion: ambulatory males and females >= 40 yrs of age in generally good health diagnosed with knee OA (ACR criteria) at least 3 mth prior to study entry, required to have been taking analgesics/ NSAIDs to control knee pain at least 3 days/wk for a minimum of 2 mth before study entry score >= 2 on Q1 of WOMAC Pain subscale at screening, score of 50‐90/100 mm VAS on both pt and investigator overall assessment, females of child‐ bearing potential required to use adequate means of contraception. Exclusion: any unstable medical condition, acute synovitis, allergy to avian products/hyaluronan‐based injection components/corticosteroid injections/acetaminophen, inflamatory arthropathy or infection in the area of the injection site, a clinical diagnosis of primarily patello‐ femoral knee pain, effusion of >10 ml at screening or baseline, venous or lymphatic statis in the leg, claudication or peripheral vascular disease, malignancy within 5 y, diabetic neuropathy or related infections, laboratory abnormalities use of glucosamine and/or chondroitin sulfate prohibited, exposure to prior viscosupplementation in target knee, oral corticosteroids or IA corticosteroid injection of a target knee within 3 mth of screening or a nontarget joint within 4 wk, pts with a history of target joint arthroplasty Baseline values: WOMAC Pain Ql: HA: 2.12 TH: 2.15 Pt VAS score: HA: 68.4 TH: 67.3 Iv VAS score: HA: 69.0 TH: 69.6 WOMAC Pain: HA: 10.7 TH: 10.4 WOMAC Stiffness: HA: 4.7 TH: 4.9 WOMAC Function HA: 38.6 TH: 37.9 WOMAC Total: HA: 54.0 TH: 53.1 % pt analgesics: HA: 98.2 TH: 97.1 | |
| Interventions | Hylan G‐F 20 (Synvisc) three weekly injections. Triamcinolone hexacetonide (Aristospan) a single ia injection of 40 mg (2 ml of a 20 mg/ml suspension). Injection approach not standardised. 18‐22 gauge needle used. Subcutaneous local anaesthetics and anaesthetic skin spray were permitted. Concurrent therapy: Medications for preexisting conditions were permitted. Except for within 24 h of study visit, the following oral pain medications were allowed: acetaminophen (up to 4000 mg/day); analgesics or short‐acting NSAID with a washout of at least 24 h (according to product labelling) for pain other than in the target knee, but not for more than 3 consecutive days or 10 days per month, and low dose aspirin (<= 325 mg/day) for antithrombotic prophylaxis. NSAID with once‐daily dose regimens were prohibited. Longer‐acting analgesics and NSAID (e.g. rofecoxib) were to be discontinued at least 7 days before baseline and not permitted during the study. | |
| Outcomes | Pain walking on a flat surface (WOMAC Pain Q1), Pt and investigator overall assessments (0‐100 mm VAS) ‐‐‐‐‐‐‐‐‐‐‐‐‐‐‐‐‐‐‐‐‐‐‐ WOMAC total score (0‐96), WOMAC pain (0‐20), WOMAC stiffness (0‐8), WOMAC physical function subscale (0‐68), use of analgesics, rate of early withdrawals, responder rate (pt improved from baseline by at least one point on WOMAC Q1 at a given visit). | |
| Notes | Jadad's:2/5 R‐1,B‐0,W‐1 If effusion present, aspirated and assessed for infection & crystals. Fourth author, D. Parenti is Asst. VP of Musculoskeletal Products, McNeil Pharmaceuticals, 5th author, C.W. Murray is Director of Musculoskeletal Products, Wyeth Pharmaceuticals. | |
| Risk of bias | ||
| Bias | Authors' judgement | Support for judgement |
| Allocation concealment (selection bias) | Unclear risk | B ‐ Unclear |
Carrabba 1995.
| Methods | Randomised Controlled Trial Double‐blind Blind observer Parallel‐group Placebo‐ and arthrocentesis‐ controlled Single centre ITT analysis (5 inj HA versus PL) | |
| Participants | Country: Italy Mean age: 60 % Female:63 Mean disease duration: NR Duration:60 days Phase 1, 6 mth Phase 2 Number randomised:100 (20/group) Inclusion: >= 40 y ACR diagnosis of knee OA clinical history of painful knee OA for > 6 mth + knee effusion (> 3 ml) pain on movement (> 40/100 mm VAS) Exclusion: generalised OA secondary knee OA known or suspected joint infection poor general health status or specific condition that would interfere with functional assessments arthrocentesis and/or IA injection within 3 mth very severe knee OA (planned intra‐medicinal product) Baseline values: pain on movement PL: 64.4, AR:64.5 HA1:61.7,HA3: 64.1,HA5: 63.3 Lequesne PL:14.5,AR:14.3 HA1:14.0,HA3: 14.9, HA5:15.0 pain at rest PL:45.6,AR:43.3 HA1:40.5, HA3: 44.7, HA5:43.6 | |
| Interventions | Hyalgan 20mg/2 ml 1 injection and arthrocentesis + 4 weekly arthrocentesis, Hyalgan 20mg/2 ml and arthro‐ centesis + 2 HA weekly injections+ 2 arthrocentesis, Hyalgan 20mg/2 ml and arthro‐ centesis + 4 HA weekly injections, Arthrocentesis=5 weekly arthrocentesis, Placebo= Arthro‐ centesis and 2 ml saline + 4 weekly saline injections Concurrent therapy: paracetamol permitted | |
| Outcomes | pain at rest by pt on 100 mm VAS pain on movement by pt on 100 mm VAS Lequesne Index ‐‐‐‐‐‐‐‐‐‐‐‐‐‐‐‐‐‐‐‐‐‐ Range of motion by goniometer (flexion) daily paracet‐ amol consumption presence joint effusion (volume) global pt and observer assessment of treatment efficacy | |
| Notes | Jadad's:3/5 R‐1,B‐1,W‐1 Effusions aspirated at Visit 1, but no aspira‐ tion at other visits except Day 35 (one wk after last injection) and 2 mth after beginning of study. Dr. G.B. Guillou and Dr. E. Maheu assisted in preparing paper. J.M. Grouin (Fidia France) provided statistical analysis. | |
| Risk of bias | ||
| Bias | Authors' judgement | Support for judgement |
| Allocation concealment (selection bias) | Unclear risk | B ‐ Unclear |
Carrabba 1995a.
| Methods | See Carrabba 1995 (HA 3 inj versus Placebo) | |
| Participants | ||
| Interventions | ||
| Outcomes | ||
| Notes | ||
| Risk of bias | ||
| Bias | Authors' judgement | Support for judgement |
| Allocation concealment (selection bias) | Unclear risk | B ‐ Unclear |
Carrabba 1995b.
| Methods | See Carrabba 1995 (HA 5 inj versus Arthrocentesis) | |
| Participants | ||
| Interventions | ||
| Outcomes | ||
| Notes | ||
| Risk of bias | ||
| Bias | Authors' judgement | Support for judgement |
| Allocation concealment (selection bias) | Unclear risk | B ‐ Unclear |
Carrabba 1995c.
| Methods | See Carrabba 1995 (HA 3 inj versus Arthrocentesis) | |
| Participants | ||
| Interventions | ||
| Outcomes | ||
| Notes | ||
| Risk of bias | ||
| Bias | Authors' judgement | Support for judgement |
| Allocation concealment (selection bias) | Unclear risk | B ‐ Unclear |
Cohen 1994.
| Methods | Randomised Controlled Trial Double‐blind Blinded assessor Placebo‐ controlled Multicentre (n=4) | |
| Participants | Country: Canada and USA Mean age: NR % Female: NR Mean disease duration: NR Duration: 8 wk Number randomised: (HA 19, PL 20) Inclusion: NR Exclusion: NR Baseline values: NR | |
| Interventions | Replasyn/ Hyalgan (20 mg) 3 weekly injections Placebo (not specified) | |
| Outcomes | Knee pain when walking (100 mm VAS), Range of motion, WOMAC OA functional Index, Pt and MD overall global | |
| Notes | Jadad's:4/5 No baseline differences between groups. Supported by a grant from Bioniche Pharm‐ aceuticals, London, ON, Canada. | |
| Risk of bias | ||
| Bias | Authors' judgement | Support for judgement |
| Allocation concealment (selection bias) | Unclear risk | B ‐ Unclear |
Corrado 1995.
| Methods | Randomised Controlled Trial Double‐blind Efficacy analysis: per protocol n=35, tolerance analysis, ITT | |
| Participants | Country: Italy Mean age:61 % Female:78 Mean disease duration: Duration:60 days Number randomised:40 (PL 19 / HA 21) Inclusion: >40 y clinically & radio‐ logically OA knee (Altman criteria) of at least 6 mth duration >= 3 ml effusion pain on movement >40 mm on VAS Exclusion: NR Baseline values: pain on movement PL:62.3, HA:68.7 pain at rest PL:16.8, HA:22.8 flexion PL:113.3, HA:114.7 | |
| Interventions | Hyalgan 20 mg/2 ml after arthro‐ centesis at baseline 5 weekly injections, Placebo=0.2mg/2 ml (2 ml water with 17 mg sodium chloride, 0.1 mg monobasic sodium phosphate, 1.2 mg bibasic sodium phosphate) 5 weekly injections Concurrent therapy: no painkillers during treatment | |
| Outcomes | pain on movement (100 mm VAS)‐‐‐‐‐‐‐‐‐‐‐ pain at rest (VAS) joint mobility on flexion efficacy of treatment by pt and MD on 5 point scale (0=none,1=poor,2=fair,3=good,4=excellent) volume of joint effusion immunological and biochemical evaluations | |
| Notes | Jadad's:3/5 R‐1,B‐1,W‐1 All pts had effusion at baseline | |
| Risk of bias | ||
| Bias | Authors' judgement | Support for judgement |
| Allocation concealment (selection bias) | Unclear risk | B ‐ Unclear |
Creamer 1994.
| Methods | Randomised Controlled Trial Single‐blind Blind observer Parallel‐group Single centre Each pt own control ITT analysis | |
| Participants | Country: England Mean age:72 % Female:100 Mean disease duration:22 y Duration:9 wk Number randomised:12 (HA 12 knees, PL 12 knees) Inclusion: use‐related pain in both knees no steroid injection at least 3 mths prior to study xray evidence of OA (joint space narrowing + sclerosis or osteophytosis, Kellgren and Lawrence Grade 2 to 4) presence of bi‐ lateral synovial effusions as judged clinically Exclusion: NR Baseline values: rest pain HA:10/12, PL: 10/12 night pain HA:7/12, PL:9/12 EMS HA:10, PL:6 min Inactivity stiffness HA:4.1,PL:4.0min | |
| Interventions | Hyalgan (20mg/2 ml) 5 weekly injections Placebo= 2 ml saline 5 weekly injections Concurrent therapy: paracetamol 4000 mg daily permitted | |
| Outcomes | use‐related pain (100 mm VAS) rest and night pain (present/absent) duration of early morning stiffness and inactivity stiffness pt opinion of disease severity (none,mild,moderate,severe) pt choice of worse knee pt preferred treatment pt overall change in each knee Synovial fluid keratan sulfate RF, CRP, plasma viscosity, chondroitin sulfate 3B3, CPII | |
| Notes | Jadad's:2/5 R‐1,B‐0,W‐1 All bilateral knee OA with effusions synovial fluid aspirated prior to each injection Wk 0‐4 max 5ml Wk 5 and 9 aspira‐ ted to dryness. Study not designed to assess clinical efficacy (cf small patient numbers and advanced disease) Work was partially supported by a grant from Fidia SpA. | |
| Risk of bias | ||
| Bias | Authors' judgement | Support for judgement |
| Allocation concealment (selection bias) | Unclear risk | B ‐ Unclear |
Cubukcu 2004.
| Methods | Randomised Controlled Trial Placebo controlled Single centre | |
| Participants | Country: Turkey Mean age: 55.1 % Female: 80 Mean disease duration: 2.25 y Duration: 8 wk Number randomised: 30 (HA 20 (30 knees), PL 10 (10 knees)) Inclusion: fulfill ACR criteria for knee OA with radiological evidence and symptoms knee pain persisting for more than one year and pain >40/100 (VAS) for more than 15 days in the last month Exclusion: any other serious systemic diseases, depression, avian allergy, other arthropathies, neoplasms, recent trauma, knee instability, effusion in the knee, a varus or valgus deformity of >15 degrees, flexion contracture of >20 degrees, had received intraarticular corticosteroids within the 6 mth prior to start of study Baseline values: Walking pain HA: 71.0, PL: 67.0 Night pain HA: 45.0 PL: 54.0 Rest pain HA: 46.7 PL: 51.0 Need for paracetamol HA: 1.0 PL: 0.9 WOMAC pain HA: 15.7 PL: 17.6 WOMAC stiffness HA: 6.3 PL: 6.1 WOMAC function HA: 49.6 PL: 47.8 15 m walk time HA: 20.6 PL: 17.9 | |
| Interventions | Hylan G‐F 20 (2 ml 10 mg/ml) (Synvisc) 3 weekly injections, Saline 2 ml 3 weekly injections Both medial approach, after injection, knees wrapped with bandage and patients instructed to rest for 24h. Concurrent therapy: Paracetamol permitted for analgesia. No additional physiotherapy or anti‐inflammatory drugs. | |
| Outcomes | Pain at rest, at night and on walking (0‐100 mm VAS), WOMAC pain (5‐25), WOMAC stiffness (2‐10), WOMAC physical function (17‐85), walking time for 15 m, need for paracetamol, evaluation of treatment by patient (1=treatment is not effective, 2=less effective, 3=effective, and 4=very effective) | |
| Notes | Jadad's: 2/5 R‐1, B‐0, W‐1 If bilateral, both knees injected. | |
| Risk of bias | ||
| Bias | Authors' judgement | Support for judgement |
| Allocation concealment (selection bias) | Unclear risk | B ‐ Unclear |
Day 2001.
| Methods | See Day 2004 | |
| Participants | ||
| Interventions | ||
| Outcomes | ||
| Notes | ||
| Risk of bias | ||
| Bias | Authors' judgement | Support for judgement |
| Allocation concealment (selection bias) | Unclear risk | B ‐ Unclear |
Day 2004.
| Methods | Randomised Controlled Trial Double‐blind Parallel‐group Multicentre (n=17) 1 wk washout Efficacy analysis: both per protocol n=208, modified ITT n=223 Safety analysis: ITT, n=223 | |
| Participants | Country: Australia Mean age: 62 % Female: 56 Mean disease duration: NR Duration:18 wk Number randomised:240 (HA ‐ 116, PL 124) Inclusion: 40‐75 y BMI < 40 appropriate contraception mild to moderate idiopathic painful femoro‐tibial OA knee defined by: knee pain while standing, walking and/or in motion of at least 3 mth duration, >=1 features on xray in past 6 mth: femoro‐tibial, osteophytes, osteosclerosis of femoral or tibial endplates or JSN unilateral or predominantly unilateral symptomatology informed written consent willing to discontinue current OA treatment for study Exclusion: pregnant and lactating females severe malalignment of knee severe, tight effusion clinical manifestations of OA of the hip and/or history of joint replacement in lower extremities history of surgery on knee within last 12 mth or arthroscopy within last 6 mth IA injection or treatment with long‐acting OA therapy in previous 3 mth Baseline values: WOMAC pain HA: 7.96 PL: 8.68 WOMAC function HA: 28.07 PL: 31.25 WOMAC stiffness HA: 3.70 PL: 3.79 | |
| Interventions | Artz (25mg/2.5 ml) 5 weekly injections local anesthesia 1% xylocaine, Placebo= phosphate buffered saline vehicle (2.5 ml) 5 weekly injections Concurrent therapy: paracetamol, standard physical therapy exercises permitted | |
| Outcomes | WOMAC ‐‐‐‐‐‐‐‐‐‐‐ Lequesne Index knee examination (4 point categorical scale for pain, stiffness, effusion and range of motion) pt and MD global assessment paracetamol consumption | |
| Notes | Jadad's:5/5 R‐2,B‐2,W‐1 Bilateral disease in 66% Artz and 64% PL. Effusions were aspirated. Work was supporated by Seikagaku Corporation. Test medications provided by Seikagaku. A CRO, Omnicare Clinical Research, was responsible for management, monitoring and safety reporting of study. Study statistician was Dr. Philip McCloud and associates of the Monash University Statistical Consuting Group. | |
| Risk of bias | ||
| Bias | Authors' judgement | Support for judgement |
| Allocation concealment (selection bias) | Unclear risk | B ‐ Unclear |
Dickson 2001.
| Methods | Randomised Controlled Trial Double‐blind Blind observer Screen blinded patient Parallel‐group Multicentre (n=18) 3‐7 day washout Efficacy analysis: both ITT n=165 and per protocol n=134 Safety analysis: ITT | |
| Participants | Country: England and Scotland Mean age:63 % Female:53 Mean disease duration:NR Duration:12 wk Number randomised:165 (HA ‐ 53, DI ‐ 55, CN ‐ 57) Inclusion: 35‐80 y radiologically confirmed knee OA (tibofemoral compartment) and no other OA joint likely to warrant escape analgesia knee had to be most painful joint xray report <2 y end of washout 2/5 WOMAC pain >40/100 mm VAS Exclusion: bed ridden pts pts in wheelchair or unable to walk 50 steps unaided other jt disease clinically significant renal, hepatic or haematological disorders any contraindication to study treatments Baseline values: WOMAC pain HA:59, DI:61, CN:58 WOMAC function HA: 54, DI: 56, CN: 56 Lequesne HA: 13.9, DI: 13.9 CN: 14.5 | |
| Interventions | Hylan G‐F 20 (2 ml) 3 weekly injections+arthro‐ centesis + placebo capsules od Diclofenac retard 100 mg od + arthrocentesis Control: Arthro‐ centesis + placebo capsules od Concurrent therapy: paracetamol 3000 mg daily permitted | |
| Outcomes | WOMAC pain subscale‐‐‐‐‐‐‐‐‐‐‐ WOMAC stiffness and function Lequesne Index pt. and blinded observer overall opinion of treatment (5‐pt verbal scale:very poor, poor, fair, good,very good) Assessments: Wk 0,1,2,4,8,12 | |
| Notes | Jadad's:4/5 R‐1,B‐2,W‐1 17 bilateral injections target knee Arthrocentesis removing all joint fluid in all 3 groups. At end of 12 DBRCT, patients could enter an open label one‐year extension study in which they could receive up to four repeat courses of Hylan G‐F 20. Syntex Pharma‐ ceuticals Ltd. and Roche Products Ltd provided financial support. Biomatrix, Inc. supplied hylan G‐F 20 and Dr. Arnold Goldman provided statistical analysis. | |
| Risk of bias | ||
| Bias | Authors' judgement | Support for judgement |
| Allocation concealment (selection bias) | Unclear risk | B ‐ Unclear |
Dougados 1993.
| Methods | Randomised Controlled Trial Single‐blind Parallel‐group Multicentre Placebo‐ controlled Efficacy analysis: per protocol n=95, ITT done to check consistency of per protocol | |
| Participants | Country: France Mean age: 68 % Female:71 Mean disease duration: Duration: 1 y Number randomised:110 (HA 55, PL 55) Inclusion: ACR criteria for knee OA Femorotibial localisation of disease + knee effusion painful knee (>= 40/100 mm VAS) stable dose of OA therapy for 3 mth NSAID, analgesics, physiotherapy stable for one mth Exclusion: serious concomitant illness secondary OA of knees by ACR knee with prothesis any IA surgery of evaluated knee, menisectomy in 10 y prior any extra‐articular surgery of evaluated knee, osteotomy last 2 y arthrocentesis of evaluated knee in previous 3 mth Baseline values: Lequesne HA:11.6, PL:10.9 Pain at rest HA:31.4, PL:28.0 Pain after exercise HA:67.6, PL:61.9 | |
| Interventions | Hyalgan (20 mg/2ml) 4 weekly injections Placebo:saline vehicle (2 ml) 4 weekly injections Concurrent therapy: previous treatment continued at same dose schedule; between Wks 7‐52, corticosteroid injection, SF aspira‐ tion, total knee re‐ placement allowed | |
| Outcomes | degree of inflam‐ mation by presence and amount of synovial fluid effusion by arthrocentesis‐‐‐‐ pain at rest and after exercise on 100 mm VAS Lequesne Index overall pt and MD assessment requirement for local therapies between Wk 7 & Wk 52 (number and time) | |
| Notes | Jadad's:2/5 R‐1,B‐0,W‐1 The MD who did injection was also the assessor and therefore may not have remained blind. Dr. G.B. Buillou and J.M. Grouin (Fidia, France) provided statistical analysis. Helpful assistance from: V. Figeac, C. Strauss, C. Kubiak, and N. Chevalier. | |
| Risk of bias | ||
| Bias | Authors' judgement | Support for judgement |
| Allocation concealment (selection bias) | Unclear risk | B ‐ Unclear |
Formiguera Sala 1995.
| Methods | Randomised Controlled Trial Double‐blind Placebo‐ controlled Single centre Washout ITT analysis | |
| Participants | Country: Spain Mean age: 62 % Female:73 Mean disease duration: Duration:90 days Number randomised:36 [40 jts: HA 20, PL 20] Inclusion: adult pt. with mono or bilateral knee OA painful limitation of movement narrowing of femorotibial space and osteophytes, subchondral sclerosis or cysts Exclusion: secondary knee OA nonarthritic arthropathies large volume of joint effusion severe systemic diseases pregnancy or lactation inexplicable biochemical or haematological abnormalities | |
| Interventions | Hyalgan (20mg/2ml) 5 weekly injections Placebo: saline (2 ml) 5 weekly injections Concurrent therapy: not reported | |
| Outcomes | pain on walking‐‐ spontaneous pain, pain on load, pain on palpation:100 mm VAS active and passive flexion in degrees pt and MD overall judgement on evolution of disease standard severity scale (0‐25) for level of pain, max distance walked and activities of daily living | |
| Notes | Jadad's:3/5 R‐1,B‐1,W‐1 Most cases "dry" knees. 4 pts bilateral knee OA with second knee treated some time after first | |
| Risk of bias | ||
| Bias | Authors' judgement | Support for judgement |
| Allocation concealment (selection bias) | Unclear risk | B ‐ Unclear |
Forster 2003.
| Methods | Randomised Controlled Trial Single centre Parallel‐group | |
| Participants | Country: England Mean age: 62 % Female: NR Disease duration: NR Duration: 1 yr Number randomised: 38 (HA 19, AR 19) Inclusion: Symptomatic knee OA with radiographic evidence of some remaining joint space on weight bearing films Be fit for regional or general anaesthesia. Exclusion: Pts with mechanical symptoms IA injection within last 6 mths Previous arthro‐ scopic surgery Hypersensitivity to avian proteins Baseline: Pain HA: 7.6 AR: 7.5 Lequesne HA: 10.5 AR: 13.0 Knee Society ftn: HA: 65 AR: 45 | |
| Interventions | Hyalgan 20 mg 5 weekly injections Arthroscopic washout with either general or spinal anaesthesia 2 l 0.9% saline at least | |
| Outcomes | Pain (10 cm VAS) Function score from the Knee Society rating system Lequesne | |
| Notes | Jadad's:3/5 R‐2,B‐0,W‐1 The Knee Society function score was significantly worse in the AR group at baseline. | |
| Risk of bias | ||
| Bias | Authors' judgement | Support for judgement |
| Allocation concealment (selection bias) | Low risk | A ‐ Adequate |
Forster 2003a.
| Methods | See Forster 2003 | |
| Participants | ||
| Interventions | ||
| Outcomes | ||
| Notes | ||
| Risk of bias | ||
| Bias | Authors' judgement | Support for judgement |
| Allocation concealment (selection bias) | Low risk | A ‐ Adequate |
Frizziero 2002.
| Methods | Randomised Controlled Trial Single‐blind Blinded assessor for arthroscopic assessment. Parallel‐group Single centre | |
| Participants | Country: Italy Mean age: 50 % Female: 53 Mean disease duration: 25 mth Duration: 6 mth Number randomised: 99 (HA 52, MP 47) Inclusion: Outpatient re‐ ferred to Rheumatology Unit for OA over a 3 yr period Primary OA or OA secondary to traumatic events to the knee. Kellgren and Lawrence Grades I to III Fulfill clinical and radiological criteria of ACR Exclusion: Pt judged not controllable or unreliable. Presence of severe concom‐ itant diseases, suspected joint infection. Concomitant treatment with NSAID IA steroid treatment in previous 3 mth Pregnancy and breast feeding Baseline: Pain after spontaneous movement: HA: NR MP: NR Pain after forced movement HA: NR MP: NR | |
| Interventions | Hyalgan (20 mg/2ml) 5 weekly injections Methylpredniso‐ lone acetate 3 weekly injections | |
| Outcomes | Noctural pain, pain at rest, pain on spontan‐ eous or forced movement, pain on touch (all on 100 mm VAS) morning stiffness (min), joint motion (max active flexion/extension) pt and MD opinion of efficacy (0=poor (unsatisfactory), 1=scarce,2=fair, 3=good,4=excel‐ lent) use of analgesic or NSAID cartilage damage (modified version of the Outer‐ bridge & Noyes scales): degree of cartilage damage (5 point scale) and extent of cartilage lesions (6 point scale) | |
| Notes | Jadad's:4/5 R‐2,B‐1,W‐1 When OA was bilateral, most severely affected knee selected for treatment. | |
| Risk of bias | ||
| Bias | Authors' judgement | Support for judgement |
| Allocation concealment (selection bias) | Low risk | A ‐ Adequate |
Graf 1993.
| Methods | Randomised Controlled Trial Single‐blind Parallel‐group Verum‐ controlled ITT analysis | |
| Participants | Country: Germany Mean age: NR % Female:55 Mean disease duration: Duration: 6 mth Number randomised:60 (HA 33, MPA 27) Inclusion: outpatients >= 18 y clinical & radiological signs of OA written informed consent Exclusion: radiographically no cartilage lesions arthropathy other than OA tubercular osteopathy peripheral neuropathy with pain severe, decompensated concomitant disease pregnant/nursing recd IA corticosteroids in last 3 mth or NSAID within 14 days Baseline values: pain HA: 14.1, MPA: 16.2 function HA: 18.0, MPA: 16.9 ROM HA: 8.8, MPA: 8.7 Larson HA: 45.7, MPA: 46.6 | |
| Interventions | Hyalgan (20mg/2ml) once a wk for 6 wk ‐ 7 injections Mucopolysacchar‐ ide polysulfuric acid ester (MPA) 50mg/1 ml twice/wk ‐ 13 injections over 6 weeks Concurrent therapy: no additional anal‐ gescis, NSAIDS, physical therapy | |
| Outcomes | Larson rating scale shortened (77 points:pain severity (0‐30), ROM (0‐10), function (0‐30), anatomy (0‐7)) extension deficit crepitation ligament loosening extensor & flexor muscle strength pt & MD global: unchanged, slightly improved, significantly improved, and symptom‐free | |
| Notes | Jadad's:2/5 R‐1,B‐0,W‐1 | |
| Risk of bias | ||
| Bias | Authors' judgement | Support for judgement |
| Allocation concealment (selection bias) | Unclear risk | B ‐ Unclear |
Grecomoro 1987.
| Methods | Randomised Controlled Trial Double‐blind Parallel‐group Placebo‐ controlled Single centre, ITT analysis | |
| Participants | Country: Italy Mean age:65 % Female:56 Mean disease duration: NR Duration:60 days Number randomised:34 [40 jts: HA 20, PL 20] Inclusion: gonarthrosis pain with clinical signs, e.g. limitation of joint function and of unaided walking Exclusion: NR | |
| Interventions | Hyalgan (20mg/2ml) 3 weekly injections Placebo: phosphate buffer 2 ml 3 weekly injections Concurrent therapy: not reported | |
| Outcomes | spontaneous pain intensity VAS ‐‐‐‐‐‐‐‐‐‐‐‐‐‐‐‐‐ pain on touch pain under load pain while walking (1=none, 2=mild,3=moder‐ ate,4=severe,5= very severe) | |
| Notes | Jadad's:3/5 R‐1,B‐1,W‐1 6 pts had bilateral disease each knee ran‐ domised | |
| Risk of bias | ||
| Bias | Authors' judgement | Support for judgement |
| Allocation concealment (selection bias) | Unclear risk | B ‐ Unclear |
Groppa 2001.
| Methods | Blind Controlled Trial | |
| Participants | Country: Republic of Moldova Mean age: 61 % Female: 64 Mean disease duration: 5.8 y Duration: 1 y Number randomised: 25 (HA ‐?, PL‐?) Inclusion:NR Exclusion:NR Baseline values: NR | |
| Interventions | Hylan G‐F 20 3 weekly injections Placebo 3 weekly injections Repeat courses given at 6 and 12 months. | |
| Outcomes | Pain Lequesne Volume of movement on affected joints xray parameters functional methods (US, scintigraphy with Te99m) | |
| Notes | Jadad's:1/5 R‐0,B‐1,W‐0 | |
| Risk of bias | ||
| Bias | Authors' judgement | Support for judgement |
| Allocation concealment (selection bias) | Unclear risk | B ‐ Unclear |
Guler 1996.
| Methods | Randomised Controlled Trial Double‐blind Placebo‐ controlled Parallel‐group ITT analysis | |
| Participants | Country: Turkey Mean age: NR % Female: NR Mean disease duration: NR Duration: 10 wk Number randomised: 30 (HA 15, PL 15) Inclusion: Exclusion: Baseline values: WOMAC pain HA: 16.87 WOMAC stiffness HA: 6.47 WOMAC function HA: 59.00 | |
| Interventions | Orthovisc 15 mg/ml 2 ml once per week for 3 weeks Placebo: physiologic saline 2 ml Concurrent therapy: acetaminophen use recorded | |
| Outcomes | WOMAC pain(5‐25), stiffness (2‐10) function (17‐85) ‐‐‐‐‐‐‐‐‐‐‐‐‐‐‐‐‐‐‐‐‐‐‐ quantity of acetaminophen use time for 15 meter walk range of joint mobility patella ciricumference pt assessment of degree of arthrosis satisfaction with treatment | |
| Notes | Jadad's: 3/5 R‐1,B‐1,W‐1 | |
| Risk of bias | ||
| Bias | Authors' judgement | Support for judgement |
| Allocation concealment (selection bias) | Unclear risk | B ‐ Unclear |
Henderson 1994.
| Methods | Randomised Controlled Trial Double‐blind Blinded metrologist Parallel‐group Placebo‐ controlled Single centre, 2 wk washout Per protocol analysis: n=84 | |
| Participants | Country: England Mean age: 65 % Female: 69 Mean disease duration:NR Duration:5 mth Number randomised:91 (HA 45, PL 46) Inclusion: clinical history of knee OA radiological evidence of knee OA (Kellgren and Lawrence 1‐4) pain in at least one knee >= 30 mm on a VAS for at least 1/5 activities in prior 2 wk Exclusion: pts with inflammatory bowel disease, anserine bursitis or pain referred from other structures (e.g. ipsilateral hip or lumbar spine) Baseline values: pain on active movement HA: mild 43.7 moderate 48.5 PL: mild 53.0 moderate 49.3 pain at rest HA: mild 20.8 moderate 25.2 PL: mild 30.3 moderate 38.9 | |
| Interventions | Hyalgan (20mg/2ml) 5 weekly injections Placebo:saline 2 ml 5 weekly injections Concurrent therapy: paracetamol permitted | |
| Outcomes | daily VAS pain in the am, pm, getting up from chair, climbing stairs, painful activity, at rest for 20 min, active and passive movement, patellofemoral tenderness, flexion by goniometer, morning stiffness (min), interference with activity of daily living, escape analgesia count, pt and metrologist global assessment | |
| Notes | Jadad's:5/5 R‐2,B‐2,W‐1 Most affected knee studied. 90 pts had bilateral disease Effusions aspirated to dryness Stratification by xray severity | |
| Risk of bias | ||
| Bias | Authors' judgement | Support for judgement |
| Allocation concealment (selection bias) | Unclear risk | B ‐ Unclear |
Henderson 1994a.
| Methods | See Henderson 1994 (severity group 2) | |
| Participants | ||
| Interventions | ||
| Outcomes | ||
| Notes | ||
| Risk of bias | ||
| Bias | Authors' judgement | Support for judgement |
| Allocation concealment (selection bias) | Unclear risk | B ‐ Unclear |
Hizmetli 1999.
| Methods | Randomised Controlled Trial Double‐blind Placebo‐ controlled 2 wk washout Per protocol analysis (n=40) | |
| Participants | Country: Turkey Mean age: 56 % Female: 68 Mean disease duration: Duration: 1 yr Number randomised: 50 (HA 25, PL 25) Inclusion: knee OA according to ACR criteria Kellgren and Lawrence Grades 1 and 2 Exclusion: pts who had undergone extra‐ or intra‐articular surgery, arthrocentesis & physical therapy Baseline values: WOMAC pain HA: 17.75 PL: 17.45 WOMAC stiffness HA:5.65, PL:5.55 WOMAC function HA:53.15, PL:52.00 | |
| Interventions | Hyaluronic acid 2 ml Placebo: sterile physiological saline 2 ml Injections done on 1st,2nd,3rd wks one wk apart and a 4th injection at 6 mth Concurrent therapy: no analgesics, NSAIDs, steroids first 4 wks of study | |
| Outcomes | WOMAC pain (5‐25) stiffness (2‐10) function (17‐85) | |
| Notes | Jadad's: 4/5 R‐1,B‐2,W‐1 clinical evaluation and injection done by 2 different researchers Although report states that WOMAC mean and sd are presented in tables, wonder if the sd is really se due to their small values. | |
| Risk of bias | ||
| Bias | Authors' judgement | Support for judgement |
| Allocation concealment (selection bias) | Unclear risk | B ‐ Unclear |
Huang 2005.
| Methods | Randomised Controlled Trial Single‐blind Single centre Blinded physiatrists | |
| Participants | Country: Taiwan Mean age: 65.0 % Female: 80.7 Mean disease duration: range 5 mth to 12 y Duration: 1 y Number randomised: 140 (35 in each of 4groups) Inclusion: patients with bilateral moderate knee OA (Altman grade II) Exclusion: Not reported Baseline values: Range of motion EX: 103 EX+US: 104 EX+US+HA: 103 CT: 101 Pain (10 cm VAS) EX: 5.3 EX+US: 5.5 EX+US+HA: 5.6 CT: 5.4 Lequesne Index EX: 7.6 EX+US: 7.4 EX+US+HA: 7.5 CT: 7.4 Ambulation speed (metres/minute) EX: 72.6 EX+US: 71.3 EX+US+HA: 72.4 CT: 73.9 Mean peak torque at 60 degrees/second EX: 230.4 EX+US: 232.7 EX+US+HA: 230.4 CT: 229.3 Mean peak torque at 180 degrees/second EX: 181.5 EX+US: 183.3 EX+US+HA: 180.1 CT: 182.3 | |
| Interventions | 1) EX: isokinetic muscular strengthening exercises, 2) EX+US: isokinetic exercise and pulse ultrasound treatment for painful periarticular soft tissue, 3) EX+US+HA: isokinetic exercise, pulse ultrasound treatment for painful periarticular soft tissue and intra‐ articular Hyalgan 20 mg/2ml 5 weekly injections, 4) CT: no treatment other than warmup exercises. Patients received treatments 3 times weekly for 8 weeks. Patients in all groups received a warmup exercise with 20 minutes of hot packs and underwent passive range of motion exercises on an electric stationary bike (20 cycles per minute) for 5 minutes to both knees before undergoing muscle strengthening exercises. Concurrent therapy: None reported. | |
| Outcomes | Active range of motion (standardised method for flexion, extension, excursion range), Pain severity by 10 cm VAS (0=no pain, 10=maximum pain) after patient had remained in a weight‐bearing position (walking or standing) for 5 minutes, Disability by the Lequesne Index (score: 1‐3 mild dysfunction, less than 7 functional status acceptable for isokinetic exercise, maximum score 26), Ambulation speed ‐ 50 metres on treadmill at self‐selected pace ‐ walking time, Muscle peak torque of knee flexion and extension with an isokinetic dynamometer | |
| Notes | Jadad's: 3/5 R‐2, B‐0, ‐1 Supported by a project grant from the National Science Counil of Taiwan. | |
| Risk of bias | ||
| Bias | Authors' judgement | Support for judgement |
| Allocation concealment (selection bias) | Low risk | A ‐ Adequate |
Huskisson 1999.
| Methods | Randomised Controlled Trial Blind observer Parallel‐group Placebo‐ controlled Single centre, Principal efficacy criteria: ITT all other efficacy: per protocol n=81 | |
| Participants | Country: England Mean age: 65 % Female: 67 Mean disease duration: NR Duration:6 mth Number randomised:100 (HA 50, PL 50) Inclusion: fully ambulant mono or bilateral knee OA Grade 2 to 3 Kellgren and Lawrence within 6 mth prior consistent pain for 3 mth prior moderate or severe pain on walking at screen and baseline visits Exclusion: Grade 4 Kellgren and Lawrence serious functional impair‐ ment at knee associated OA of hip that interferes with knee assessment OA of any other jt that affect knee assessment psoriasis radiographic evidence of sacroilitis or any other joint disease other than OA known or suspected jt infection poor general health or other conditions preventing hospital attendance skin conditions overlying jt affecting injection painful knee conditons other than OA severe hepatic or renal disease or major medical conditions use of IA steroid or radiocolloid within 3 mth Baseline values: pain on walking HA:65.8, PL:61.9 Lequesne HA:13.4, PL:14.0 | |
| Interventions | Hyalgan (20mg/2 ml) 5 weekly injections Placebo: saline 2 ml 5 weekly injections Concurrent therapy: Existing analgesic & NSAID continued as considered appro‐ priate by referring physician | |
| Outcomes | pain on walking (100 mm VAS) Lequesne ‐‐‐‐‐‐‐‐‐ knee pain at rest (100 mm VAS) joint tenderness, swelling (4 point: none,mild,mod‐ erate, severe) am stiffness, in‐ activity stiffness (min), pt. global impression (excellent, fair, poor, useless) satisfaction index | |
| Notes | Jadad's:4/5 R‐1,B‐2,W‐1 Effusions aspirated | |
| Risk of bias | ||
| Bias | Authors' judgement | Support for judgement |
| Allocation concealment (selection bias) | Unclear risk | B ‐ Unclear |
Jones 1995.
| Methods | Randomised Controlled Trial Double‐blind Parallel‐group Both per protocol and ITT analyses | |
| Participants | Country: England Mean age:71 % Female:62 Mean disease duration: NR Duration:6 mth Number randomised:63 (HA 32, TH 31) Inclusion: bilateral effusions bilateral sympto‐ matic knee OA (ARA criteria) self‐selected knee pain average of >30 mm during 2 wk run‐in Exclusion: Coexistent rheumatological or serious medical disease Baseline values: pain on nomina‐ ted activity HA:77.2, TH:75.8 pain at rest HA:53.2, TH:55.3 pain at night HA:57.8, TH:62.2 | |
| Interventions | Hyalgan (20mg) 5 weekly injections Triamcinolone hexacetonide 20 mg followed by 4 placebo (1 ml of 0.9% saline) injections Concurrent therapy: Paracetamol per‐ mitted | |
| Outcomes | pain on self‐selected activity (10 cm VAS)‐‐‐‐‐‐‐‐‐‐‐‐‐‐‐‐‐ pain at rest, night duration of stiffness range of motion joint effusion local heat synovial thickening joint line and periarticular tenderness xray score synovial fluid volume | |
| Notes | Jadad's:4/5 R‐1,B‐2,W‐1 Active treatment was always given to worse knee with contra‐ lateral knee re‐ ceiving 5 placebo injections Joint aspirated to dryness before injection. Study sponsored by Fidia SPA. Drs. B. Guillou and J.M. Grouin of Fidia S.p.A. provided statistical analysis. | |
| Risk of bias | ||
| Bias | Authors' judgement | Support for judgement |
| Allocation concealment (selection bias) | Unclear risk | B ‐ Unclear |
Jubb 2001a.
| Methods | See Jubb 2003 | |
| Participants | ||
| Interventions | ||
| Outcomes | ||
| Notes | ||
| Risk of bias | ||
| Bias | Authors' judgement | Support for judgement |
| Allocation concealment (selection bias) | Unclear risk | B ‐ Unclear |
Jubb 2001b.
| Methods | See Jubb 2003 | |
| Participants | ||
| Interventions | ||
| Outcomes | ||
| Notes | ||
| Risk of bias | ||
| Bias | Authors' judgement | Support for judgement |
| Allocation concealment (selection bias) | Unclear risk | B ‐ Unclear |
Jubb 2001c.
| Methods | See Jubb 2003 | |
| Participants | ||
| Interventions | ||
| Outcomes | ||
| Notes | ||
| Risk of bias | ||
| Bias | Authors' judgement | Support for judgement |
| Allocation concealment (selection bias) | Unclear risk | B ‐ Unclear |
Jubb 2001d.
| Methods | See Jubb 2003 | |
| Participants | ||
| Interventions | ||
| Outcomes | ||
| Notes | ||
| Risk of bias | ||
| Bias | Authors' judgement | Support for judgement |
| Allocation concealment (selection bias) | Unclear risk | B ‐ Unclear |
Jubb 2003.
| Methods | Randomised Controlled Trial Double‐blind Masked‐observer Placebo controlled Parallel group Multicentre (n=17) Primary analysis population n=273 ITT for safety n=408 | |
| Participants | Country: England Mean age: 64 % Female: 68 Mean disease duration: 8 y Duration: 1 y Number randomised: 408 (HA 208, PL 200) Inclusion: primary OA of the knee by ACR criteria, grade II or III Kellgren and Lawrence in medial tibiofemoral compartment Exclusion: OA of the hip or other joint disease severe enough to prevent assess‐ ment of knee, psoriasis, sacro‐ ilitis, other joint disease, known or suspected joint infection, disease of skin overlying knee joint that prevented injections, other painful knee conditions or severe concurrent illnesses, ia corticosteroid or radiocolloid treatment in 3 mths before study or ia or new/rearrange‐ ment surgical procedures on legs, evidence of clinically important axial deviation of the legs (valgus or varus deformities), history of allergic reactions to avian proteins, pregnant or breast‐feeding Baseline values: JSW HA: 4.9 PL: 4.5 JSW>=4.6 mm HA: 5.9 PL: 5.9 JSW<4.6 mm HA: 3.5 PL: 3.4 | |
| Interventions | Hyalgan (20 mg/2 ml) 3 weekly injections Placebo: saline Course was repeated twice more at four‐monthly intervals. Concurrent therapy: Free concomitant use of analgesics and NSAIDs, except indomethacin, was allowed but regimens had to be stable for at least one month before study entry. Concurrent treatment with corticosteroids, glucosamine or chondroitin sulphate was not permitted. | |
| Outcomes | Mean joint space width at 52 wk by computerised DIA‐‐‐‐‐‐‐‐‐‐‐‐‐‐‐‐‐‐‐ pain on walking (VAS), knee pain (6 point categorical scale), Pt and investigator global impression of efficacy (5 point categorical scale), Lequesene Index, SF‐36 | |
| Notes | Jadad's:4/5 R‐1,B‐2,W‐1 If bilateral OA, more painful knee was treated. Subgroups defined by joint space wideth >= or <4.6 mm at baseline. The trial was supported by a grant from Fidia SpA, Abano Terme, Italy. Second and third authors are affiliated with Sponsor. | |
| Risk of bias | ||
| Bias | Authors' judgement | Support for judgement |
| Allocation concealment (selection bias) | Unclear risk | B ‐ Unclear |
Kahan 2001.
| Methods | See Kahan 2003a | |
| Participants | ||
| Interventions | ||
| Outcomes | ||
| Notes | ||
| Risk of bias | ||
| Bias | Authors' judgement | Support for judgement |
| Allocation concealment (selection bias) | Unclear risk | D ‐ Not used |
Kahan 2003.
| Methods | See Kahan 2003a | |
| Participants | ||
| Interventions | ||
| Outcomes | ||
| Notes | ||
| Risk of bias | ||
| Bias | Authors' judgement | Support for judgement |
| Allocation concealment (selection bias) | Unclear risk | D ‐ Not used |
Kahan 2003a.
| Methods | Randomised Controlled Trial Open‐label Parallel‐group Multicentre (n=81) Stratified Effectiveness | |
| Participants | Country: France Mean age: 66 % Female: 68 Mean disease duration: 5.9 y Duration: 9 mth Number randomised: 518 (HA 258, CT 260) Inclusion: >18 y of age predominantly femorotibial OA meeting ACR criteria pain upon walking >= 40/ 100 mm VAS had to have received at least 2 courses of NSAID therapy each at least 10 d long within the last 3 mth and/or a symptomatic slow‐acting drug taken continu‐ ously during the last 2 mth Exclusion: inflammatory flare in the target knee (effusion with nocturnal pain, local heat or redness, morning stiffness for longer than 45 min or greater than 50% increase in the VAS pain score as compared to the previous wk viscosupple‐ mentation in the target knee within the last 3 mth, ia procedure (arthroscopy, lavage, menis‐ ectomy, etc.) within the last year, history of syno‐ vectomy, tibial osteotomy, or knee replace‐ ment surgery scheduled within the next 9 mth Baseline values: Lequesne: HA 11.1 CT 11.3 WOMAC: HA 46.3 CT 47.9 Pain walking: HA 61.1 CT 60.3 | |
| Interventions | Hylan G‐F 20 3 weekly injections in target knee (encouraged to stop or spare any other OA treat‐ ments) [Synvisc could also be given in other knee] Conventional treatment for knee OA Concurrent therapy: NSAID: HA 87%, CT 82% Symptomatic slow‐acting drugs: HA 69%, CT 76% | |
| Outcomes | Lequesne ‐‐‐‐‐‐‐‐‐ WOMAC OA Index, SF‐12, medico‐ economic evaluation, pt rating of effectiveness on a 4‐category Likert scale | |
| Notes | Jadad's:3/5 R‐2,B‐0,W‐1 Bilateral OA in 72% HA, 76% CT Synvisc given to both knees in 45 pts. Second and third authors are affiliated with Boehringer Ingelheim. | |
| Risk of bias | ||
| Bias | Authors' judgement | Support for judgement |
| Allocation concealment (selection bias) | Low risk | A ‐ Adequate |
Kalay 1997.
| Methods | Randomised Controlled Trial Open‐label Parallel‐group 1 wk washout ITT analysis | |
| Participants | Country: Turkey Mean age: 61 % Female: 78 Mean disease duration: NR Duration: 56 days Number randomised: 40 (HA 20, PT 20) Inclusion: idiopathic OA according ACR criteria AP xray Kellgren and Lawrence 2 or 3 study knee and <4 other knee >40 yr walk 25 m without help stop all NSAIDs and muscle relaxants 1 wk before study Exclusion: ia inj or important trauma episode within last 3 mths oral or im steroid episode within last 2 mths HA inj within last 12 mths start of quadriceps exercise program in last 4 mths presence of fixed flexion contracture at knee >10 degrees valgus/varus >15 degrees on standing knee xrays anticoagulant treatment knee surgery episode joint diseases: secondary OA or inflammatory jt disease, pseudo ‐gout attack in last 3 mths, FM, intrajoint tumor, excessive symptoms in same hip or other knee that may interfere with study, anserine bursitis functional damages: hemi‐ paresis episode others: multiple i‐a inj or aspiration,liver or kidney disease, pregnancy, lacta‐ tion, insufficient contraception, peripheral neuropathy or vascular inadequacy, osteonecrosis, immune suppresive disease, diabetes mellitus Baseline values: spontaneous pain HA:2.61, PT:2.21 activity pain HA:4.68, PT:3.71 night pain HA:2.43, PT:2.17 25 m walk time HA:22.4, PL:18.6 | |
| Interventions | Sodium hyaluronate 1.5% 15 mg/ml 2 ml Orthovisc 2 weekly injections + 5 days/wk for a total of 10 sessions in‐patient physical therapy program (paraffin, short wave, quadriceps exercises) directed towards knees Physical therapy program only Concurrent therapy: Paracetamol per‐ mitted | |
| Outcomes | spontaneous pain, pain during daily activities and night pain (0‐4: 0=none,1=light, 2=medium, 3= strong, 4=very strong and 100 mm VAS) paracetamol use morning stiffness (min) range of motion: flexion/extension goniometer knee circumfer‐ ence 25 metre walk time pt global (1‐4) MD global (1‐4) (1=ineffective,2= slightly effective, 3=effective, 4= very effective) side effects | |
| Notes | Jadad's: 2/5 R‐1,B‐0,W‐1 If bilateral OA, more symptomatic knee in study | |
| Risk of bias | ||
| Bias | Authors' judgement | Support for judgement |
| Allocation concealment (selection bias) | Unclear risk | B ‐ Unclear |
Karatay 2004.
| Methods | Randomised Controlled Trial Parallel group Singel centre | |
| Participants | Country: Turkey Mean age: 61.5 % Female: 70 Mean disease duration: NR Duration: 3 wk Number randomised: 40 (Orthovisc 20, Hylan G‐F 20 20) Inclusion: fulfill ACR criteria for knee OA, Kellgren‐Lawrence grade II or III Exclusion: use of analgesic or NSAID, pts with concomitant rheumatological disease, active synovitis, surgical or arthroscopic interventions or ia steroid or HA treatment during the past 6 mth Baseline values: WOMAC pain: OR: 11.2 GF: 10.8 WOMAC stiffness OR: 3.8 GF: 3.6 WOMAC function OR: 35 GF: 31.9 ICAM‐1 OR: 19.2 GF: 17.8 VCAM‐1 OR: 40.5 GF: 37.8 | |
| Interventions | Orthovisc 2 ml, 30 mg (Anika Therapeutics) 3 weekly injections; Hylan G‐F 20 Synvisc 2 ml, 16 mg (Wyeth) 3 weekly injections Concurrent therapy: None permitted as per exclusion criteria | |
| Outcomes | WOMAC OA Index pain (0‐20), stiffness (0‐8), physical function (0‐68) biochemical measurements: sICAM‐1 and sVCAM‐1 in SF samples | |
| Notes | Jadad's: 1/5 R‐1, B‐0, W‐0 No baseline differences between groups of demographic features, clinical indices or lab values. | |
| Risk of bias | ||
| Bias | Authors' judgement | Support for judgement |
| Allocation concealment (selection bias) | Unclear risk | B ‐ Unclear |
Karatay 2005.
| Methods | See Karatay 2004. | |
| Participants | ||
| Interventions | ||
| Outcomes | ||
| Notes | ||
| Risk of bias | ||
| Bias | Authors' judgement | Support for judgement |
| Allocation concealment (selection bias) | Unclear risk | D ‐ Not used |
Karatay 2005a.
| Methods | See Karatay 2004. | |
| Participants | ||
| Interventions | ||
| Outcomes | ||
| Notes | ||
| Risk of bias | ||
| Bias | Authors' judgement | Support for judgement |
| Allocation concealment (selection bias) | Unclear risk | D ‐ Not used |
Karatosun 2005.
| Methods | Randomised Controlled Trial Parallel group Blinded physical therapist Single centre | |
| Participants | Country: Turkey Mean age: 56.6 % Female: 86 Mean disease duration: NR Duration: 18 mth Number randomised: 105 (200 knees) (HA 52, PE 53) Inclusion: primary OA of the knee as defined by ACR criteria, Kellgren Law‐ rence grade III with joint space narrowing and sclerosis of the subchondral bone Exclusion: radiographic appearance of pseudocysts as defined by Kellgren Law‐ rence Grade IV, unable to discontinue NSAID for duration of study, previous fracture around the knee, inflammatory arthritis, previous intraarticular injections or any other invasive procedure in the knee, significant comorbidity (renal, hepatic or heart disease), chicken or egg allergy Baseline values: pain during activity HA: 4.0, PE: 4.5 pain at rest HA: 7.8, PE: 9.1 pain during climbing stairs HA: 2.5, PE: 2.5 pain during transfer activity HA: 2.9, PE: 3.1 walking distance HA: 8.1, PE: 7.9 range of motion HA: 113.2, PE: 114.4 total HSS score HA: 62.6, PE: 65.4 | |
| Interventions | Hylan G‐F 20 (Synvisc) 3 weekly injections at baseline, Week 1 and Week 3, Exercise programme included a series of progressive, simple range of motion and resistance exercises for 6 wk. Home‐based regimen but patients came to hospital at baseline and weeks 1, 2, 3 and 6 to learn the exercises. | |
| Outcomes | Knee function evaluated by the Hospital for Special Surgery knee score criteria that is based on a total of 100 points with the score divided into 7 categories: pain, function, range of motion, muscle, strength, flexion deformity, instability, and subtractions. scores 85‐100 excellent, 84‐70 good, 60‐69 fair and less than 60 poor‐‐‐‐‐‐‐‐‐‐‐‐‐‐‐‐‐ pain during activity, pain at rest, pain during climbing stairs, pain during transfer activity, walking distance and range of motion all but walking distance and ROM are graded by HSS score (i.e. pain) | |
| Notes | Jadad's: 3/5 R‐2, B‐0, W‐1 95 patients had bilateral OA; 48 in the HA group and 47 in the PE group. 10 patients had unilateral OA: 4 HA and 6 PE | |
| Risk of bias | ||
| Bias | Authors' judgement | Support for judgement |
| Allocation concealment (selection bias) | Unclear risk | B ‐ Unclear |
Karatosun 2005a.
| Methods | Randomised Controlled Trial Parallel group Double blind 15 day washout of NSAID | |
| Participants | Country: Turkey Mean age: 60.55 % Female: 81.5 Mean disease duration: NR Duration: 1 y Number randomised: 92 (184 knees) (OR 46, GF 46) Inclusion: primary OA of the knee as defined by ACR criteria, all seeking treatment, Kellgren‐ Lawrence stage III OA with joint space narrowing and sclerosis of subchondral bone Exclusion: any pt with radiographic appearance of pseudocysts was defined as Kellgren‐ Lawrence grade IV, if pt could not discontinue NSAID beginning 15 days prior to the study due to presence of other diseases, previous fracture around the knee, joint effusion, inflammatory arthritis, previous intraarticular injection or any other invasive procedure in the knee, significant comorbidity (renal, hepatic or heart disease), chicken or egg allergy Baseline values: pain at activity OR: 4.4, GF 5.2 pain at rest OR: 9.1, GF 8.1 pain during climbing stairs OR: 2.1, GF 2.1 pain during transfer activities OR: 2.5, GF 2.6 walking distance OR: 5.4, GF 8.3 range of motion OR: 113.0, GF: 114.4 total HSS score OR: 67.7, GF: 70.1 | |
| Interventions | Orthovisc 3 weekly injections, Hylan G‐F 20 (Synvisc) 3 weekly injections Concurrent therapy: NSAID not permitted | |
| Outcomes | Hospital for Special Surgery Knee Score which includes pain at activity, pain at rest, pain during climbing stairs, pain during transfer activities, walking distance, and range of motion | |
| Notes | Jadad's: 5/5 R‐2, B‐2, W‐1 All radiographs (AP, lateral and Merchant) evaluated by 2 orthoopaedic surgeons and if consensus not achieved pt not included. Statistically significant difference at baseline in walking distance. | |
| Risk of bias | ||
| Bias | Authors' judgement | Support for judgement |
| Allocation concealment (selection bias) | Low risk | A ‐ Adequate |
Karlsson 1999.
| Methods | See Karlsson 2002a | |
| Participants | ||
| Interventions | ||
| Outcomes | ||
| Notes | ||
| Risk of bias | ||
| Bias | Authors' judgement | Support for judgement |
| Allocation concealment (selection bias) | Unclear risk | D ‐ Not used |
Karlsson 2002.
| Methods | See Karlsson 2002a | |
| Participants | ||
| Interventions | ||
| Outcomes | ||
| Notes | ||
| Risk of bias | ||
| Bias | Authors' judgement | Support for judgement |
| Allocation concealment (selection bias) | Unclear risk | D ‐ Not used |
Karlsson 2002a (AvP).
| Methods | Randomised Controlled Trial Double‐blind Parallel‐group Multicentre (n=19) 2 wk washout Both per protocol n=210 (Artzal 76, Synvisc 77, PL 57) and ITT n=242 (Artzal 90, Synvisc 86, PL 66) analyses completed PP analysis planned a priori as high drop‐out rate expected. | |
| Participants | Country: Sweden Mean age: 71 % Female: 65 Mean disease duration: NR Duration: 1 yr Number randomised: 246 (Artzal 92 Synvisc 88 Placebo 66) Inclusion: age at least 60 y Lequesne Index score at least 10 weight bearing pain at least 40/100 mm VAS normal general physical exam dominant pain in one knee due to OA radiologically verified OA of grade I or II by Ahlback criteria (50‐100% joint space narrowing but no bone erosion) Exclusion: bone attrition in either knee (Ahlback grade III to V) previous ia fracture of knee RA or other inflammatory joint disease as defined by ACR criteria ia injections of steroids or HA or other invasive procedure (arthroscopy, arthrography, surgery) in knee less than 6 mths prior to study known alcohol or drug abuse known allergy to any substance related to study (disinfectants, adhesives) any clinically relevant haematological or known clinical chemistry values outside the reference values any disabling problem of the musculoskeletal system or other organ system which could interfere with the assessment of efficacy Baseline values: Weight bearing pain: A: 64 S: 63 PL: 65 Total WOMAC A: 48.7 S: 48.7 PL: 48.9 Total Lequesne: A: 13.9 S: 13.4 PL: 13.6 | |
| Interventions | Artzal 2.5 ml (1% hyaluronan, Astra Lakemedel) 3 weekly injections (7 days apart) Synvisc 2.0 ml (0.8% hyaluronan, Roche) 3 weekly injections (7 days apart) Placebo (phosphate‐ buffered saline solution ‐ 3 ml solution in 5 ml ampoules, Astra Lakemedel) 3 weekly injections (7 days apart) Concurrent therapy: Paracetamol (acetaminophen) up to 4 g/day permitted; analgesics not permitted 12 h prior to clinical assessment; pt recoded use of analgesics on diary card during wk 0‐26 | |
| Outcomes | Wk 0‐26 primary outcome was weight bearing pain and Wk 0‐52 was duration of clinical benefit Clinical failure defined as use of concurrent treatment for study knee, i.e. more than 4g/day, surgery or new injections. ******************* Patient rated weight bearing pain, resting pain and maximum pain of knee on 100 mm VAS WOMAC OA Index (Likert), SF 36, global evaluation of overall response to treatment at Wk 26 (8‐point ordinal scale), Examiner completed the Lequesne Index, evaluated change in intake of concurrent analgesic medication (much more, more, unchanged, less, much less), | |
| Notes | Jadad's:5/5 R‐2,B‐2,W‐1 Study was supported by grants from Astra Lakemedel. Second author affiliated with Clinical Research Medical Dept. of AstraZeneca. These pts had significant knee pain and impairment as reflected by high WOMAC and Lequesne scores. By Wk 26 approx. 20‐30% dropouts By Wk 52 approx. 60‐70% dropouts Study pts from a community‐ based outpatient population cared for by family doctors, GPs and orthopaedic surgeons in private practice. | |
| Risk of bias | ||
| Bias | Authors' judgement | Support for judgement |
| Allocation concealment (selection bias) | Unclear risk | B ‐ Unclear |
Karlsson 2002b (SvP).
| Methods | See Karlsson 2002a | |
| Participants | ||
| Interventions | ||
| Outcomes | ||
| Notes | ||
| Risk of bias | ||
| Bias | Authors' judgement | Support for judgement |
| Allocation concealment (selection bias) | Unclear risk | D ‐ Not used |
Karlsson 2002c (AvS).
| Methods | See Karlsson 2002a | |
| Participants | ||
| Interventions | ||
| Outcomes | ||
| Notes | ||
| Risk of bias | ||
| Bias | Authors' judgement | Support for judgement |
| Allocation concealment (selection bias) | Unclear risk | D ‐ Not used |
Karlsson 2003d.
| Methods | See Karlsson 2002a | |
| Participants | ||
| Interventions | ||
| Outcomes | ||
| Notes | ||
| Risk of bias | ||
| Bias | Authors' judgement | Support for judgement |
| Allocation concealment (selection bias) | Unclear risk | D ‐ Not used |
Karras 2001.
| Methods | Randomised Controlled Trial Parallel‐group SIngle centre | |
| Participants | Country: Greece Mean age: NR % Female: NR Disease duration: NR Duration: 1 y Number randomised: 200 (HA5: NR HA3: NR ) Inclusion: Suffering from OA of the knee Exclusion: NR Baseline values: NR | |
| Interventions | Hyalgan 5 weekly injections every 6 months Hyalgan 3 weekly injections every 3 months | |
| Outcomes | Lequesne, Pain (VAS), Clinical response by pt and physician. | |
| Notes | Jadad's:2/5 | |
| Risk of bias | ||
| Bias | Authors' judgement | Support for judgement |
| Allocation concealment (selection bias) | Unclear risk | B ‐ Unclear |
Kawabata 1993.
| Methods | Randomised Controlled Trial Parallel‐group Multicentre (n=23) Safety analysis: ITT, n=164, Pt. impression & global: per proto‐ col, n=156 Usefulness: per protocol, n=159 | |
| Participants | Country: Japan Mean age: 67 % Female: 75 Mean disease duration: NR Duration: 5 wk Number randomised: 172 (SLM 87, Artz 85) Inclusion: diagnosis of knee OA on basis of clinical and xray informed consent pain during movement xray findings: one of osteophyte, JSN, osteoscl‐ erosis Exclusion: considered to require an operation received ia injection of steroid within 2 wks of start newly administered analgesic, NSAID within 2 wk of start new PT within 2 wk pregnant, lactating, or may become pregnant serious complications such as definite hepatic and renal ftn. disorders have or have history of hyper‐ sensitivity to drug those judged by the physi‐ cian in charge to be inappro‐ priate as trial subjects Baseline values: movement pain mild SLM 39% Artz 35%, moderate SLM 55%, Artz 61% severe SLM 6%, Artz 4% | |
| Interventions | SLM‐10 (25 mg/2.5 ml) 5 weekly injections Artz (25 mg/2.5 ml) 5 weekly injections Concurrent therapy: "New" analgesics, NSAIDs, steroids and physiotherapy to be avoided | |
| Outcomes | assessment by attending physician: daily activity dis‐ order:standing up from chair,up/ down stairs, squatting, sitting up straight (easy, mild,moderate, severe), walking ftn disorder, pain (in movement, when resting, pressure), knee jt findings (swel‐ ling,feverish feeling,floating patella), range of motion: all on 4‐point scales (none,mild,mod‐ erate,severe), +/‐ stagnant synovial fluid, if present, volume pt's impression: 7 grades:much better,better, slightly better, unchanged, slightly worse, worse, much worse pt global improvement : 7 grades:markedly improved, im‐ proved,slightly improved, un‐ changed,slightly deteriorated, de‐ teriorated, mark‐ edly deteriorated overall safety: 3 grades: safe, continued use despite some problem, discon‐ tinued due to problem usefulness: 7 grades:very use‐ ful,useful,slightly useful,cannot say useful or not, slightly undesir‐ able, undesir‐ able, very unde‐ sirable Committee assessment: pain, daily activity disorder, knee jt findings, walking ftn: score/100, overall severity: 3 grades (mild >=60/100, moderate 30‐50/ 100, severe <= 29/100) and global improvement: 7 grades, overall safety & usefulness | |
| Notes | Jadad's: 2/5 R‐1,B‐0,W‐1 Pt observation and assessment done by physician other than physician in charge (injection) Synovial fluid removed as required. Significant group difference in baseline +/‐ of complications. Artz provided by Seikagaku Corp‐ oration. | |
| Risk of bias | ||
| Bias | Authors' judgement | Support for judgement |
| Allocation concealment (selection bias) | Low risk | A ‐ Adequate |
Kirchner 2005.
| Methods | Randomised Controlled Trial Parallel‐group Double‐blind Multicentre (n=10) | |
| Participants | Country: Germany Mean age: 63.2 % Female: 64.5 Mean disease duration: 58.9 mth Duration: 12 wk Number randomised: 321 (EUF 160, SYN 161) Inclusion: either sex, age 50 to 80 y, confirmed OA in one or both knees, clinical evidence of chronic idiopathic OA of the study knee according to criteria of Altman, radiologically verified OA of the study knee by modified Kellgren‐Lawrence (grade 2 or 3), symptoms in study knee for at least 1 y, willingness to discontinue all OA treatments other than acetaminophen, moderate to severe knee pain as reflected by a VAS pain score of 41 to 80 out of 100 mm for the average of the WOMAC OA Index pain subscale with only one pain item permitted to be below 20 mm or above 80 mm Exclusion: secondary OA originating from a known injury to the knee, RA, history of joint infection, dermatologic disorders or skin infection in proximity to study knee, osteonecrosis, chronic active fibromyalgia, any inflammatory or metabolic arthrides and known sensitivity to acetaminophen or hyaluronan, hyaluronan injection to study knee within 6 mth of screening, corticosteroid injection and surgery or arthroscopy to study knee within 3 mth of screening, nonambulatory patients: inability to perform a 50 foot walk test, patients with symptomatic OA of the hip or any other health condition that would have interfered with study assessments including patients with uncontrolled hematological, cardiovascular, neoplastic, pulmonary, neurological, renal, hepatic or systemic disease, clinical lab values: fasting blood glucose concentration greater than 160mg/dl, alkaline phosphatase greater than 250 U/I, alanine aminotransferase greater than 30 U/I, or aspartate aminotransferase greater than 30 U/I, participation in another study during the study period and during the 4 wk prior to study enrollment Baseline values: WOMAC pain EUF 49.2 SYN 51.9 WOMAC stiffness EUF 43.2 SYN 47.8 WOMAC function EUF 47.0 SYN 50.8 WOMAC total EUF 47.2 SYN 50.8 | |
| Interventions | Euflexxa (bioengineered 1% sodium hyaluronate) (20 mg/2 ml) 3 weekly injections, Synvisc (16 mg/2 ml) 3 weekly injections Both groups advised to rest for 24 h following each injection. Before each injection, any SF that was present was aspirated. Concurrent therapy: acetaminophen (500 mg tablets) up to 4 g daily was permitted as rescue medication; NSAIDs and other non‐acetaminophen pain medications were prohibited | |
| Outcomes | WOMAC OA Index pain subscale‐‐‐‐‐‐‐‐‐‐‐ WOMAC stiffness, WOMAC physical function, patient global assessment of treatment, "Are you satisfied with the results of the injections?" with response graded on a 4‐point ordinal scale: 1=dissatisfied, 2=slightly satisfied, 3=satisfied, 4=very satisfied; patient consumption of acetaminophen for pain relief as quantified by pill counts | |
| Notes | Jadad's: 5/5 R‐2, B‐2, W‐1 Study supported by Ferring Pharmaceuticals, Inc. Statistical review by W. Huang, PhD, Savient Pharmaceuticals, clinical and regulatory support by R. Zaibel, Bio‐Technology General (Israel) Ltd., editorial assistance in manuscript preparation provided by BioScience Communications, New York | |
| Risk of bias | ||
| Bias | Authors' judgement | Support for judgement |
| Allocation concealment (selection bias) | Low risk | A ‐ Adequate |
Kirchner 2005.
| Methods | See Kirchner 2005 above. | |
| Participants | ||
| Interventions | ||
| Outcomes | ||
| Notes | ||
| Risk of bias | ||
| Bias | Authors' judgement | Support for judgement |
| Allocation concealment (selection bias) | Low risk | A ‐ Adequate |
Kirchner 2006.
| Methods | See Kirchner 2005 above. | |
| Participants | ||
| Interventions | ||
| Outcomes | ||
| Notes | ||
| Risk of bias | ||
| Bias | Authors' judgement | Support for judgement |
| Allocation concealment (selection bias) | Low risk | A ‐ Adequate |
Kotevoglu 2002.
| Methods | See Kotevoglu 2005. | |
| Participants | ||
| Interventions | ||
| Outcomes | ||
| Notes | ||
| Risk of bias | ||
| Bias | Authors' judgement | Support for judgement |
| Allocation concealment (selection bias) | Unclear risk | D ‐ Not used |
Kotevoglu 2005.
| Methods | Randomised Controlled Trial Double blind Parallel group Single centre Placebo and active controlled Blinded evaluator | |
| Participants | Country: Turkey Mean age: 59.5 % Female: 88 Mean disease duration: 4 y Duration: 6 mth Number randomdised: (Orthovisc 26, Synvisc 26, Saline 26) Inclusion: patients with knee OA according to ACR criteria, Kellgren‐ Lawrence grades II‐IV Exclusion: renal and hepatic comorbidity, abnormal lab tests, treatment with anticoagulants or immunosuppressives, intra‐articular injection of HA or steroids within the past 12 mth, any quadriceps exercise programe within the last 4 mth Baseline values: WOMAC pain OR: 16.5 SYN: 18 PL: 20 WOMAC stiffness OR: 6.5 SYN: 7 PL: 6 WOMAC function OR: 52.5 SYN: 55 PL: 59.5 Patient global OR: 90 SYN: 80 PL: 90 Physician global OR: 95 SYN: 80 PL: 90 | |
| Interventions | Synvisc 3 weekly injections, Orthovisc 3 weekly injections, Saline 3 weekly injections All injections injections performed by 2 physicians in anterolateral approach (along the patellar tendon) with knee in 90 degrees of flexion Concurrent therapy: aceta‐ minophen up to 4 mg/day permitted | |
| Outcomes | WOMAC pain (5‐25), WOMAC stiffness (2‐10), WOMAC physical function (17‐85), patient and physician global assessments on a 0‐100 mm VAS scale; for both the question was, "How do you grade the severity of your (or the patient's) knee OA according to a 0‐100 scale, 100 being the worst | |
| Notes | Jadad's: 3/5 R‐1, B‐1, W‐1 Patients did not have effusion. In bilateral disease, the more painful knee was treated. | |
| Risk of bias | ||
| Bias | Authors' judgement | Support for judgement |
| Allocation concealment (selection bias) | Unclear risk | B ‐ Unclear |
Lanzer 2002.
| Methods | See Caborn 2004. | |
| Participants | ||
| Interventions | ||
| Outcomes | ||
| Notes | ||
| Risk of bias | ||
| Bias | Authors' judgement | Support for judgement |
| Allocation concealment (selection bias) | Unclear risk | B ‐ Unclear |
Leardini 1987.
| Methods | Randomised Controlled Trial Single‐blind Parallel‐group Washout Mth 2: ITT analysis, Mth 12: Per protocol | |
| Participants | Country: Italy Mean age: 64 % Female:81 Disease duration: NR Duration:1 y Number randomised:36 (HA 20, MPA 16) [40 jts: HA 20, MPA 20] Inclusion: active gonarthrosis Kellgren Grade 2 or 3 Exclusion: no other joint disease Baseline values: spontaneous pain HA:41.3, MPA: 33.4 passive movement HA:115.8 MPA:109.0 active movement HA:108.4 MPA:104.2 ring size HA: 43.0, MPA: 42.6 # jts.pain under load HA:18, MPA:19 # jts walking pain HA:20, MPA:20 | |
| Interventions | Hyalgan (20 mg/2ml) 3 weekly injections Methylpredniso‐ lone acetate (MPA) 40 mg/1 ml (Depo‐Medrol) 3 weekly injections Concurrent therapy: simple analgesics permitted for most severe pain, no NSAIDs for first 2 mths then allowed for short periods (<2 wk) between end of mth 2 and mth 12 | |
| Outcomes | spontaneous pain on VAS pain under load and on walking (1=absent to 5= very severe) active and passive movement in degrees ring size in cm | |
| Notes | Jadad's:2/5 R‐1,B‐0,W‐1 4 pts had bilateral OA; each knee counted as 'one' case. R. Bruno and A. Perbellini, Fidia SpA. C. Baggio and C. Zanetti provided statistical analysis. A. Babolin provided secretarial assistance. | |
| Risk of bias | ||
| Bias | Authors' judgement | Support for judgement |
| Allocation concealment (selection bias) | Unclear risk | B ‐ Unclear |
Leardini 1991.
| Methods | Randomised Controlled Trial Open‐label Parallel‐group ITT analysis | |
| Participants | Country: Italy Mean age: 65 % Female:88 Mean disease duration: 99 mth (range 12‐300) Duration:60 days Number randomised:40 (HA 20, MPA 20) Inclusion: painful idiopathic OA of the knee by ARA criteria and radiologically assessed by Kellgren previous NSAID treatment with poor results suggesting the usefulness of IA treatment Exclusion: serious concomitant disorders ongoing infections pregnancy allergy or hypersensitivity to drugs treatment with any IA drug in last 3 mth Baseline values: % pts with strong pain under load HA:65, MPA:55 % pts with strong rest pain HA:60, MPA:70 | |
| Interventions | Hyalgan (20 mg/2ml) 3 weekly injections 6‐methylpredniso‐ lone acetate (6‐MPA) 40 mg/1 ml 3 weekly injections (Depo‐ Medrol) Concurrent therapy: Analagesic & NSAID permitted | |
| Outcomes | spontaneous pain (100 mm VAS), am stiffness, flexion (degrees)‐‐‐‐‐‐‐‐‐‐‐‐‐‐‐‐‐‐‐‐‐‐‐ night pain, pain under load, touch pain (0‐4: 0=none,1=slight, 2=moderate, 3= strong, 4 = very strong) analgesic or NSAID consumption (0‐3: 0=none, 1= occasional low doses, 2=regular low doses, 3 = regular high doses) joint effusion volume (ml) pt and MD global efficacy (0‐4: 0 = unsatisfactory, 1 = poor, 2 = fair, 3 = good, 4 = excellent) | |
| Notes | Jadad's:2/5 R‐1,B‐0,W‐1 Arthrocentesis performed if effusion present and measured. Pts kept at rest for 2 days after injection. A. Perbellini, Fidia S.p.A. | |
| Risk of bias | ||
| Bias | Authors' judgement | Support for judgement |
| Allocation concealment (selection bias) | Unclear risk | B ‐ Unclear |
Leopold 2003.
| Methods | Randomised Controlled Trial Single‐blind Blinded assessor Parallel‐group Single centre | |
| Participants | Country: USA Mean age: 65 % Female: 54 Disease duration: NR Duration: 6 mth Number randomised: 100 (HA 50, CS 50) Inclusion: >18 y x‐ray evidence of symptomatic OA of the knee dissatisfaction with prior attempts at non‐ operative management modalities (e.g. NSAID, oral analgesics, nutritional supplements, PT, braces) symptomatic= pain with weight bearing at TB and/or PF with one or more of: loss of cartilage thickness, osteo‐ phyte formation, subchondral sclerosis, cysts Exclusion: pregnant lactating x‐ray signs of bone‐on‐bone arthritis, chrondrocalcin‐ osis, physical exam showed an insufficiency of collateral ligament or insufficiency of anterior or posterior cruciate ligament with concomitant symtomatic giving‐way of the affected extremity, or current infection in affected extremity history of crystalline arthropathy or inflammatory arthritis, neuropathic arthropathy, an ia injection with any corticosteroid or any HA within the previous 3 mth allergy or hyper‐ sensitivity to study medications, eggs, feathers, avian proteins, or chickens | |
| Interventions | Hylan G‐F 20 3 weekly injections (with effusion aspiration) Betamethasone sodium phos‐ phate‐betameth‐ asone acetate 2 ml mixed in 4 ml of Marcaine (bupivacaine) and 4 ml of lido‐ caine (effusion not aspirated) & could have 2nd injection at any time (48%) (Celestone Soluspan) Concurrent therapy: NSAID permitted but tracked (HA ‐ 64%, CS ‐56% usage) | |
| Outcomes | Modified Knee Society clinical rating scale (100 points), WOMAC OA Index (Likert), pain (100 mm VAS) | |
| Notes | Jadad's:3/5 R‐2,B‐0,W‐1 Study was independently funded. Base‐ line significant difference in x‐ray severity: more moderate in HA; more mild or severe in CS. If bilateral, only one knee analysed. | |
| Risk of bias | ||
| Bias | Authors' judgement | Support for judgement |
| Allocation concealment (selection bias) | Low risk | A ‐ Adequate |
Lin 2004.
| Methods | See Tsai 2003. | |
| Participants | ||
| Interventions | ||
| Outcomes | ||
| Notes | ||
| Risk of bias | ||
| Bias | Authors' judgement | Support for judgement |
| Allocation concealment (selection bias) | Unclear risk | D ‐ Not used |
Listrat 1997.
| Methods | Randomised Controlled Trial Per protocol: n=36 | |
| Participants | Country: France and Italy Mean age: 62 % Female:67 Mean disease duration: 3 y Duration: 1 y Number randomised:39 (HA 20, CT 19) Inclusion: primary OA defined by ACR clinical involvement of medial compartment active disease justifying local therapy absence of advanced disease (Kellgren and Lawrence Grade 4) absence of contraindication of arthroscopy presence of chondropathy of medial comparment at arthroscopy Exclusion: any IA surgery in past 5 y (including arthroscopy) any IA treatment prescribed in past 3 mths any concurrent symptomatic treatment had to be stable for at least one mth before study Baseline values: pain HA:49.2, CT:52.1 Lequesne HA:8.9, CT:9.4 arthroscopy overall assessment HA:41.8, CT:52.6 AIMS2 HA:2.6, CT:2.2 Joint space width (mm) HA: 4.5, CT: 3.5 SFA scoring HA: 26.1, CT: 39.0 | |
| Interventions | Hyalgan (20 mg/2ml) 3 weekly injections every 3 mth for total of 9 injections with 1st injection 1 mth after arthroscopy and last 3 mth before final visit Conventional therapy but all pts had arthroscopy with lavage 2 litres saline serum before randomisation Concurrent therapy: analgesics & NSAID permitted | |
| Outcomes | arthroscopy scored MD overall assess‐ ment (100 mm VAS), revised SFA scoring and SFA grading‐‐‐‐‐‐‐ global pain 100 mm VAS Lequesne Index AIMS2 analgesic/NSAID score AP wt bearing knee xrays ‐ joint space narrowing by 7‐grade and joint space width (mm) | |
| Notes | Jadad's:2/5 R‐1,B‐0,W‐1 Synovial fluid aspirated before injection. Imbalance at entry in severity of chondropathy . Imbalance in amount of rescue treatment. Study supported by a grant from Fidia S.p.A. and in part from a grant from the Societe Francaise de Rhumatologie. Hyalgan supplied by Fidia S.p.A. | |
| Risk of bias | ||
| Bias | Authors' judgement | Support for judgement |
| Allocation concealment (selection bias) | Unclear risk | B ‐ Unclear |
Lohmander 1996.
| Methods | Randomised Controlled Trial Double‐blind Multicentre (n=8) Placebo‐ controlled Stratified Efficacy analysis: per protocol n=189, safety analysis: ITT, n=239 | |
| Participants | Country: Denmark, Finland, Norway, Sweden Mean age: 58 % Female:56 Mean disease duration: Duration:20 wk Number randomised:240 (HA 120, PL 120) Inclusion: 40‐75 y symptomatic, radiologically verified knee OA (Ahlback stage 1 to 2) knee pain on day of examination >10/100 mm VAS Lequesne score >= 4 baseline Exclusion: significant symptoms of bilateral knee OA previous IA fracture of knee RA or other inflammatory arthritis IA injection of steroids or other invasive procedure in knee in past 6 mth any other condition that in‐ terferes with efficacy assessment or completion of trial Baseline values: pain HA:44.4, PL: 42.3 activity level HA:60.7, PL:60.7 knee function HA:51.2, PL:49.3 ROM HA:33.8, PL:38.5 Lequesne HA:9.9, PL:9.6 Lysholm HA:54.1, PL:57.9 Tegner HA:2.7, PL: 2.6 Clincial exam HA:20.8, PL:21.0 | |
| Interventions | Artzal (25 mg/2.5 ml) 5 weekly injections Placebo:saline 2.5 ml 5 weekly injections Local anaesthetic used. Concurrent therapy: analgesics & NSAID permitted and monitored. | |
| Outcomes | Lequesne index 100 mm VAS for knee pain, ROM, activity level and total knee function‐‐‐‐‐‐‐‐‐‐‐‐‐ Tegner activity score, Lysholm knee function score clinical exam quantity of con‐ current medication pt and examiner global (7 stages: from much im‐ proved to much worse) volume of fluid aspirated number of leuco‐ cytes in joint fluid | |
| Notes | Jadad's:4/5 R‐1,B‐2,W‐1 Effusion aspirated before injection Stratification by age and Lequesne score into 4 groups: 40‐60 y, Lequesne 4‐10; 40‐60 y, Lequesne >10, 61‐75 y, Lequesne 4‐10, 61‐75 y, Lequesne >10 Standardisation meeting for injection tech‐ nique and assessment procedures. Work supported by Medical Faculty of Lund University, the Swedish MRC, KaroBio AB and Astra Lakemedel AB. | |
| Risk of bias | ||
| Bias | Authors' judgement | Support for judgement |
| Allocation concealment (selection bias) | Unclear risk | B ‐ Unclear |
McDonald 2000.
| Methods | Randomised Controlled Trial Double‐blind Multicentre (n=12) 2 wk washout Both ITT n=256 and per protocol, n=233 with publication based on PP. analyses done | |
| Participants | Country: Germany Mean age: 62 % Female: 61 Mean disease duration: 4.4 y Duration:6 mth Number randomised:256 (FM 127, HA 129) Inclusion: radiologically confirmed knee OA (Ahlback 1 to 3) and ACR diagnostic criteria investigator approval of with‐ drawal of analgesic medication with escape medication being acetaminophen for study Exclusion: IA injections or arthroplasty to affected knee in last 3 mth concomitant medical condi‐ tions that could interfere with study assessments such as hip OA Baseline values: pain FM:56.2,HA:57.2 Lequesne FM:11.2,HA:11.1 | |
| Interventions | Fermathron 2 ml 5 weekly injections Hyalart 2 ml 5 weekly injections Concurrent therapy: Paracetamol, Aspirin up to 150 mg daily | |
| Outcomes | Lequesne ‐‐‐‐‐‐‐‐‐ use of escape medication by pt daily diary VAS pain assess‐ ment of affected knee pt global (very good, good, average, poor, very poor) | |
| Notes | Jadad's:5/5 R‐2,B‐2,W‐1 First author of publication is affiliated with Fermentech Medical Ltd. | |
| Risk of bias | ||
| Bias | Authors' judgement | Support for judgement |
| Allocation concealment (selection bias) | Low risk | A ‐ Adequate |
Miltner 2002.
| Methods | Randomised Controlled Trial Single‐blind Blinded clinical assessor Right/left comparison Single centre Stratified on more impaired knee | |
| Participants | Country: Germany Mean age: 67 % Female: 53 Mean disease duration: NR Duration: 7 wk Number randomised: 43 (HA: 24 knees most impaired, 19 knees less impaired; No treatment: 19 knees most impaired; 24 knees less impaired) Inclusion: Adults of both genders with a minimum age of 50 yr OA of both knees Radiographic changes = Kell‐ gren and Lawrence stage II to III bilat‐ erally Symptomatic gonarthrosis for a minimum of 12 months Pain during wt bearing >=4/10 cm VAS bilaterally Lequesene score not different by more than +/‐ 2 points in total value Exclusion: Pts who do not meet all inclusion criteria Neurological deficits in lower extremities Underlying diseases such as: primary inflammatory joint disease, joint infections, crystalline arthritis, ia tumors, axis deviation of >15o varus or valgus malalignment, ligamentous instability, previous fractures of the joint, arthroscop‐ ic surgery on the knee in the previous 12 mths IA injections of the knee joint in 3 mth prior to study Baseline values: Pain at rest HA: 3.83 NT: 3.67 Pain wt bearing HA: 7.57 NT: 7.43 Lequesne HA: 13.57 NT: 12.48 | |
| Interventions | Hyalart 20 mg 5 weekly injections No treatment Concurrent therapy: NSAID & analgesics to be avoided. Paracetamol 500 mg was permitted as pain medication. | |
| Outcomes | Lequesne (max score 26), pain (10 cm VAS) isokinetic test (maximum peak torque for extensors and flexors), total work | |
| Notes | Jadad's:1/5 R‐1,B‐0,W‐0 Baseline difference between groups in initial values for total work of the knee flexor and extensor. This may be possibly due to the fact that the more impaired knee was entered in the treatment group more often than in the control group. This trial was piloted by the trial by Schneider (1997). | |
| Risk of bias | ||
| Bias | Authors' judgement | Support for judgement |
| Allocation concealment (selection bias) | Unclear risk | B ‐ Unclear |
Moreland 1993.
| Methods | Randomised
Controlled
Trial
Double‐blind
Blinded assessor
Screen blinded pt
Parallel‐group
Multicentre (n=5)
4 wk washout of NSAID but permitted acetaminophen as analgesia. Analysis: ITT Phase I efficacy: per protocol Flare population: n=30 (31 knees) |
|
| Participants | Country: U.S.A. Mean age: NR % Female:67 Mean disease duration: NR Duration:34 wk Number randomised:94 (HA 46, AR 48) [104 knees: HA 52, AR 52] Inclusion: chronic idiopathic OA of knee confirmed by xray Kellgren and Lawrence Grade 2 to 4 in no more than 2 compartments symptoms of inflammation and/or advanced disease which included rest pain during day of at least moderate severity (>=40/ 100 mm VAS) or pain awakening them at night Exclusion: pregnant or of childbearing potential not using effective contraception varus or valgus deformity >=10o surgery on knee in past 3 mth or planning surgery chondromalacia as primary contributor to symptoms <18 y unavailable for 26 wk follow‐up RA, AS, gout, IBD, pseudogout, psoriatic arthritis, peripheral neuropathy causing pain or diastasis distal to knee metabolic disease associ‐ ated with joint abnormalities liver disease cancer diabetes mellitus, drug abuse Baseline values: pain with motion HA: 69, AR: 70 | |
| Interventions | Hylan G‐F 20 (2 ml) 3 weekly arthro‐ centeses followed by injection Arthrocentesis 3 weekly Concurrent therapy: Acetaminophen usage for analgesia documented (pill counts) | |
| Outcomes | pain with walking, at rest, at night, with motion and overall ( 100 mm VAS) activity restriction joint tenderness (100 mm VAS) joint effusion (+/‐, volume) pt and evaluator global assess‐ ments (100 mm VAS) Assessments: Phase I Wk 0,2,4,5,6,8,10 Phase II Wk 10‐18,11‐19,12‐ 20,16‐22,18‐26, 26‐34 | |
| Notes | Jadad's:5/5 R‐2,B‐2,W‐1 If bilateral OA, both knees could be treated and evaluated. 10 pts had both knees treated ‐ (5 AR, 1 HA, 4 both) 34% patients presented with an effusion. Each knee randomised Arthrocentesis with removal of effusion if present. In Phase II, evaluated repeat treatment with a second course of three hylan G‐F 20 injections but no control group. Biomatrix, Inc. sponsored work. | |
| Risk of bias | ||
| Bias | Authors' judgement | Support for judgement |
| Allocation concealment (selection bias) | Low risk | A ‐ Adequate |
Nahler 1996.
| Methods | See Nahler 1998. | |
| Participants | ||
| Interventions | ||
| Outcomes | ||
| Notes | ||
| Risk of bias | ||
| Bias | Authors' judgement | Support for judgement |
| Allocation concealment (selection bias) | Unclear risk | D ‐ Not used |
Nahler 1998.
| Methods | Randomised Controlled Trial Single‐blind Parallel‐group Multicentre (n=12) Stratified by pain severity Equivalence study | |
| Participants | Country: Germany and Austria Mean age: 67 % Female: 80 Mean disease duration: 68% <1 year Duration: 5 wk Number randomised: 121 (ZL 57, HY 57) Inclusion: presence of primary (idio‐ pathic) arthritis verified by: pain in 1 or 2 knees a typical xray (medial narrow‐ ing of the joint cavity, peripheral osteophyte de‐ velopment, com‐ pact ossification of subchondral bone) chronic pain in 1 or 2 knee joints for at least 3 mth with no sign of acute inflamma‐ tion written statement of patient consent Exclusion: age <35 or >85 y arthritis resulting from prior defor‐ mations, injuries or metabolic causes (secon‐ dary arthritis) other ailments with symptoms similar to arthritis of the knee such as arthritis of the hip, varicosis, bone & muscle disorders, RA signs of acute inflammation (acute active arthritis) nonambulatory or bedridden pts pts who stated their intention to change level of physical activity during the study probable surgical treatment of the arthritic joint in the near future i‐a corticosteroid treatment of the arthritic joint within the past 2 mth low grade pain (<25 mm on the 100 mm VAS) a history of aller‐ gic reactions to Zeel or Hyalart serious liver or kidney disease long term treat‐ ment with immu‐ nosuppressives during last mth ongoing concom itant therapy with analgesics/anti‐ inflammatories | |
| Interventions | Zeel compositum 10 injections (two 2 ml injections/wk) Hyalart (2 ml) 5 weekly injection Concurrent therapy: Analgesics & anti‐ inflammatories prohibited | |
| Outcomes | Pain during active movement on 100 mm VAS (0=pain free, 100=worst pain to date) pt final assess‐ ment of toler‐ ance on 100 mm VAS (0=ex‐ tremely poorly tolerated, 100= extremely well tolerated)‐‐‐‐‐‐‐‐pain during night on 100 mm VAS duration of morning stiff‐ ness (min) maximum dis‐ tance capable of walking time (sec) to walk up and down a stand‐ ard series (1 flight) of stairs final assess‐ ment of efficacy by MD and pt on 100 mm VAS (0=no improve‐ ment, 100=ex‐ treme improve‐ ment) final assess‐ ment of toler‐ ance by MD and pt on 100 mm VAS as above drop‐out rate resulting from inadequate efficacy reporting of un‐ desired side effects (weekly) | |
| Notes | Jadad's:4/5 R‐2,B‐1,W‐1 | |
| Risk of bias | ||
| Bias | Authors' judgement | Support for judgement |
| Allocation concealment (selection bias) | Unclear risk | B ‐ Unclear |
Neustadt 2004.
| Methods | See Neustadt 2005a‐3inj. | |
| Participants | ||
| Interventions | ||
| Outcomes | ||
| Notes | ||
| Risk of bias | ||
| Bias | Authors' judgement | Support for judgement |
| Allocation concealment (selection bias) | Unclear risk | D ‐ Not used |
Neustadt 2005.
| Methods | See Neustadt 2005a‐3inj | |
| Participants | ||
| Interventions | ||
| Outcomes | ||
| Notes | ||
| Risk of bias | ||
| Bias | Authors' judgement | Support for judgement |
| Allocation concealment (selection bias) | Unclear risk | D ‐ Not used |
Neustadt 2005a ‐3inj.
| Methods | Randomised Controlled Trial Arthrocentesis controlled Multicentre n=24, (Canada n=3, USA n=21) Double‐blind 7‐day washout NSAID and analgesics January 2001 to December 2002 | |
| Participants | Country: Canada and the United States Mean age: 176.4 % Female: 47.9 Mean disease duration: NR Duration:28 wk Number randomised: 372 (O4 128, O3A1 120, and A4 124) Inclusion: greater than or equal to 40 y of age, willing to discontinue all analgesics and NSAID 7 days before the first injection and for the duration of the study, diagnosis of knee OA according to ACR criteria, Kellgren‐Lawrence grade 1,2 or 3, a summed WOMAC pain score greater than or equal to 200 mm and less than 400 mm (maximum 500) in the index (treated) knee and less than 150 mm in the contralateral (untreated) knee Exclusion: patients who initiated an exercise or physical therapy program within 3 mth, oral or parenteral corticosteroid use within 30 days, intraarticular injection of steroids into the index knee within 90 days, intraarticulr injection of any hyaluronic substanced within the past 9 mth or operative arthroscopy within 6 mth, treatment with anticoagulants, clinically significant comorbidity (fibromyalgia, peripheral neuropathy, vascular insufficiency or hemiparesis) severe enough to interferewith accurate evaluation Baseline values: (based on evaluable (per protocol) population) WOMAC pain index knee O4: 286.6 O3A1: 289.0 A4: 294.1 contralateral knee O4: 66.8 O3A1: 69.3 A4: 64.6 Patient global O4: 67.5 O3A1: 62.4 A4: 64.4 Investigator global O4: 58.8 O3A1:57.0 A4: 57.6 Pain on standing O4: 65.2 O3A1: 65.7 A4: 65.5 Synovial fluid volume (ml) O4: 0.9 O3A1: 1.0 A4: 0.9 Mean analgesic usage (tablets/day): O4: 2.08 O3A1: 2.48 A4: 2.05 | |
| Interventions | 1) O4: Orthovisc 2 ml (30 mg) 4 weekly injections 2) O3A1: Orthovisc 2 ml (30 mg) 3 weekly injections plus one control arthrocentesis procedure 3) A4: 4 control arthrocentesis All injections were administered by either lateral or medial approach after instillation of 1% lidocaine hydrochloride solution. If fluid present, joint space aspirated to dryness. Concurrent therapy: Acetaminophen up to 4 g/day allowed but not permitted for at least 24h prior to each study assessment visit. NSAIDs and other analgesics not permitted during the study. | |
| Outcomes | The proportion of patients achieving a 20% relative and 50 mm absolute improvement from baseline in WOMAC pain score at weeks 8, 12, 16 and 22 post baseline in the Index Knee (0‐500 mm VAS) ‐‐‐‐‐‐‐‐‐‐‐‐‐‐‐‐‐‐‐‐‐‐‐ patient global score, investigator global score and pain on standing score all scored on a 0 to 100 mm VAS | |
| Notes | Jadad's: 5/5 R‐2, B‐2, W‐1 The evaluable poulation (patients who received all 4 treatments and at least one followup visit and who had no significant protocol deviation) was considered the primary planned analysis population NOT the intent to treat population. Screend patients: 888; Randomised patients: 372; ITT (safety) O4: 128, O3A1: 119, A4: 123; Evaluable: 336 O4: 115, O3A1: 107, A4: 114; Per protocol: 258 O4: 93, O3A1: 76, A4: 89 | |
| Risk of bias | ||
| Bias | Authors' judgement | Support for judgement |
| Allocation concealment (selection bias) | Low risk | A ‐ Adequate |
Neustadt 2005b‐4inj.
| Methods | See Neustadt 2005a‐3inj. | |
| Participants | ||
| Interventions | ||
| Outcomes | ||
| Notes | ||
| Risk of bias | ||
| Bias | Authors' judgement | Support for judgement |
| Allocation concealment (selection bias) | Unclear risk | D ‐ Not used |
Ozturk 2005.
| Methods | Randomised Controlled Trial Single‐blind Single centre 7‐day washout of NSAID | |
| Participants | Country: Turkey Mean age: 58.03 % Female: 97.5 Mean disease duration: NR Duration: 1 y Number randomised: 47 (HA: 24, HA+TA: 23) Inclusion: OA of the knee according to ACR criteria, Kellgren‐Lawrence grades II or III radiographically confirmed, pain in affected knee for at least 6 mth Exclusion: received intra‐ articular injection in the joint and/or attend physiotherapy for the affected knee within 6 mth prior to study, history of allergy or hypersensitive to drugs or eggs, ascertained or suspected to be pregnant or lactacting, known or suspected joint infection or a specific condition (neoplasms, diabetes mellitus, paresis, osteonecrosis, recent trauma) or poor general health that would interfere with the functional assessments during the study Baseline values: range of motion HA: 112.0 HA+TA: 118.8 50‐foot walking time HA: 23.7 HA+TA: 22.6 pain (VAS) HA: 66.7 HA+TA: 72.6 WOMAC pain HA: 14.3 HA+TA: 16.3 WOMAC stiffness HA: 4.1 HA+TA: 4.1 WOMAC function HA: 53.3 HA+TA: 49.0 WOMAC total HA: 71.8 HA+TA: 69.6 | |
| Interventions | Orthovisc (2 ml Biomeks) alone 3 weekly injections (Days 0,7,14) then 3 injections at month 6, Combined group: same as above but prior to lst and 4th HA injection, effusions aspirated and then 1 ml triamcinolone acetonid (Kenacort‐A, Bristol Myers Squibb) Concurrent therapy: paracetamol to a maximum of 2 g daily as considered appropriate by the physician was permitted; NSAID not permitted. | |
| Outcomes | WOMAC OA Index (Likert), pain (0‐100 mm VAS), ROM ‐ flexion only with a goniometer, 50 foot walking time (sec), assessment of effusion (peri‐ pheral measurement of knee), MRI ‐ cartilage evaluated with an eight grade system by 2 independent observers | |
| Notes | Jadad's: 3/5 R‐2, B‐0, W‐1 No statistically significant differences in demographic or clinical data at baseline. Although 47 patients enrolled, 7 in the HA+TA group were withdrawn as they did not meet inclusion criteria. | |
| Risk of bias | ||
| Bias | Authors' judgement | Support for judgement |
| Allocation concealment (selection bias) | Low risk | A ‐ Adequate |
Petrella 2002.
| Methods | Randomised Controlled Trial Double‐blind Placebo‐ controlled Parallel‐group 2 wk washout all OA medications ITT analysis | |
| Participants | Country: Canada Mean age: 65.5 % Female: 46 Mean disease duration: NR Duration: 12 wk Number randomised: 120 (30/group) Inclusion: radiographic evidence of Grade 1 to 3 medial compartment unilateral knee OA [Grade 1‐23%, Grade 2 ‐ 45%, Grade 3 ‐ 32%] >=3 cm current rest pain absence of non‐OA arthritides Exclusion: previous NSAID intolerance gastrointestinal hemorrhage peptic ulcer disease avian allergy intraarticular injection of HA or corticosteroid in previous 6 mth regular con‐ consumption of "herbal" OA products (e.g. glucosamine sulfate) Baseline values: WOMAC pain HA+PL: 3.32 NSAID+PL: 4.22 NSAID+HA: 3.65 PL: 3.62 WOMAC function HA+PL: 4.10 NSAID+PL: 4.32 NSAID+HA: 3.90 PL: 4.72 Rest pain: HA+PL:3.29 NSAID+PL:3.34 NSAID+HA:3.60 PL:3.30 Baseline xray: HA+PL: 2.2 (0.3) NSAID+HA: 2.2 (0.5) NSAID+PL: 2.3 (0.4) PL: 2.2 (0.2) based on Altman et al 1987 Arthritis Rheum. | |
| Interventions | Suplasyn 20 mg 3 weekly injections + placebo (lactose 100 mg po bid) Suplasyn 20 mg 3 weekly injections + 75 mg diclofenac/ 200 ug misoprostol po bid (Arthrotec) Saline 2 ml 3 weekly injections + 75 mg diclofenac/ 200 ug misoprostol po bid (Arthrotec) Saline 2 ml 3 weekly injections + placebo (lactose 100 mg po bid) All pts received 10 min home‐based resistance exercise program to be done at least 3x/wk but preferably most days/wk Concurrent therapy: 325 mg acetaminophen | |
| Outcomes | self‐report of cur‐ rent pain at rest on VAS WOMAC OA Index functional perfor‐ mance of self‐ paced walking test and a self‐ paced stepping test ‐ VAS scale of pain after completion and performance time range of motion VO2 max | |
| Notes | Jadad's:5/5 R‐2,B‐2,W‐1 Unilateral only Discrepancy between abstract and paper for rest pain mean and sd at baseline and sd at 4 wk. The sd for SPW and SPS pain at wk4 changed as well but WOMAC pain and function and walk time values did not change. Results only presented for Week 4 not Week 12. Study supported by Bioniche Life Sciences Inc. Dr. Hildebrand is affiliated with Bioniche Life Sciences Inc. Editorial reports that a factorial design analysis most efficient; a reanalysis found no evidence that Suplasyn had a signficant or important clinical effect on pain. | |
| Risk of bias | ||
| Bias | Authors' judgement | Support for judgement |
| Allocation concealment (selection bias) | Low risk | A ‐ Adequate |
Pham 2003.
| Methods | See Pham 2004 | |
| Participants | ||
| Interventions | ||
| Outcomes | ||
| Notes | One author of abstract, S. Brin, affiliated with Aventis, Paris, France. | |
| Risk of bias | ||
| Bias | Authors' judgement | Support for judgement |
| Allocation concealment (selection bias) | Unclear risk | B ‐ Unclear |
Pham 2004.
| Methods | Randomised Controlled Trial Double‐blind X‐ray scorers blinded Placebo‐ controlled Parallel group Multicentre (46 rheumatology departments) Parallel‐group Multicentre ITT (LOCF) Repeat treatme | |
| Participants | Country: France Mean age: 64.8 % Female: 68 Mean disease duration: NR Duration: 1 y Number randomised: 301 (NRD+PLDIA 131, PLINJ+DIA 85, PLINJ+PLDIA 85) Inclusion: outpt fulfilling the ACR clinical or radiological criteria for the diagnosis of knee OA, presenc eof a symptomatic primary painful medial femorotibial knee OA defined by a daily pain VAS score >30 mm in the previous mth, medial joint space width >2mm, radiographic evidence of knee OA, eligibility criteria and quality of radiographic films were verified by a central reader Exclusion: evidence of secondary knee OA (possibly due to injury, inflam‐ mation or meta‐ bolic rheumatic disease, osteonecrosis, Paget's disease, villonodular synovitis, haemophilia), prior ia HA treatment, other ia injection including lavage and corticosteroids within the previous 3 mth, treatment with diacerein in the 3 mth before inclusion and use of any other anti‐osteoarthritic drugs in the 2 mth before inclusion, contraindication to IA injection (anticoagulants, haematological anomalies), severe knee OA (JSW <2 mm, surgery required on the evaluated knee in the year) Baseline values: Pain (0‐100) NRD: 61.7 DIA: 59.6 PL: 59.1 Lequesne NRD: 11.1 DIA: 10.5 PL: 10.5 Pt global (0‐100) NRD: 59.7 DIA: 59.0 PL: 57.3 % of painful days during previous mth (0‐100) NRD: 85.5 DIA: 83.0 PL: 82.6 JSW (mm) NRD: 4.5 DIA: 4.5 PL: 4.7 | |
| Interventions | 1) NRD 101 ‐ 3 courses of 3 IA injections+ oral placebo, 2) IA injections of saline + Diacerein 50 mg twice daily, 3) IA injections of saline + oral placebo Concurrent therapy: Allowed to take analgesics as rescue drugs but 2‐day washout before evaluation visit; aspirin <500 mg/day allowed; NSAID allowed but 7‐day washout requied before each evaluation visit; no systemic corticosteroid, IA treatment or any potential symptom modifying drug was allowed during the study | |
| Outcomes | Pain (0‐100 mm VAS), Lequesne, Pt. global assessment of disease activity (0‐100 mm VAS), % of painful days during previous months (0‐100 mm VAS), use of concomitant treatments (analgesics and NSAIDs) evaluated by numbers of days of intake between each clinic visit, pt and investigator global assessment of treatment efficacy (5 point Likert: very good, good, moderate, bad, very bad), investigator global assessment of treatment safety on 5 level Likert scale, Structural: JSW, Kellgren Lawrence grade, osteophyte score on antero‐posterior X‐ray, % of progressors (joint space narrowing 0.5 mm) | |
| Notes | Jadad's: 5/5 R‐2, B‐2, W‐1 | |
| Risk of bias | ||
| Bias | Authors' judgement | Support for judgement |
| Allocation concealment (selection bias) | Low risk | A ‐ Adequate |
Pietrogrande 1991.
| Methods | Randomised Controlled Trial Open‐label Parallel‐group Multicentre ITT analysis | |
| Participants | Country: Italy Mean age: NR % Female:73 Mean disease duration: NR Duration:60 days Number randomised: 90 (HA 45, MPA 45) Inclusion: confirmed radiological signs of knee OA (Kellgren) and presence of pain Exclusion: knee joint disease other than OA severe concomitant diseases or diseases inter‐ fering with evaluation of knee joint OA pregnancy allergy skin infections other IA treatments in past 3 mth Baseline values: % pt pain under load strong HA:40, MPA: 64 % pt rest pain strong HA: 20, MPA: 22 % pt pain on touch strong HA: 18, MPA: 22 % pt night pain strong HA: 16, MPA: 11 | |
| Interventions | Hyalgan (20mg/2ml) 5 weekly injections at 7 day intervals 6‐methylprednis‐ olone acetate (40mg/1 ml) 3 weekly injections (Depo‐Medrol) Concurrent therapy: Analgesic & NSAID consumption assessed | |
| Outcomes | daytime spon‐ taneous pain on 100 mm VAS morning stiffness (min) range of motion (goniometer) pt and MD efficacy assessment (0= unsatisfactory,1=poor,2=fair,3= good,4=excellent)‐‐‐‐‐‐‐‐‐‐‐‐‐‐‐‐‐ night pain, rest pain, pain under load, touch pain (0=absent,1= slight, 2=moder‐ ate,3=strong,4= very strong) NSAID,analgesic consumption,0‐3:0=none,1=occa‐ sional,2=continu‐ ous low doses, 3=continuous high doses) effusion volume (ml) | |
| Notes | Jadad's:2/5 R‐1,B‐0,W‐1 Drugs supplied by Fidia S.p.A. P. Pierfederici and A. Perbellini, Fidia S.p.A. | |
| Risk of bias | ||
| Bias | Authors' judgement | Support for judgement |
| Allocation concealment (selection bias) | Unclear risk | B ‐ Unclear |
Puhl 1993.
| Methods | Randomised Controlled Trial Double‐blind Parallel‐group Multicentre (n=24) Efficacy analysis: per protocol, n=195, safety analysis: ITT, n=209 | |
| Participants | Country: Germany Mean age: 62 % Female: 64 Mean disease duration: NR Duration:18 wk (Wk 18 either in person or telephone follow‐up) Number randomised:209 (HA 102, PL 107) Inclusion: 40‐75 y informed consent idiopathic OA of knee defined by clinical and xray criteria (Lequesne) Exclusion: inflammatory jt disease ESR>40 mm RF >1:40 specific arthropathies (chondrocalcinosis, jt effusion >100 ml) excessive obesity severe axis deviations or instabilities protheses of lower limbs symptomatic hip IA injection in prior 3 mth infectious or febrile diseases joint or skin infections pregnancy contraindication to paracetamol Baseline values: pain HA:54.1, PL:51.4 Lequesne HA:10.4, PL:9.4 pain under load (% pt moderate/ severe) HA:90.5, PL:87.0 pain at rest (% pt moderate/ severe) HA:41.1, PL:35.0 pain starting to walk (% pt mod‐ erate/severe) HA: 73.3, PL:63.0 | |
| Interventions | Artz (25mg/2.5 ml) 5 weekly injections Placebo:sodium hyaluronate 0.25mg/2.5 ml 5 weekly injections Concurrent therapy: Paracetamol up to 1‐2 tabs of 500 mg tid daily permitted | |
| Outcomes | Lequesne paracetamol consumption‐‐‐‐‐ modified Lequesne pain last week,at rest, under load, starting (100 mm VAS) crepitation joint effusion joint mobility pt and MD global efficacy rating overall tolerance | |
| Notes | Jadad's:5/5 R‐2,B‐2,W‐1 Significantly more females in Artz group (73% versus 55%, P value 0.011) Retrospective analysis indicated patients >60 y and Lequesne >10 most likely to benefit from treatment. Work sponsored by Luitpold Pharma Munich. Statistical evaluations performed by Mr. Elsasser. | |
| Risk of bias | ||
| Bias | Authors' judgement | Support for judgement |
| Allocation concealment (selection bias) | Low risk | A ‐ Adequate |
Raynauld 2002.
| Methods | Randomised Controlled Trial Steering Committee blinded Multicentre (n=14) Parallel‐group Open‐label ITT analysis | |
| Participants | Country: Canada Mean age: 63 % Female: 70 Mean disease duration: 9.5 y Duration: 1 y Number randomised: 255 (AC+H 127, AC 128) Inclusion: >40 y primary diagnosis of radiologically verified OA in study knee symptomatic (>175/500 WOMAC pain) despite prior treatment with NSAIDs or acetaminophen ambulatory willing to participate sign informed consent Exclusion: Grade 4 (Kellgren) contraindicated per Hylan G‐F20 label inflammatory arthropathies tense effusion in study knee at baseline chondrocalcinosis varus or valgus deformity >12o in study knee steroid inj in prior 3 mths in study knee prior viscosupplementation isolated patello‐femoral OA uncontrolled morbidity particularly that in any joint which would impede measurements in study knee Baseline values: WOMAC pain AC+H: 11.35 AC: 11.94 WOMAC function AC+H: 39.54 AC: 40.20 | |
| Interventions | Appropriate care with hylan G‐F20 (AC+H) Appropriate care without hylan G‐F20 (AC) Concurrent therapy: Standard care | |
| Outcomes | Mean change in WOMAC LK3.0 pain score in study knee baseline to termination‐‐‐‐‐‐‐‐ % pts improved at termination from baseline for 1) 20% improve‐ ment WOMAC pain in study knee, 2) 20% WOMAC pain and either 20% ftn or stiffness in study knee pt global assessment of effectiveness for 1) OA in study knee, 2) OA in all jts, 3) overall health HRQOL: WOMAC, SF‐36, HUI3 safety: pt. self report during telephone inter‐ view and global assessments of side effects Assessments: Wk0,Mth1,2,4,6,8,19,12 (Wk 0 and Mth 12 at site; others by telephone interview) | |
| Notes | Jadad's: 3/5 R‐2,B‐0,W‐1 109 AC+H and 108 AC had bilateral knee OA. Tense effusion at baseline excluded pt. Although Grade IV xray grade was to be excluded, 20% of AC+H and 33% of AC had grade IV. An independent Steering Committee designed the study, developed analysis plan, resolved methodological issues and interpreted and disseminated results. A CRO, Innovus Research Inc., managed the study. Study was funded by Biomatrix, Inc.and Rhone‐Poulenc Rorer Canada Inc. Dan Pericak provided statistical analysis. | |
| Risk of bias | ||
| Bias | Authors' judgement | Support for judgement |
| Allocation concealment (selection bias) | Low risk | A ‐ Adequate |
Redd 2003.
| Methods | See Leopold 2003. | |
| Participants | ||
| Interventions | ||
| Outcomes | ||
| Notes | ||
| Risk of bias | ||
| Bias | Authors' judgement | Support for judgement |
| Allocation concealment (selection bias) | Low risk | A ‐ Adequate |
Rejaili 2005.
| Methods | Randomised Controlled Trial Single centre | |
| Participants | Country: Brazil Mean age: 54.5 % Female: 80 Mean disease duration: NR Duration: 6 mth Number randomised: 20 (HA 10, AR 10) Inclusion: knee arthrosis refractory to conservative treatment with blockage and pain symptoms, grade 3 Kellgren and Lawrence radiological classification Exclusion: NR Baseline values (preoperative): Pain in rest HA 7.90 AR 8.30 Pain with load HA 8.60 AR 9.20 Pain upon movement HA 8.40 AR 9.10 Diclofenac used HA 2.80 AR 2.50 Postoperative values: Pain in rest HA 3.20 AR 4.00 Pain with load HA 3.80 AR 4.50 Pain upon movement HA 3.90 AR 5.20 Diclofenac usage HA 0.90 AR 0.80 | |
| Interventions | Arthroscopy (articular lavage and debridement) plus 3 weekly injections of hylan G‐F 20, Arthroscopy alone Both groups instructed to stroll first postoperative day. Stitches removed at first visit after 2 weeks at which time the course of Hylan G‐F 20 was started. Concurrent therapy: potassium diclofenac permitted with daily usage recorded. | |
| Outcomes | VAS (patient saw "faces" and colours ranging from blue to red as pain increased while observer side showed absolute numerical value (0‐10) pain during the night, pain during movement with a 10% overload of weight on affected knee, pain reduction during the most painful movements of the knee, daily amount of potassium diclofenac used to relieve pain of the injured knee, chondral lesions at time of arthroscopy scored by Noyes and Stabler appud Lemark (grades I to III) | |
| Notes | Jadad's: 2/5 R‐1, B‐0, W‐1 No between group differences at baseline. Statistical analyses completed at Laboratory for Study Design and Data Analyses of the Dept. of Epidemiology and Public Health of the Medical School of Sao Jose do rio Preto. | |
| Risk of bias | ||
| Bias | Authors' judgement | Support for judgement |
| Allocation concealment (selection bias) | Unclear risk | B ‐ Unclear |
Roman 2000.
| Methods | Randomised Controlled Trial Blind Parallel‐group ITT analysis | |
| Participants | Country: Spain Mean age: 65 % Female:84 Mean disease duration:NR Duration: 6 mth Number randomised:49 (AD 30, HY 19) Inclusion: gonarthrosis by clinical and radiological criteria (Kellgren and Lawrence Grade 2 to 3) Exclusion: NR | |
| Interventions | Adant (25 mg/2.5 ml) 5 weekly injections Hyalgan (20 mg/2 ml) 5 weekly injections Concurrent therapy: Analgesics and/or NSAIDs monitored | |
| Outcomes | pt efficacy assessment (clinical improvement crieria rated as: excellent >75, good 50 to 75, fair 25 to 50, no clinical response <25) consumption of analgesic and/or NSAIDS | |
| Notes | Jadad's:3/5 R‐1,B‐1,W‐1 Imbalance in sample size per group. | |
| Risk of bias | ||
| Bias | Authors' judgement | Support for judgement |
| Allocation concealment (selection bias) | Unclear risk | B ‐ Unclear |
Scale 1994a (2 inj).
| Methods | Randomised Controlled Trial Double‐blind Blinded assessor Placebo‐ controlled Single centre 2 wk washout of NSAID and analgesics. ITT analysis | |
| Participants | Country: Germany Mean age: 60 %Female: Study A: 57 (37/65) Mean disease duration: 5.6 y Duration: 12 wk Telephone follow‐up at 26 wk Number randomised: Study A: 50 (HA 25, PL 25) Inclusion: >18 y male and female diagnosis of OA of the knee Grade 2 to 4 Larsen scale Exclusion: RA unreliable pain under weight bearing <40/100 mm VAS effusion present in the joint Baseline group differences: 1) Significantly more pts had Grade 4 xray in PL group 2) females in 2 inj group weighed significantly less than PL group | |
| Interventions | Study A: Hylan G‐F 20 2 ml (2 inj: end of washout and 2 wks later) Placebo: Phosphate‐ buffered saline 2.0 ml Concurrent therapy: No medication to treat arthritis pain allowed. | |
| Outcomes | weight bearing pain by pt and MD on VAS night pain pt and MD on VAS reduction of activity while performing daily tasks (joint mobility) assessed by MD during examination improvement in most painful knee movement by pt on VAS global evaluation of efficacy due to treatment by pt and MD on VAS Assessments: Wk 0,2,4,8,12,26 | |
| Notes | Jadad's:4/5 R‐1,B‐2,W‐1 Control groups combined for analyses in publication. Separate group results in PMA. Excluded pts with effusions. Arthrocentesis with removal of effusion if present. If bilateral OA, only most painful knee treated. Research was supported by Biomatrix, Inc. | |
| Risk of bias | ||
| Bias | Authors' judgement | Support for judgement |
| Allocation concealment (selection bias) | Low risk | A ‐ Adequate |
Scale 1994b (3 inj).
| Methods | See Scale 1994a above. | |
| Participants | Country: Germany Mean age: 59 % Female: Study B: 44 (24/55) Mean disease duration: 4.2 y Duration: 12 wk Telephone follow‐up at 26 wk Number randomised: 30 (HA 15, Pl 15) Inclusion/ Exclusion as above (Scale 1994a). Baseline group differences: 1) Significantly more patients had Grade 4 xray in PL group. 2) 3 inj group had significantly shorter disease duration at baseline. | |
| Interventions | Hylan G‐F 20 (2 ml) 3 weekly injections Placebo: Phosphate‐ buffered saline 2.0 ml Concurrent therapy: No medication to treat arthritis pain allowed. | |
| Outcomes | See Scale 1994a above. Assessments: Wk 0,1,2,3,8,12, 26 | |
| Notes | Jadad's:4/5
R‐1,B‐2,W‐1
See Scale 1994a above. Excluded pts with effusions. Arthrocentesis with removal of effusion if present. If bilateral OA only most painful knee treated. Research was supported by Biomatrix, Inc. |
|
| Risk of bias | ||
| Bias | Authors' judgement | Support for judgement |
| Allocation concealment (selection bias) | Low risk | A ‐ Adequate |
Schneider 1997.
| Methods | See Miltner 2002. | |
| Participants | ||
| Interventions | ||
| Outcomes | ||
| Notes | ||
| Risk of bias | ||
| Bias | Authors' judgement | Support for judgement |
| Allocation concealment (selection bias) | Unclear risk | D ‐ Not used |
Sezgin 2005.
| Methods | Randomised Controlled Trial Single‐blind | |
| Participants | Country: Turkey Mean age: 59.7 % Female: 75.6 Duration: 4 wk Number randomised: 41 (HA 22, PL 19) Inclusion: diagnosis of primary gonarthrosis based on modified ACR criteria, Kellgren‐ Lawrence grade II or III on plain x‐ray, presence of effusion in the painful and swollen kne, total pain score of 15 or over on the WOMAC OA Index, not receiving NSAIDs Exclusion: in the previous year, injection of HA or application of physiotherapy to the knees included in the study, administration of ia medicine to the knees included in the study or exposure to trauma within the previous 3 mth, oral or intramuscular administration of carticosteroids in the previous 2 mth, pregnancy or lactation, history of allergy and the preence of infectious, inflammatory, metabolic or malignant disease, presence of OA of the hip and the opposite knee severe enough to affect the evaluation of functions Baseline values: WOMAC pain HA: 18.9, PL: 17.2 WOMAC stiffness HA: 6.5 PL: 4.5 WOMAC function HA: 64.1 PL: 50.0 Flexion HA: 95.9 PL: 108.4 Walk time HA: 43.1 PL: 31.5 Knee circumference HA: 41.5 PL: 41.3 Effusion volume HA: 19.0 PL: 18.5 IL‐6 in pg/ml HA: 42.8 PL: 51.7 IL‐8 in pg/ml HA: 20.6 PL: 17.9 TNF‐alpha in pg/ml HA: 77.0 PL: 80.8 | |
| Interventions | Orthovisc (15 mg/ml) 2 ml three weekly injections, NaCl 0.9% 2 ml three weekly injections Both groups had any effusion aspirated before injection. All patients recommended to use bandages and apply cold and rest for 48h. All instructed to do isometric quadriceps exercises. Concurrent therapy: acetaminophen permitted but no other analgesics or NSAID allowed. | |
| Outcomes | IL‐6, IL‐8, TNF‐alpha, WOMAC OA Index (Likert: pain (5‐25), stiffness (2‐10), function (17‐85)), flexion, 25 m walking time (sec), circumference of knee measured in the middle of the patella (cm), amount of effusion (ml) | |
| Notes | Jadad's: 2/5 R‐1, B‐0, W‐1 Statistically significant poorer values in the HA group verus PL group for WOMAC pain, stiffness, function, flexion, and walking time | |
| Risk of bias | ||
| Bias | Authors' judgement | Support for judgement |
| Allocation concealment (selection bias) | Unclear risk | B ‐ Unclear |
Shichikawa 1983a.
| Methods | Randomised Controlled Trial Double‐blind Multicentre (n=38) Safety analysis: ITT, n=219 Efficacy analysis: per protocol, n=208 | |
| Participants | Country: Japan Mean age: NR % Female: NR Mean disease duration: NR Duration:5 wk Number randomised: 228 (HA 114, PL 114) Inclusion: knee OA with clinical symptoms with exercise pain & at least 1/3 radiographic change: joint space narrowing, sclerosis, bony spur formation written or oral consent Exclusion: severe JSN marked retention of synovial effuson IA corticosteroids or any other drug within 2 wk serious concurrent diseases drug allergy pregnant or lactating females pt whose info was difficult to obtain doctors judged unsuitable | |
| Interventions | sodium hyaluronate (25 mg/2.5 ml) 1.0% SPH (Artz) 5 weekly injections + placebo tablet 3T/day Placebo:sodium hyaluronate (0.25mg/2.5 ml) 0.01% SPH 5 weekly injections + placebo tablet 3T/day No local anesthesia. Concurrent therapy: No "new" arthritis treatment permitted. Physio that had been in effect >2 wk continued but no "new" PT. | |
| Outcomes | pain at rest, walking,up and down stairs, flexion and extension pain, oppressive pain, swelling, ballote‐ ment of patella, presence/absence of synovial effu‐ sion and volume range of motion: no symptom, mild, moderate, marked overall severity: mild, moderate, severe diary: VAS pain and activities of daily living: 10 min walk, up/down stairs,squat to pick up some‐ thing on floor, sit on floor or ta‐ tami, 5 classes: possible to do as normal person, fairly possible to do alone without much difficulty, fairly possible to do alone but often with difficul‐ ty, needed help of others, impos‐ sible subjective change in symptoms (1‐7: excellently im‐ proved,improved,fairly improved, unchanged, slightly worsened, worsened, markedly wor‐ sened) global effective‐ ness (1‐7: excel‐ lent improvement, good improve‐ ment,fair improvement, poor improve‐ ment,slight aggravation,moderate aggravation,marked aggravation) overall evaluation: final effectiveness (1‐7: excellent improvement, good improve‐ ment, fair improvement, poor improve‐ ment, slight aggravation, moderate aggravation, ex‐ treme aggrava‐ tion) + safety (1‐3:no side effect, side effect but drug contin‐ ued, drug dis‐ continued due to side effect) + usefulness (1‐7: extremely useful, useful,fairly use‐ ful,uncertain, slightly unfavor‐ able,unfavorable, extremely unfa‐ vorable) | |
| Notes | Jadad's:4/5 R‐1,B‐2,W‐1 In case of bilateral OA, worst side "mainly evaluated". Excluded marked synovial effusion. Synovial effusion aspirated and volume measured. Baseline pain going up and down stairs significantly more severe in Artz group (p<0.05). Work sponsored by Seikagaku Corporation. N. Ogawa in change of statistical analysis. | |
| Risk of bias | ||
| Bias | Authors' judgement | Support for judgement |
| Allocation concealment (selection bias) | Low risk | A ‐ Adequate |
Shichikawa 1983b.
| Methods | Randomised Controlled Double‐blind Multicentre (n=16) Safety analysis: ITT, n=103 Efficacy analysis: per protocol, n=98 | |
| Participants | Country: Japan Mean age: 62 % Female: 83 Mean disease duration: NR Duration: 5 wk Number randomised:107 (HA 52, PL 55) Inclusion: apparent clinical signs with pain on movement xray at least 1 of joint space narrowing, spur formation, osteosclerosis consent Exclusion: moderate to severe JSN varus or valgus deformities synovial effusion IA corticosteroid injection in past 2 wk pregnant or lactating females hard to communicate cases thought to be inadequate for trial by doctors in charge Baseline values: % pt moderate walking pain HA:52, PL:46 ROM HA:133.4, PL:128.6 pain score HA:1.03, PL:1.12 | |
| Interventions | sodium hyaluronate 5.0 ml of 0.5% SPH solution 5 weekly injections + 2 sugar coated lactose pills tid Placebo: 5.0 ml of 0.01% SPH solution 5 weekly injections + 2 sugar coated lactose pills tid Concurrent therapy: No "new" arthritis therapy permitted | |
| Outcomes | pain: rest, walking, up and down stairs, press, flexion and extension, sense of fever, swelling, range of motion, ballotement of patella (4 point scale: no symptom, mild, moderate, severe) disturbance of 4 activities of daily living: walk 10 min, up/down stairs, squat to pick up things from floor, sitting on floor or tatami: 5 ranks: can do as the normal people, scarcely possible by one‐ self and not so in‐ convenient, scarcely possible by oneself but inconvenience necessary for aid, totally impossible diary for activities of daily living and pain (knee pain at rest and at the beginning of motion:0=no pain,1=mild, 2= painful but mo‐ bile,3=painful & immobile,4=un‐ endurable pain & can do nothing) general improve‐ ment (1‐7: sig. improved,moder‐ately improved, lightly improved, no change,lightly worsened, mod‐ erately worsened sig. worsened) impression by pt (1‐7:sig. improved,fairly improved,slightly improved, no change,slightly worsened, fairly worsened, sig. worsened) general evalua‐ tion (1‐7: sig. improved,moder‐ately improved, slightly improved, no change, slightly worsened, moderately worsened, sig. worsened) general safety (1‐3: no side effect,side effect seen but can continue treat‐ ment, stop treat‐ ment because of side effect) usefulness judged on general improvement and general safety: 7 ranks: extremely useful, fairly useful, slightly useful, cannot judge whether useful or not useful, slightly undesir‐ able, fairly unde‐ sirable, extremely unde‐ sirable | |
| Notes | Jadad's:4/5 R‐1,B‐2,W‐1 Pt with moderate to severe synovial effusion excluded. If bilateral, evaluation completed on knee fulfilling entry criteria. Test drug provided by Seikagaku Kogyo Co., Ltd. | |
| Risk of bias | ||
| Bias | Authors' judgement | Support for judgement |
| Allocation concealment (selection bias) | Low risk | A ‐ Adequate |
St. J. Dixon 1988.
| Methods | Randomised Controlled Trial Double‐blind Parallel‐group Multicentre (n=3) Placebo‐ controlled Per protocol analysis | |
| Participants | Country: England Mean age: 69 % Female: 54 Mean disease duration: NR Duration: 48 wk Number randomised: 63 (HA 30, PL 33) Inclusion: outpatients of either sex and any age symptomatic OA of one of both knees informed consent Exclusion: inflammatory knee conditions, e.g. RA, psoriatic, pseudo‐ gout or joint infection OA of the hip which could confuse assessment poor general health skin conditions which would deter injection receiving regular analgesic therapy for reasons other than painful OA of the knee | |
| Interventions | Hyalgan (20 mg/2 ml) up to 11 injections over a 23 week period Placebo: l/100th of active, e.g. 0.2 mg sodium hyaluronate Concurrent therapy: Paracetamol 3000 mg daily permitted | |
| Outcomes | pain at rest and on movement (100 mm VAS) activities of daily living (6 activities scored 0=no diff‐ iculty to 7=activity impossible, total = 42) questioned and ex‐ amined for local or systemic adverse reactions | |
| Notes | Jadad's:4/5 R‐1,B‐2,W‐1 Dr. M. Massarotti, Dr. D. Massari and Dr. U. Cornelli of Fidia S.p.A. supported study and supplied clinical trial material. Dr. R. Kohn and Dr. J.F. Harper of Advisory Services, London helped with trial organisation. | |
| Risk of bias | ||
| Bias | Authors' judgement | Support for judgement |
| Allocation concealment (selection bias) | Unclear risk | B ‐ Unclear |
Tamir 2001.
| Methods | Randomised Controlled Trial Single‐blind Parallel‐group Open‐label Placebo‐ controlled Single centre | |
| Participants | Country: Israel Mean age: 71 (BH: 71, PL: 70) % Female: 73 Mean disease duration: NR Duration: 20 wk Number randomised: 49 (BH 25, PL 24) Inclusion: adults of either sex between 60‐85 y evidence of idio‐ pathic sympto‐ matic clinical OA of the knee as per Altman criteria and radiologically verified OA of the knee (stages 2 to 4: Kellgren & Lawrence: BH: 2‐6, 3‐16, 4‐3, PL: 2‐5, 3‐11,4‐7) in good general health no previous history of surgical treatment of joint or arthroscopy or injections to the knee in 6 mth prior to study start Exclusion: pts with knee OA originating from an i‐a fracture, RA, joint infection, other inflammatory & metabolic arthritis or OA of the hip joint, pt with significant systemic diseases allergy or atrophy or skin conditions overlying the joint which could cause adminis‐ tration of injections to be problematic, pt with copious joint exudates (>15 ml of aspirated synovial fluid) | |
| Interventions | BioHy 20 mg (10 mg/ml) 5 weekly injections Placebo: 2 ml of phosphate buffered saline 5 weekly injections Concurrent therapy: Para‐ cetamol and NSAIDs were permitted | |
| Outcomes | pain at rest and during activity‐‐‐‐‐ stiffness and physical function as per the MODEMS arthritic model (none=1, mild=2,moderate =3, severe=4, extreme=5) [looks like WOMAC] muscle strength, stiffness, and tenderness of joint upon palpation scored on same scale, active range of motion: 1= >135.2; 2=90 to 135; 3=45 to 90; 4= <45 | |
| Notes | Jadad's:3/5 R‐1,B‐1,W‐1 Third author is affiliated with Bio‐Technology General. | |
| Risk of bias | ||
| Bias | Authors' judgement | Support for judgement |
| Allocation concealment (selection bias) | Unclear risk | B ‐ Unclear |
Tascioglu 2003.
| Methods | Randomised Controlled Trial Blinded observer Open‐label Parallel‐group Single centre Per protocol n=55 (OR 28, 6‐MPA 27) | |
| Participants | Country: Turkey Mean age: 59 % Female: 100 Duration: 6 mth Number recruited: 69 Number randomised: 60 Inclusion: ambulant patients with idiopathic OA as per ACR criteria, Grade II or III knee OA by Kellgren and Lawrence system, pain under weight bearing >40/100 mm VAS Exclusion: Kellgren‐Lawrence Grade IV, knee joint disease other than OA, OA of the hip, OA of the feet, serious concomitant systemic diseases, ia injections within 3 mth prior to study start, skin infections overlying the joint, ia fluid effusion, history of allergy or hypersensitivity to drugs, treatment with anticoagulants, previous knee surgery Baseline values: Weight bearing pain 100mmVAS OR: 54.26 6‐MPA: 53.10 Walking pain OR: 67.60 6‐MPA: 69.00 Rest pain OR: 30.43 6‐MPA: 29.90 Lequesne OR: 10.23 6‐MPA: 9.86 Flexion OR: 108.70 6‐MPA: 108.06 | |
| Interventions | Orthovisc 15 mg/ml 2 ml once per wk for 3 wk, 6‐methylprednis‐olone acetate (6‐MPA) 40 mg/ml l ml once per wk for 3 wk Depo‐Medrol Concurrent therapy: paracetamol (maximum of 3 g/day) but not permitted 48 h before each injection and clinical assessment | |
| Outcomes | Pain at rest, at weight‐bearing, and on walking (100 mm VAS), Lequesne Index Flexion (degrees) | |
| Notes | Jadad's: 2/5 R‐1,B‐0,W‐1 | |
| Risk of bias | ||
| Bias | Authors' judgement | Support for judgement |
| Allocation concealment (selection bias) | Unclear risk | B ‐ Unclear |
Tekeoglu 1998.
| Methods | Randomised Controlled Trial Parallel‐group Open‐label ITT analysis | |
| Participants | Country: Turkey Mean age: 58 % Female: 100 Mean disease duration: 54 wk Duration:15 wk Number randomised: 40 (HA 20, BA 20) Inclusion: presence of pain Kellgren scale (result:Gr. 2 or 3) Exclusion: knee jt disease other than OA history of allergy, skin infections other i‐a treatments in the 3 mths prior to study Baseline values: WOMAC function HA:45.5, BA:45.6 maximum flexion HA:110.5, BA:116.0 | |
| Interventions | Sodium hyaluronate 20 mg (Orthovisc) 3 injections: 1 every 7 days Betamethasone 3 mg/ml (Celestone choronodose) 3 injections: 1 every 7 days Concurrent therapy: Paracetamol per‐ mitted | |
| Outcomes | Kellgren and Lawrence rating intensity of spontaneous pain and clinical severity in terms of pain felt during normal living activities(1=slight ,2=moderate,3= severe) WOMAC function subscale for ADL (1=none,2=mild, 3=moderate, 4=severe, 5=extreme) joint flexion in o NSAID use (0=none, 1=occasional, 2=continuous low doses, 3=continuous high doses) pt and investigator judgement of efficacy (0=un‐ satisfactory,1= poor,2=fair,3= good,4=excellent) morning stiffness effusion (presence/absence) Blood pressure and heart rate, blood and urine study start and end | |
| Notes | Jadad's: 2/5 R‐1,B‐0,W‐1 When present effusion extracted by arthrosynthesis to dryness Pt kept in rest for one day after inj Trial population consisted of all female. | |
| Risk of bias | ||
| Bias | Authors' judgement | Support for judgement |
| Allocation concealment (selection bias) | Unclear risk | B ‐ Unclear |
Thompson 2002.
| Methods | Randomised Controlled Trial Double‐blind Parallel‐group Multicentre (n=10) Non‐inferiority study | |
| Participants | Country: Germany Mean age: NR % Female: 64.5 Mean disease duration: NR Duration: 12 wk Number randomised: 321 (AR 160, GF20 161) Inclusion: Scored a total of between 41‐80 mm based on WOMAC OA Index mean pain subscale. Exclusion: NR Baseline values: WOMAC pain: AR: 49.20 GF20: 51.90 | |
| Interventions | Arthrease (20 mg/2 ml) 3 weekly injections Hylan G‐F 20 (16mg/2 ml) 3 weekly injections Concurrent therapy: acetaminophen up to 4 g daily after 1st injection. | |
| Outcomes | WOMAC OA Index Pain VA ‐‐‐‐‐‐‐‐‐‐‐‐‐‐‐‐‐‐‐‐‐‐‐ Escape medication usage, pt assessment of treatment (very satisfied, satisfied, slightly satisfied, dissatisfied), Global WOMAC including stiffness and physical function. | |
| Notes | Jadad's: 2/5 R‐1,B‐1,W‐0 The 3 authors of the abstract are affiliated with industry: J.I. Thompson, DePuy International Ltd., Y.W. Huang and R. Zaibel, Biotechnology General. | |
| Risk of bias | ||
| Bias | Authors' judgement | Support for judgement |
| Allocation concealment (selection bias) | Unclear risk | B ‐ Unclear |
Tsai 2003.
| Methods | Randomised Controlled Trial Double‐blind (masked observer) Placebo‐ controlled Parallel‐group Multicentre (n=3 hospitals, 6 investigators) Both ITT and per protocol analyses. | |
| Participants | Country: Taiwan Mean age: 65 % Female: 76 Mean disease duration: 427 days Duration: 25 wk Number randomised: 200 (HA 100,PL 100) Inclusion: >50 years of age, diagnosed with knee OA (ACR criteria: >50 y, crepitus, morning stiffness<30 min in duration) pain >= 40/100 mm VAS on 50 foot walk radiographic evidence Kellgren Lawrence II to III with predominance in TB compartment acute disease or trauma leading to secondary OA must have occurred at least 5 y before study entry Exclusion: severe degeneration of knee joint with marked joint narrowing, varus, or valgus deformity of knee (>12o) or other joint deformities, or other joint disorders (e.g. inflammatory joint disease, specific arthropathy, severe axis deviations or instabilities, joint or skin infections, joint prostheses of the lower limbs or symptomatic hip) ia steroid injections within the 2 wks prior to study entry Baseline values: Pain 50' walk HA: 47.85 PL: 45.65 WOMAC Pain HA: 45.73 PL: 45.39 WOMAC Function HA: 46.54 PL: 45.45 WOMAC Stiffness HA: 43.35 PL: 44.46 | |
| Interventions | Hyalgan 20 mg/2ml 5 weekly injections Saline 2 ml 5 weekly injections Concurrent therapy: acetaminophen permitted as escape medica‐ tion up to max 3 g/day but not on the day before study visit Not permitted: oral & parenteral corticosteroids, ia corticosteroid injections, NSAIDs or analgesics other than acetaminophen, topical analgesic preparations, rehabiliation, physical therapy, acupuncture | |
| Outcomes | Pain during 50 foot walk (100 mm VAS)‐‐‐‐‐‐‐‐‐‐‐ WOMAC (VAS), pt and iv overall effectiveness (1‐6:1=gravely worsened, 6= excellent improvement), acetaminophen consumption, 50 ft walk time, volume of synovial effusion in study knee, safety | |
| Notes | Jadad's: 2/5 R‐1,B‐1,W‐0 Fourth and fifth authors of abstract are affiliated with Fidia SpA, Italy. One author of manuscript is affiliated with Fidia S.p.A. Work supported by a grant from Medpharma. | |
| Risk of bias | ||
| Bias | Authors' judgement | Support for judgement |
| Allocation concealment (selection bias) | Unclear risk | B ‐ Unclear |
Tsukamoto 1995.
| Methods | See Yamamoto 1994 | |
| Participants | ||
| Interventions | ||
| Outcomes | ||
| Notes | ||
| Risk of bias | ||
| Bias | Authors' judgement | Support for judgement |
| Allocation concealment (selection bias) | Low risk | A ‐ Adequate |
Wobig 1998.
| Methods | Randomised Controlled Trial Double‐blind Screen blinded patient Blinded assessor Multicentre (n=4) 2 wk washout of NSAID and analgesics. ITT analysis | |
| Participants | Country: Germany Mean age: 62 % Female: 65 Mean disease duration: 6 y Duration: 12 wk Telephone follow‐up at 26 wk Number randomised: 110 (HA 52, PL 54, HA+PL 4) [117 knees: HA 57, PL 60] Inclusion: > 18 y male & female chronic primary OA of knee of Larsen Grade 1‐3 ESR < 40 mm/h RF < 1:160 daily pain on activity and persistent pain despite use of NSAIDs or analgesics Exclusion: pts with effusion in knee Baseline values: pt wtbearing pain HA:71, PL:75 pt night pain HA:42, PL:47 MD wtbearing pain HA:71, PL:75 MD night pain HA:41, PL:47 MD loss of activity HA:59, PL:67 | |
| Interventions | Hylan G‐F 20 (2 ml) 3 weekly injections Placebo: phosphate‐ buffered saline 2 ml 3 weekly injections Concurrent therapy: Standard care per‐ mitted: steroids, NSAIDs, analgesics, PT, surgery | |
| Outcomes | pt: pain wt bearing, at rest during night, decrease during most painful movement, treatment success MD: extent of pt's loss of activity while performing difficult daily tasks & treatment success all above on 100 mm VAS Assessments: Wk 0,1,2,3,8,12, 26 | |
| Notes | Jadad's:4/5 R‐1,B‐2,W‐1 Local analgesia was optional. If bilateral OA, only most painful knee treated. 7 pts bilateral ‐ 14 knees: 6 HA , 8 PL. Each knee randomised and analysed independently for efficacy but for safety these pts. were considered individuals. Time between treatment of two knees varied from 0 to 153 days. Pts with effusions excluded. Arthrocentesis with removal of effusion if present. At baseline, Larsen xray grade III to IV: HA: 28% versus PL:57%(p<0.05), duration of OA <1 y: HA: 28% versus PL: 10% (p<0.025) Work was supported by Biomatrix, Inc. | |
| Risk of bias | ||
| Bias | Authors' judgement | Support for judgement |
| Allocation concealment (selection bias) | Low risk | A ‐ Adequate |
Wobig 1999.
| Methods | ||
| Participants | ||
| Interventions | ||
| Outcomes | ||
| Notes | ||
| Risk of bias | ||
| Bias | Authors' judgement | Support for judgement |
| Allocation concealment (selection bias) | Unclear risk | D ‐ Not used |
Wobig 1999a (Healon).
| Methods | See Wobig 1999 | |
| Participants | Number randomised: Healon: 39 knees | |
| Interventions | ||
| Outcomes | ||
| Notes | ||
| Risk of bias | ||
| Bias | Authors' judgement | Support for judgement |
| Allocation concealment (selection bias) | Low risk | A ‐ Adequate |
Wobig 1999b (Artz).
| Methods | Randomised Controlled Trial Double‐blind Blinded assessor Multicentre (n=6) 2 wk washout of NSAIDs and analgesics. Efficacy analysis: both ITT and per protocol. Tolerability analysis: ITT | |
| Participants | Country: Germany Mean age: 60 % Female: 51 Mean disease duration: 4.6 y Duration: 12 wk Number randomised: 132 pts (148 knees) in 4 arms of trial. In 2 arms GF/AR: 70 patients (GF 38, AR 32) [73 knees: GF 38, AR 35] [Healon 39 knees, NE hylan 36 knees] Inclusion: > 18 y primary OA knee (Larsen 1 to 3) ESR < 40 mm/h RF < 1:160 daily, persistent pain despite use of pain relieving medications Exclusion: free of pain in OA knee detectable effusion in joint at time of first treatment considered unreliable by the investigator Baseline values: pt wtbearing pain HA:70, AR:72 MD wtbearing pain HA:69, PL:72 | |
| Interventions | Hylan G‐F 20 (2 ml) 3 weekly injections, Artz (2 ml) 3 weekly injections, Healon 3 weekly injections, Nonelastoviscous denatured hylan fluid 3 weekly injections Subcutaneous local anesthetic optional in both groups. Concurrent therapy: Standard care per‐ mitted | |
| Outcomes | wt bearing pain by pt and MD on 100 mm VAS overall treatment response by pt & MD(100mmVAS) improvement on most painful knee movement by pt 100 mm VAS Assessments: Wk 0,1,2,3,8,12 | |
| Notes | Jadad's:4/5 R‐1,B‐2,W‐1 Pt with detectable effusion excluded Arthocentesis with removal of effusion if present. If bilateral OA both knees could be treated and evaluated. 16 patients had bilateral OA. Each knee randomised and independently evaluated for efficacy. Time between treatment of two knees varied from 0 to 23 days but 11/16 had the same day. 4‐arm study but only 2 arms reported in publication (Hylan G‐F 20 and Artz). Biomatrix, Inc. provided support for this work and performed all elastoviscosity analyses. | |
| Risk of bias | ||
| Bias | Authors' judgement | Support for judgement |
| Allocation concealment (selection bias) | Low risk | A ‐ Adequate |
Wobig 1999c (NEhyl).
| Methods | See Wobig 1999 | |
| Participants | Number randomised: NE hylan fluid: 36 knees | |
| Interventions | ||
| Outcomes | ||
| Notes | ||
| Risk of bias | ||
| Bias | Authors' judgement | Support for judgement |
| Allocation concealment (selection bias) | Low risk | A ‐ Adequate |
Wu 1997.
| Methods | Randomised Controlled Trial Double‐blind Placebo‐ controlled Single centre Per protocol analysis: n=111 knees (60 Artz, 51 Placebo) | |
| Participants | Country: China Mean age: 69 % Female: 28 Mean disease duration: 19 mth Duration: 26 wk Number randomised: 90 [116 knees: Artz 62, PL 54] Inclusion: adults diagnosed as early OA (mild to moderate) by 4 senior orthopedic surgeons clinical symptoms with exercise pain, limitation of joint function and radiologic findings of bone spur, JSN, or osteosclerosis Exclusion: steroid IA injection functional disturbance of liver and kidney pregnancy severe degeneration of knee joints with marked joint narrowing, marked varus or valgus deformity or a large amount synovial effusion Baseline values: % pt moderate walking pain Artz: 36, PL:41 % pt mild rest pain Artz:53, PL:54 | |
| Interventions | Artz 2.5 ml 5 weekly injections Placebo:solvent for Artz (sodium chloride phosphate solution) 2.5 ml 5 weekly injections No local anesthetic drugs. Concurrent therapy: No antiinflammatory agent or physical therapy permitted | |
| Outcomes | pain: rest, walking, up/down stairs, flexion and extension, oppressive; swelling, ballote‐ ment of patella (4 grades: no symptoms, mild, moderate,severe symptoms); synovial fluid (vol), range of motion (degrees), actvities of daily living (walk 10 min, up/down stairs,squat to pick up some‐ thing, sitting on floor) impair‐ ment (1:no problem to do,2= fairly possible to do alone,3=pos‐ sible to do but often with incon‐ venience,4=need help,5=complete ly impossible) radiographic change (mild, moderate,severe), general improvement by pt and MD (1‐7: excellent improvement, improved, fair improvement, unchanged, slightly worsened, wor‐ sened, markedly worsened), overall evaluation effectiveness (1‐7:excellent improvement, improved, fair improvement, no change, slightly worsened, wor‐ sened, extremely worsened), usefulness (1‐7: extremely good, good, fairly good, uncertain, slightly unfavor‐ able, unfavor‐ able, extremely unfavorable), and safety (1‐3):no side effect, side effect but treat‐ ment continued, stop treatment due to side effect | |
| Notes | Jadad's:3/5 R‐1,B‐1,W‐1 Pts with large amount synovial effusion excluded | |
| Risk of bias | ||
| Bias | Authors' judgement | Support for judgement |
| Allocation concealment (selection bias) | Unclear risk | B ‐ Unclear |
Wu 2004.
| Methods | Randomised Controlled Trial Single‐blind Parallel group | |
| Participants | Country: China Mean age: 67 % Female: 55 Mean disease duration: 3 y Duration: 16 wk Number randomised: 150 5 groups with 50 per group 1) HA, 2) HA+low dose celecoxib (HALC), 3) HA + self‐ selected dose celecoxib (HASCC), 4) celecoxib (CEL), 5) Self‐selected celecoxib (SCC) Inclusion: NR Exclusion: NR Baseline values: WOMAC function HA: 67.7, HALC: 68.3, HASCC: 70.2, CEL: 71.3, SCC: 70.4 | |
| Interventions | 1) HA 2 ml (10mg/L) 5 weekly injections, 2) HA+low dose celecoxib (one course HA + 100 mg celecoxib once per day for 4 mth), 3) regular dose celecoxib 100 mg/day for 4 mth, 4) HA + self‐controlled dose of celecoxib (one course of HA + celecoxib 100 mg bid) and dosage could be decreased once symptoms well controlled), 5) voluntary celecoxib 100 mg bid and dosage could be decreased with symptom control Concurrent therapy: NR | |
| Outcomes | WOMAC physical function subscale‐‐‐‐‐‐‐‐‐‐‐ weekly dosage of celecoxib, total dosage of celecoxib, satisfaction level to the treatment protocol (bad, fine, good, and excellent) Assessments at baseline, Wks 1,2,4,,8,10,12,14,16 | |
| Notes | Jadad's: 2/5 R‐1, B‐0, W‐1 | |
| Risk of bias | ||
| Bias | Authors' judgement | Support for judgement |
| Allocation concealment (selection bias) | Unclear risk | B ‐ Unclear |
Yamamoto 1994.
| Methods | Randomised Controlled Trial Double‐blind Blinded assessor. Parallel‐group Multicentre (n=31) Safety analysis: ITT, n=199 Efficacy analysis: per protocol, n= 182‐184 | |
| Participants | Country: Japan Mean age: 66 % Female: 78 Mean disease duration: Not reported Duration: 5 wk Number randomised:203 (NRD 102, Artz 101) Inclusion: knee OA with definite pain or inflammatory symptom & demonstrating on xray 1 of: osteophyte formation, joint space narrowing, osteosclerosis age >=20 < 80 y if bilateral lesions, only one of lesions which satisfied criteria was selected Exclusion: definite 2o knee OA operation indicated oral or IV steroid or ia steroid or other drug within 2 wk of start of study NSAID or new PT within 2 wk lesion in hip or ankle of affected side RA pregnant, breast feeding or possibly pregnant judged by physician to be in‐ appropriate as study subject Baseline values: % pt moderate spontaneous pain NRD:31, Artz:31 % pt moderate walking disorder NRD:40, Artz:41 | |
| Interventions | NRD101 (25 mg/2.5 ml) 5 weekly injections Artz (25 mg/2.5 ml) 5 weekly injections No local anesthetics. Concurrent therapy: Analgesics, NSAIDs & physical therapy continued but no "new" therapy per‐ mitted | |
| Outcomes | clinical findings:4 grades of none, mild, moderate, severe for pain:spontaneous, pressure,night, on passive movement, inflammation: swelling of soft part of jt, floating patella, local feverish feeling, synovial fluid retention, activities of daily living disorder: sitting upright, up/down stairs, standing up, squatting, walking passive movement: flexion/extension, drainage: volume efficacy assessed by MD: overall im‐ provement: 7 grades: marked improvement, moderate im‐ provement, slight improve‐ ment, un‐ changed,slight aggravation,moderate aggrava‐ tion, marked aggravation) pt. impression ‐ how they felt about changes in symptoms (very good, good,fair, cannot say good or not, bad) comprehensive assessment based on 3: final overall improvement ratings (8 grades: same as above+ unassessable), global safety (5 grades: no adverse reaction,mild AR, moderate AR, severe AR, unassessable), usefulness (8 grades:very use‐ ful,useful,slightly useful,cannot say useful or not, slightly undesir‐ able, undesirable, very undesirable, un‐ assessable) | |
| Notes | Jadad's: 5/5 R‐2,B‐2,W‐1 MD who did inj different from MD who did assess‐ ment In case of bilateral OA, only one knee was evaluated. Bilateral: NRD 53, Artz 44; Unilateral: NRD 42, Artz 43 Puncture and drainage done as required. Artz provided by Seikagaku Corporation. M. Nakajima performed statistical analysis. | |
| Risk of bias | ||
| Bias | Authors' judgement | Support for judgement |
| Allocation concealment (selection bias) | Low risk | A ‐ Adequate |
Yentur 2003.
| Methods | Randomised Controlled Trial SIngle‐blind Blinded physician completed assessments | |
| Participants | Country: Turkey Mean age: 60.95 % Female: 100 Mean disease duration: NR Duration: 21 days Number randomised: 34 (HA 17, TP+HA 17) Inclusion: diagnosis according to ACR criteria, painful idiopathic knee OA with moderate to very severe pain (pain all the day under weight bearing or at rest) with x‐ray confirmation (Kellgren Lawrence grade 3 ‐ moderate joint space narrowing, osteophytes, subchondral sclerosis), all patients were using NSAIDs for more than one year, but stated that they did not have any beneficial effect Exclusion: intraarticular injection or physical therapy at least within the previous 6 mth, patients who had knee joint diseases other than OA, severe concomitant diseases, diseases interfering with the evaluation of knee joint function, skin infections, joint instability, hemorrhagic diathesis or major neuroses Baseline values: pain at rest: HA: weak 2, moderate 4, severe 9, very severe 1 HA+TP: moderate 2, severe 14, very severe 1 knee ROM HA: 116.2 HA+TP: 103.8 walking HA: weak 2, moderate 7, severe 6, very severe 1 HA+TP: weak 2, moderate 7, severe 8 stairs ascending/ descending HA: weak 1, moderate 5, severe 9, very severe 1 HA+TP: moderate 6, severe 11 | |
| Interventions | Orthovisc 2 ml three weekly injections plus at each session following IA injetion, trigger point (TP) injections with 0.5% lidocaine were performed in relevant TP according to Travell and SImons' guide‐ lines (rectus femoris, vastus medialis, vastus lateralis, sartorius, adductor longus, tensor fasciae latae, gracilis, pectineus, iliopsoas, biceps femoris, semitendinosus, semimembranosus, adductor magnus, gastrocnemius, soleus. Local twitch responses were induced on introducint the needle into the muscle. All patients were kept at rest for 2 days after each injection to avoid overcharging of the injected joint. Concurrent therapy: No other treatment modalities were permitted during the trial. | |
| Outcomes | Intensity of local pain at rest or during normal daily activities and activit restrictions (squatting, sitting down, ascending and descending stairs, walking, taking off socks, rising from bed, getting in or out of a car) were evaluated by a 5‐point scale (0= no pain, 1=mild, 2=moderate, 3=severe, 4=very severe), range of movement (flexion‐degrees) | |
| Notes | Jadad's: 2/5 R‐1, B‐0, W‐1 | |
| Risk of bias | ||
| Bias | Authors' judgement | Support for judgement |
| Allocation concealment (selection bias) | Unclear risk | B ‐ Unclear |
Characteristics of excluded studies [ordered by study ID]
| Study | Reason for exclusion |
|---|---|
| Aglas 1997 | Open, prospective study of HA in two subjects conducted in Austria with a 56‐month observation period. |
| Akermark 2002 | Open, non‐blind, prospective study of non‐animal stabilised hyaluronic acid (NASHA) (Durolane) in 103 subjects conducted at five centres in Sweden. Primary outcome was frequency of device‐related, unanticipated adverse events. Primary study involved a single injection of 60 mg/3 ml and follow‐up was for 3 months. In extension to primary study, 53 subjects received a second injection approximately 6 mths after the 1st and were followed up over a 1‐month period. |
| Akermark 2004 | Open, prospective, 12‐week study of non‐animal stabilized hyaluronic acid (NASHA) in 149 subjects conducted in Sweden. |
| Alonge 2004 | Open, prospective, 12‐week study of Synject in 20 subjects conducted in Nigeria. |
| Angel 2001 | Retrospective telephone survey of 69 patients with knee OA who had ia injections of Synvisc conducted South Australia. |
| Arizono 1997 | Not randomised, three‐month trial of Artz versus mepivacaine in 38 knees conducted in Japan. |
| Ates 2001 | Open, prospective, 21‐week study of Orthovisc (five weekly injections) in 21 subjects conducted in Turkey. |
| Bagga 2003 | Open, prospective, 6‐month study of Hylan G‐F 20 in 30 subjects conducted in Australia. Primary endpoints were synovial fluid HA concentration, molecular weight determination, viscosity and sulfated glycosaminoglycan levels. |
| Bardin 2004 | Open, prospective, 90‐day phase IV trial of Arthrum H in 3349 subjects conducted in France and Spain. |
| Barrett 2002 | Uncontrolled, retrospective, 18‐month study of Hyalgan in 249 subjects conducted at a single orthopaedic practice in Florida, USA. |
| Bell 1999 | Open, prospective, multicenter, 12‐month study in 60 subjects conducted in Canada. |
| Bellamy 2000 | Open, prospective, 6‐week study of Hylan G‐F 20 in 445 subjects conducted in Canada. This was a study of a learning intervention which tested the impact of an injection skills‐acquisition programme for family physicians. |
| Birbara 2004 | Open, multicentre extension study in 190 subjects conducted in Canada and the United States. This is an extension of the OAK0101 Orthovisc randomised, controlled trial (Neustadt 2004). |
| Bolgen Cimen | Open, prospective, six‐month study in 14 female subjects conducted in Turkey. |
| Bruce 2004 | Open, controlled, prospective, four‐year observational cohort study in 1860 subjects (1301 treated with Hylan G‐F 20 and 559 control) conducted in United States |
| Carrabba 1992 | Open, randomized, 60‐day, controlled study comparing Hyalgan and Orgotein (superoxide dismutase) in 118 subjects conducted in three centers in Italy. |
| Chhabra 2000 | Open, prospective, six‐month study of Hylan G‐F 20 in 120 subjects conducted in England. |
| Clarke 2001 | See Clarke 2005. |
| Clarke 2005 | Uncontrolled, prospective, 26‐week, pilot study of Hylan G‐F 20 in 43 subjects with patellofemoral osteoarthritis of the knee conducted in England. |
| Conrozier 2003 | Open, retrospective, 14‐month study of Hylan G‐F 20 in 155 subjects conducted in France. Objective was to identify factors predicting efficacy. |
| Couceiro 2003 | Open, prospective, non‐controlled, six‐month, multicentre study of Adant in 112 subjects conducted in Spain. |
| D'Agnolo 1988 | Open, prospective, 60‐day study of Hyalgan in 30 subjects conducted in Italy. |
| Dahlberg 1994 | Radiographs, obtained in a standardized manner at the time of arthroscopic examination, did not show any evidence of OA. |
| Evanich 2001 | Randomized, single‐blind, 26‐week controlled trial of Synvisc (hylan G‐F 20) and Aristospan 40 mg (triamcinolone hexacetonide) in 220 subjects with OA of the knee conducted in Seattle, WA. Abstract reports interim results for over 100 subjects; means and p values up to Week 12. |
| Faraawi 2003 | Retrospective telephone survey of 127 patients assessing satisfaction wih hylan G‐F 20 therapy. Patients treated from January 1999 to April 2002. Study conducted in Kitchener, Ontario, Canada. |
| Faus 2002 | Open, prospective, one‐year study of 35 subjects with severe knee OA conducted in Spain. Ultrasound was used to measure thickness of articular cartilage of lateral and medial femoral condyles. Femoral articular cartilage of contralateral knee was used as control group. |
| Frizziero 1993 | No clinical outcomes reported in abstract. Six‐month study comparing HA versus methylprednisolone in 24 subjects conducted in Italy. |
| Frizziero 1997 | No clinical outcome reported in abstract. Six‐month study comparing Hyalgan versus methylprednisolone in 99 subjects conducted in Italy. |
| Frizziero 1998 | Open, prospective, six‐month, pilot study of 40 subjects conducted in Italy. |
| Fuji 1994 | This study addresses the effect of concomitant use of local anesthetic with Artz. |
| Goorman 2000 | Open, prospective, six‐month, case series of Hylan G‐F 20 in 84 subjects conducted in USA. |
| Grecomoro 1992 | Study studies synergism between Hyalgan and dexamethasone. |
| Guerrero 1999 | Open, prospective, cohort study of Adant 10 mg/ml, 2.5 ml, five injections, in 20 subjects conducted in Madrid, Spain. Outcome based on cartilage markers (ACR abstract). |
| Guerrero 1999a | Open, prospective, cohort study of Adant 10 mg/ml, 2.5 ml, five injections, in 20 subjects conducted in Madrid Spain. Outcome based on cartilage markers (OARSI abstract). |
| Hamburger 2004 | Retrospective review of 171 subjects between 1997‐2002 comparing Hyalgan and Synvisc conducted in New York. |
| Hashimoto 1992 | Open, prospective (up to two years and 11 months) study of Artz in 35 knee joints conducted in Japan. |
| Honma 1989 | Open, prospective study of Artz in 83 subjects conducted at 13 institutions in Japan. |
| Igarashi 1983 | Open, prospective, 40‐week study of Artz in 43 subjects conducted at 19 centers in Japan. |
| Ines 2002 | Open, prospective, six‐month, rheumatology clinical study of Synvisc, triamcinolone hexacetonide and methylprednisolone acetate with and without joint lavage in 85 subjects of a mixed population (34% OA) conducted in Portugal. |
| Iseki 1983 | Sodium hyaluronate 25 mg versus sodium hyaluronate 1%. Article is in Japanese. |
| Iwasaki 1993 | This study addresses the effect of concomitant use of local anesthetic with Artz. |
| Johnson 2004 | This was an audit of clinical practice in 40 patients with knee OA who had received Hyalgan conducted in England. |
| Kawakami 1993 | Open, prospective clinical evaluation of Artz in 45 subjects with moderate or severe OA of the knee conducted in Japan. |
| Kolarz 1995 | Randomised, controlled, multicentre, comparative, phase III trial with a masked observer design conducted in Austria and Germany. Comparison of five intra‐articular injections of Hyalgan and 10 intra‐articular injections of the glycosaminoglycan polysulphase (Arteparon). The planned sample size was 144 subjects. Due to the withdrawal of Arteparon from the Austrian and German markets, the design of the trial was changed; data from only 53 patients who had completed the first treatment cycle (day 0‐35) were analysed. |
| Kolarz 2003 | Open, multicenter, observational study conducted at 14 Austrian rheumatologic and orthopedic centers. 108 patients were treated with Hyalgan once weekly for five weeks. A repeat course was administered if patients continued to fulfill the inclusion criteria but not earlier than month 4. |
| Kotz 1999 | Open, multicenter, prospective, 12‐month study of Hyalgan in 108 subjects conducted at 14 centers in Austria. |
| Koyuncu 2002 | Open, prospective, one‐year study of hyaluronate in 21 subjects conducted in Turkey. |
| Koyuncu 2003 | Open, prospective, three‐week study of Hylan G‐F 20 conducted in Turkey. |
| Kumar 2003 | Open, prospective, one‐year clinical service study of Hyalgan in 91 subjects conducted at one rheumatology department in England. |
| Kurokawa 1994 | Open, prospective, 12‐week study of NRD‐101 in 114 subjects conducted in Japan. |
| Lee 1999 | Open, prospective, 12‐week study of Hyruan in 48 subjects with OA of the knee conducted in Korea. [English abstract, article in Korean] |
| Lee 2004 | Open, prospective, one‐year study of Hylan G‐F 20 in 74 patients in an orthopaedic surgery clinic conducted in the United States. |
| Legre 2001 | Study subjects had both osteoarthritis of the knee and calcium pyrophosphate dihydrate (CPPD) deposition diseases. Open, prospective, six‐month study of Hylan GF‐20 in 21 subjects conducted in France. |
| Leopold 2002 | This is not a randomised controlled trial. Objective of trial was to test hypothesis that the likelihood of a painful reaction to Hylan G‐F 20 did not increase in patients who received more than one course of treatment. The single course group (n=42) was prospectively followed as part of a randomised trial. The repeat course group (n=19) was retrospectively identified from a chart review. This was a 15‐month, single centre study conducted in the USA. |
| Lussier 1996 | Retrospective review of clinical practice of Hylan G‐F 20 in 336 subjects conducted at five Canadian centers with 2.5 yr follow‐up. |
| Magobotha 2001 | Open, prospective, six‐month study of Hylan G‐F 20 in 166 subjects conducted in South Africa. |
| Mathieu 2001 | Open, prospective, 14‐month study of Hylan GF‐20 in 155 subjects conducted in France. Assessed predictive factors of long‐term efficacy. |
| Mazieres 2004 | An observational, naturalistic, open‐label, multicentre, nine‐month study of Suplasyn in 232 subjects conducted in France. |
| Mazzocato 1987 | Open, prospective, 60‐day study of Hyalgan in 22 subjects. |
| Megyeri 1993 | Open, prospective, four‐week study of sodium hyaluronate 20 mg in 23 subjects conducted in Hungary. |
| Mensitieri 1995 | No clinical outcomes reported. Study of Hyalgan, arthrocentesis, and placebo in 60 subjects conducted in Italy. |
| Milini 1989 | Open, prospective, 60‐day study of Hyalgan in 23 subjects. |
| Miller 1999 | Open, prospective, one‐year study of Hylan G‐F 20 in 108 subjects conducted in the USA. |
| Minami 1993 | Open, prospective study of SLM‐10 in 33 subjects conducted in Japan. |
| Moller 2001 | Open, prospective, six‐month study of Ostenil in 40 subjects conducted in Spain. |
| Monfort 2000 | Open, prospective, three‐month study of hyaluronic acid (three injections) in 50 subjects conducted in Barcelona, Spain. Studied treatment with HA in subjects with gonarthrosis with and without chondrocalcinosis. |
| Myburgh 2001 | Open, prospective, 24‐week case series of Hylan G‐F 20 in 18 subjects conducted in South Africa. |
| Namiki 1982 | Open, prospective study of Artz in 43 subjects conducted in Japan. |
| Neustadt 2001 | Open, prospective, greater than two‐year study of intra‐articular hyaluronate (five weekly injections) in 92 subjects conducted in Louisville, USA. |
| Neustadt 2003 | Open, prospective, two‐year study of intra‐articular hyaluronate (Hyalgan) in 76 patients (92 knees) conducted in Louisville, KT, USA. 13 patients had a repeat treatment course. |
| Novaes 2005 | Open, prospective, multicentre, four‐week study of 25 mg/2.5 ml of hyaluronan (Meiji Seika Kasha, Ltd., Tokyo, Japan, MW 900 kDa 5 intraarticular injections) in 365 subjects conducted in seven Latin American countries. |
| Oberoi 2004 | Open, prospective, four‐year sudy in 75 subjects of Hyruan plus arthroscopic joint debridement compared to arthroscopic joint debridement alone conducted in India. |
| Olszynski 2002 | Open, prospective, clinical practice study of Synvisc, Suplasyn, Orthovisc and Neovisc in 267 subjects in a Canadian rheumatology practice. |
| Ono 1993 | Open, prospective study in 72 subjects conducted in Japan. |
| Ono 1993a | Open, prospective, multicentre study in 26 subjects conducted in Japan. |
| Oron 2003 | Open, prospective, clinical practice study of Orthovisc and Synvisc in 522 subjects conducted in Israel. |
| Oshima 1983 | Open, prospective study of Artz in 206 subjects conducted in Japan. |
| Pasquali Ronchetti | Randomized, open‐label, six‐month study of Hyalgan and Depomedrol in 99 subjects conducted at one centre in Bologna, Italy. This paper reports the structural varibles of the synovial membrane. Clinical and arthroscopic findings will be the subject of a separate publication. |
| Pavelka 2002 | Multicenter, open, prospective, 17‐week, observational study of Hyalgan in 601 subjects conducted at 35 centers in the Czech Republic. |
| Pavelka 2002a | See Pavelka 2002. |
| Payne 2000 | Randomised, doube blind, placebo‐controlled, three‐month trial of Suplasyn (three weekly injections) and saline (three weekly injections) in 46 subjects (40 randomised) conducted in Canada. Both groups given a programme of flexibility and stretching exercises. Acetaminophen was permitted for pain. The objective was to test if Suplasyn improved proprioception. No OMERACT efficacy outcome measures were reported. Primary outcome was absolute angular error measured with an electrogoniometer. |
| Petrella 2003 | Retrospective study of 493 patients with unilateral knee OA treated with Suplasyn was conducted over 4.5 years in London, Canada. |
| Petrella 2003a | Cross‐sectional, retrospective cohort analysis of 53000 subjects in more than 35 famly practice clinics in Southwestern Ontario, Canada. Aim is to determine and compare the tolerance and efficacy of intra‐articular viscosupplementation of HA for the treatment of OA with other products for the same indication. Safety profile of Suplasyn versus other treatment options studied. VAS walking and rest pain, BMI, comorbidity, global assessment as well as pharmacoeconomic parameters collected. |
| Petrella 2003b | A retrospective study of 537 subjects with unilateral OA of the knee treated with Suplasyn conducted over 4.5 years in Canada. 481 subjects received a second series. Improved walking and rest pain reported for both first‐ and second‐time subjects with low incidence of adverse events and high treatment satisfaction. |
| Petrella 2005 | A prospective, naturalistic cohort study of 537 subjects with unilateral OA of the knee treated with Suplasyn conducted over 6.7 years in Canada. Repeat injection was permitted. |
| Pipino 1990 | Open, prospective, 35‐day study in 100 subjects. |
| Punzi 1988 | Open, prospective, seven‐day, single centre study in mixed study population of 17 subjects (seven OA) conducted in Italy. |
| Rao 2001 | Open, prospective, six‐month study of dedicated viscosupplementation clinic ascertaining which patient groups would derive the most benefit from Hyalgan conducted in England. |
| Rastogi 2005 | Open, prospective, six‐month study conducted of 30 patients conducted at two orthopaedic centres in New Delhi. Patients received a series of five Hyruan ia injections (25 mg/2.5 ml). |
| Russell 1992 | Abstract only published. 210 subjects randomised to either HA or Placebo or No‐intervention. Two centers in USA conducted this 14‐week study. |
| Scali 1995 | Open, prospective, three‐month study of Hyalart in 75 subjects conducted in Argentina. |
| Sepici 2002 | Open, prospective, case‐control, one‐month study of Orthovisc in 15 female subjects and 16 age‐matched healthy controls conducted in Turkey. |
| Shibata 1993 | Open, case series of Artz in 532 subjects conducted in Japan |
| Sieliwonczyk 1997 | Open, prospective case series. |
| Singh 2004 | See Bruce 2004. This is the same study as the Bruce 2004 reference (Measurement of Outcomes from Viscosupplementation Effectiveness Study (MOVE)). This is a longitudinal observational cohort study of 1860 subjects conducted in the United States. |
| Sripada 1999 | Retrospective pilot study of Hylan G‐F 20 and hyaluronan in 100 subjects conducted in the USA. |
| Stambuk 2001 | Open, prospective, 12‐week study of Hylan G‐F 20 in 35 subjects with bilateral knee OA with effusion conducted in Zagreb, Croatia. Control group was contralateral knee of same subject. |
| Suzu 1990 | Open, prospective, 18‐month study of ARTZ in 15 subjects conducted in Japan. |
| Suzu 1993 | Open, prospective study in 43 subjects conducted in Japan. |
| Takeuchi 1993 | Open, prospective study of 82 subjects conducted in Japan. |
| Taneda 1993 | Open, prospective study of 28 subjects conducted in Japan. |
| Tang 2004 | A case‐comparison study of 15 subjects (30 knees) with symptomatic knee OA and 15 age‐, mass‐ and gender‐matched non‐OA control subjects (30 knees). Gait patterns and sagittal ground force reaction forces after intraarticular injection of Artz or 2.5 mL of .01% sodium hyaluronate/ampoule; MW 860 kd was injected once a week for a total of 5 injections. |
| Tang 2005 | Open, prospective study of 25 subjects conducted in Taiwan. HA with a MW of 860 kd (Artz) was injected once a week for five consecutive weeks. Main purpose of study was to demonstrate if knee muscle strength could be increased in patients with knee OA after injection of HA. |
| Toh 2002 | Open, prospective, 12‐week study of Orthovisc in 60 patients conducted in the United Kingdom. Patients with a minimal to mild loss in joint space are most likely to benefit from HA supplementation. |
| Toh 2003 | A prospective cohort of 60 patients received a standard course of ia viscosupplement. Followup was for 12 weeks. WOMAC was outcome. Concluded that only patients with a minimal to mild loss in joint space on radiological examination are most likely to benefit from ia viscosupplementation (cf not those with moderate to severe OA changes in joint space). |
| Torrance 2002 | This paper reports the economic results of the trial. The clinical results and health‐related quality of life outcomes for this trial are reported in the Raynauld 2000 manuscript. This prospective, one‐year, open‐label health economic trial compared Appropriate Care with Hylan G‐F 20 to Appropriate Care without Hylan G‐F 20 in 255 subjects at 14 sites in Canada. |
| Turajane 2005 | An uncontrolled, retrospective cohort study of 83 subjects conducted at a single centre in Bangkok, Thailand between 1998 and 2002. Purpose was to determine the clinical factors that may influence results of treatment with Hyalgan for subjects who had failed conservative treatment and who were recommended for surgical treatment. |
| Turajane 2005a | A retrospective cohort study carried out between 1998 and 2004 of 109 Kellgren Lawrence grade 4 knee OA patients who failed conservative treatment. Conducted at a single centre in Bangkok, Thailand. A pharmacoeconomic analysis of Hyalgan was completed. A second objective was to determine the clinical indicators for successful outcomes and patient satisfaction. |
| Uebelhart 2003 | Retrospective survey of 467 subjects conducted at 23 centres in Switzerland. Previous 15‐month data extracted. Ostenil and Synvisc were the main products evaluated. |
| Vad 2000 | Open, prospective, one‐year study of knee lavage plus Hylan G‐F 20 versus Hylan G‐F 20 in 81 subjects conducted in the USA. Both groups received an eight‐week home rehabilitation programme and knee cryobrace. |
| Vad 2003 | Nonrandomized, prospective, one‐ year study of knee lavage plus Hylan G‐F 20 versus Hylan G‐F 20 in 81 subjects conducted by a single physician in faculty practice at a major teaching hospital in the USA. All participants received an 8‐week programme of home knee rehabilitation exercise combined with aquatherapy and use of a knee cryobrace 15 minutes a night. |
| Waddell 2001a | Retrospective study from November 1, 1997 to February 29, 2000 of tolerance of Hylan G‐F 20 using fluoroscopically‐confirmed injection and effectiveness of retreatment in 598 subjects conducted in the USA. |
| Waddell 2001b | Retrospective study from 1997 to 2000 of Hylan G‐F 20 to assess the effect of several independent factors on probability of progression to total knee replacement in 1253 subjects conducted in the USA. |
| Waddell 2001c | Pharmacoeconomic model with inputs obtained from peer reviewed medical literature, clinical trial data, clinical expert opinion, and claims data. A hypothetical cohort of subjects was followed over a three year period. Analysis conducted from the perspective of a managed care plan. |
| Waddell 2003 | Open, prospective, one‐year study of hylan G‐F 20 in 70 subjects conducted in the USA. Objective was to evaluate a second course of hylan G‐F 20. |
| Waddell 2003a | A retrospective, case‐control study of 110 who had undergone TKR and 1151 who had not undergone TKR. Effects of age, gender, BMI, and viscosupplementation with hylan G‐F 20 were evaluated on the probabilit of progression to TKR. Repeat treatment with hylan G‐F 20 was also analysed. Conducted in USA. |
| Waddell 2003b | A retrospective, four and a half year study of 1047 patients (1489 knees) who had received at least one intraarticular injection of hylan G‐F 20 conducted at an orthopaedic practice in the USA. |
| Waddell 2003c | Open, prospective, 26‐week study of Hylan G‐F 20 in 85 patients conducted at an orthopaedic practice in the USA. |
| Weiss 1999 | Open, prospective, 12‐month study of Hylan G‐F 20 in 93 subjects conducted in the USA. |
| Wobig 1999d | Open, prospective, 12‐week, multicenter study of Hylan G‐F 20 in 222 subjects conducted in Germany. |
| Wulwik 2001 | Open, prospective, cohort, two‐year study of Synvisc in 117 subjects with severe knee OA conducted in France. |
| Yoh 1989 | Open, prospective, six‐month study of Artz in 35 subjects conducted in Japan. |
| Zamora‐Quezada 2004 | Open, prospective study of an electronic data capture system involving Hyalgan in 43 subjects conducted in the United States. |
Characteristics of ongoing studies [ordered by study ID]
Anonymous 1999.
| Trial name or title | Orthovisc versus saline: a double‐ blind randomised controlled trial |
| Methods | |
| Participants | |
| Interventions | Orthovisc versus saline |
| Outcomes | |
| Starting date | |
| Contact information | Anika Therapeutics Press Release August 1999 |
| Notes |
Hempfling 2003.
| Trial name or title | Long‐term outcome of synovial fluid substitution with Viscoseal post‐ arthroscopy Prospective, randomised, masked‐observer study |
| Methods | |
| Participants | 80 patients with severe pain in knee joint persisting for at least six months (VAS pain greater than 50 mm) |
| Interventions | arthroscopic lavage versus Viscoseal (50 mg/10 ml) one intra‐articular injection immediately after arthroscopy |
| Outcomes | Outerbridge, VAS (investigator) VAS (pain diary) by patient daily, clinical global impression, problems when walking 100 m, Pain when walking 100 m, pain at night, safety |
| Starting date | |
| Contact information | Prof. Dr. med. Harald Hempfling, Berufsgenossenschaftliche Unfallklinik, D‐82418 Murnau am Staffelsee |
| Notes |
ISRCTN43185756.
| Trial name or title | Comparative study between intraarticular ostenil versus orthovisc |
| Methods | |
| Participants | 73 patients with OA of the knee both male and female. |
| Interventions | Ostenil or Orthovisc a single course |
| Outcomes | WOMAC/VAS pain scale is primary outcome outcome. |
| Starting date | 01/05/2004 |
| Contact information | Mr. David Teanby, Consultant Orthopaedic Surgeon, St Helens & Knowsley Hospitals NHS Trust, Whiston Hospital, Prescot, Merseyside L35 5DR, United Kingdom |
| Notes | Sources of funding: St. Helens & Knowsley Hospitals NHS Trust, NHS R&D Support Funding. Prospective masked observer RCT. |
ISRCTN51421587.
| Trial name or title | Viscosupplementation for osteoarthritis of the knee: protocol for the Swiss viscosupplementation trial (SVISCOT) |
| Methods | |
| Participants | Males and females with radiologically confirmed symptomatic OA of the knee for at least six months, with pain on most days for the previous three months, will be eligible for trial if they fulfill ACR clinical criteria for OA of the knee; have an ACR functional class rating of II to IV, and have failed to respond sufficiently or were intolerant to conservative treatment. |
| Interventions | Synvisc, Orthovisc or Ostenil Up to three treatment cycles per knee (one cycle consisting of three injections) |
| Outcomes | Primary outcome is rate of patients who reach a WOMAC total score of 39 or greater plus the rate of individuals who have undergone tootal knee replacement surgery after 24 months of follow‐up. Secondary outcomes will be (1) the severity of OA symptoms based on the WOMAC pain sub‐scale and the WOMAC global scale on pain, stiffness and disability, (2) the cost‐utility based on health related quality of life measured by EuroQol and self‐reported healthcare utilisation for OA, (3) the frequency of local side effects, (4) serious adverse events, (5) the rate of surgical interventions for knee OA other than total knee replacement, and (6) overall mortality |
| Starting date | July 2002 |
| Contact information | juni@ispm.unibe.ch Maya Zullig MD, Research Officer Swiss Federal Office of Social Insurance (OFAS), Berne, Switzerland |
| Notes | Pilot trial of 600 patients (200/group); main trial 9000 to be randomised ISRCTN51421587 |
ISRCTN82192623.
| Trial name or title | Prospective randomised single‐blind trial comparing the effectiveness of combined arthroscopic washout and intra articular hyaluronan injection to intra articular hyaluronan injection and arthroscopic washout in isolation, for osteoarthritis of knee |
| Methods | |
| Participants | 219 patients |
| Interventions | Arthroscopic washout followed by intra‐articular HA injection versus arthroscopic washout and intra‐articular HA injection in isolation |
| Outcomes | |
| Starting date | 01 Jan 2002 |
| Contact information | Mr. A. Mohsen Orthopaedic Department, Hull Royal Infirmary, Anlaby Road, Hull HU3 2JZ UK Tel:+44 01482 328541 |
| Notes | End date: 31 Mar 2005 ISRCTN82192623 |
NCT00130468.
| Trial name or title | A double blind, randomized trial of intra‐articular injections of 20 mg of Hyalgan for the treatment of knee pain due to osteoarthritis (three injection‐regimen for efficacy and duration ‐ 20 mg/2ml dose: Tread‐20) |
| Methods | |
| Participants | Phase IV randomised, double‐blind, placebo controlled, parallel group Inclusion criteria: 12 criteria: written consent, 40 yr of age and above, of sufficient good health to be able to complet 6‐month follow‐up, signs and symptoms of OA of at least one knee according to ACR criteria, Kellgren‐Lawrence Grade II or III, symptoms including knee joint pain, crepitus, swelling, and/or effusion of the knee for at least 6 mths, pts on analgesic/NSAID VAS pain score after walking on a 50 foot flat surface of greater than or equal to 30 mm but less than 90 mm, if not taking analgesic/NSAIDVAS pain score after walking of greater than 40 mm but less than 90 mm, if bilateral knee pain is present, investigator will select the more painful knee Exclusion criteria: 4 general, 28 musculoskeletal related, 16 concomitant conditions, diseases, medications and/or clinical history related |
| Interventions | Hyalgan |
| Outcomes | |
| Starting date | |
| Contact information | Suzanne Meeves Study Director Sanofi‐Aventis |
| Notes | Sponsored by Sanofi‐Aventis ClinicalTrials.gov Identifier: NCT00130468 |
NCT00131352.
| Trial name or title | A study of the safety and efficacy of Synvisc in patients with symptomatic osteoarthritis of the knee |
| Methods | |
| Participants | Country: Belgium (4 sites), Czech Republic (4 sites), France (5 sites), Germany (1 site), Netherlands (2 sites), United Kingdom (5 sites) Duration: 26 wk with possible repeat treatment after this time Inclusion criteria: age 40 years and above, pts with symptomatic OA pain of the knee Exclusion criteria: Pts with current or prior conditions or treatment that would impede measurement of efficacy or safety |
| Interventions | Hylan G‐F 20 Placebo |
| Outcomes | Pain relief |
| Starting date | May 2005 |
| Contact information | David Perkins Study Director Genzyme |
| Notes | Sponsored by Genzyme. ClinicalTrialsgov. Identifier: NCT00131352 Expected completion: December 2006 |
NCT00139295.
| Trial name or title | Comparison of the efficacy and safety of Hylastan to methylprednisolone acetate in patients with symptomatic osteoarthritis of the knee |
| Methods | |
| Participants | Males and females 40 years and above diagnosed with OA of the knee. Have tried but not been sufficiently helped by conservative treatment such as weight reduction and pain medications. Exclusion: prior or concomitant treatments that would impede measuremen tof safety and efficacy |
| Interventions | Hylastan and active control |
| Outcomes | Pain relief |
| Starting date | October 2004 |
| Contact information | David Perkins, R.Ph., Study Director, Genzyme |
| Notes | Expected completion: March 2007, Data entry closure: December 2006 |
NCT00144820.
| Trial name or title | Intra‐articular injections of hyaluronan versus 20 MI NaCl versus placebo in treatment of knee osteoarthritis: a randomised, double‐blind, placebo controlled single centre trial |
| Methods | |
| Participants | Males and females 60 years and above with clinical, radiological and possible arthroscopical verified knee OA; knee pain on the day of examination scoring more than 20 mm on a VAS at baseline. Exclusion: less than 60 y, unconsciousness, psychosis, demens, ingestion of drugs that may influence the results of the clinical examinations, inflammatory diseases of the joints, RA or other inflammatory arthritis as diagnosed by ACR criteria, contraindication to Hyalgan treatment, previous intra‐articular fracture of a knee joint, infection or skin disease located at the place of injection and invasive procedures done to the knee joint within previous 2 mth inclusive intra‐articular injections of steroids, any other condition that might interfere with the efficacy assessment or completion of the trial |
| Interventions | 4 weekly injections of : Hyaluronan (2 ml sodium hyaluronate), Placebo (2 ml isotonic saline), Excessive saline (20 ml isotonic saline) |
| Outcomes | Pain measured on a VAS on movement; at rest and during the night; KOOS scores; daily consumption of analgesics; cartilage and bone degradation markers; quadriceps circumference (cm); abililty to bend (degrees flexion); and stretch (degrees extension); global assessment patient; global assessment investigator |
| Starting date | This study is no longer recruiting patients. |
| Contact information | Charlotte Lundsgaard, MD, Principal Investigator, Copenhagen Trial Unit (CTU), H:S Rigshospitalet. dept. 7102, Copenhagen, Copenhagen 0, 2100, Denmark |
| Notes | 251 consecutive patients were randomised. Results were evaluated at weeks 1,2,3,4,8,12,16 and 26. Biochemical markers for bone and cartilage degradation were measured in urine/blood. |
Russell 2001.
| Trial name or title | A comparison of Hylan G‐F 20 and arthroscopic lavage in the management of osteoarthritis of the knee |
| Methods | |
| Participants | 50 patients with knee OA |
| Interventions | Hylan G‐F 20 Arthroscopic lavage |
| Outcomes | WOMAC |
| Starting date | |
| Contact information | 4 Rural Way, Ty Coch, Swansea SA2 9NA Wales |
| Notes | Synvisc group showed greater and more consistent improvement in WOMAC scores at all assessments post treatment. At 6 months (p<0.05) and 1 yr (p=0.0018) |
Contributions of authors
NB filed the protocol for the review with The Cochrane Collaboration. JC coordinated the review under NB's supervision. JC searched the literature and extracted data. NB and JC performed the methodological review. JC entered and analysed the data. VR checked data extraction. GAW provided statistical and methodological support. TG provided statistical support. NB is the guarantor for the review.
For the update, JC completed data extraction and NB verified data extraction. NB and JC performed the methodological review. VR provided methodological support. GAW provided statistical and methodological support. TG provided statistical support. NB is the guarantor for the review.
Sources of support
Internal sources
Centre of National Research on Disability and Rehabilitation Medicine (CONROD), Australia.
External sources
No sources of support supplied
Declarations of interest
The original review was externally supported by Genzyme Biosurgery [formerly Biomatrix, Inc] and Wyeth‐Ayerst as an unrestricted educational grant. Finances supported research staff to research this treatment area for all products, not just that manufactured by Genzyme BioSurgery [formerly Biomatrix, Inc]. The interpretation of the results are those of the reviewers who retain the right to publish.
Dr. Nicholas Bellamy and Dr. Robert Bourne participated in the Raynauld (Raynauld 2002) trial. Dr. Bellamy was a co‐investigator on the Steering Committee of the Raynauld (Raynauld 2002) trial, and previously provided consulting services to Biomatrix and Genzyme Inc.
Dr. Bourne was a clinical investigator in the Raynauld (Raynauld 2002) trial.
Product‐based analyses were circulated to each respective manufacturer prior to finalisation of the original review to permit any factual errors to be addressed. Comments were received from some but not all manufacturers.
Edited (no change to conclusions), comment added to review
References
References to studies included in this review
Adams 1995 {published data only}
- Adams ME, Atkinson MH, Lussier AJ, Schulz JI, Siminovitch KA, Wade JP, Zummer M. The role of viscosupplementation with hylan G‐F 20 (Synvisc) in the treatment of osteoarthritis of the knee: a Canadian multicenter trial comparing hylan G‐F 20 alone, hylan G‐F 20 with non‐steroidal anti‐inflammatory drugs (NSAIDs) and NSAIDs alone. Osteoarthritis and Cartilage 1995;3:213‐6. [DOI] [PubMed] [Google Scholar]
Altman 1998 {published data only}
- Altman RD, Moskowitz R, the Hyalgan Study Group. Intraarticular sodium hyaluronate (Hyalgan) in the treatment of patients with osteoarthritis of the knee: a randomized clinical trial [published erratum appears in J Rheumatol 1999;26:1216]. The Journal of Rheumatology 1998;25(11):2203‐12. [PubMed] [Google Scholar]
Altman 2004 {unpublished data only}
- Altman RD, Akermark C, Beaulieu AD, Schnitzer T for the Durolane International Study Group. Efficacy and safety of a single intra‐articular injection of non‐animal stabilized hyaluronic acid (NASHA) in patients with osteoarthritis of the knee. Osteoarthritis and Cartilage 2004;12(8):642‐9. [DOI] [PubMed] [Google Scholar]
Ardic 2001 {published data only}
- Ardic F, Bolulu D, Topuz O, Cubukcu S. Efficacy of intra‐articular hyaluronic acid injections in knee osteoarthritis. Annals of the Rheumatic Diseases 2001;60 Suppl (1):232. [Google Scholar]
Atamaz 2004 {published data only}
- Atamaz F, Kirazli Y, Akkoc Y. A comparative study between intra‐articular hylan G‐F 20 and Na‐hyaluronate and physical therapy in the management of knee osteoarthritis. Annals of the Rheumatic Diseases 2004;EULAR, Berlin, June 9‐12. [Google Scholar]
Atamaz 2005 {unpublished data only}
- Atamaz F, Kirazli Y, Akkoca Y. A comparison of two different intra‐articular hyaluronan drugs and physical therapy in the management of knee osteoarthritis. Rheumatology International 2006;26(10):873‐8. [DOI] [PubMed] [Google Scholar]
Auerbach 2002 {published data only}
- Auerbach B, Melzer C. Cross‐linked hyaluronic acid in the treatment of osteoarthritis of th eknee ‐ results of a prospective randomized trial [Die Behandlung der Gonarthrose mit hochvernetzter Hyaluronsaure ‐ Ergebnisse einer prospektiven randomisierten Studie]. Zentralblatt fur Chirurgie 2002;127(10):895‐9. [DOI] [PubMed] [Google Scholar]
Auerbach 2002a {published data only}
- Auerbach B. [Ergebnisse einer prospektiven randomisierten Studie zur Wirksamkei hochvernetzter Hyaluronsaure bei der Behandlung der Gonarthrose]. Inaugural‐Dissertation zur Erlangung des Grades eines Doktors der Medizin des Fachbereichs Humanmedizin der Justus‐Liebig‐Universitat Giessen 2002.
Bayramoglu 2003 {published data only}
- Bayramoglu M, Karatas M, Cetin N, Akman N. Comparison of two different viscosupplements in knee osteoarthritis ‐ a pilot study. Clinical Rheumatology 2003;22:118‐2. [DOI] [PubMed] [Google Scholar]
Bragantini 1987 {published data only}
- Bragantini A, Cassini M, Bastiani G. Controlled single‐blind trial of intra‐articularly injected hyaluronic acid (Hyalgan) in osteo‐arthritis of the knee. Clinical Trials Journal 1987;24(4):333‐40. [Google Scholar]
Brandt 2001 {published data only}
- Brandt KD, Block JA, Michalski JP, Moreland LW, Caldwell JR, Lavin PT, the ORTHOVISC Study Group. Efficacy and safety of intraarticular sodium hyaluronate in knee osteoarthritis. Clinical Orthopaedics and Related Research 2001;385:130‐43. [DOI] [PubMed] [Google Scholar]
Brown 2003 {published data only}
- Brown DJ, Beinat L. Safety and efficacy of an hyaluronan of 500‐730 KDa and Hylan G‐F 20 in clinical practice. Osteoarthritis and Cartilage 2003;11 Suppl (A):118. [OARSI October 2003 Berlin] [Google Scholar]
Bunyaratavej 2001 {published data only}
- Bunyaratavej N, Chang KM, Subramanian N. Treatment of painful osteoarthritis of the knee with hyaluronic acid results of a multicenter Asian study. Journal of the Medical Association of Thailand 2001;84 Suppl (2):576‐81. [PubMed] [Google Scholar]
Caborn 2003 {published data only}
- Caborn DN. Efficacy and tolerability of hylan G‐F 20 compared to intra‐articular triamcinolone hexacetonide in patients with osteoarthritis of the knee in a randomized, evaluator‐blinded study. Annals of the Rheumatic Diseases 2003;EULAR, Lisbon, Portugal,June 18‐21. [Google Scholar]
Caborn 2004 {published data only}
- Caborn D, Rush J, Lanzer W, Parenti D, Murray C on Behalf of the Synvisc 901 Study Group. A randomized, single‐blind comparison of the efficacy and tolerability of hylan G‐F 20 and triamcinolone hexacetonide in patients with osteoarthritis of the knee. The Journal of Rheumatology 2004;31(2):333‐43. [PubMed] [Google Scholar]
Carrabba 1995 {published data only}
- Carrabba M, Paresce E, Angelini M, Re KA, Torchiana EEM, Perbellini A. The safety and efficacy of different dose schedules of hyaluronic acid in the treatment of painful osteoarthritis of the knee with joint effusion. European Journal of Rheumatology and Inflammation 1995;15(1):25‐31. [Google Scholar]
Carrabba 1995a {published data only}
- Reference same as Carrabba 1995, multiple arm trial.
Carrabba 1995b {published data only}
- Reference same as Carrabba 1995, multiple arm trial.
Carrabba 1995c {published data only}
- Reference same as Carrabba 1995, multiple arm trial.
Cohen 1994 {published data only}
- Cohen MA, Shiroky JB, Ballachey ML, Neville C, Esdaile JM. Double‐blind randomized trial of intra‐articular (I/A) hyaluronate in the treatment of osteoarthritis of the knee. Arthritis & Rheumatism 1994;37 Suppl 6:R31. [Google Scholar]
Corrado 1995 {published data only}
- Corrado EM, Peluso GF, Gigliotti S, Durante C, Palmieri D, Savoia M, Oriani GO, Tajana GF. The effects of intra‐articular administration of hyaluronic acid on osteoarthritis of the knee: a clinical study with immunological and biochemical evaluations. European Journal of Rheumatology and Inflammation 1995;15(1):47‐56. [Google Scholar]
Creamer 1994 {published data only}
- Creamer P, Sharif M, George E, Meadows K, Cushnaghan J, Shinmei M, Dieppe P. Intra‐articular hyaluronic acid in osteoarthritis of the knee: an investigation into mechanisms of action. Osteoarthritis and Cartilage 1994;2:133‐40. [DOI] [PubMed] [Google Scholar]
Cubukcu 2004 {published data only}
- Cubukcu D, Ardic F, Karabulut N, Topuz O. Hylan G‐F 20 efficacy on articular cartilage quality in patients with knee osteoarthritis: clinical and MRI assessment. Clinical Rheumatology 2005;24(4):336‐41. [DOI] [PubMed] [Google Scholar]
Day 2001 {unpublished data only}
- Day R, Brooks P, Petersen M, The Australian Multicentre Trial Group. A randomised multicentre parallel group study of the effectiveness and tolerance of intra‐articular injections of sodium hyaluronate in osteoarthritis of the knee.
Day 2004 {published data only}
- Day R, Brooks P, Conaghan PG, Petersen M for the Multicenter Trial Group. A double blind, randomized, multicenter, parallel group study of the effectiveness and tolerance of intraarticular hyaluronan in osteoarthritis of the knee. The Journal of Rheumatology 2004;31(4):775‐82. [PubMed] [Google Scholar]
Dickson 2001 {published and unpublished data}
- Dickson DJ, Hosie G, English JR, and the Primary Care Rheumatology Society. A double‐blind, placebo‐controlled comparison of hylan G‐F 20 against diclofenac in knee osteoarthritis. Journal of Clinical Research 2001;4:41‐52. [Google Scholar]
Dougados 1993 {published and unpublished data}
- Dougados M, Nguyen M, Listrat V, Amor B. High molecular weight sodium hyaluronate (hyalectin) in osteoarthritis of the knee: a 1 year placebo‐controlled trial. Osteoarthritis and Cartilage 1993;1:97‐103. [DOI] [PubMed] [Google Scholar]
Formiguera Sala 1995 {published data only}
- Sala S, Miguel RE. Intra‐articular hyaluronic acid in the treatment of osteoarthritis of the knee: a short term study. European Journal of Rheumatology and Inflammation 1995;15(1):33‐8. [Google Scholar]
Forster 2003 {published and unpublished data}
- Forster MC, Straw R. A prospective randomised trial comparing intra‐articular Hyalgan injection and arthroscopic washout for knee osteoarthritis. The Knee 2003;10:291‐3. [DOI] [PubMed] [Google Scholar]
Forster 2003a {published and unpublished data}
- Forster MC, Straw R, Rowles JM. A prospective randomised trial comparing intra‐articular sodium hyaluronate injection and arthro‐scopic washout for knee osteoarthritis. The Journal of Bone and Joint Surgery 2003;85‐B Suppl (II):103. [Google Scholar]
Frizziero 2002 {published data only}
- Frizziero L, Pasquali Rochetti I. Intra‐articular treatment of osteoarthritis of the knee: an arthroscopic and clinical comparison between sodium hyaluronate (500‐730 kDa) and methylprednisolone acetate. Journal of Orthopaedics and Traumatology 2002;3:89‐96. [Google Scholar]
Graf 1993 {published data only}
- Graf J, Neusel E, Schneider E, Niethard FU. Intra‐articular treatment with hyaluronic acid in osteoarthritis of the knee joint: a controlled clinical trial versus mucopolysaccharide polysulfuric acid ester. Clinical and Experimental Rheumatology 1993;11:367‐72. [PubMed] [Google Scholar]
Grecomoro 1987 {published data only}
- Grecomoro G, Martorana U, Marco C. Intra‐articular treatment with sodium hyaluronate in gonarthrosis: a controlled clinical trial versus placebo. Pharmatherapeutica 1987;5(2):137‐41. [PubMed] [Google Scholar]
Groppa 2001 {published data only}
- Groppa LG, Moshneaga M. Studying of the efficiency of the Synvisc in osteoarthrosis. Annals of the Rheumatic Diseases 2001;60 Suppl (1):230. [Google Scholar]
Guler 1996 {published data only}
- Guler M, Kuran B, Parlar D, Guler M, Saglam H, Yapici S, Guzeloglu S, Ozgul Mese F, Bonveval F. Clinical trial of intra‐articular injection of hyaluronic acid in patients with osteoarthritis of the knee. X National Rheumatology Congress, Turkey. October 29‐November 3, 1996.
Henderson 1994 {published data only}
- Henderson EB, Smith EC, Pegley F, Blake DR. Intra‐articular injections of 750 kD hyaluronan in the treatment of osteoarthritis: a randomised single centre double‐blind placebo‐controlled trial of 91 patients demonstrating lack of efficacy. Annals of the Rheumatic Diseases 1994;53:529‐34. [DOI] [PMC free article] [PubMed] [Google Scholar]
Henderson 1994a {published data only}
- See Henderson 1994.
Hizmetli 1999 {unpublished data only}
- Hizmetli S, Kocagil S, Kaptanoglu E, Elden H, Nacitarhan V. The efficacy and safety of intra‐articular hyaluronic acid in osteoarthritis of the knee: a prospective, double‐blind trial.
Huang 2005 {published and unpublished data}
- Huang M‐H, Yang R‐C, Lee C‐L, Chen T‐W, Wang M‐C. Preliminary results of integrated therapy for patients with knee osteoarthritis. Arthritis Care & Research 2005;53(6):812‐20. [DOI] [PubMed] [Google Scholar]
Huskisson 1999 {published and unpublished data}
- Huskisson EC, Donnelly S. Hyaluronic acid in the treatment of osteoarthritis of the knee. Rheumatology 1999;38:602‐7. [DOI] [PubMed] [Google Scholar]
Jones 1995 {published data only}
- Jones AC, Pattrick M, Doherty S, Doherty M. Intra‐articular hyaluronic acid compared to intra‐articular triamcinolone hexacetonide in inflammatory knee osteoarthritis. Osteoarthritis and Cartilage 1995;3:269‐73. [DOI] [PubMed] [Google Scholar]
Jubb 2001a {published data only}
- Jubb RW, Piva S, Beinat L, Dacre J, Gishen P on behalf of the UK Hyalgan Study Group. Effect of sodium hyaluronate (500‐730 KDa, HyalganR) on joint space width in osteoarthritis of the knee. The Journal of Rheumatology 2001;28 Suppl (63):8. [Google Scholar]
Jubb 2001b {published data only}
- Jubb RW, Piva S, Beinat L, Dacre J, Gishen P for the UK Hyalgan Study Group. Structure modifying study of hyaluronan (500‐730 KDa, HyalganR) on osteoarthritis of the knee. Osteoarthritis and Cartilage 2001;9 Suppl (B):16. [Google Scholar]
Jubb 2001c {published data only}
- Jubb RW, Piva S, Beinat L, Dacre J, Gishen P. Structure modifying study of hyaluronan (500‐730 KDa, HyalganR) on osteoarthritis of the knee. Arthritis & Rheumatism 2001;44 Suppl (9):155. [Google Scholar]
Jubb 2001d {published data only}
- Jubb RW, Piva S, Beinat L, Dacre J, Gishen P, on behalf of the UK Hyalgan Study Group. Structure modification in osteoarthritis with intra‐articular sodium hyaluronate of mol. 500‐730 KDA. Annals of the Rheumatic Diseases 2001;60 Suppl (I):46. [Google Scholar]
Jubb 2003 {published and unpublished data}
- Jubb RW, Piva S, Beinat L, Dacre J, Gishen P. A one‐year, randomised, placebo (saline) controlled clinical trial of 500‐730 kDa sodium hyaluronate (Hyalgan) on the radiological change in osteoarthritis of the knee. International Journal of Clinical Practice 2003;57(6):467‐74. [PubMed] [Google Scholar]
Kahan 2001 {published data only}
- Kahan A, Guemas E, Lieu PL. Patients with knee osteoarthritis treated by hylan G‐F 20 versus usual treatments: a medico‐economic, prospective, randomised large scale trial in France, efficacy and safety outcomes. Annals of the Rheumatic Diseases 2001;60 Suppl (1):232. [Google Scholar]
Kahan 2003 {published data only}
- Kahan A, Lleu P‐L, Salin L. Prospective randomised study comparing the medico‐economic benefits of hylan GF‐20 versus conventional treatment in knee osteoarthritis [Etude prospective randomisee comparant le benefice medico‐economique de Synvisc a celui des traitements usuels chez des patients souffrant de gonarthrose]. Revue du rhumatisme 2003;70:588‐94. [Google Scholar]
Kahan 2003a {published data only}
- Kahan A, Lleu P‐L, Salin L. Prospective randomized study comparing the medicoeconomic benefits of Hylan G‐F 20 vs. conventional treatment in knee osteoarthritis. Joint Bone Spine 2003;70:276‐81. [DOI] [PubMed] [Google Scholar]
Kalay 1997 {published data only}
- Kalay S. The effectiveness of intraarticular hyaluronic acid treatment in primary gonarthrosis [specialization thesis]. Ankara, Turkey: Ministry of Health, Republic of Turkey, 1997. [Google Scholar]
Karatay 2004 {published data only}
- Karatay S, Kiziltunc A, Yildirim K, Karanfil RC, Senel K. Effects of different hyaluronic acid products on synovial fluid levels of intercellular adhesion molecule‐1 and vascular cell adhesion molecule‐1 in knee osteoarthritis. Annals of Clinical & Laboratory Science 2004;34(3):330‐5. [PubMed] [Google Scholar]
Karatay 2005 {published data only}
- Karatay S, Kiziltunc A, Yildirim K, Karanfil RC, Senel K. Effects of different hyaluronic acid products on synovial fluid NO levels in knee osteoarthritis. Osteoporosis International 2005;16(3):S71. [DOI] [PubMed] [Google Scholar]
Karatay 2005a {published data only}
- Karatay S, Yildirim K, Yildiz L, Karanfil RC, Senel K. The effect of hyaluronic acid on levels of IFG‐1 and IGFBP‐3 in synovial fluids of patients with knee osteoarthritis. Osteoporosis International 2005;16(3):S72. [Google Scholar]
Karatosun 2005 {published and unpublished data}
- Karatosun V, Unver B, Gocen Z, Sen A, Gunal I. Intra‐articular hyaluronic acid compared with progressive knee exercises in osteoarthritis of the knee: a prospective randomized trial with long‐term follow‐up. Clinical & Experimental Rheumatology 2005. [DOI] [PubMed] [Google Scholar]
Karatosun 2005a {published data only}
- Karatosun V, Unver B, Gocen Z, Sen A. Comparison of two hyaluronan drugs in patients with advanced osteoarthritis of the knee. A prospective, randomized, double‐blind study with long term follow‐up. Clinical and Experimental Rheumatology 2005;23(2):213‐8. [PubMed] [Google Scholar]
Karlsson 1999 {published data only}
- Karlsson J, Selin‐Sjogren L. A comparison of two hyaluronan drugs and placebo in patients with mild to moderate osteoarthritis of the knee ‐ a controlled, randomised, parallel‐design multicenter study. Acta orthopaedica Scandinavica 1999;70 Suppl (287):62. [Google Scholar]
Karlsson 2002 {published data only}
- Karlsson J, Sjogren LS, Lohmander LS. Comparison of two hyaluronan drugs and placebo in patients with knee osteoarthritis. A controlled, randomized, double‐blind, parallel‐design multicentre study. Rheumatology 2002;41(11):1240‐8. [DOI] [PubMed] [Google Scholar]
Karlsson 2002a (AvP) {published data only}
- See Karlsson 2002.
Karlsson 2002b (SvP) {published data only}
- See Karlsson 2002.
Karlsson 2002c (AvS) {published data only}
- See Karlsson 2002.
Karlsson 2003d {published data only}
- Karlsson J, Sjogren LS, Lohmander S. Comparison of two hyaluronan drugs and placebo in patients with knee osteoarthritis. A controlled, randomized, double‐blind, parallel‐design multicentre study. Rheumatology 2003;42(10):1262‐3. [DOI] [PubMed] [Google Scholar]
Karras 2001 {published data only}
- Karras D, Basilakos J, Diaourta V, Kedikoglou S, Iliopoulos A. Comparative study of 2 regimens of intraarticular infusion of hyaluronan (Hyalart, Fidia, SPA) in knee osteoarthritis. The Journal of Rheumatology 2001;28 Suppl (63):6. [Google Scholar]
Kawabata 1993 {published data only}
- Kawabata M, Igarashi M, Mikami R, Ninomiya S, Oda H, Hoshino Y, Yamamoto S, Kurokawa T, Ogawa N. Clinical evaluation of SLM‐10 (sodium hyaluronate injection) in patients with osteoarthritis of the knee ‐ a mutli‐center comparative trial with Artz as control drug. Japanese Pharmacology & Therapeutics 1993;21(1):257‐83. [Google Scholar]
Kirchner 2005 {published data only}
Kirchner 2005 {published data only}
- Kirchner M, Marshall D. A double‐blind randomized controlled trial comparing alternate forms of high molecular weight hyaluronan for the treatment of osteoarthritis of the knee. Osteoarthritis and Cartilage 2006;14(2):154‐62. [DOI] [PubMed] [Google Scholar]
Kirchner 2006 {published and unpublished data}
- Kirchner M, Marshall D. A double‐blind randomized controlled trial comparing alternate forms of high molecular weight hyaluronan for the treatment of osteoarthritis of the knee. Osteoarthritis and Cartilage 2006;14(2):154‐62. [DOI] [PubMed] [Google Scholar]
Kotevoglu 2002 {published data only}
- Kotevoglu N, Iyibozkurt P, Hiz O, Kuran B. Viscosupplementation treatment for osteoarthritis of the knee. Annals of the Rheumatic Diseases 2002;61 Suppl. [Google Scholar]
Kotevoglu 2005 {published data only}
- Kotevoglu N, Iybozkurt PC, Hz O, Toktas H, Kuran B. A prospective randomised controlled clinical trial comparing the efficacy of different molecular weight hyaluronan solutions in the treatment of knee osteoarthritis. Rheumatology International 2005;4. [DOI] [PubMed] [Google Scholar]
Lanzer 2002 {published data only}
- Lanzer WL, Schuster R. A randomized, single‐blind comparison of the efficacy and safety of Synvisc Hylan G‐F 20 and Aristospan Triamcinolone Hexacetonide in patients with osteoarthritis (OA) of the knee. American Academy of Orthopaedic Surgeons Annual Meeting. Dallas, Texas: AAOS, February 13‐17, 2002:Paper No. 135.
Leardini 1987 {published data only}
- Leardini G, Franceschini M, Mattara L, Bruno R, Perbellini A. Intra‐articular sodium hyaluronate (Hyalgan) in gonarthrosis. A controlled study comparing methylprednisolone acetate. Clinical Trials Journal 1987;24(4):341‐50. [Google Scholar]
Leardini 1991 {published data only}
- Leardini G, Mattara L, Franceschini M, Perbellini A. Intra‐articular treatment of knee osteoarthritis. A comparative study between hyaluronic acid and 6‐methyl prednisolone acetate. Clinical and Experimental Rheumatology 1991;9:375‐81. [PubMed] [Google Scholar]
Leopold 2003 {published data only}
- Leopold SS, Redd BB, Warme WJ, Wehrle PA, Pettis PD, Shott S. Corticosteroid compared with hyaluronic acid injections for the treatment of osteoarthritis of the knee. A prospective, randomized trial. The Journal of Bone and Joint Surgery 2003;85‐A(7):1197‐203. [DOI] [PubMed] [Google Scholar]
Lin 2004 {unpublished data only}
- Lin C‐C, Tsai C‐L, Lee C‐H, Chang C‐C, Chen S‐C, Lai C‐H, Beinat L. Efficacy and safety of intra‐articular injections of sodium hyaluronate (Hyalgan) in the treatment of osteoarthritis of the knee. A randomized, controlled trial. The Journal of Bone and Joint Surgery in Preparation.
Listrat 1997 {published data only}
- Listrat V, Ayral X, Patarnello F, Bonvarlet JP, Simonnet J, Amor B, Dougados M. Arthroscopic evaluation of potential structure modifying activity of hyaluronan (Hyalgan) in osteoarthritis of the knee. Osteoarthritis and Cartilage 1997;5:153‐60. [DOI] [PubMed] [Google Scholar]
Lohmander 1996 {published data only}
- Lohmander LS, Dalen N, Englund G, Hamalainen M, Jensen EM, Karlsson K, et al. Intra‐articular hyaluronan injections in the treatment of osteoarthritis of the knee: a randomised, double blind, placebo controlled multicentre trial. Annals of the Rheumatic Diseases 1996;55:424‐31. [DOI] [PMC free article] [PubMed] [Google Scholar]
McDonald 2000 {published and unpublished data}
- McDonald C, Hantel S, Strohmeier M. A randomised, controlled study to compare the performance and safety of two sources of sodium hyaluronate given as a viscosupplement by intra‐articular injection to patients with osteoarthritis of the knee. Journal of Clinical Research 2000;3:41‐50. [Google Scholar]
Miltner 2002 {published data only}
- Miltner O, Schneider U, Siebert CH, Niedhart C, Niethard FU. Efficacy of intrarticular hyaluronic acid in patients with osteoarthritis ‐ a prospective clinical trial. Osteoarthritis and Cartilage 2002;10(9):680‐6. [DOI] [PubMed] [Google Scholar]
Moreland 1993 {published and unpublished data}
- Moreland LW, Arnold WJ, Saway A, Savory C, Sikes D. Efficacy and safety of intra‐articular hylan G‐F 20 (Synvisc), a viscoelastic derivative of hyaluronan, in patients with osteoarthritis of the knee. Arthritis & Rheumatism 1993;36 Suppl (9):165. [Google Scholar]
Nahler 1996 {published data only}
- Nahler von G, Metelmann H, Sperber H. Treatment of gonarthrosis with Zeel comp. ‐ Results of a randomised, controlled, comparative clinical trial with hyaluronic acid [Behandlung der Gonarthrose mit Zeel comp. ‐ Ergebnisse einer randomisierten, kontrollierten klinischen Prufung im Vergleich zu Hyaluronsaure]. Orthopadische Praxis 1996;32(5):354‐9. [Google Scholar]
Nahler 1998 {published data only}
- Nahler G, Metelmann H, Sperber H. Treating osteoarthritis of the knee with a homeopathic preparation. Results of a randomized, controlled, clinical trial in comparison to hyaluronic acid. Biomedical Therapy 1998;XVI(2):186‐91. [Google Scholar]
Neustadt 2004 {published data only}
- Neustadt D, Wade J, Gimbel J, Bell M, Caldwell J. Clinical effects of intra‐articular high molecular weight hyaluronan (Orthovisc) in osteoarthritis of the knee. Arthritis & Rheumatism 2004;50 Suppl (9):144. [Google Scholar]
Neustadt 2005 {published data only}
- Neustadt DH, Caldwell JR, Burnette MC, Block JA, Bhirangi K, Lavin PT, Broderick JN. Intra‐articular high molecular weight hyaluronan (Orthovisc) is effective in the treatment of pain of knee osteoarthritis. Annals of the Rheumatic Diseases 2005;64(Suppl III):EULAR, June 8‐11, Vienna, Austria. [Google Scholar]
Neustadt 2005a ‐3inj {published and unpublished data}
- Neustadt D, Caldwell J, Bell M, Wade J, Gimbel J. Clinical effects of intraarticular injection of high molecular weight hyaluronan (Orthovisc) in osteoarthritis of the knee: a randomized, controlled multicenter trial. The Journal of Rheumatology 2005;32(10):1928‐36. [PubMed] [Google Scholar]
Neustadt 2005b‐4inj {published and unpublished data}
Ozturk 2005 {published data only}
- Ozturk C, Atamaz F, Hepguler S, Argin M, Arkun R. The safety and efficacy of intraarticular hyaluronan with/without corticosteroid in knee osteoarthritis: 1‐year, single‐blind, randomized study. Rheumatology International 2005 February 10;Epub ahead of print. [DOI] [PubMed] [Google Scholar]
Petrella 2002 {published data only}
- Petrella RJ, DiSilvestro MD, Hildebrand C. Effect of hyaluronate sodium on pain and physical functioning in osteoarthritis of the knee. A randomized, double‐blind, placebo‐controlled clinical trial. Archives of Internal Medicine 2002;162:292‐8. [DOI] [PubMed] [Google Scholar]
Pham 2003 {published data only}
- Pham T, Henanff A, Ravaud P, Dieppe P, Brin S, Paolozzi L, Dougados M. Lack of symptomatic and structural efficacy of a new hyaluronic acid (HA) compund (NRD101) when compared to diacerein and placebo in a one‐year controlled study in symptomatic knee osteoarthritis. Arthritis & Rheumatism 2003;48 Suppl (9):698. [Google Scholar]
Pham 2004 {published data only}
- Pham T, Henanff A, Ravaud Ph, Dieppe P, Paolozzi L, Dougados M. Evaluation of the symptomatic and structural efficacy of a new hyaluronic acid compound, NRD101, in comparison with diacerein and placebo in a 1 year randomised controlled study in symptomatic knee osteoarthritis. Annals of the Rheumatic Diseases 2004;63:1611‐7. [DOI] [PMC free article] [PubMed] [Google Scholar]
Pietrogrande 1991 {published data only}
- Pietrogrande V, Melanotte PL, D'Agnolo B, Ulivi M, Benigni GA, Turchetto L, Pierfederici P, Perbellini A. Hyaluronic acid versus methylprednisolone intra‐articularly injected for treatment of osteoarthritis of the knee. Current Therapeutic Research 1991;50(5):691‐701. [Google Scholar]
Puhl 1993 {published data only}
- Puhl W, Bernau A, Greiling H, Kopcke W, Pforringer W, Steck KJ, Zacher J, Scharf HP. Intra‐articular sodium hyaluronate in osteoarthritis of the knee: a multicenter, double‐blind study. Osteoarthritis and Cartilage 1993;1:233‐41. [DOI] [PubMed] [Google Scholar]
Raynauld 2002 {published and unpublished data}
- Raynauld JP, Torrance GW, Band PA, Goldsmith CH, Tugwell P, Walker V, Schultz M, Bellamy N. A prospective, randomized, pragmatic, health outcomes trial evaluating the incorporation of hylan G‐F 20 into the treatment paradigm for patients with knee osteoarthritis (Part 1 of 2): clinical results. Osteoarthritis and Cartilage 2002;10(7):506‐17. [DOI] [PubMed] [Google Scholar]
Redd 2003 {published data only}
- Redd BB, Leopold SS, Warme WJ, Pettis PD, Wehrle PA, Shott S. Corticosteroid vs. Synvisc injections for knee arthritis: a randomized, controlled trial demonstrating similar overall efficacy but significant gender‐related treatment differences. American Academy of Orthopaedic Surgeons. New Orleans: AAOS, Feb.5‐9, 2003.
Rejaili 2005 {published data only}
- Rejaili WA, Chueire AG, Cordeiro JA, Petean FC, Carvalho Filho G. The evaluation of hilan GF‐20 in the postoperative knee arthroscopies for arthrosis. Acta Ortop Bras 2005;13(1):20‐3. [Google Scholar]
Roman 2000 {published data only}
- Roman JA, Chismol J, Morales M, Donderis JL. Intra‐articular treatment with hyaluronic acid. Comparative study of hyalgan and adant. Clinical Rheumatology 2000;19:204‐6. [DOI] [PubMed] [Google Scholar]
Scale 1994a (2 inj) {published and unpublished data}
- Scale D, Wobig M, Wolpert W. Viscosupplementation of osteoarthritic knees with hylan: a treatment schedule study. Current Therapeutic Research 1994;55(3):220‐32. [Google Scholar]
Scale 1994b (3 inj) {published and unpublished data}
- Scale D, Wobig M, Wolpert W. Viscosupplementation of osteoarthritis knees with hylan: a treatment schedule study. Current Therapeutic Research 1994;55(3):220‐32. [Google Scholar]
Schneider 1997 {published data only}
- Schneider U, Miltner O, Graf J, Thomsen M, Niethard FU. The efficacy of hyaluronic acid in patients with osteoarthritis of both knees in right/left‐comparison ‐ examination with dynamometry, synovial oxygen partial pressure, intraarticular temperature and Lequesne score [Wirkungsweise von Hyaluronsaure bei Gonarthrose beider Kniegelenke im Rechts/Links‐Vergleich. Untersuchung mit Dynamometrie, Sauerstoffpartialdruck, Temperatur und Lequesne score]. Zeitschrift Orthop 1997;135:341‐7. [DOI] [PubMed] [Google Scholar]
Sezgin 2005 {published data only}
- Sezgin M, Demirel AC, Karaca C, Ortancil O, Ulkar GB, Kamk A, Cakci A. Does hyaluronan affect inflammatory cytokines in knee osteoarthritis?. Rheumatology International 2005;25(4):264‐9. [DOI] [PubMed] [Google Scholar]
Shichikawa 1983a {published data only}
- Shichikawa K. Evaluation of the effect of sodium hyaluronate (SPH) to osteoarthritis of the knee. The Ryumachi 1983;23(4):280‐90. [PubMed] [Google Scholar]
Shichikawa 1983b {published data only}
- Shichikawa K, Igarashi M, Sugawara S, Iwasaki Y. Clinical evaluation of high molecular weight sodium hyaluronate (SPH) on osteoarthritis of the knee ‐ a mutli‐center well controlled comparative study. Japanese Journal of Clinical Pharmacology and Therapeutics 1983;14(3):545‐58. [Google Scholar]
St. J. Dixon 1988 {published and unpublished data}
- St. J. Dixon A, Jacoby RK, Berry H, Hamilton EBD. Clinical trial of intra‐articular injection of sodium hyaluronate in patients with osteoarthritis of the knee. Current Medical Research and Opinion 1988;11(4):205‐13. [DOI] [PubMed] [Google Scholar]
Tamir 2001 {published data only}
- Tamir E, Robinson D, Koren R, Agar G, Halperin N. Intra‐articular hyaluronan injections for the treatment of osteoarthritis of the knee: a randomized, double blind, placebo controlled study. Clinical and Experimental Rheumatology 2001;19:265‐70. [PubMed] [Google Scholar]
Tascioglu 2003 {published data only}
- Tascioglu F, Oner C. Efficacy of intra‐articular sodium hyaluroante in the treatment of knee osteoarthritis. Clinical Rheumatology 2003;22:112‐7. [DOI] [PubMed] [Google Scholar]
Tekeoglu 1998 {published data only}
- Tekeoglu I, Adak B, Goksoy T, Tosun N. Effects of intra‐articular injections of sodium hyaluronate (Orthovisc) and betamethasone on osteoarthritis of the knee. The Journal of Rheumatology & Medical Rehabilitation 1998;9(4):220‐4. [Google Scholar]
Thompson 2002 {published data only}
- Thompson JI, Huang YW, Zaibel R. Safety and efficacy of fermentation‐derived high molecular weight sodium hyaluronate ‐ a clinical trial in patients with osteoarthritis of the knee. Osteoarthritis and Cartilage 2002;10 Suppl (A):70‐1. [Google Scholar]
Tsai 2003 {published and unpublished data}
- Tsai C‐L, Chang C‐C, Chen S‐C, Beinat L, Piva S. Treatment of knee osteoarthritis in Asian population with an intra‐articular hyaluronan of MW 500‐730 KDa. Osteoarthritis and Cartilage 2003;11 Suppl (A):119. [OARSI October 2003 Berlin] [Google Scholar]
Tsukamoto 1995 {published data only}
- Tsukamoto Y, Yamamoto M, Motegi M, Iwata H, Ryu J, Takagishi K, Sugawara S. A double‐blind trial of intra‐articular higher molecular weight hyaluronic acid (NRD 101) versus lower molecular weight hyaluronic acid (Artz) in knee osteoarthritis. Rheumatology in Europe 1995;24(EULAR, Amsterdam):333. [Google Scholar]
Wobig 1998 {published data only}
- Wobig M, Dickhut A, Maier R, Vetter G. Viscosupplementation with hyaln G‐F 20: a 26‐week controlled trial of efficacy and safety in the osteoarthritic knee. Clinical Therapeutics 1998;20(3):410‐23. [DOI] [PubMed] [Google Scholar]
Wobig 1999 {published data only}
- Wobig M, Bach G, Beks P, Dickhut A, Runzheimer J, Schwieger G, Vetter G, Balazs E. The role of elastoviscosity in the efficacy of viscosupplementation for osteoarthritis of the knee: a comparison of hylan G‐F 20 and a lower‐molecular‐weight hyaluronan. Clinical Therapeutics 1999;21(9):1549‐62. [DOI] [PubMed] [Google Scholar]
Wobig 1999a (Healon) {published and unpublished data}
- See Wobig 1999.
Wobig 1999b (Artz) {published and unpublished data}
- See Wobig 1999.
Wobig 1999c (NEhyl) {published data only}
- See Wobig 1999.
Wu 1997 {published data only}
- Wu JJ, Shih LY, Hsu HC, Chen TH. The double‐blind test of sodium hyaluronate (Artz) on osteoarthritis knee. Chinese Medical Journal (Taipei) 1997;59:99‐106. [PubMed] [Google Scholar]
Wu 2004 {published data only}
- Wu H‐B, Du J‐Y, Yang S‐H, Shao Z‐W, Xiong X‐Q. Evaluation on the effects of hyaluronan combined with different dosages of celecoxib for relieving pain and ankylosis induced by knee osteoarthritis. Chinese Journal of Clinical Rehabilitation [Zhongguo lin Chuang Kang fu] 2004;8(26):5491‐3. [Google Scholar]
Yamamoto 1994 {published data only}
- Yamamoto M, Sugawara Y, Tsukamoto Y, Motegi M, Iwata H, Rye J, Takagishi K, Nakashima M. Clinical evaluation of high molecular weight sodium hyaluronate (NRD 101) on osteoarthritis of the knee. A phase III comparative clinical study with Artz as a control drug. Japanese Pharmacology & Therapeutics 1994;22(9):4059‐87. [Google Scholar]
Yentur 2003 {published data only}
- Yentur EA, Okcu G, Yegul I. The role of trigger point therapy in knee osteoarthritis. The Pain Clinic 2003;15(4):385‐90. [Google Scholar]
References to studies excluded from this review
Aglas 1997 {published data only}
- Aglas F, Hermann J, Uitz E, Rainer F. Long‐term benefits of a single treatment cycle with hyaluronan (Hyalgan) in patients with osteoarthritis of the knee. Rheumatology in Europe 1997;26 Suppl (2):46. [Google Scholar]
Akermark 2002 {published data only}
- Akermark C, Berg P, Bjorkman A, Malm P. Non‐animal stabilised hyaluronic acid in the treatment of osteoarthritis of the knee. A tolerability study. Clinical Drug Investigation 2002;22(3):157‐66. [Google Scholar]
Akermark 2004 {published data only}
- Akermark C, Adalberth T, Ericsater J, Isacsson J. [Patient‐perceived efficacy of non‐animal stabilized hyaluronic acid in the treatment of osteoarthritis of the knee]. Osteoarthritis and Cartilage 2004;12 Suppl (2):147. [DOI] [PubMed] [Google Scholar]
Alonge 2004 {published data only}
- Alonge TO, Akinpelu A, Ogunlade SO, Akinosun OM. [Intra‐articular Synject in the management of knee OA in Nigeria ‐ an intial report]. Osteoarthritis and Cartilage 2004;12 Suppl (2):148. [Google Scholar]
Angel 2001 {published data only}
- Angel K, Campbell D, Dobson P, Lewis P, Nisyrios G, Tandon S. [Does viscosupplementation work? A preliminary study]. The Journal of Bone and Joint Surgery 2001;83‐B(Suppl III):324. [Google Scholar]
Arizono 1997 {published data only}
- Arizono T, Hara T, Hara Y. Effect of high‐molecular‐weight sodium hyaluronate on osteoarthrosis. Orthop Surg Traumatol 1997;46 Suppl (1):207‐10. [Google Scholar]
Ates 2001 {published data only}
- Ates A, Kinikli G, Turgay M, Duman M. Viscosupplementation with sodium hyaluronate for the treatment of osteoarthritis. The Journal of Rheumatology 2001;28 Suppl (63):8. [Google Scholar]
Bagga 2003 {published data only}
- Bagga H, Burkhardt D, Morris D, Ghosh P, Sambrook P, March L. [Long term effects of intra‐articular hylan G‐F 20 (Synvisc) on synovial fluid hyaluronan and sulfated glycosaminoglycans levels]. Annals of the Rheumatic DIseases 2003;EULAR, Lisbon, Portugal, June 18‐21. [Google Scholar]
Bardin 2004 {published data only}
- Bardin T, Kieffer P, Hassaynia K, Vincent P, Vincent Aubrey F. [A large study phase IV of intraarticular arthrum H in knee OA patients]. Osteoarthritis and Cartilage 2004;12 Suppl (2):145. [Google Scholar]
Barrett 2002 {published data only}
- Barrett JP, Siviero P. [Retrospective study of outcomes in Hyalgan‐treated patients with osteoarthritis of the knee]. Clinical Drug Investigation 2002;23:87‐97. [DOI] [PubMed] [Google Scholar]
Bell 1999 {published data only}
- Bell M, Fallaha M, Lenczner E, Ranger P, Welsh P. Viscosupplementation with hylan G‐F 20 in total knee replacement candidates: an effective pain management therapy that may delay surgery. Osteoarthritis and Cartilage 1999;7 Suppl (A):30. [Google Scholar]
Bellamy 2000 {published data only}
- Bellamy N, Goldstein LD, Tekanoff RA. Continuing medical education‐driven skills acquisition and impact on improved patient outcomes in family practice setting. The Journal of Continuing Education in the Health Professions 2000;20:52‐61. [DOI] [PubMed] [Google Scholar]
Birbara 2004 {published data only}
- Birbara CA, Bell M, Caldwell JR. [Effectiveness and safety of retreatment with high molecular weight hyaluronan (HMWH; Orthovisc): results from an extension of a randomized controlled trial]. Osteoarthritis and Cartilage 2004;12 Suppl (2):127. [Google Scholar]
Bolgen Cimen {published data only}
- Bolgen CImen O, Gulaldi NCM, Ozisik S, Bagis S, Kanik A, Erdogan C. [Clinical and scintigraphic evaluation in intra‐articular hyaluronate therapy]. Annals of the Rheumatic Diseases 2003;EULAR, Lisbon, Portugal, June 18‐2. [Google Scholar]
Bruce 2004 {published data only}
- Bruce B, Singh G, Sato R, Waddell DD. [Hylan G‐F 20 significantly improves pain, function and patient global after 6 months in knee OA]. American Academy of Orthopaedic Surgeons (AAOS) On‐Line Service 2004;Annual Meeting Podium Presentations(71st Annual Meeting, March 10‐14, San Francisco). [Google Scholar]
Carrabba 1992 {published data only}
- Carrabba M, Paresce E, Angelini M, Zamboni AM, Bragantini A, Paissan A, Molinaroli F, Perbellini A. The intra‐articular treatment of osteoarthritis of the knee. A comparative study between hyaluronic acid (Hyalgan) and Orgotein. European Journal of Rheumatology and Inflammation 1992;12:47‐57. [Google Scholar]
Chhabra 2000 {published data only}
- Chhabra SR, Newlove R, Montgomery S. Intraarticular hylan injections in the treatment of osteoarthritis of the knee: a prospective study of 120 patients. The Journal of Bone and Joint Surgery 2000;82‐B Suppl (I):68. [Google Scholar]
Clarke 2001 {published data only}
- Clarke S, Lock V, Duddy J, Newman J, Kirwan JR. Intra‐articular hylan GF20 (Synvisc) in the management of patellofemoral osteoarthritis of the knee (POAK). Annals of the Rheumatic Diseases 2001;60:230‐1. [DOI] [PubMed] [Google Scholar]
Clarke 2005 {published data only}
- Clarke S, Lock V, Duddy J, Sharif M, Newman JH, Kirwan JR. [Intra‐articular hylan G‐F 20 (Synvisc) in the management of patellofemoral osteoarthritis of the knee (POAK)]. The Knee 2005;12:57‐62. [DOI] [PubMed] [Google Scholar]
Conrozier 2003 {published data only}
- Conrozier T, Mathieu P, Schott A‐M, Laurent I, Hajri T, Crozes P, et al Meignan F, Noel E, Rozand Y, Savoye J‐F, Vignon E. Is there predictive factors of long term efficacy of viscosupplementation with hylan GF‐20 in knee osteoarthritis? [Existe‐t‐il des facteurs predictifs de l'efficacite a long terme de la viscosupplementation par hylane GF‐20 dans la gonarthrose?]. Revue du rhumatisme 2003;70:253‐8. [Google Scholar]
Couceiro 2003 {published data only}
- Couceiro JM, Coton F, Fernandez A, Collado A, Usabiaga J, Coronel P, Llorens MA and the Adant Study Group. Multicenter clinical trial on the efficacy of intra‐articular hyaluronic acid (Adant) in osteoarthritis of the knee [Estudio multicentrico de la eficacia del tratamiento intraarticular con acido hialuronico (Adant) en artrosis de rodilla]. Revista Espanola de Reumatologia 2003;320(2):57‐65. [Google Scholar]
D'Agnolo 1988 {published data only}
- D'Agnolo B, Perbellini A. Intra‐articular hyaluronic acid treatment in gonarthritis. Results of an open trial on 30 patients. Reumatismo 1988;40:57‐64. [Google Scholar]
Dahlberg 1994 {published data only}
- Dahlberg L, Lohmander LS, Ryd L. Intraarticular injections of hyaluronan in patients with cartilage abnormalities and knee pain. A one‐year double‐blind, placebo‐controlled study. Arthritis & Rheumatism 1994;37(4):521‐8. [DOI] [PubMed] [Google Scholar]
Evanich 2001 {published data only}
- Evanich JD, Evanich CJ, Wright MB, Rydlewicz JA. [Effficacy of intraarticular hyaluronic acid injections in knee osteoarthritis]. Clinical Orthopaedics and Related Research 2001, (390):173‐81. [DOI] [PubMed] [Google Scholar]
Faraawi 2003 {published data only}
- Faraawi R. [Retrospective study in intra‐articular injection with hylan G‐F 20 (patient perspective)]. The Journal of Rheumatology 2003;30(8):1880. [Google Scholar]
Faus 2002 {published data only}
- Faus S, Fiter J, Canellas. Ultrasound measuring of the thickness of articular cartilage in patients with severe knee osteoarthritis treated with hyaluronic acid. Annals of the Rheumatic Diseases 2002;61 Suppl. [Google Scholar]
Frizziero 1993 {published data only}
- Frizziero L, Focherini MC, Govoni E. Hyaluronic acid versus methylprednisolone intra‐articular treatment in knee osteoarthritis: a comparative, integrated in vivo and ex vivo morphological assessment by arthroscopy and histopathology. Revista Espanola de Rheumatologia 1993;20 Suppl (1):575. [Google Scholar]
Frizziero 1997 {published data only}
- Frizziero L, Pasquali Ronchetti I, Guerra D, Guidolin D. Intra‐articular treatment with hyalonic acid: a clinical endoscopic and histological study in osteoarthritis of the knee. Rheumatology in Europe 1997;26 Suppl (2):47. [Google Scholar]
Frizziero 1998 {published data only}
- Frizziero L, Govoni E, Bacchini P. Intra‐articular hyaluronic acid in the treatment of osteoarthritis of the knee: clinical and morphological study. Clinical and Experimental Rheumatology 1998;16:441‐9. [PubMed] [Google Scholar]
Fuji 1994 {published data only}
- Fuji T, Matsui S, Fujita S, Hirota S. Clinical effect of intra‐articular injection of sodium hyaluronate (Artz) on osteoarthritis of the knee. A study comparing between independently using and combined using local anesthetic. Japanese Journal of Medicine and Pharmaceutical Sciences 1994;32(3):507‐13. [Google Scholar]
Goorman 2000 {published data only}
- Goorman SD, Watanabe TK, Miller EH, Perry C. Functional outcome in knee osteoarthritis after treatment with hylan G‐F 20: a prospective study. Archives of Physical Medicine and Rehabilitation 2000;81:479‐83. [DOI] [PubMed] [Google Scholar]
Grecomoro 1992 {published data only}
- Grecomoro G, Piccione F, Letizia G. Therapeutic synergism between hyaluronic acid and dexamethasone in the intra‐articular treatment of osteoarthritis of the knee: a preliminary open study. Current Medical Research and Opinion 1992;13(1):49‐55. [DOI] [PubMed] [Google Scholar]
Guerrero 1999 {published data only}
- Guerrero R, Sanchez‐Pernaute O, Acebes C, Llorens MA, Mas S, Palacios I, et al. Modification of synovial cartilage markers after repetitive intraarticular administration of hyaluronate (Adant) in knee OA patients. Arthritis & Rheumatism 1999;42 Suppl (9):253. [Google Scholar]
Guerrero 1999a {published data only}
- Guerrero R, Herreo‐Beaumont G, Acebes C, Sanchez‐Pernaute O, Llorens MA, Blazquez AB, Palacios I, Egido J, Vivanco F. Cartilage turnover and symptomatic relief observed in patients with knee OA after intra‐articular administration of a hyaluronate polymer (Adant). Osteoarthritis and Cartilage 1999;7 Suppl (A):32. [Google Scholar]
Hamburger 2004 {published data only}
- Hamburger MI, Hamburger MK, Brandt L, Kaell AT, Bennett RS, Johnson S, Rumore P, Schulman P. [Retrospective comparative analysis of the safety and efficacy of intra‐articular hyaluronan therapies in clinical practice]. Osteoarthritis and Cartilage 2004;12 Suppl (2):146. [Google Scholar]
Hashimoto 1992 {published data only}
- Hashimoto Y, et al. Multicenter clinical studies of ARTZ (high molecular weight sodium hyaluronate) in the long term treatment of osteoarthritis of the knee: including x‐ray analysis. Japanese Pharmacology & Therapeutics 1992;20(7):2699‐712. [Google Scholar]
Honma 1989 {published data only}
- Honma T, Sakurai M, Maeda I, et al. Clinical effects of high molecular weight sodium hyaluronate (Artz) injected into osteoarthritis knee joint. Japanese Pharmacology & Therapeutics 1989;17(10):5057‐72. [Google Scholar]
Igarashi 1983 {published data only}
- Igarashi M, Onozawa T, Murata M, et al. Multicentre clinical studies of high molecular weight sodium hyaluronate in the long‐term treatment of osteoarthritis of the knee. Japanese Pharmacology & Therapeutics 1983;11(11):4871‐88. [Google Scholar]
Ines 2002 {published data only}
- Ines LS, Reis P, Santos MJ, Alexandre M, Silva C, Brana A, Barcelos A, Nour D, Silva JAP, Malcata A, Porto A. Joint lavage and infiltration as treatment for knee arthritis: an open follow‐up evaluation in the clinical setting. Annals of the Rheumatic Diseases 2002;61 Suppl. [Google Scholar]
Iseki 1983 {published data only}
- Iseki F, Hosokawa M, Shibata H, et al. Clinical study of high molecular weight sodium hyaluronate (SPH) on osteoarthritis of the knee. Japanese Pharmacology & Therapeutics 1983;11(8):401(3283)‐15(97). [Google Scholar]
Iwasaki 1993 {published data only}
- Iwaskai K, Norimatsu T, Matsuzaka N, Teramoto T. Usefulness of sodium hyaluronate (Artz) in osteoarthritis of the knee. Comparison between monotherapy and combination therapy with a local anesthetic. Medical Consultation & New Remedies 1993;30(8):1469‐76. [Google Scholar]
Johnson 2004 {published data only}
- Johnson DM. [Audit of the effect on pain scores of intra‐articular hyalgan injection in patients with osteoarthritis of the knee in a nurse‐led clinic]. Rheumatology 2004;43(Suppl 2):ii156. [Google Scholar]
Kawakami 1993 {published data only}
- Kawakami K, et al. Clinical evaluation of intra‐articlar injection therapy of high‐molecular Na‐hyaluronate for osteoarthritis of the knee joint. Journal of Medicine and Pharmaceutical Science 1993;29(5):1309. [Google Scholar]
Kolarz 1995 {published data only}
- Kolarz G, Kotz R, Broll H, Dunky A, Landsiedl F, Mayrhofer F, Rainer F, Ramach W, Singer F, Metz M. [Hyaluronic acid in the treatment of osteoarthritis of the knee joint: interim results of a comparative clinical study]. European Journal of Rheumatology and Inflammation 1995;15(1):39‐46. [Google Scholar]
Kolarz 2003 {published data only}
- Kolarz G, Kotz R, Hochmayer I. [Long‐term benefits and repeated treatment cycles of intra‐articular sodium hyaluronate (Hyalgan) in patients with osteoarthritis of the knee]. Seminars in Arthritis and Rheumatism 2003;32(5):310‐9. [DOI] [PubMed] [Google Scholar]
Kotz 1999 {published data only}
- Kotz R, Kolarz G. Intra‐articular hyaluronic acid: duration of effect and results of repeated treatment cycles. American Journal of Orthopedics 1999;28 Suppl (11):5‐7. [PubMed] [Google Scholar]
Koyuncu 2002 {published data only}
- Koyuncu H, Dinc A, Ozkul Y, Yucel E. Clinical, functional and radiological efficacy and tolerability of hyaluronate in osteoarthritis ‐ an open study. Annals of the Rheumatic Diseases 2002;61 Suppl (EULAR). [Google Scholar]
Koyuncu 2003 {published data only}
- Koyuncu H, Uludag M, Cakmak B, Yucel E, Dinc A, Toros H. [The efficacy and safety of viscosupplementation with hylan G‐F 20 in osteoarthritic knee]. Osteoarthritis and Cartilage 2003;11 Suppl (A):45. [Google Scholar]
Kumar 2003 {published data only}
- Kumar N, Rao C, Marshall NJ, Griffiths ID. [Results of one year follow up after treatment with viscosupplementation]. Annals of the Rheumatic Diseases 2003;EULAR, Lisbon, Portugal, June 18‐21. [Google Scholar]
Kurokawa 1994 {published data only}
- Kurokawa T, et al. Clinical evaluation of high molecular weight sodium hyaluronate (NRD101) on osteoarthritis of the knee: phase III long‐term clinical study. Jpn Pharmacol Ther 1994;22(9):4007‐28. [Google Scholar]
Lee 1999 {published data only}
- Lee S‐S, Joo Y‐S, Kim W‐U, Park S‐H, Cho C‐S, Kim H‐Y, Kim H‐J, Kim S‐J. Clinical efficacy and safety of hyruan (sodium hyaluronate) in patients with osteoarthritis of the knee. J Korean Rheum Assoc 1999;6(1):53‐61. [Google Scholar]
Lee 2004 {published data only}
- Lee S, Park D, Chmell SJ. Viscosupplementation with hylan G‐F 20 (Synvisc). The Journal of Knee Surgery 2004;17(2):73‐7. [DOI] [PubMed] [Google Scholar]
Legre 2001 {published data only}
- Legre V, Pham T, Lafforgue P. Evaluation of safety and efficacy of hylan GF‐20 in knee osteoarthritis with chondrocalcinosis. Osteoarthritis and Cartilage 2001;9 Suppl (B):47. [Google Scholar]
Leopold 2002 {published data only}
- Leopold SS, Warme WJ, Pettis PD, Shott S. [Increased frequency of acute local reaction to intra‐articular hylan GF‐20 (Synvisc) in patients receiving more than one course of treatment]. The Journal of Bone and Joint Surgery 2002;83‐A(9):1619‐23. [DOI] [PubMed] [Google Scholar]
Lussier 1996 {published data only}
- Lussier A, Cividino AA, McFarlane CA, Olszynski WP, Potashner WJ, Medicis R. Viscosupplementation with hylan for the treatment of osteoarthritis: findings from clinical practice in Canada. The Journal of Rheumatology 1996;23(9):1579‐85. [PubMed] [Google Scholar]
Magobotha 2001 {published data only}
- Magobotha SK, Rogan IM. [Viscosupplementation: an alternative method of treating osteoarthritis of the knee]. The Journal of Bone and Joint Surgery 2001;83‐B Suppl (1):10‐1. [Google Scholar]
Mathieu 2001 {published data only}
- Mathieu P, Conrozier T, Schott AM, Laurent I, Marc JF, Vignon E. [Viscosupplementation with hylan GF‐20 in knee osteoarthritis: assessment of the predictive factors of long‐term efficacy]. Osteoarthritis and Cartilge 2001;9 Suppl (B):27. [Google Scholar]
Mazieres 2004 {published data only}
- Mazieres B, Bacri A, Bard H, Pen C, Riviere M. [French pharmacoeconomic study of hyaluronic acid for osteoarthritis of the knee. An interim analysis]. Annals of the Rheumatic Diseases 2004;EULAR, Berlin, June 9‐12. [Google Scholar]
Mazzocato 1987 {published data only}
- Mazzocato G, Melanotte PL, Perbellini A. [Efficacia terapeutica dello ialuronato di sodio nell‐arthrosi del ginocchio. Risultati di uno studio in aperto]. Ortopedia e traumatologia oggi 1987;VII(6):333‐8. [Google Scholar]
Megyeri 1993 {published data only}
- Megyeri A, Genti G. [Intra‐articular treatment with sodium hyaluronate in osteoarthritis of the knee: short‐term clinical study]. Revista Espanola de Reumatologia 1993;20 Suppl (1):329. [Google Scholar]
Mensitieri 1995 {published data only}
- Mensitieri M, Ambrosio L, Iannace S, Nicolais L. Viscoelastic evaluation of different knee osteoarthritis therapies. Journal of Materials Science: Materials in Medicine 1995;6:130‐7. [Google Scholar]
Milini 1989 {published data only}
- Milini C, Monini L, Brunelli G. Hyaluronic acid in the treatment of gonarthrosis. Findings of an open study [L'acido ialuronico nel trattamento della gonartrosi. Risultati di uno studio in aperto]. Farmaci 1989;13:1‐7. [Google Scholar]
Miller 1999 {published data only}
- Miller EH, Snyder MA, Heidt RS, Welch MC. Analysis of the results of viscosupplementation with hylan G‐F 20 in the treatment of osteoarthritis of the knee: a prospective study of 108 patients. 66th Annual Meeting Proceedings, American Academy of Orthopaedic Surgeons. Anaheim, CA, February 4‐8, 1999:233.
Minami 1993 {published data only}
- Minami S, Okazaki, T, Tanaka T, Isobe K, Tsuchida T, Saegusa O, Fujitsuka M, Moriya H. A study of the effect of intra‐articular injection of SLM‐10 (sodium hyaluronate) on osteoarthritis of the knee. Japanese Pharmacology & Therapeutics 1993;21 Suppl (2):565‐79. [Google Scholar]
Moller 2001 {published data only}
- Moller I, Moragues C, Marti N, Alegre JJ. [Intra‐articular hyaluronate efficacy and safety in treatment of knee OA]. Osteoarthritis and Cartilage 2001;9 Suppl (B):51. [Google Scholar]
Monfort 2000 {published data only}
- Monfort J, Benito P. [Treatment with hyaluronic acid in patients affected with gonarthrosis with and without chondrocalcinosis]. Osteoarthritis and Cartilage 2000;8 Suppl (B):70. [Google Scholar]
Myburgh 2001 {published data only}
- Myburgh JG. [Viscosupplementation with hylan G‐F 20 in the treatment of osteoarthritis]. The Journal of Bone and Joint Surgery 2001;83‐B Suppl (1):10. [Google Scholar]
Namiki 1982 {published data only}
- Namiki O, Toyoshima H, Morisaki N. Therapeutic effect of intra‐articular injection of high molecular weight hyaluronic acid on osteoarthritis of the knee. International Journal of Clinical Pharmacology, Therapy and Toxicology 1982;20(11):501‐7. [PubMed] [Google Scholar]
Neustadt 2001 {published data only}
- Neustadt DH. [Clinical experience with intra‐articular hyaluronate in osteoarthritis of the knee]. The Journal of Rheumatology 2001;28 Suppl (63):6. [Google Scholar]
Neustadt 2003 {published data only}
- Neustadt DH. [Long‐term efficacy and safety of intra‐articular sodium hyaluroante (Hyalgan) in patients with osteoarthritis of the knee]. Clinical and Experimental Rheumatology 2003;21:307‐11. [PubMed] [Google Scholar]
Novaes 2005 {published data only}
- Novaes AC, Schaiquevich P, Nasswetter G, The Latin American Group of Quality of Life in Rheumatology. [Multicenter study of hyaluronic acid obtained by biotechnology to evaluate clinical efficacy and safety in knee osteoarthritis]. International Journal of Clinical and Pharmacology Research 2005;XXV(1):1‐7. [PubMed] [Google Scholar]
Oberoi 2004 {published data only}
- Oberoi IS. [Gains of viscosupplementation following arthroscopic assisted surgery in gonarthrosis in femoro‐tibial joints]. International Cartilage Repair Society, 5th Symposium. Gent, Belgium, May 26‐29, 2004:20‐1.
Olszynski 2002 {published data only}
- Olszynski WP, Olszynski M. The effect of viscosupplementation therapy among patients suffering from degenerative joint disease of the knees. The Journal of Rheumatology 2002;29(7):1572. [Google Scholar]
Ono 1993 {published data only}
- Ono K, Nakahara H, Yonenobu K, Ochi T, Hongo I, Mizushima T, et al. [A study of the effect of intra‐articular injection of high molecular weight sodium hyaluronate (SLM‐10) on osteoarthritis of the knee joint]. Japanese Pharmacology & Therapeutics 1993;21 Suppl (2):611‐32. [Google Scholar]
Ono 1993a {published data only}
- Ono K, Hirasawa Y, Matsui N, Moriya H. [A study of the effect of intra‐articular long term injection of high molecular weight sodium hyaluronate (SLM‐10) on osteoarthritis of the knee joint]. Japanese Pharmacology & Therapeutics 1993;21 Suppl (2):687‐702. [Google Scholar]
Oron 2003 {published data only}
- Oron A, Mirovsky Y, Agar G, Halperin N. [Viscosupplementation with Orthovisc vs. Synvisc for the treatment of osteoarthritis: findings from clinical practice in Israel]. Osteoarthritis and Cartilage 2003;11 Suppl (A):46. [Google Scholar]
Oshima 1983 {published data only}
- Oshima Y, Azuma H, Namiki O, Aoki T, Azuma T, Irie N, et al. Intra‐articular injection therapy of high molecular weight sodium hyaluronate (SPH) on osteoarthritis of the knee joint ‐ phase II clinical study. Japanese Pharmacology & Therapeutics 1983;11(6):2253‐67. [Google Scholar]
Pasquali Ronchetti {published data only}
- Pasquali Ronchetti I, Guerra D, Taparelli F, Boraldi F, Bergamini G, Mori G, Zizzi F, Frizziero L. [Morphological analysis of knee synovial membrane biopsies from a randomized controlled clinial study comparing the effects of sodium hyaluronate (HyalganR) and methylprednisolone acetate (DepomedrolR) in osteoarthritis]. Rheumatology 2001;40:158‐69. [DOI] [PubMed] [Google Scholar]
Pavelka 2002 {published data only}
- Pavelka K. Intraarticular sodium hyaluronate (Hyalgan) in the treatment of patients with osteoarthritis of the knee: findings from clinical practise in Czech Republic. Annals of the Rheumatic Diseases 2002;61 Suppl. [Google Scholar]
Pavelka 2002a {published data only}
- Pavelka K. Intraarticular sodium hyaluronate (Hyalgan) in the treatment of patients with osteoarthritis of the knee: findings from clinical practise in Czech Republic. Czech Acta Chir Orthop Traumatol Cech 2002;69:302‐7. [PubMed] [Google Scholar]
Payne 2000 {published data only}
- Payne MW, Petrella RJ. [Viscosupplementation effect on proprioception in the osteoarthritic knee]. Archives of Physical Medicine and Rehabilitation 2000;81:598‐603. [DOI] [PubMed] [Google Scholar]
Petrella 2003 {published data only}
- Petrella RJ, Cogliano A. [Sodium hyaluronate (Suplasyn) viscosupplementation for treatment of knee osteoarthritis: clinical and functional outcomes and treatment satisfaction from routine clinical practice]. Annals of the Rheumatic Diseases 2003;EULAR, Lisbon, Portugal, June 18‐21. [Google Scholar]
Petrella 2003a {published and unpublished data}
- Petrella RJ, Riviere M. The utilization of hyaluronic acid for the treatment of osteoarthritis within the primary care experience (methodology of data mining of a large database >53 000). Osteoarthritis and Cartilage. 2003; Vol. 11 Suppl (A):83.
Petrella 2003b {published and unpublished data}
- Petrella RJ, Cogliano A. [Sodium hyaluronate viscosupplementation for treatment of knee osteoarthritis: clinical and functional outcomes and treatment satisfaction from routine clinical practices]. Osteoarthritis and Cartilage 2003;11 Suppl (A):101. [Google Scholar]
Petrella 2005 {published data only}
- Petrella RJ. Hyaluronic acid for the treatment of knee osteoarthritis: long‐term outcomes from a naturalistic primary care experience. American Journal of Physical Medicine & Rehabilitation 2005;84(4):278‐83. [DOI] [PubMed] [Google Scholar]
Pipino 1990 {published data only}
- Pipino F, Molfetta L, Berlingerio G. Hyaluronic acid in the treatment of gonarthrosis. Results of an open trial [L'acido ialuronico nella terapia della gonartrosi]. Minerva Ortopedica e Traumatologica 1990;41(11):655‐60. [Google Scholar]
Punzi 1988 {published data only}
- Punzi L, Schiavon F, Ramonda R, Malatesta V, Gambari P, Todesco S. Intra‐articular hyaluronic acid in the treatment of inflammatory and noninflammatory knee effusions. Current Therapeutic Research 1988;43(4):643‐47. [Google Scholar]
Rao 2001 {published data only}
- Rao C, Kumar N, Young‐Min S, Marshall NJ, Platt PN, Griffiths ID. Experiences with a viscosupplementation (Hyalgan) clinic. Annals of the Rheumatic Diseases 2001;60 Suppl (1):233. [Google Scholar]
Rastogi 2005 {published data only}
- Rastogi S, Sharma VK, Chandra R, Sivaraman ST. [Open label multicentre trial on safety and efficacy of intra‐articular hyaluronic acid in the treatment of osteoarthritis of the knee ‐ a prospective study]. Journal, Indian Academy of Clinical Medicine 2005;6(3):232‐5. [Google Scholar]
Russell 1992 {published data only}
- Russell IJ, Michalek JE, Lawrence VA, Lessard JA, Briggs BT, May GS. A randomized, placebo (PL) and no‐intervention (NI) controlled, trial of intra‐articular (IA) 1% sodium hyaluronate (HA) in the treatment of knee osteoarthritis (OA). Arthritis & Rheumatism 1992;35 Suppl:132. [Google Scholar]
Scali 1995 {published data only}
- Scali JJ. Intra‐articular hyaluronic acid in the treatment of osteoarthritis of the knee: a long term study. European Journal of Rheumatology and Inflammation 1995;15(1):57‐62. [Google Scholar]
Sepici 2002 {published data only}
- Sepici V, Sepici A, Acikgoz S, Tali T. The role of viscosupplementation with sodium hyaluronate (Orthovisc) in urine gag levels and magnetic resonance imaging (MRI) features of osteoarthritis of the knee. Annals of the Rheumatic Diseases 2002;61 Suppl. [Google Scholar]
Shibata 1993 {published data only}
- Shibata S. Using experience and significance of sodium hyaluronate (Artz) for osteoarthritis of the knee. Journal of New Remedies & Clinics 1993;42(3):598. [Google Scholar]
Sieliwonczyk 1997 {published data only}
- Sieliwonczyk P, Mazurkiewicz S, Ostojski R, Kusiak A. The value of intraarticular Hyalgan injections in treatment of osteoarthritis of the knee [Ocena wartosci dostawowych iniekcji preparatu Hyalgan w leczeniu zmian zwyrodnieniowych stawu kolanowego]. Chir Narz Ruchu Ortop Pol 1997;LXIII(4):337‐42. [PubMed] [Google Scholar]
Singh 2004 {published data only}
- Singh G, Bruce B, Sato R, Waddell DD. [Treatment satisfaction in patients treated with hylan G‐F 20 vs. intra‐articular steroids at 6 months]. American Academy of Orthopaedic Surgeons (AAOS) On‐Line Service 2004;Annual Meeting Podium Presentations(71st Annual Meeting, March 10‐14, San Francisco). [Google Scholar]
Sripada 1999 {published data only}
- Sripada P, Pritchard C, Bankes PF. Comparison efficacy of hyaluronan and hylan G‐F 20 in osteoarthritis. Arthritis & Rheumatism 1999;42 Suppl (9):296. [Google Scholar]
Stambuk 2001 {published data only}
- Stambuk B, Gnjidic Z, Brencic‐Dlesk M. [Efficacy and safety of intra‐articular injection of hylan GF‐20 (Synvisc) for the knee]. The Journal of Rheumatology 2001;28 Suppl (63):10. [Google Scholar]
Suzu 1990 {published data only}
- Suzu F, Hirasawa Y. Results of long term treatment with ARTZ for the knee osteoarthritis. Japanese Pharmacology & Therapeutics 1990;18(12):4979‐84. [Google Scholar]
Suzu 1993 {published data only}
- Suzu F, Hirasawa Y. A study of the effect of high molecular weight sodium hyaluronate (SLM‐10) on osteoarthritis of the knee joint. Japanese Pharmacology & Therapeutics 1993;21 Suppl (2):595‐610. [Google Scholar]
Takeuchi 1993 {published data only}
- Takeuchi H, Yamaguchi I, Morita S, Kawagoe S, Chosa E, Maehara T, Kuroki T, Kuwahara S. Multicenter clinical study in intraarticular injection of high molecular sodium hyaluronate (ARTZ) for osteoarthritis of the knee. Journal of Medicine and Pharmaceutical Science 1993;29(6):1517‐25. [Google Scholar]
Taneda 1993 {published data only}
- Taneda Y, Matsui N, Nakane K, Takai Y, Suzuki H, Hongoh N. A study of the effect of SLM‐10 on osteoarthritis of the knee. Japanese Pharmacology & Therapeutics 1993;21 Suppl (2):581‐93. [Google Scholar]
Tang 2004 {published data only}
- Tang SF, Chen CP, Chen MJ, Pei Y‐C, Lau Y‐C, Leong C‐P. [Changes in sagittal ground reaction forces after intra‐articular hyaluronate injections for knee osteoarthritis]. Archives Physical Medicine and Rehabilitation 2004;85(6):951‐5. [DOI] [PubMed] [Google Scholar]
Tang 2005 {published data only}
- Tang SFT, Chen CPC, Chen MJL, Hong WH, Yu TY, Tsai WC. [Improvement of muscle strength in osteoarthritic knee patients after intraarticular knee injection of hyaluronan]. American Journal of Physical Medicine & Rehabilitation 2005;84(4):274‐7. [DOI] [PubMed] [Google Scholar]
Toh 2002 {published data only}
- Toh EM, Prasad PS, Teanby D. [Correlating the efficacy of knee viscosupplementation with osteoarthritic changes on roentgenological examination]. The Knee 2002;9:321‐30. [DOI] [PubMed] [Google Scholar]
Toh 2003 {published data only}
- Toh EM, Prasad P, Teanby D. [Correlating the outcome of knee intraarticular viscosupplementation with radiological changes of osteoarthritis]. The Journal of Bone and Joint Surgery 2003;85‐B Suppl (II):178. [Google Scholar]
Torrance 2002 {published and unpublished data}
- Torrance GW, Raynauld JP, Walker V, Goldsmith CH, Bellamy N, Band PA, Schultz M, Tugwell P. A prospective, randomized, pragmatic, health outcomes trial evaluating the incorporation of hylan G‐F 20 into the treatment paradigm for patients with knee osteoarthritis (Part 2 of 2): economic results. Osteoarthritis and Cartilage 2002;10(7):518‐27. [DOI] [PubMed] [Google Scholar]
Turajane 2005 {published data only}
- Turajane T, Labpiboonpong V, Maungsiri S, Sattayathum P. [Therapeutic effects of intra‐articular hyaluronan on failed conservative treatment of knee osteoarthritis with minimum two years follow up]. Annals of the Rheumatic Diseases 2005;64(Suppl III):EULAR, June 8‐11, Vienna, Austria. [Google Scholar]
Turajane 2005a {published data only}
- Turajane T, Labpiboonpong V, Maungsiri S, Sattayathum P. [Medico‐economic analysis of sodium hyaluronate (Hyalgan) treatment in an Asian population over 65 yrs with Kellgren‐Lawrence grade 4 knee OA who failed conservative treatment]. Annals of the Rheumatic Diseases 2005;64(Suppl III):EULAR, June 8‐11, Vienna, Austria. [Google Scholar]
Uebelhart 2003 {unpublished data only}
- Uebelhart D, Berz S. [Safety and efficacy of fermentative hyaluronan in knee osteoarthritis: a retrospective study]. Osteoarthritis and Cartilage 2003;11 Suppl (A):80. [Google Scholar]
Vad 2000 {published data only}
- Vad VB, Cooke PM, Wickiewicz TL, Sculco TP, Warren RF, Althek DW. Hylan versus knee lavage and hylan in management of knee osteoarthritis. 67th Annual Meeting Proceedings, American Academy of Orthopedic Surgeons. Orlando, FL, March 15‐19, 2000:456.
Vad 2003 {published data only}
- Vad VB, Bhat AL, Sculco TP, Wickiewicz TL. [Management of knee osteoarthritis: knee lavage combined with hylan versus hylan alone]. Archives of Physical Medicine and Rehabilitation 2003;84:634‐7. [DOI] [PubMed] [Google Scholar]
Waddell 2001a {published data only}
- Waddell DD, Estey DJ, Bricker D. [Retrospective tolerance of hylan G‐F 20 using fluoroscopically‐confirmed injection and effectiveness of retreatment of knee osteoarthritis]. Arthritis & Rheumatism 2001;44 Suppl (9):48. [Google Scholar]
Waddell 2001b {published data only}
- Waddell DD, Bricker D. [Hylan G‐F 20 reduces the probability of progression to total knee replacement in knee osteoarthritis]. Arthritis & Rheumatism 2001;44 Suppl (9):49. [Google Scholar]
Waddell 2001c {published data only}
- Waddell D, Rein A, Panarites C, Coleman PM, Weiss C. [Cost implications of introducing an alternative treatment for patients with osteoarthritis of the knee in a managed care setting]. American Journal of Management and Care 2001;7(10):981‐91. [PubMed] [Google Scholar]
Waddell 2003 {published data only}
- Waddell DD, Cefalu CA, Bricker DC. [A 52‐week, open‐label study of a second course of hylan G‐F 20 for the treatment of pain associated with osteoarthritis of the knee]. Annals of the Rheumatic Diseases 2003;EULAR, Lisbon, Portugal, June 18‐21. [Google Scholar]
Waddell 2003a {published data only}
- Waddell DD, Bricker DC. [Hylan G‐F 20 reduces the probability of progression to total knee replacement in knee osteoarthritis]. Annals of the Rheumatic Diseases 2003;EULAR, Lisbon, Portugal, June 18‐21. [Google Scholar]
Waddell 2003b {published data only}
- Waddell DD, Bricker DC. [Hylan G‐F 20 in knee osteoarthritis patients: low incidence and clinical management of local adverse events]. Arthritis & Rheumatism. 2003; Vol. 48 Suppl (9):486.
Waddell 2003c {published data only}
- Waddell DD, Cefalu CA, Bricker DC. [An open‐label study of a second course of hylan G‐F 20 for the treatment of pain associated with knee osteoarthritis]. Current Medical Research and Opinion 2003;19(6):499‐507. [DOI] [PubMed] [Google Scholar]
Weiss 1999 {published data only}
- Weiss C, Tillero W, Balazs L. The treatment of osteoarthritis of the knee with hylan GF20 in orthopaedic practice. Osteoarthritis and Cartilage 1999;7 Suppl (A):37. [Google Scholar]
Wobig 1999d {published data only}
- Wobig M, Beks P, Dickhut A, Maier R, Vetter. Open‐label multicenter trial of the safety and efficacy of viscosupplementation with hylan G‐F20 (Synvisc) in primary osteoarthritis of the knee. Journal of Clinical Rheumatology 1999;5 Suppl (6):24‐31. [Google Scholar]
Wulwik 2001 {published data only}
- Wulwik A, Bertocci S, Raude‐Leroy V, Lleu PL. [Efficacy and safety of Synvisc in severe knee osteoarthritis (OA): experience from a large cohort of patients followed in private rheumatological practice]. Annals of the Rheumatic Diseases 2001;60 Suppl (I):226. [Google Scholar]
Yoh 1989 {published data only}
- Yoh K, Tsuji H, Maruoka T, Tateishi H. Clinical results of intra‐articular treatment with sodium hyaluronate in osteoarthritis of the knee. Clinical Rheumatology 1989;2(2):132‐6. [Google Scholar]
Zamora‐Quezada 2004 {published data only}
- Zamora‐Quezada J. [Clinical practice adoption of a Touch‐Screen Outcome Patient Surveys (TOPS) in the management of chronic pain of osteoarthriis]. Arthritis and Rheumatism 2004;50(9(Suppl)):S468‐9. [Google Scholar]
References to studies awaiting assessment
Anand 2004 {published data only}
- Anand S, Mitchell S, Bamforth C, Asumu T, Buch KA. [Effect of intra‐articular injection of sodum hyaluronate on recovery after arthroscopic knee surgery]. Osteoarthritis and Cartilage 2004;12 Suppl (2):141. [Google Scholar]
Blanco Garcia 2004 {published data only}
- Blanco Garcia FJ, Fernandez Sueiro JL, Pinto JA, Fernandez Lopez JC, Ramos M, Gimeno M, Coronel P, Galdo F. [Treating of patients with knee osteoarthritis waiting by replacement surgery with intra‐articular hyaluronic acid (Adant)]. Osteoarthritis and Cartilage 2004;12 Suppl (2):142‐3. [Google Scholar]
Bourgeois (Artz) {unpublished data only}
Briliantono 1996 {published data only}
- Soenarwo Briliantono M. [Treatment of osteoarthritis of the knee by intra‐articular hyaluronic acid]. Immunology and Cell Biology 1996;74:A16. [Google Scholar]
Byrd (Artz) {unpublished data only}
Caracuel 2001 {published data only}
- Caracuel MA, Munoz‐Villanueva MC, Escudero A, Veroz R, Frias G, Vacas J, et al. [Effects of joint lavage and hyaluronic acid infiltration in patients with osteoarthritis of the knee]. Annals of the Rheumatic Diseases 2001;60 Suppl (I):236‐7. [Google Scholar]
Castro 2005 {published data only}
- Castro C, Font P, Munoz E, Frias G, Caracuel MA, Vacas J, Perez V, Escudero A, Lopez P, Collantes E. Efficacy and safety of intra‐articular hyaluronic acid compared (HA) to steroid injections in patients with knee osteoarthritis. Annals of the Rheumatic Diseases 2005;64(Suppl III):EULAR, June 8‐11, Austria, Vienna. [Google Scholar]
Garcia 2004 {published data only}
- Garcia B. [A comparative study: adverse reactions to Synvisc(R) but not Hyalgan(R)]. American Academy of Orthopaedic Surgeons (AAOS) On‐Line Service 2004;71st Annual Meeting, March 10‐14, San Francisco(Annual Meeting Poster Presentations). [Google Scholar]
Gur 2002 {published data only}
- Gur A, Kylync S, Sarac AJ, Nas K, Cevik R. Effects of intra‐articular hyaluronic acid and corticosteroid in the patients with serious knee osteoarthritis. Annals of the Rheumatic Diseases 2002;61 Suppl (EULAR). [Google Scholar]
Joergensen 2005 {published data only}
- Joergensen A, Stengaard‐Pedersen K. [Hyaluronan intra‐articular is without clinical effect in knee osteoarthritis (OA). A multicentre, randomised, placebo controlled, double‐blind study]. Annals of the Rheumatic Diseases 2005;64(Suppl III):EULAR, June 8‐11, Vienna, Austria. [DOI] [PubMed] [Google Scholar]
Kilinc 2002 {published data only}
- Kilinc S, Gur A, Sarac AJ, Nas K, Cevik R. Comparison of intra‐articular hyaluronic acid and physiotherapy in the management of serious knee osteoarthritis. Annals of the Rheumatic Diseases 2002;61 Suppl (EULAR). [Google Scholar]
Kim 2000 {published data only}
- Kim SB, Yoon K, Park HS, Kwak H, Ha NJ, Park JS. The effect of intra‐articular hyaluronic acid and steroid injection in osteoarthritis of the knee. Journal of the Korean Academy of Rehabilition Medicine 2000;24(4):747‐55. [Google Scholar]
Koyuncu 2002a {published data only}
- Koyunci H, Kinc A, Ozkul Y, Yucel E. Clinical, functional and radiological efficacy and tolerability of hyaluronate in osteoarthritis ‐ an open study. Annals of the Rheumatic Diseases 2002;61 Suppl (EULAR). [Google Scholar]
Kuzmanova 2005 {published data only}
- Kuzmanova SI, Solakov PT. [Sodium hyaluronate 500‐730 KDA (Hyalgan) intra‐articularly after treatment of synovitis in primary active osteoarthritis of the knee joint with betamethasone]. Annals of the Rheumatic Diseases 2005;64(Suppl III):EULAR, June 8‐11, Vienna, Austria. [Google Scholar]
Lee 2002 {published data only}
- Lee DC, Beak SH, Sohn WJ, Shin KS, Han JH. Effect of the hyaluronic acid on osteoarthritis of the knee. Journal of the Korean Knee Society 2002;14(2):213‐21. [Google Scholar]
Lucangeli 2001 {published data only}
- Lucangeli A, Gugelmetto M, Primon D. Physical therapy and intraarticular hyaluronic acid in the treatment of osteoarthritis [Terapia fisica e acido ialuronico per via intra‐articolare nel trattamento della gonartrosi]. Revista Italiana di Biologia e Medicina 2001;21(1‐2):5‐10. [Google Scholar]
Petrella 2002a {published data only}
- Petrella RJ, Alkemade SJ, Salvatori VA. Sodium hyaluronate for functional improvement of the osteoarthritic knee ‐ three and six injections. Osteoarthritis and Cartilage 2002;10 Suppl (A):71. [Google Scholar]
Renk[inodot]tepe 20 {published data only}
- Renkl[inodot]tepe N, Atalay E. The effect of intra‐articular sodium hyaluronate therapy in knee osteoarthritis. Annals of the Rheumatic Diseases 2000;59 Suppl (1). [Google Scholar]
Russell 2003 {published data only}
- Russell ID, Baker D, Johnson SR. [A comparison of synvisc and arthroscopic lavage in the mangement of osteoarthritis of the knee]. The Journal of Bone and Joint Surgery 2003;85‐B Suppl (II):106. [Google Scholar]
Shariati 2001 {published data only}
- Shariati J, Hatef M, Jokar M. Intraarticular Hylan G‐F20 (Synvisc) in the treatment of patients with osteoarthritis of the knee. The Journal of Rheumatology 2001;28 Suppl (63):3. [Google Scholar]
Sinha 2003 {published data only}
- Sinha S, Singh BJ, Thilagarajah M, Housden P. [Single vs multiple dose intra‐articular hyaluronic acid in patients with osteoarthritis knee ‐ a prospective clinical trial]. Osteoarthritis and Cartilage 2003;11 Suppl (A):43. [Google Scholar]
Stitik 2004 {published data only}
- Stitik TP, Foye PM, Stiskal DM, Nadler SF, Chen B, Schoenherr L. [Intra‐articular hyaluronate (MW 500‐730 KDA) therapy and concomitant home exercise strengthening: an effective additive therapeutic algorithm for osteoarthritis of the knee]. Osteoarthritis and Cartilage 2004;12 Suppl (2):84. [Google Scholar]
Talwalkar 2005 {published data only}
- Talwalkar NC, Russell DI, Johnson S. [Management of osteoarthritis of the knee, knee lavage compared with intraarticular hylan G‐F 20 (Synvisc) injections]. Journal of the Japanese Orthopaedic Association 2005;79(3):S57. [Google Scholar]
Xu 2005 {published data only}
- Xu P, Guo X, Jin WZ, Yao J, Zhang Y, Cai Q. Clinical observaion on effect of intra‐articular injection of sodium hyaluronate accompanied with external application of sanhua ointment for knee osteoarthritis [[Chinese]]. Zhongguo Zhong Xi Yi Jie He Za Zhi Zhongguo Zhongxiyi Jiehe Zazhi [Chinese Journal of Integrated Traditional & Western Medicine] 2005;25(7):620‐2. [PubMed] [Google Scholar]
Za 2002 {published data only}
- Za ZG, Song YC, Zao MJ, Liu CF. Comparison of therapeutic results of Danshen and sodium hyaluronate injection for knee osteoarthritis. Chinese Journal of Clinical Rehabilitation 2002;6(24):3746‐7. [Google Scholar]
References to ongoing studies
Anonymous 1999 {unpublished data only}
- Orthovisc compared to saline: a double‐blind, randomised controlled trial. Anika Therapeutics Press Release August 1999.
Hempfling 2003 {published and unpublished data}
- Hempfling H. Long‐term outcome of synovial fluid substitution with Viscoseal post‐arthroscopy. Osteoarthritis and Cartilage 2003;11 Suppl (A):79. [Google Scholar]
ISRCTN43185756 {published data only}
- Department of Health, London, UK Phase III trial.
ISRCTN51421587 {published data only}
- Juni P, Villiger PM, Dieppe PA, Zullig M, Egger M for the SVISCOT Group. [Viscosupplementation for osteoarthritis of the knee: protocol for the Swiss viscosupplementation trial (SVISCOT)]. May 15, 2003; Vol. Draft #22.
ISRCTN82192623 {published data only}
- Prospective randomised single blind trial comparing the effectiveness of combined arthroscopic washout and intra articular hyaluronan injection to intra articular hyaluronan injection and arthroscopic washout in isolation, for osteoarthritis of the knee.
NCT00130468 {published data only}
- Sanofi‐Aventis Phase IV trial.
NCT00131352 {published data only}
- Genzyme Phase III trial.
NCT00139295 {published data only}
- Genzyme Phase III trial.
NCT00144820 {published data only}
- Glostrup University Hospital, Phase IV trial.
Russell 2001 {published data only}
- Russell ID, Baker D, Johnson SR. A comparison of Synvisc and arthroscopic lavage in the management of osteoarthritis of the knee. The Journal of Bone and Joint Surgery 2001;83‐B Suppl (II):213. [Google Scholar]
Additional references
ACR Guidelines 2000
- American College of Rheumatology Subcommittee on osteoarthritis guidelines. Recommendations for the medical management of osteoarthritis of the hip and knee. 2000 Update. Arthritis & Rheumatism 2000;43(9):1905‐15. [DOI] [PubMed] [Google Scholar]
Adams 2000
- Adams ME, Lussier AJ, Peyron JG. [A risk‐benefit assessment of injections of hyaluronan and derivatives in the treatment of osteoarthritis of the knee]. Drug Safety 2000;23(2):115‐30. [DOI] [PubMed] [Google Scholar]
Aggarwal 2004
- Aggarwal A, Sempowski IP. [Hyaluronic acid injections for knee osteoarthritis. Systematic review of the literature]. Canadian Family Physician 2004;50:249‐56. [PMC free article] [PubMed] [Google Scholar]
Albert 2005
- Albert C, Brocq O, Gerard D, Roux C, Euller‐Ziegler L. [Septic knee arthritis after intra‐articular hyaluronate injection. Two case reports]. Joint Bone Spine 2005. [DOI] [PubMed] [Google Scholar]
Altman 1986
- Altman R, Asch E, Bloch D, Bole G, Borenstein D, Brandt K, et al. [Development of criteria for the classification and reporting of osteoarthritis. Classification of osteoarthritis of the knee]. Arthritis & Rheumatism 1986;29(8):1039‐49. [DOI] [PubMed] [Google Scholar]
Altman 1991
- Altman RD. [Criteria for classification of clinical osteoarthritis]. The Journal of Rheumatology 1991;18 Suppl (27):10‐2. [PubMed] [Google Scholar]
Altman 2000
- Altman RD. Intra‐articular sodium hyaluronate in osteoarthritis of the knee. Seminars in Arthritis and Rheumatism 2000;30 Suppl (1):11‐8. [DOI] [PubMed] [Google Scholar]
Altman 2002
- Altman R, Moskowitz R. [Hyaluronate sodium injections for osteoarthritis: the truth]. Archives of Internal Medicine 2002;162:2498‐9. [DOI] [PubMed] [Google Scholar]
Altman 2003
- Altman RD. [Status of hyaluronan supplementation therapy in osteoarthritis]. Current Rheumatology Reports 2003;5:7‐14. [ISSN 1523‐3774] [DOI] [PubMed] [Google Scholar]
Arrich 2005
- Arrich J, Piribauer F, Mad P, Schmid D, Klaushofer K, Mullner M. [Intra‐articular hyaluronic acid for the treatment of osteoarthritis of the knee: systematic review and meta‐analysis]. Canadian Medical Association Journal 2005;172(8):1039‐1043. [DOI:10.1503/cmaj.1041203] [DOI] [PMC free article] [PubMed] [Google Scholar]
Aviad 1994
- Aviad AD, Houpt JB. [The molecular weight of therapeutic hyaluronan (sodium hyaluronate): how significant is it?]. The Journal of Rheumatology 1994;21(2):297‐301. [PubMed] [Google Scholar]
Ayral 2001
- Ayral X. Injections in the treatment of osteoarthritis. Bailliere's Best Practice & Research in Clinical Rheumatology 2001;15(4):609‐26. [DOI: 10.1053/berh.2001.0177] [DOI] [PubMed] [Google Scholar]
Bachinger 1996
- Bachinger A, Rappenhoner B, Rychlik R. [Zur soziookonomischen Effizienz einer Zeel comp.‐Therapie im Vergleich zu Hyaluronsaure bei Patienten mit Gonarthrose]. Zeitschrift fur Orthopadie und ihre Grenzgebiete 1996;134(4):Oa20‐1. [PubMed] [Google Scholar]
Balazs 1982
- Balazs EA. [The physical properites of synovial fluid and the special role of hyaluronic acid]. In: Helfet AJ editor(s). Disorders of the Knee. 2. Philadelphia: J. B. Lippincott Company, 1982:61‐74. [Google Scholar]
Band 2005
- Band PA. Comparing different therapeutic classes for the treatment of osteoarthritis of the knee: data from the OMERACT‐OARSI responder criteria analysis. Osteoarthritis and Cartilage 2005. [DOI] [PubMed] [Google Scholar]
Bell 2003
- Bell MJ, Bellamy N, Goldsmith CH, Tugwell P, Torrance GW, Raynauld J‐P, Polisson R, Pericak D, Walker V. [Evaluation of the OARSI and OMERACT‐OARSI set of responder criteria in patients treated with hylan G‐F 20 for knee osteoarthritis]. Arthritis & Rheumatism. 2003; Vol. 48 Suppl (9):482.
Bellamy 1993
- Bellamy N. Musculoskeletal Clinical Metrology. Dordrecht: Kluwer Academic Publishers, 1993. [Google Scholar]
Bellamy 1997
- Bellamy N, Kirwan J, Boers M, Brooks P, Strand V, Tugwell P, Altman R, Brandt K, Dougados M, Lequesne M. [Recommendations for a core set of outcome measures for future phase III clinical trials in knee, hip, and hand osteoarthritis. Consensus development at OMERACT III]. The Journal of Rheumatology 1997;24(4):799‐802. [PubMed] [Google Scholar]
Bellamy 2002
- Bellamy N, Campbell J, Hill J, Band P. [A comparative study of telephone versus onsite completion of the WOMAC 3.0 Osteoarthritis Index]. The Journal of Rheumatology 2002;29(4):783‐6. [PubMed] [Google Scholar]
Bellamy 2003
- Bellamy N, Campbell J, Gee T, Robinson V, Wells G, Bourne RB. [Hylan G‐F 20 for knee osteoarthritis (OA): a Cochrane review]. Arthritis & Rheumatism 2003;48 Suppl (9):697. [Google Scholar]
Bellamy 2003a
- Bellamy N, Bell MJ, Goldsmith CH, Tugwell P, Torrance GW, Raynauld JP, Polisson R, Pericak D, Walker V. [WOMAC 20, 50, 70 response levels in patients treated with hylan G‐F 20 for knee osteoarthritis]. Osteoarthritis and Cartilage 2003;11 Suppl (A):82. [Google Scholar]
Bellamy 2003b
- Bellamy N, Bell MJ, Goldsmith CH, Tugwell P, Torrance GW, Raynauld JP, Polisson R, Pericak D, Walker V. [Symptom free response using the WOMAC pain score in patients treated with hylan G‐F 20 for knee osteoarthritis]. Osteoarthritis and Cartilage 2003;11 Suppl (A):42‐3. [Google Scholar]
Bellamy 2004
- Bellamy N, Bell MJ, Goldsmith CH, Torrance GW, Raynauld J, Tugwell P, Polisson R, Pericak D, Walker V. [Examining minimal perceptible clinical improvement criteria in patients treated with hylan G‐F 20 for knee osteoarthritis]. Annals of the Rheumatic Diseases 2004;EULAR, Berlin, June 9‐12. [DOI] [PMC free article] [PubMed] [Google Scholar]
Bellamy 2005
- Bellamy N, Campbell J, Robinson V, Wells GA, Bourne RB. A Cochrane review of viscosupplementation: hylan G‐F 20 versus placebo. Osteoporosis International 2005;16(3):S12. [Google Scholar]
Bellamy 2005a
- Bellamy N, Bell MJ, Goldsmith CH, Pericak D, Walker V, Raynauld J‐P, Torrance GW, Tugwell P, Polisson R. The effectiveness of hylan G‐F 20 in patients with knee osteoarthritis: an application of two sets of response criteria developed by the OARSI and one set developed by OMERACT‐OARSI. Osteoarthritis and Cartilage 2005;13(2):104‐10. [DOI] [PubMed] [Google Scholar]
Bellamy 2005b
- Bellamy N, Bell MJ, Goldsmith CH, Pericak D, Walker V, Raynauld JP, TorranceGW, Tugwell P, Polisson R. [Evaluation of WOMAC 20, 50, 70 response criteria in patients treated with hylan G‐F 20 for knee osteoarthritis]. Annals of the Rheumatic Diseases 2005;64:881‐5. [DOI] [PMC free article] [PubMed] [Google Scholar]
Bernstein 2004
- Berstein J. [Therapeutic effects of hyaluronic acid on osteoarthritis of the knee]. The Journal of Bone and Joint Surgery 2004;86‐A(11):2567. [DOI] [PubMed] [Google Scholar]
Bhogal 2000
- Bhogal SSSK. Expectation and the placebo effect: how patients' expectation of receiving an active drug versus a placebo influences subjective and objective outcome measures. Senior Honours Thesis, Department of Psychology, The University of Western Ontario, London, Ontario, Canada April 2000.
Blue Cross 1998
- Blue Cross Blue Shield Association Technology Evaluation Center. [Intra‐articular hyaluronan injections for treatment of osteoarthritis of the knee]. TEC Assessment Program 1998; Vol. 15, issue 17:1‐66. [PubMed]
Blue Cross 2004
- Blue Cross Blue Shield Technology Evaluation Center. [Special Report: Intra‐articular hyaluronan for osteoarthritis of the knee]. TEC Assessment Program December 2004. [PubMed]
Brandt 2000
- Brandt KD, Smith GN Jr, Simon LS. Intraarticular injection of hyaluronan as treatment for knee osteoarthritis. What is the evidence?. Arthritis & Rheumatism 2000;43(6):1192‐203. [DOI] [PubMed] [Google Scholar]
Brandt 2004
- Brandt KD. [Non‐surgical treatment of osteoarthritis: a half century of "advances"]. Annals of the Rheumatic Diseases 2004;63:117‐22. [DOI] [PMC free article] [PubMed] [Google Scholar]
Brown 2004
- Brown DJ, Wood EV, Hannah HM, Rao VS, Teanby D. [Prospective comparison of sodium hyaluronate and hylan G‐F 20 in a clinical practice: comment on the concise communication by Martens]. Arthritis & Rheumatism 2004;50(5):1697‐8. [DOI] [PubMed] [Google Scholar]
Brys 2003
- Brys DA. [Corticosteroid compared with hyaluronic acid injections for the treatment of osteoarthritis of the knee]. The Journal of Bone and Joint Surgery 2003;85‐A(4):874‐5. [DOI] [PubMed] [Google Scholar]
Burns 2005
- Burns JW, Kraines JL, Magilavy DB, Murray CW, Richards SM. [Response to: identification of an immunogenic candidate for the elicitation of severe acute inflammatory reactions (SAIRs) to hylan G‐F 20]. Osteoarthritis and Cartilage 2005;13(12):1128‐9. [DOI] [PubMed] [Google Scholar]
Charalambous 2003
- Charalambous CP. [Corticosteroid compared with hyaluronic acid injections for the treatment of osteoarthritis of the knee]. The Journal of Bone and Joint Surgery 2003;85‐A(4):874. [DOI] [PubMed] [Google Scholar]
Choi 1999
- Choi HK, Modawal A, Ferrer M, Caron JA. [A meta‐analysis on the efficacy of intra‐articular viscosupplementation therapy for knee osteoarthritis]. Arthritis & Rheumatism 1999;42 Suppl (9):293. [Google Scholar]
Cohen 1977
- Cohen J. Statistical power analysis for the behavioural sciences. New York: Academic Press, 1977. [Google Scholar]
Collange 1999
- Collange C, Weyl‐Clerc D. [Que penser des injections intra‐articulaires dans le traitement de la gonarthrose]. In: MF Kahn, D Kuntz, O Meyer, Th Bardin, Ph Orcel, CI Guerin editor(s). L'actualities rhumatologique. Paris: Expansion Scientifique Francaise, 1999:422‐34. [Google Scholar]
Denlinger 1998
- Denlinger JL. [Hyaluronan and its derivatives as viscoelastics in medicine]. In: Laurent TC editor(s). The Chemistry, Biology and Medical Applications of Hyaluronan and its Derivatives. London: Portland Press Ltd., 1998. [Google Scholar]
Dickerson 1994
- Dickerson K, Scherer R, Lefevbre C. [Identifying relevant studies for systematic reviews]. BMJ 1994;309:1286‐91. [DOI] [PMC free article] [PubMed] [Google Scholar]
Dougados 2000
- Dougados M. Sodium hyaluronate therapy in osteoarthritis: arguments for a potential beneficial structural effect. Seminars in Arthritis and Rheumatism 2000;30 Suppl (1):19‐25. [DOI] [PubMed] [Google Scholar]
Dougados 2005
- Dougados M. Comparing different therapeutic classes for the treatment of osteoarthritis of the knee: data from the OMERACT‐OARSI responder criteria analysis. Osteoarthritis and Cartilage 2005. [DOI] [PubMed] [Google Scholar]
Dubey 2003
- Dubey V, Glazier RH. [Intra‐articular hyaluronic acid injections. Are they effective treatment for osteoarthritis of the knee?]. Canadian Family Physician 2003;49(April):435‐7. [PMC free article] [PubMed] [Google Scholar]
Espallargues 2003
- Espallargues M, Pons J.M.V. Efficacy and safety of viscosupplementation with Hylan G‐F 20 for the treatment of knee osteoarthritis. A systematic review. International Journal of Technology Assessment in Health Care 2003;19(1):41‐56. [DOI] [PubMed] [Google Scholar]
Felson 2002
- Felson DT, Anderson JJ. [Hyaluronate sodium injections for osteoarthritis. Hope, hype, and hard truths]. Archives of Internal Medicine 2002;162:245‐7. [DOI] [PubMed] [Google Scholar]
Felson 2002a
- Felson DT, Anerson JJ. [Hyaluronate sodium injections for osteoarthritis: the truth (In reply)]. Archives of Internal Medicine 2002;162:2499‐500. [DOI] [PubMed] [Google Scholar]
Galli 2004
- Galli M, Santis V, Tafuro L. [Reliability of the Ahlback classification of knee osteoarthritis]. Osteoarthritis and Cartilage 2003;11:580‐4. [DOI] [PubMed] [Google Scholar]
Ghosh 2002
- Ghosh P, Guidolin D. [Potential mechanism of action of intra‐articular hyaluronan therapy in osteoarthritis: are the effects molecular weight dependent?]. Seminars in Arthritis and Rheumatism 2002;32(1):10‐37. [doi:10.1053/sarh.2002.32549] [DOI] [PubMed] [Google Scholar]
Goldsmith 2004
- Goldsmith CH, Bellamy N, Pericak D, Torrance GW, Raynauld JP, Bell M, Polisson R. [Predictors of osteoarthritis (OA) improvement in patients treated with hylan G‐F 20 for knee OA]. Osteoarthritis and Cartilage 2004;12 Suppl (2):77. [Google Scholar]
Gossec 2006
- Gossec L, Dougados M. [Do intra‐articular therapies work and who will benefit most?]. Best Practice & Research Clinical Rheumatology 2006;20(1):131‐144. [DOI] [PubMed] [Google Scholar]
Hamburger 2003
- Hamburger MI, Lakhanpal S, Mooar PA, Oster D. [Intra‐articular hyaluronans: a review of product‐specific safety profiles]. Seminars in Arthritis and Rheumatism 2003;32:296‐309. [DOI] [PubMed] [Google Scholar]
Hamburger 2005
- Hamburger MI. [Letter to the Editor: Response to the article by Raynauld et al.]. Osteoarthritis and Cartilage 2005;13(11):1039‐40. [DOI] [PubMed] [Google Scholar]
Hamburger 2005a
- Hamburger M, Settles M, Teutsch J. [Author's reply to letter by Burns et al]. Osteoarthritis and Cartilage 2005;13(12):1130‐1. [DOI] [PubMed] [Google Scholar]
Hammesfahr 2003
- Hammesfahr JFR, Knopf AB, Stitik T. [Safety of intra‐articular hyaluronates for pain associated with osteoarthritis of the knee]. The American Journal of Orthopedics 2003;32(6):277‐83. [PubMed] [Google Scholar]
Haraoui 2002
- Haraoui B, Raynauld J‐P. [Intra‐articular therapy in osteoarthritis]. In: G.C. Tsokos editor(s). Modern Therapeutics in Rheumatic Diseases. Totowa, NJ: Humana Press, Inc., 2002:193‐200. [Google Scholar]
Haynes 1994
- Haynes RB, Wilczynski N, McKibbon KA, WalkerCJ, Sinclair JC. [Developing optimal search strategies for detecting clinically sound studies in MEDLINE]. Journal of the American Medical Informatics Association 1994;1:447‐58. [DOI] [PMC free article] [PubMed] [Google Scholar]
Hedges 1985
- Hedges LV, Olkin I. Statistical methods for metaanalysis. Orlando, FL: Academic Press, 1985. [Google Scholar]
Higgins 2003
- Higgins JPT, Thompson SG, Deeks JJ, Altman DG. [Measuring inconsistency in meta‐analyses]. BMJ 2003;327:557‐60. [DOI] [PMC free article] [PubMed] [Google Scholar]
Hochberg 2000
- Hochberg MC. Role of intra‐articular hyaluronic acid preparations in medical management of osteoarthritis of the knee. Seminars in Arthritis and Rheumatism 2000;30 Suppl (1):2‐10. [DOI] [PubMed] [Google Scholar]
Hou 2004
- Hou S‐M, Wang C‐T. [Therapeutic effects of hyaluronic acid on osteoarthritis of the knee]. The Journal of Bone and Joint Surgery 2004;86‐A(11):2567. [DOI] [PubMed] [Google Scholar]
Hyalgan
- Hyalgan Premarket Approval Application: Summary of safety and effectiveness data. http://www.fda.gov/cdrh/pdf/p950027.pdf.
Ikeda 1998
- Ikeda K, et al. Changes in synovial fluid markers and clinical effect after intra‐articular injection of sodium hyaluronate: with particulr reference to the anti‐inflammatory effect in terms of prostaglandin E2 concentration. Journal of Tokyo Womens' Medical College 1998;68(1/2):22‐36. [Google Scholar]
Jadad 1996
- Jadad AR, Moore RA, Carroll D, Jenkinson C, Reynolds DJM, Gavaghan DJ, McQuay HJ. Assessing the quality of reports of randomized clinical trials: is blinding necessary. Controlled Clinical Trials 1996;17:1‐12. [DOI] [PubMed] [Google Scholar]
Jones 1993
- Jones A, Regan M, Ledingham J, Pattrick M, Mantire A, Doherty M. [Importance of placement of intra‐articular steroid injections]. BMJ 1993;307:1329‐30. [DOI] [PMC free article] [PubMed] [Google Scholar]
Jordan 2003
- Jordan KM, Arden NK, Doherty M, Bannwarth B, Bijlsma JWJ, Dieppe P, et al. [EULAR recommendations 2003: an evidence based approach to the management of knee osteoarthritis: Report of a Task Force of the Standing Committee for International Clinical Studies Including Therapeutic Trials (ESCISIT)]. Annals of the Rheumatic Diseases 2003;62:1145‐55. [DOI] [PMC free article] [PubMed] [Google Scholar]
Kaptchuk 2000
- Kaptchuk TJ, Goldman P, Stone DA, Stason WB. [Do medical devices have enhanced placebo effects?]. Journal of Clinical Epidemiology 2000;53:786‐92. [DOI] [PubMed] [Google Scholar]
Kelly 2003
- Kelly MA, Goldberg VM, Healy WL, Pagnano MW, Hamburger MI. [Osteoarthritis and beyond: a consensus on the past, present and future of hyaluronans in orthopedics]. Orthopedics 2003;26(10):1064‐79. [DOI] [PubMed] [Google Scholar]
Khanuja 2003
- Khanuja HS, Hungerford MW, Manjoo A. [Intraarticular injections for the treatment of osteoarthritis of the knee: basic science, results, and indications]. Current Opinion in Orthopaedics 2003;14(1):62‐8. [Google Scholar]
Kirwan 1997
- Kirwan JR, Rankin E. Intra‐articular therapy in osteoarthritis. Bailliere's Clinical Rheumatology 1997;11(4):769‐94. [DOI] [PubMed] [Google Scholar]
Kirwan 2001
- Kirwan J. Is there a place for intra‐articular hyaluronate in osteoarthritis of the knee?. The Knee 2001;8(2):93‐101. [DOI] [PubMed] [Google Scholar]
Lequesne 1996
- Lequesne M. Clinical outcomes of intra‐articular hyaluronan in the treatment of osteoarthritis of the knee. Immunology and Cell Biology 1996;74:A13‐14. [Google Scholar]
Lo 2002
- Lo GH, LaValley MP, McAlindon TE, Felson DT. [Is intra‐articular (IA) hyaluronic acid (HA) efficacious in treating knee osteoarthritis (OA)?]. Arthritis & Rheumatism 2002;47 Suppl (9):576. [Google Scholar]
Lo 2003
- Lo GH, Valley M, McAlindon T, Felson DT. [Intra‐articular hyaluronic acid in treatment of knee osteoarthritis. A meta‐analysis]. JAMA 290(23):3115‐21. [DOI] [PubMed] [Google Scholar]
Lo 2003a
- Lo GH, Valley M, Felson DT. [Importance of intra‐articular placebos in trials evaluating intra‐articular therapies]. Arthritis & Rheumatism 2003;48(12):3618. [Google Scholar]
Lund 1988
- Lund T. [Some metrical issues with meta‐analysis of therapy effects]. Scandinavian Journal of Psychology 1988;29:1‐8. [DOI] [PubMed] [Google Scholar]
Lussier 1996
- Lussier A, Cividino AA, McFarlane CA, Olszynski WP, Potashner WJ, Medicis R. Viscosupplementation with Hylan for the treatment of osteoarthritis: findings from clinical practice in Canada. The Journal of Rheumatology 1996;23(9):1579‐85. [PubMed] [Google Scholar]
Magilavy 2003
- Magilavy D, Polisson R, Parenti D. Re: Karlsson et al. Comparison of two hyaluronan drugs and placebo in patients with knee osteoarthritis. A controlled, randomized, double‐blind, parallel‐design multicentre study. Rheumatology 2003;42(10):1262. [DOI] [PubMed] [Google Scholar]
Maheu 1994
- Maheu E, Lamotte J, Lequesne M. [Sel sodiuque de l'acide hyaluronique (hyaluronan) et gonarthrose]. In: S De Seze, A Ryckewaert, MF Kahn, D Kuntz, A Dryll, O Meyer, Th Bardin, CI Guerin editor(s). L'actualite rhumatologique. Paris: Expansion Scientifique Francaise ed., 1994:324‐39. [Google Scholar]
Maheu 1995
- Maheu E. Hyaluronan in knee osteoarthritis: a review of the clinical trials with Hyalgan. European Journal of Rheumatology and Inflammation 1995;15(1):17‐24. [Google Scholar]
Maheu 2002
- Maheu E, Ayral X, Dougados M. [A hyaluronan preparation (500‐730 KDA) in the treatment of osteoarthritis: a review of clinical trials with hyalgan]. International Journal of Clinical Practice 2002;56(10):804‐13. [PubMed] [Google Scholar]
Maheu 2003
- Maheu E, Bonvarlet. [Acute pseudo‐septic arthritis post hyaluronate (HA) intra‐articular (IA) injections. Results of a French survey in rheumatology practice]. Annals of the Rheumatic Diseases 2003;EULAR, Lisbon, Portugal, June 18‐21. [Google Scholar]
Maheu 200?
- Maheu E. Hyaluronic acid in the treatment of osteoarthritis of the knee [L'acide hyaluronique dans le traitement de la gonarthrose]. Le journal francais de l'orthopedie [The French Orthopaedic web journal] at www.maitrise‐orthop.com 2003. [Google Scholar]
Maneiro 2004
- Maneiro E, Andres MC, Fernandez‐Sueiro JL, Galdo F, Blanco FJ. [The biological action of hyaluronan on human osteoarthritic articular chondrocytes: the importance of molecular weight]. Clinical and Experimental Rheumatology 2004;22:307‐12. [PubMed] [Google Scholar]
Marshall 2000
- Marshall KW. Intra‐articular hyaluronan therapy. Current Opinion in Rheumatology 2000;12:468‐74. [DOI] [PubMed] [Google Scholar]
Mazieres 2001
- Mazieres B, Bannwarth B, Dougados M, Lequesne M. [EULAR recommendations for the management of knee osteoarthritis. Report of a task force of the Standing Committee for International Clinical Studies Including Therapeutic Trials]. Joint Bone Spine 2001;68:231‐40. [DOI] [PubMed] [Google Scholar]
McAuley 2000
- McAuley L, Pham B, Tugwell P, Moher D. [Does the inclusion of grey literature influence estimates of intervention effectiveness reported in meta‐analyses?]. Lancet 2000;356(9237):1228‐31. [DOI] [PubMed] [Google Scholar]
Middel 2002
- Middel B, Sonderen E. [Statistical significant change versus relevant or important change in (quasi) experimental design: some conceptual and methodological problems in estimating magnitude of intervention‐related change in health services research]. International Journal of Integrated Care 2002;2. [DOI] [PMC free article] [PubMed] [Google Scholar]
Modawal 2005
- Modawal A, Ferrer M, Choi HK, Castle JA. [Hyaluronic acid injections relieve knee pain]. The Journal of Family Practice 2005;54(9):758‐67. [PubMed] [Google Scholar]
MOHLTC 2005
- Ontario Ministry of Health and Long‐Term Care. Intra‐articular injection of hylan G‐F 20 for osteoarthritis of the knee. Government of Ontario, Canada 2005.
Moreland 2003
- Moreland LW. [Intra‐articular hyaluronan (hyaluronic acid) and hylans for the treatment of osteoarthritis: mechanisms of action]. Arthritis Research & Therapy 2003;5(2):54‐67. [DOI] [PMC free article] [PubMed] [Google Scholar]
Moskowitz 2000
- Moskowitz RW. [Hyaluronic acid supplementation]. Current Review of Rheumatology 2000;2:466‐71. [DOI] [PubMed] [Google Scholar]
MSAC 2003
- Medical Services Advisory Committee. Intra‐articular viscosupplementation for treatment of osteoarthritis of the knee. Commonwealth of Australia March 2003; Vol. MSAC application 1045, issue Assessment Report:88 pages.
Namiki 1983
- Namiki O, Akiyama F, Hasegawa K, Rikimaru Y, Takahashi S. Properties of osteoarthritic synovial fluid and the metabolism of injected sodium hyaluronate. The Knee 1983;9(1):69‐73. [Google Scholar]
Norman 1989
- Norman GR. [Issues in the use of change scores in randomized trials]. Journal of Clinical Epidemiology 1989;42(11):1097‐105. [DOI] [PubMed] [Google Scholar]
Orthovisc
- Orthovisc Premarket Approval Application: Summary of safety and effectiveness data. http://www.fda.gov/cdrh/pdf/p030019.pdf.
Pagnano 2005
- Pagnano M, Westrich G. Successful nonoperative management of chronic osteoarthritis pain of the knee: safety and efficacy of retreatment with intra‐articular hyaluronans. Osteoarthritis and Cartilage 2005;13(9):751‐761. [DOI] [PubMed] [Google Scholar]
Pendleton 2000
- Pendleton A, Arden N, Dougados M, Doherty M, Bannwarth B, Bijlsma JWJ, et alelka K, Serni U, Swoboda B, Verbruggen AA, Weseloh G, Zimmermann‐Gorska I. [EULAR recommendations for the management of knee osteoarthritis: report of a task force of the Standing Committee for International Clinical Studies Including Therapeutic Trials (ESCISIT)]. Annals of the Rheumatic Diseases 2000;43:1905‐15. [DOI] [PMC free article] [PubMed] [Google Scholar]
Petitti 1994
- Petitti DB. Meta‐analysis, decision analysis, and cost‐effectiveness analysis. Methods for quantitative synthesis in medicine. Monographs in epidemiology and biostatistics. Vol. 24, New York: Oxford University Press, Inc., 1994. [Google Scholar]
Peyron 1974
- Peyron JG, Balazs EA. Preliminary clinical assessment of Na‐hyaluronate injection into human arthritic joints. Pathologie‐Biologie (Paris) 1974;22(8):731‐6. [PubMed] [Google Scholar]
Peyron 1993
- Peyron JG. Intraarticular hyaluronan injections in the treatment of osteoarthritis: state‐of‐the‐art review. The Journal of Rheumatology 1993;20 Suppl (39):10‐5. [PubMed] [Google Scholar]
Pisoni 2004
- Pisoni L, Schito E, Lucia O, Murgo A, Paresce E. Osteoarthritis of the knee and local treatment [La gonartrosi ed il trattamento locale]. Artroscopia 2004;5(3):176‐188. [Google Scholar]
Puhl 1997
- Puhl W, Scharf P. [Intra‐articular hyaluronan treatment for osteoarthritis]. Annals of the Rheumatic Diseases 1997;56(7):441. [DOI] [PMC free article] [PubMed] [Google Scholar]
Punzi 2001
- Punzi L. The complexity of the mechanisms of action of hyaluronan in joint diseases. Clinical and Experimental Rheumatology 2001;19:242‐6. [PubMed] [Google Scholar]
Puttick 1995
- Puttick MPE, Wade JP, Chalmers A, Connell DG, Rangno KK. Acute local reactions after intraarticular hylan for osteoarthritis of the knee. The Journal of Rheumatology 1995;22(7):1311‐4. [PubMed] [Google Scholar]
Raynauld 2003
- Raynauld JP, Olszynski WP, Goldsmith CH, Torrance GW, Bellamy N, Polission R, Pericak D, Walker V. [Effectiveness and safety of hylan G‐F 20 compared to steroid injections in patients with knee osteoarthritis]. Arthritis & Rheumatism. 2003; Vol. 48 Suppl (9):484.
Raynauld 2005
- Raynauld JP, Goldsmith CH, Bellamy N, Torrance GW, Polisson R, Belovich D, Pericak D, Tugwell P. Effectiveness and safety of repeat courses of hylan G‐F 20 in patients with knee osteoarthritis. Osteoarthritis and Cartilage 2005;13(2):111‐9. [DOI] [PubMed] [Google Scholar]
Raynauld 2005a
- Raynauld J‐P, Goldsmith CH, Torrance GW for the Steering Committee and Clinical Investigators of the Canadian Knee OA Study Group. [Letter to the Editor: Reply to the letter by Max I. Hamburger]. Osteoarthritis and Cartilage 2005;13(12):1037‐38. [DOI] [PubMed] [Google Scholar]
Schulz 1995
- Schulz KF, Chalmers I, Hayes RJ, Altman DG. [Empirical evidence of bias. Dimensions of methodological quality associated with estimates of treatment effects in controlled trials]. JAMA 1995;273(5):408‐12. [DOI] [PubMed] [Google Scholar]
Schumacher 2003
- Schumacher Jr HR. [Aspiration and injection therapies for joints]. Arthritis & Rheumatism 2003;49(3):413‐20. [DOI] [PubMed] [Google Scholar]
Shinmei 1983
- Shinmei M, Inaoka M, Ukon Y, Shimomura Y, Tsuru S. Intra‐articular injection therapy of high molecular weight sodium hyaluronate on osteoarthritis of the knee ‐ clinical effects and change in synovial fluid properties. The Knee 1983;9(1):108‐13. [Google Scholar]
Sokoloff 2001
- Sokoloff L. Some highlights in the emergence of modern concepts of osteoarthritis. Seminars in Arthritis and Rheumatism 2001;31(2):71‐107. [DOI] [PubMed] [Google Scholar]
Stucki 1996
- Stucki G, Daltroy L, Katz JN, Johannesson M, Liang MH. [Interpretation of change scores in ordinal clinical scales and health status measures: the whole may not equal the sum of the parts]. Journal of Clinical Epidemiology 1996;49(7):711‐7. [DOI] [PubMed] [Google Scholar]
Supartz
- Supartz Premarket Approval Application: Summary of safety and effectiveness data. http://www.fda.gov/cdrh/pdf/p980044.pdf.
Sutton 1997
- Sutton AJ, Muir KR, Jones AC. [Two knees or one person: data analysis strategies for paired joints or organs]. Annals of the Rheumatic Diseases 1997;56:401‐2. [DOI] [PMC free article] [PubMed] [Google Scholar]
Synvisc Hylan G‐F 20
- Synvisc Hylan G‐F 20 Premarket Approval Application: Summary of safety and effectiveness data. http://www.fda.gov/cdrh/pdf/p940015.pdf.
Tehranzadeh 2005
- Tehranzadeh J, Booya F, Root J. Cartilage metabolism in osteoarthritis and the influence of viscosupplementation and steroid: a review. Acta Radiologica 2005;46(3):288‐96. [DOI] [PubMed] [Google Scholar]
Terrin 2005
- Terrin N, Schmid CH, Lau J. [In an empirical evaluation of the funnel plot, researchers could not visually identify publication bias]. Journal of Clinical Epidemiology 2005;58:894‐01. [DOI] [PubMed] [Google Scholar]
Towheed 1997
- Towheed TE, Hochberg MC. A systematic review of randomized controlled trials of pharmacological therapy in osteoarthritis of the knee, with an emphasis on trial methodology. Seminars in Arthritis and Rheumatism 1997;25(5):755‐70. [DOI] [PubMed] [Google Scholar]
Tubach 2005
- Tubach F, Ravaud P, Baron G, Falissard B, Logeart I, Bellamy N, Bombardier C, Felson DT, Hochberg M, Heijde D, Dougados M. [Evaluation of clinically relevant changes in patient reported outcomes in knee and hip osteoarthritis: the Minimal Clinically Important Improvement]. Annals of the Rheumatic Diseases 2005;64(1):29‐33. [DOI] [PMC free article] [PubMed] [Google Scholar]
Uebelhart 1999
- Uebelhart D, WilliamsJM. [Effects of hyaluronic acid on cartilage degradation]. Current Opinion in Rheumatology 1999;11:427‐35. [DOI] [PubMed] [Google Scholar]
Ueno 1995
- Ueno Y, Kuramoto K, Konno N, Koizumi T, Hoshiba T, Kamohara S, Koono M, Nunomura T, Futami M. Investigations on result of use after launch of ARTZ and ARTZ Dispo ‐ evaluation on the efficacy, safety and utility in the medications for osteoarthritis of the knee and periarthritis of the shoulder. Japanese Pharmacology & Therapeutics 1995;23(8):2151‐70. [Google Scholar]
Vickers 2001
- Vickers AJ, Altman DG. [Analysing controlled trials with baseline and follow up measurements]. BMJ 2001;323:1123‐4. [DOI] [PMC free article] [PubMed] [Google Scholar]
Waddell 2003
- Waddell DD. [The tolerability of viscosupplementation: low incidence and clinical management of local adverse events]. Current Medical Research and Opinion 2003;19(7):575‐80. [DOI] [PubMed] [Google Scholar]
Walker‐Bone 2000
- Walker‐Bone K, Javaid K, Arden N, Cooper C. Medical management of osteoarthritis. BMJ 2000;321:936‐40. [DOI] [PMC free article] [PubMed] [Google Scholar]
Wang 2004
- Wang C‐T, Lin J, Chang C‐J, Lin Y‐T, Hou S‐M. [Therapeutic effects of hyaluronic acid on osteoarthritis of the knee. A meta‐analysis of randomized controlled trials]. The Journal of Bone and Joint Surgery 2004;86‐A(3):538‐45. [DOI] [PubMed] [Google Scholar]
Watterson 2000
- Watterson JR, Esdaile JM. Viscosupplementation: Therapeutic mechanisms and clinical potential in osteoarthritis of the knee. Journal of the American Academy of Orthopedic Surgeons 2000;8(5):277‐84. [DOI] [PubMed] [Google Scholar]
Weiss 1999
- Weiss C, Band P. [Basic principles underlying the development of viscosupplementation for the treatment of osteoarthritis]. Journal of Clinical Rheumatology 1999;5 Suppl:2‐11. [Google Scholar]
Wen 2000
- Wen DY. [Intra‐articular hyaluronic acid injections for knee osteoarthritis]. American Family Physician 2000;62(3):565‐70. [PubMed] [Google Scholar]
WInd 2004
- Wind Jr. WM, Smolinski RJ. [Reliability of common knee injection sites with low‐volume injections]. The Journal of Arthroplasty 2004;19(7):858‐61. [DOI] [PubMed] [Google Scholar]
Zhang 1996
- Zhang Y, Glynn RJ, Felson DT. [Musculoskeletal disease research: should we analyze the joint or the person?]. The Journal of Rheumatology 1996;23(7):1130‐4. [PubMed] [Google Scholar]
References to other published versions of this review
Bellamy 2005c
- Bellamy N, Campbell J, Robinson V, Gee T, Bourne R, Wells G. [Viscosupplementation for the treatment of osteoarthritis of the knee]. The Cochrane Database of Systematic Reviews 2005, (2). [MEDLINE: ; DOI:10.1002/14651858.CD005321] [DOI] [PubMed] [Google Scholar]