Abstract
Elevated intraocular pressure (IOP) may cause mechanical injuries to the optic nerve head (ONH) and the peripapillary tissues in glaucoma. Previous studies have reported the mechanical deformation of the ONH and the peripapillary sclera (PPS) at elevated IOP. The deformation of the peripapillary retina (PPR) has not been well-characterized. Here we applied high-frequency ultrasound elastography to map and quantify PPR deformation, and compared PPR, PPS and ONH deformation in the same eye. Whole globe inflation was performed in ten human donor eyes. High-frequency ultrasound scans of the posterior eye were acquired while IOP was raised from 5 to 30 mmHg. A correlation-based ultrasound speckle tracking algorithm was used to compute pressure-induced displacements within the scanned tissue cross sections. Radial, tangential, and shear strains were calculated for the PPR, PPS, and ONH regions. In PPR, shear was significantly larger in magnitude than radial and tangential strains. Strain maps showed localized high shear and high tangential strains in PPR. In comparison to PPS and ONH, PPR had greater shear and a similar level of tangential strain. Surprisingly, PPR radial compression was minimal and significantly smaller than that in PPS. These results provide new insights into PPR deformation in response of IOP elevation, suggesting that shear rather than compression was likely the primary mode of IOP-induced mechanical insult in PPR. High shear, especially localized high shear, may contribute to the mechanical damage of this tissue in glaucoma.
Introduction
The retina is a light-sensitive neural tissue that forms the innermost layer of the ocular shell. It converts incoming light energy to electrochemical signals that are passed along the retinal ganglion cell (RGC) axons to the brain through the scleral canal where the axons converge and exit the eye. In the group of diseases known as glaucoma, damage to the RGC axons initiates at the optic nerve head (ONH) and leads to vision loss and, in severe cases, blindness. Elevated intraocular pressure (IOP) has been identified as a primary risk factor for glaucoma onset and progression. As such, IOP-related mechanical damage to the ONH and surrounding peripapillary tissues plays a central role in glaucoma pathophysiology. Characterization of the deformation response of these tissues offers an important opportunity to further our understanding of the biomechanical contributors in glaucoma damage.
While the biomechanical responses of the ONH and the peripapillary sclera (PPS) have been the focus of many studies [1], little is known about the biomechanical responses of the peripapillary retina (PPR) to elevated IOP. The PPR is implicated in glaucoma. For example, the thinning of the neural fiber layer of the PPR is a clinical hallmark of glaucoma progression [2]. In the diseased state, PPR also shows reduced capillary density [3]. The retina is composed mostly of neural and capillary tissues, which are thought to be much weaker mechanically than the collagenous sclera. Retina is also fragile, presenting a challenge for ex vivo testing in dissected specimens [4,5]. Uniaxial tensile tests of retinal strips [6–8] and compression tests of retinal biopsy punches [9] from animal eyes have been reported. More recently, optical coherence tomography (OCT) was used to image the displacement of retina when pushed by acoustic radiation force [10]. These studies do not replicate the physiological loading (i.e., IOP) in the eye, and the PPR's response to elevated IOP remains largely unknown.
The primary objective of the present study was to characterize the deformation of the human peripapillary retina (PPR) in response to acute IOP elevations using a high-frequency ultrasound elastography technique in donor eyes. High-frequency ultrasound at 50 MHz offers excellent tissue penetration (∼2 mm) and spatial resolution (30 μm axially and 75 μm laterally) for imaging the structures in and around the ONH [11–14]. Using radiofrequency (RF) analysis and interpolation, we have developed and validated an elastographic technique that achieves a displacement sensitivity at the level of 10's of nanometers [13,15]. In this study, we measured PPR deformation in normal human donor eyes during acute IOP elevation and compared with PPS and ONH deformation in the same eye. These results may provide new insights into the biomechanical response of the PPR and the potential role of such response in IOP-related glaucomatous damage.
Methodology
Donor Eye Preparation and Experimental Setup.
Ten normal donor globes (age: 20 – 74 years old; mean±SD: 49 ± 20 years old; 4 male and 6 female) were obtained from the Lion's Eye Bank of West Central Ohio (Dayton, OH, USA) in accordance with the Declaration of Helsinki. All globes were recovered within 12 h postmortem and all experiments were completed within 36 h postmortem. The globes were stored in a moist container at 4 °C until experimental use.
Extraocular tissue was removed from the globe and the optic nerve was trimmed close to the surface of the sclera for ultrasound imaging from the posterior side. Two spinal needles were inserted through the equator of the globe to secure the eye to a custom-built holder with the ONH facing upward (Fig. 1). Two 20G needles were inserted into the anterior chamber of the eye, one connected to an infusion pump (Ph.D. Ultra, Harvard Apparatus, MA) and the other to a pressure sensor (P75, Harvard Apparatus, MA) to control and continuously record IOP. The eye was immersed in 0.9% saline to maintain tissue hydration and facilitate ultrasound transduction.
Fig. 1.
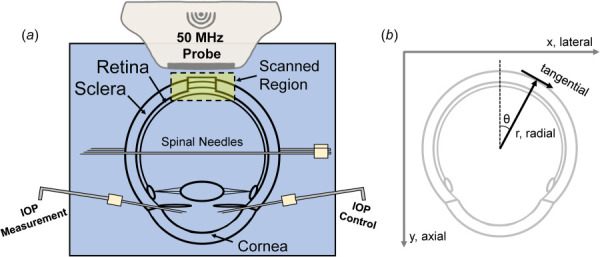
(a) Experimental setup of human donor globe inflation with high-frequency ultrasound imaging of the PPR, PPS, and ONH. (b) Illustration of the image scanning coordinate system (x/lateral, y/axial) and the polar coordinate system used to calculate radial and tangential strains.
Inflation Testing with Ultrasound Imaging.
For all inflation testing, control of the testing apparatus and data acquisition were implemented by using a customized LabView program (National Instruments, Austin, TX). The globes were first preconditioned with 20 cycles from 5 to 30 mmHg at 2 s per cycle before equilibrating at 5 mmHg for 30 min. The inflation tests were then performed by increasing IOP from 5 to 30 mmHg with 0.5 mmHg steps. The IOP was held constant at each pressure level for 30 s before ultrasound scans were acquired using a 50 MHz ultrasound probe (MS700, Vevo2100, FUJIFilm VisualSonics, Toronto). The two-dimensional scans captured a cross-sectional view of approximately 10 mm (width) × 5 mm (depth) of the posterior eye centered at the ONH. Each eye was inflated twice, and two sets of scans were acquired, one along the nasal-temporal (NT) axis and the other along the superior-inferior (SI) axis. The two inflations were separated by 30 min of equilibration time at 5 mmHg.
Ultrasound Speckle Tracking Algorithm.
A correlation-based ultrasound speckle tracking algorithm has been described and validated previously [11]. Briefly, digitized ultrasound radiofrequency (RF) data, sampled at 1.5 μm × 19 μm (axial × lateral), are acquired during image acquisition. To perform speckle tracking, a region of interest (ROI) was manually defined to include all visible tissue within the boundaries of the PPS and PPR, including the ONH, at the initial IOP. Within the ROI, the RF data were divided into kernels, each containing 51 × 31 pixels (75 μm × 570 μm), with a 50% kernel overlap for the optimal tradeoff between spatial resolution of strain maps and signal-to-noise ratio of strains [11]. The displacement of each kernel was computed by cross-correlation between successive RF frames within a search window. The maximum correlation coefficient value designated the new location of the kernel, and spline interpolation allowed for subpixel resolution in displacement tracking. The cumulative displacement vectors were calculated with respect to the kernel location at the initial IOP. Green–Lagrangian strains in the scanning coordinates along the lateral (x) and axial (y) directions were calculated from local displacement gradients using least squares estimation [16]. Radial, tangential, and shear strains were obtained by coordinate transform based on tissue curvature of the posterior scleral boundary and the anterior retinal boundary to eliminate the effect of pure rotation and better reflect the curved anatomy of the posterior eye (Fig. 1(b)) using the following equation:
| (1) |
where and are the strains in horizontal and vertical directions, and are the radial and tangential strains, and is the angle between the two coordinate systems. is calculated from the coordinates of the kernel and those of the center of the circle fit to the contours of the PPS and PPR boundaries. The remaining strain variables in Eq. (1) represent the shear components, and the magnitudes (absolute values) were used for quantitative analyses.
Regional Deformation Analysis.
Peripapillary retina, PPS, and ONH were defined by manual segmentation based on tissue boundaries visible in ultrasound images (Fig. 2(a)). We have previously validated the repeatability of manual segmentation of ONH structures for ultrasound images, showing excellent interobserver repeatability [14]. Choroid was not separable from the sclera in the ultrasound images, and thus was included within the PPS region. Three concentric circles were fitted that matched approximately the anterior PPR, posterior PPR, and posterior PPS surfaces within the scanned images in both the NT and SI scans at the baseline IOP (Fig. 2(b)). Retinal thickness was measured as the difference in the radii of the fitted circles of the anterior and posterior PPR surfaces. Similarly, scleral thickness was measured as the difference in the radii of the fitted circles of the posterior PPR and posterior PPS surfaces. Average displacements and strains in each region were obtained and analyzed. Color maps were generated to visualize the spatial distribution of strains. Strain maps were generated for each region with spline interpolation to the pixel level. The differences of the average strains between the different regions were evaluated by using paired t-tests. Explorative analyses were performed to evaluate correlations between age and PPR/PPS thickness, as well as the strains in different regions.
Fig. 2.
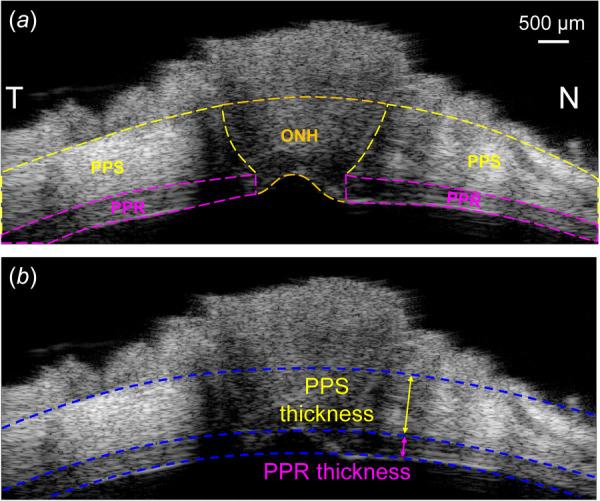
(a) A representative ultrasound image of the scanned region along the nasal-temporal (NT) axis. PPR, ONH, and PPS are manually segmented. (b) Circle fitting of the posterior PPS, posterior PPR, and anterior PPR boundaries. PPR and PPS thicknesses are calculated as the difference in radii between adjacent circles.
Results
Representative ultrasound images of posterior eyes are presented in Fig. 3. The retinal layer had sufficient and consistent ultrasound echogenicity for successful speckle tracking as evidenced by very high correlation coefficients between images at consecutive pressure levels (>0.99). The retina was shown as a distinct layer anterior to the highly echogenic PPS in the high-resolution ultrasound images. The average PPR and PPS thicknesses were 367 ± 35 μm and 1033 ± 183 μm, respectively. PPS thickness was found to be negatively correlated to age (Pearson correlation R = -0.753, p = 0.012), while no association between PPR thickness and age was found (R = 0.269, p = 0.452; see Fig. 4).
Fig. 3.
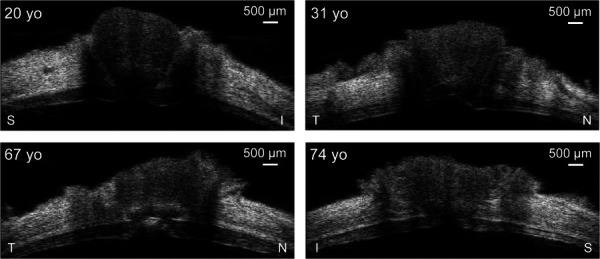
B-mode images of the posterior eye centered at the ONH from four human donors at the reference IOP (5 mmHg) showing the variability of the posterior eye tissue morphology across different age. The imaging axis is labeled for each eye. S: superior, I: inferior, N: nasal, T: temporal.
Fig. 4.

(a) PPR thickness was not correlated with age, while (b) PPS thickness was negatively correlated with age
Representative strain maps depicting regional PPR, PPS, and ONH radial, tangential, and shear strains are shown in Fig. 5. At 30 mmHg, PPR had shear strain of 1.46 ± 0.55% that was significantly greater in magnitude than radial strain (−0.79 ± 0.36%, p = 0.004) and tangential strain (0.40 ± 0.26%, p < 0.001). As shown in Fig. 6(a), PPR had smaller radial strain than either PPS or ONH (−0.79 ± 0.36% versus −2.83 ± 1.03%, p < 0.001; and −0.79 ± 0.36% versus −1.34 ± 0.44%, p = 0.008, respectively), larger shear strain (1.46 ± 0.55% versus 1.05 ± 0.33%, p = 0.043; and 1.46 ± 0.55% versus 0.87 ± 0.42%, p = 0.010, respectively), and similar levels of tangential strain (0.40 ± 0.26% versus 0.46 ± 0.23%, p = 0.575; and 0.40 ± 0.26% versus 0.16 ± 0.53%, p = 0.295). The radial strains of the PPR and PPS regions were strongly correlated (R = 0.751, p = 0.012, Fig. 7(a)) at 30 mmHg. Similarly, the shear strains of the ONH and PPS regions were strongly correlated (R = 0.907, p < 0.001, Fig. 7(b)) at 30 mmHg.
Fig. 5.
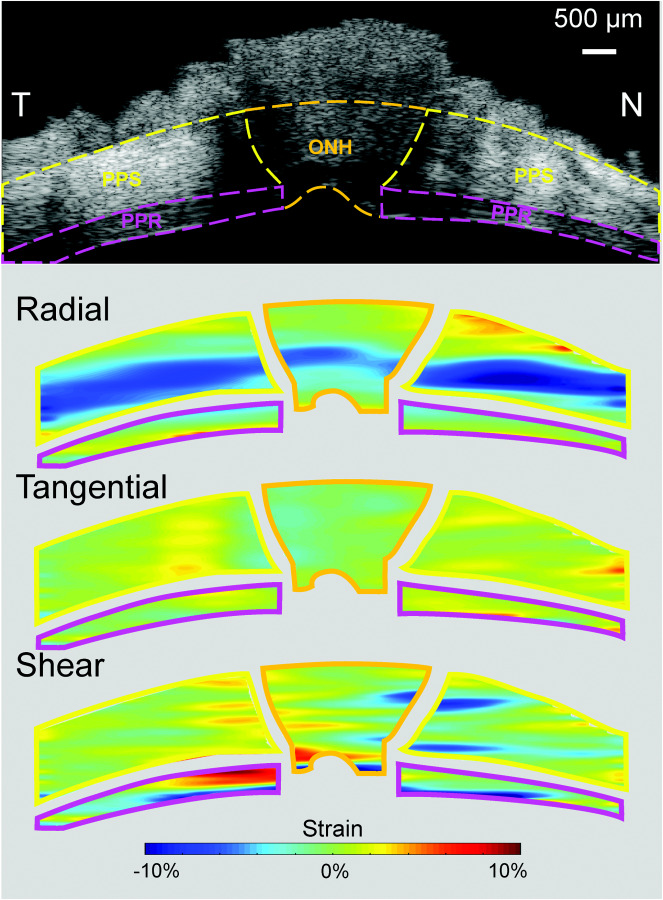
Radial, tangential, and shear strain maps of PPR, ONH, and PPS from a representative eye at 30 mmHg
Fig. 6.
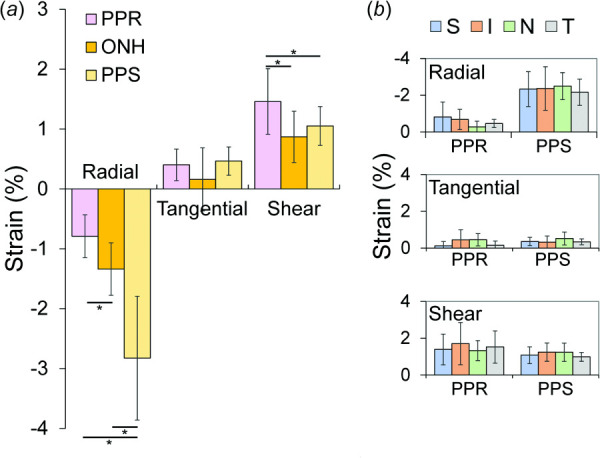
(a) Comparisons of the averaged radial, tangential, and shear strains in PPR, ONH, and PPS regions at 30 mmHg across all donor eyes (n = 10, * denotes p < 0.05). (b) Average strains were not significantly different across different quadrants of the PPR and PPS. S: superior, I: inferior, N: nasal, T: temporal.
Fig. 7.
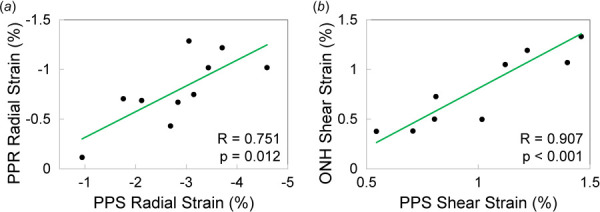
(a) Radial strains in PPR and PPS were correlated at 30 mmHg and (b) shear strains in ONH and PPS were correlated at 30 mmHg
Localized high shear strains were observed in PPR in the region close to the ONH (up to 10%, Fig. 5). In some cases, higher tangential strains were also seen in the same location of high shear, especially along the anterior boundary of the PPR. Exploratory analysis showed no significant differences in strains between quadrants in either PPR or PPS (Fig. 6(b)).
Discussion
In this study, we reported the deformation response of the PPR to IOP elevation measured by high-frequency ultrasound elastography in human donor eyes. Whole eye inflation permitted us to experimentally mimic the physiological loading of IOP and capture the response of the PPR, PPS, and ONH simultaneously. The primary findings of this study include:
Shear was the dominant mode of deformation of the PPR during IOP elevation, as the magnitude of shear strains was significantly larger than the magnitude of radial or tangential strains in PPR;
In comparison to PPS and ONH, PPR experienced significantly greater shear strains but lower radial strains during IOP elevation.
High-frequency ultrasound at 50 MHz provided clear delineation of the PPR as a distinct layer anterior to the PPS in all tested eyes (Fig. 3). PPR and PPS thicknesses estimated from the ultrasound images were consistent with the reported values from in vivo [17] and histology [18] studies, although our values were in general higher than the population average reported previously. This is likely due to the limited sample size in the current study (10 donor eyes). We also explored PPR and PPS correlation with age and found a negative correlation between PPS thickness and age (Fig. 4(b)) but no correlation between PPR thickness and age (Fig. 4(a)). Thinning of the PPS with age was reported in previous studies using ultrasound to measure thickness [13,19]. Another study based on histology analysis reported no significant dependence of scleral thickness on age [18]. For retinal thickness, a previous study using OCT imaging found a small but significant decrease with age at 0.53 μm per year [20]. Our results indicated a slight decreasing trend of PPR thickness with age (Fig. 4(a)), consistent with previous studies. However, this trend did not reach statistical significance, likely due to the limited sample size.
The mechanical deformation of the PPR in response to IOP elevation was quantified and compared to that of PPS and ONH (Fig. 5). The overall negative radial strains in PPR, PPS, and ONH suggest through-thickness compression, as would be expected when inflating a shell or membrane. PPR radial strain was less than 1% at 30 mmHg. This small radial compression was consistent with the findings from a previous in vivo study in nonhuman primates that showed clinically negligible PPR thickness reduction when IOP was elevated from 10 to 45 mmHg and held at 45 mmHg for an hour [21]. PPR radial strain was correlated with that in PPS (Fig. 7(a)), but surprisingly, the collagenous PPS had a much larger radial strain than the neural PPR (Fig. 6). Mechanical testing of porcine and murine retina biopsy punches showed that the unconfined compressive modulus was lower in retina than sclera [9]. It is thus unexpected that the PPR had smaller radial compression than the tougher PPS. The PPS has proteoglycans such as aggrecan [22,23], which has many glycosaminoglycan sidechains whose negative charge and osmotic properties attract water and create a swelling pressure [24]. Aggrecan is the most abundant proteoglycan in cartilage and plays a critical role in cartilage's compressive properties. Aggrecan's role in scleral biomechanics is yet to be elucidated. Our results and others [25] indicate that aggrecan may be important for sclera's hydration and compressive properties under IOP loading. As seen in the strain maps (Fig. 5), high compression (darker blue) was largely observed in the more anterior region of the PPS. This compressive anterior layer may serve as a “cushion” to protect the neural retina during IOP elevation. It is interesting to note that in vertebrate eyes, there is a cartilage layer anterior to the fibrous sclera, which may serve similar biomechanical functions [26]. Future modeling and experimental studies are needed to further elucidate this potential mechanism. It is also noted that the choroid was collapsed in our ex vivo experiments after the preconditioning cycles. The compression in the collapsed choroid may partially but not fully account for the layer of high compression observed in this study.
Shear strains were substantially higher than radial strains in PPR. PPR shear strains were also greater than those in PPS or ONH. ONH and PPS shear strains were strongly correlated, but PPR shear strain was correlated with neither. Despite being a thin layer of tissue, PPR exhibited spatial variations of shear strains across its depth and width as shown in the strain maps (Fig. 5). PPS and ONH shear strains were also localized, mostly at the conjunction between ONH and PPS. The pattern of the shear strains (positive on one side and negative on the other side of ONH, Fig. 5) indicated an outward radial movement of the ONH with respect to the PPS as IOP increased. This was also observed in our previous study, where a detailed discussion was provided [13]. Briefly, the circumferential collagen fiber alignment in the PPS surrounding the scleral canal likely underlies the minimal expansion of the canal but significant outward bending around the material transition border. Localized high tangential strain was also observed in PPR, particularly along the anterior surface of PPR in most eyes. Anatomically the anterior PPR corresponds to the retinal nerve fiber layer consisting of axon fibers. Localized high shear and tangential stretch may contribute to regional susceptibility to IOP-related glaucomatous damage.
This study has a few limitations. First, although the current sample size permitted comparison of different types of strains and regional variations, it was likely not powered to detect quadrant difference. Future studies will expand the sample size to verify the current results and compare quadrant responses. Second, our ex vivo inflation tests do not fully replicate the in vivo condition of the posterior eye, which is subject to several other mechanical loads such as blood pressure, cerebrospinal fluid pressure, and optic nerve tension. IOP's effect in the presence of the other loads may alter, although it has been shown that IOP is the most dominant load [27–30]. Finally, the present study was limited to two-dimensional characterization along two perpendicular planes. A more complete characterization of the PPR will be pursued in the future with our three-dimensional ultrasound elastography technique [12,31,32].
In summary, this study quantified the PPR's mechanical deformation in response to elevated IOP using high-frequency ultrasound elastography. Our results showed that radial compression was small in PPR, but shear was significant and localized, which may be the dominant mode of mechanical insult to this neural/capillary tissue in glaucoma. IOP has been shown to be a primary risk factor in glaucoma, and current therapies aim to reduce IOP. Our findings may provide new insights into the mechanisms of IOP-related mechanical insults to the peripapillary retina and assist future efforts to protect this tissue from glaucomatous damage.
Funding Data
National Institute of Health (NIH) (No. R01EY025358; Funder ID: 10.13039/100000002).
References
- [1]. Campbell, I. C. , Coudrillier, B. , and Ethier, C. R. , 2014, “ Biomechanics of the Posterior Eye: A Critical Role in Health and Disease,” ASME J. Biomech. Eng., 136(2), p. 21005. 10.1115/1.4026286 [DOI] [PubMed] [Google Scholar]
- [2]. Schuman, J. S. , Hee, M. R. , Puliafito, C. A. , Wong, C. , Pedut Kloizman, T. , Lin, C. P. , Hertzmark, E. , Izatt, J. A. , Swanson, E. A. , and Fujimoto, J. G. , 1995, “ Quantification of Nerve Fiber Layer Thickness in Normal and Glaucomatous Eyes Using Optical Coherence Tomography: A Pilot Study,” Arch. Ophthalmol., 113(5), p. 586. 10.1001/archopht.1995.01100050054031 [DOI] [PubMed] [Google Scholar]
- [3]. Liu, L. , Jia, Y. , Takusagawa, H. L. , Pechauer, A. D. , Edmunds, B. , Lombardi, L. , Davis, E. , Morrison, J. C. , and Huang, D. , 2015, “ Optical Coherence Tomography Angiography of the Peripapillary Retina in Glaucoma,” JAMA Ophthalmol., 133(9), p. 1045. 10.1001/jamaophthalmol.2015.2225 [DOI] [PMC free article] [PubMed] [Google Scholar]
- [4]. Wu, W. , Peters, W. H. , and Hammer, M. E. , 1987, “ Basic Mechanical Properties of Retina in Simple Elongation,” ASME J. Biomech. Eng., 109(1), pp. 65–67. 10.1115/1.3138644 [DOI] [PubMed] [Google Scholar]
- [5]. Wollensak, G. , and Spoerl, E. , 2004, “ Biomechanical Characteristics of Retina,” Retina, 24(6), pp. 967–970. 10.1097/00006982-200412000-00021 [DOI] [PubMed] [Google Scholar]
- [6]. Chen, K. , and Weiland, J. D. , 2010, “ Anisotropic and Inhomogeneous Mechanical Characteristics of the Retina,” J. Biomech., 43(7), pp. 1417–1421. 10.1016/j.jbiomech.2009.09.056 [DOI] [PubMed] [Google Scholar]
- [7]. Chen, K. , and Weiland, J. D. , 2012, “ Mechanical Characteristics of the Porcine Retina in Low Temperatures,” Retina, 32(4), pp. 844–847. 10.1097/IAE.0b013e318225d0c9 [DOI] [PubMed] [Google Scholar]
- [8]. Chen, K. , and Weiland, J. D. , 2014, “ Discovery of Retinal Elastin and Its Possible Role in Age-Related Macular Degeneration,” Ann. Biomed. Eng., 42(3), pp. 678–684. 10.1007/s10439-013-0936-x [DOI] [PubMed] [Google Scholar]
- [9]. Worthington, K. S. , Wiley, L. A. , Bartlett, A. M. , Stone, E. M. , Mullins, R. F. , Salem, A. K. , Guymon, C. A. , and Tucker, B. A. , 2014, “ Mechanical Properties of Murine and Porcine Ocular Tissues in Compression,” Exp. Eye Res., 121, pp. 194–199. 10.1016/j.exer.2014.02.020 [DOI] [PMC free article] [PubMed] [Google Scholar]
- [10]. Qu, Y. , He, Y. , Saidi, A. , Xin, Y. , Zhou, Y. , Zhu, J. , Ma, T. , Silverman, R. H. , Minckler, D. S. , Zhou, Q. , and Chen, Z. , 2018, “ In Vivo Elasticity Mapping of Posterior Ocular Layers Using Acoustic Radiation Force Optical Coherence Elastography,” Investig. Ophthalmol. Visual Sci., 59(1), pp. 455–461. 10.1167/iovs.17-22971 [DOI] [PMC free article] [PubMed] [Google Scholar]
- [11]. Tang, J. , and Liu, J. , 2012, “ Ultrasonic Measurement of Scleral Cross-Sectional Strains During Elevations of Intraocular Pressure: Method Validation and Initial Results in Posterior Porcine Sclera,” ASME J. Biomech. Eng., 134(9), p. 091007. 10.1115/1.4007365 [DOI] [PMC free article] [PubMed] [Google Scholar]
- [12]. Cruz Perez, B. , Pavlatos, E. , Morris, H. J. , Chen, H. , Pan, X. , Hart, R. T. , and Liu, J. , 2016, “ Mapping 3D Strains With Ultrasound Speckle Tracking: Method Validation and Initial Results in Porcine Scleral Inflation,” Ann. Biomed. Eng., 44(7), pp. 2302–2312. 10.1007/s10439-015-1506-1 [DOI] [PMC free article] [PubMed] [Google Scholar]
- [13]. Ma, Y. , Pavlatos, E. , Clayson, K. , Pan, X. , Kwok, S. , Sandwisch, T. , and Liu, J. , 2019, “ Mechanical Deformation of Human Optic Nerve Head and Peripapillary Tissue in Response to Acute IOP Elevation,” Investig. Ophthalmol. Visual Sci., 60(4), pp. 913–920. 10.1167/iovs.18-26071 [DOI] [PMC free article] [PubMed] [Google Scholar]
- [14]. Ma, Y. , Kwok, S. , Sun, J. , Pan, X. , Pavlatos, E. , Clayson, K. , Hazen, N. , and Liu, J. , 2020, “ IOP-Induced Regional Displacements in the Optic Nerve Head and Correlation With Peripapillary Sclera Thickness,” Exp. Eye Res., 200, p. 108202. 10.1016/j.exer.2020.108202 [DOI] [PMC free article] [PubMed] [Google Scholar]
- [15]. Pavlatos, E. , Chen, H. , Clayson, K. , Pan, X. , and Liu, J. , 2018, “ Imaging Corneal Biomechanical Responses to Ocular Pulse Using High-Frequency Ultrasound,” IEEE Trans. Med. Imag., 37(2), pp. 663–670. 10.1109/TMI.2017.2775146 [DOI] [PMC free article] [PubMed] [Google Scholar]
- [16]. Kallel, F. , and Ophir, J. , 1997, “ A Least-Squares Strain Estimator for Elastography,” Ultrason. Imag., 19(3), pp. 195–208. 10.1177/016173469701900303 [DOI] [PubMed] [Google Scholar]
- [17]. Myers, C. E. , Klein, B. E. K. , Meuer, S. M. , Swift, M. K. , Chandler, C. S. , Huang, Y. , Gangaputra, S. , Pak, J. W. , Danis, R. P. , and Klein, R. , 2015, “ Retinal Thickness Measured by Spectral-Domain Optical Coherence Tomography in Eyes Without Retinal Abnormalities: The Beaver Dam Eye Study,” Am. J. Ophthalmol., 159(3), pp. 445–456.e1. 10.1016/j.ajo.2014.11.025 [DOI] [PMC free article] [PubMed] [Google Scholar]
- [18]. Vurgese, S. , Panda-Jonas, S. , and Jonas, J. B. , 2012, “ Scleral Thickness in Human Eyes,” PLoS ONE, 7(1), p. e29692. 10.1371/journal.pone.0029692 [DOI] [PMC free article] [PubMed] [Google Scholar]
- [19]. Coudrillier, B. , Tian, J. , Alexander, S. , Myers, K. M. , Quigley, H. A. , and Nguyen, T. D. , 2012, “ Biomechanics of the Human Posterior Sclera: Age- and Glaucoma-Related Changes Measured Using Inflation Testing,” Investig. Ophthalmol. Visual Sci., 53(4), pp. 1714–1728. 10.1167/iovs.11-8009 [DOI] [PMC free article] [PubMed] [Google Scholar]
- [20]. Alamouti, B. , and Funk, J. , 2003, “ Retinal Thickness Decreases With Age: An OCT Study,” Br. J. Ophthalmol., 87(7), pp. 899–901. 10.1136/bjo.87.7.899 [DOI] [PMC free article] [PubMed] [Google Scholar]
- [21]. Fortune, B. , Yang, H. , Strouthidis, N. G. , Cull, G. A. , Grimm, J. L. , Downs, J. C. , and Burgoyne, C. F. , 2009, “ The Effect of Acute Intraocular Pressure Elevation on Peripapillary Retinal Thickness, Retinal Nerve Fiber Layer Thickness, and Retardance,” Investig. Ophthalmol. Visual Sci., 50(10), pp. 4719–4726. 10.1167/iovs.08-3289 [DOI] [PMC free article] [PubMed] [Google Scholar]
- [22]. Rada, J. A. , Achen, V. R. , Perry, C. A. , and Fox, P. W. , 1997, “ Proteoglycans in the Human Sclera. Evidence for the Presence of Aggrecan,” Investig. Ophthalmol. Visual Sci., 38(9), pp. 1740–1751.https://pubmed.ncbi.nlm.nih.gov/9286262/#:~:text=Conclusions%3A%20The%20adult%20human%20sclera,and%20condition%20of%20the%20sclera. [PubMed] [Google Scholar]
- [23]. Rada, J. A. , Achen, V. R. , Penugonda, S. , Schmidt, R. W. , and Mount, B. A. , 2000, “ Proteoglycan Composition in the Human Sclera During Growth and Aging,” Investig. Ophthalmol. Visual Sci., 41(7), pp. 1639–1648.https://pubmed.ncbi.nlm.nih.gov/10845580/#:~:text=Results%3A%20Human%20scleral%20proteoglycans%20were,small%20proteoglycans%20biglycan%20and%20decorin [PubMed] [Google Scholar]
- [24]. Yanagishita, M. , 1993, “ Function of Proteoglycans in the Extracellular Matrix,” Pathol. Int., 43(6), pp. 283–293. 10.1111/j.1440-1827.1993.tb02569.x [DOI] [PubMed] [Google Scholar]
- [25]. Pachenari, M. , and Hatami-Marbini, H. , 2021, “ Regional Differences in the Glycosaminoglycan Role in Porcine Scleral Hydration and Mechanical Behavior,” Investig. Ophthalmol. Visual Sci., 62(3), p. 28. 10.1167/iovs.62.3.28 [DOI] [PMC free article] [PubMed] [Google Scholar]
- [26]. Franz-Odendaal, T. A. , and Vickaryous, M. K. , 2006, “ Skeletal Elements in the Vertebrate Eye and Adnexa: Morphological and Developmental Perspectives,” Dev. Dyn., 235(5), pp. 1244–1255. 10.1002/dvdy.20718 [DOI] [PubMed] [Google Scholar]
- [27]. Sigal, I. A. , Flanagan, J. G. , and Ethier, C. R. , 2005, “ Factors Influencing Optic Nerve Head Biomechanics,” Investig. Ophthalmol. Visual Sci., 46(11), pp. 4189–4199. 10.1167/iovs.05-0541 [DOI] [PubMed] [Google Scholar]
- [28]. Hua, Y. , Voorhees, A. P. , and Sigal, I. A. , 2018, “ Cerebrospinal Fluid Pressure: Revisiting Factors Influencing Optic Nerve Head Biomechanics,” Investig. Ophthalmol. Visual Sci., 59(1), pp. 154–165. 10.1167/iovs.17-22488 [DOI] [PMC free article] [PubMed] [Google Scholar]
- [29]. Feola, A. J. , Myers, J. G. , Raykin, J. , Mulugeta, L. , Nelson, E. S. , Samuels, B. C. , and Ethier, C. R. , 2016, “ Finite Element Modeling of Factors Influencing Optic Nerve Head Deformation Due to Intracranial Pressure,” Investig. Ophthalmol. Visual Sci., 57(4), pp. 1901–1911. 10.1167/iovs.15-17573 [DOI] [PubMed] [Google Scholar]
- [30]. Wang, X. , Fisher, L. K. , Milea, D. , Jonas, J. B. , and Girard, M. J. A. , 2017, “ Predictions of Optic Nerve Traction Forces and Peripapillary Tissue Stresses Following Horizontal Eye Movements,” Investig. Ophthalmol. Visual Sci., 58(4), pp. 2044–2053. 10.1167/iovs.16-21319 [DOI] [PubMed] [Google Scholar]
- [31]. Pavlatos, E. , Perez, B. C. , Morris, H. J. , Chen, H. , Palko, J. R. , Pan, X. , Weber, P. A. , Hart, R. T. , and Liu, J. , 2016, “ Three-Dimensional Strains in Human Posterior Sclera Using Ultrasound Speckle Tracking,” ASME J. Biomech. Eng., 138(2), pp. 2101–2109. 10.1115/1.4032124 [DOI] [PMC free article] [PubMed] [Google Scholar]
- [32]. Ma, Y. , Pavlatos, E. , Clayson, K. , Kwok, S. , Pan, X. , and Liu, J. , 2020, “ Three-Dimensional Inflation Response of Porcine Optic Nerve Head Using High-Frequency Ultrasound Elastography,” ASME J. Biomech. Eng., 142(5), pp. 1–7. 10.1115/1.4045503 [DOI] [PMC free article] [PubMed] [Google Scholar]


