Abstract
Acid phosphatase is believed to be important for phosphorus scavenging and remobilization in plants, but its role in plant adaptation to low phosphorus availability has not been critically evaluated. To address this issue, we compared acid phosphatase activity (APA) in leaves of common bean (Phaseolus vulgaris) in a phosphorus-inefficient genotype (DOR364), a phosphorus-efficient genotype (G19833), and their F5.10 recombinant inbred lines (RILs). Phosphorus deficiency substantially increased leaf APA, but APA was much higher and more responsive to phosphorus availability in DOR364 than in G19833. Leaf APA segregated in the RILs, with two discrete groups having either high (mean = 1.71 μmol/mg protein/min) or low (0.36 μmol/mg protein/min) activity. A chi-square test indicated that the observed difference might be controlled by a single gene. Non-denaturing protein electrophoresis revealed that there are four visible isoforms responsible for total APA in common bean, and that the difference in APA between contrasting genotypes could be attributed to the existence of a single major isoform. Qualitative mapping of the APA trait and quantitative trait loci analysis with molecular markers indicated that a major gene contributing to APA is located on linkage group B03 of the unified common bean map. This locus was not associated with loci conferring phosphorus acquisition efficiency or phosphorus use efficiency. RILs contrasting for APA had similar phosphorus pools in old and young leaves under phosphorus stress, arguing against a role for APA in phosphorus remobilization. Our results do not support a major role for leaf APA induction in regulating plant adaptation to phosphorus deficiency.
In natural ecosystems, phosphorus availability is seldom optimal for plant growth because of limited phosphorus content in minerals, chemical and biological reactions that limit phosphorus bioavailability in soils, and the fact that the phosphorus cycle is open ended and tends toward depletion (Sample et al., 1980; Stevenson 1986). Plants exhibit inter- and intraspecific variation in their ability to grow or yield at suboptimal phosphorus supply, or “phosphorus efficiency” (Clark and Duncan, 1991; Lynch and Beebe, 1995; Lynch, 1998). Phosphorus efficiency comprises acquisition efficiency, or superior ability to acquire phosphorus from the environment, and phosphorus use efficiency (PUE), or superior ability to convert phosphorus into biomass or yield once it is acquired (Gerloff and Gabelman, 1983). Phosphorus acquisition efficiency (PAE) may be achieved through efficient root morphology and root architecture (Gardner et al., 1981; Barber, 1995; Lynch 1995) and specific phosphorus-mobilizing root exudates (Marschner et al., 1987; Ae et al., 1990; Hoffland et al., 1992), whereas mechanisms for enhanced PUE include reduced tissue phosphorus requirement (Fawole et al., 1982; Halsted and Lynch, 1996) and efficient phosphorus remobilization from senescent or nonproductive tissues to growing or productive tissues (Smith et al., 1990; Snapp and Lynch, 1996).
Acid phosphatase (APase) is believed to be important for many physiological processes, including regulation of phosphorus efficiency (Bieleski, 1973; Duff et al., 1994). Exuded and internal APase activity (APA) change in response to phosphorus availability. Low phosphorus availability increases APase secretion to the rhizosphere in a number of plant species, including maize (Zea mays; Clark, 1975), tomato (Lycopersicon esculentum; Goldstein et al., 1988a, 1988b), wheat (Triticum aestivum) and clover (Trifolium spp.; Tarafdar and Jungk, 1987), lupin (Lupinus spp.), rice (Oryza sativa), and soybean (Glycine max; Tadano et al., 1993). Secretion of APase under phosphorus stress has been speculated to liberate phosphorus from organic sources in the soil (Tarafdar and Claassen, 1988). A positive relation was reported between root APA and phosphorus uptake from inositol hexaphosphate in bean (Helal, 1990) and barley (Hordeum vulgare; Asmar et al., 1995). However, a negative relationship was also observed between root APA and phosphorus uptake by wheat under low phosphorus stress (McLachlan, 1980). A recent study found no significant difference in root surface APA between white clover genotypes with contrasting phosphorus efficiency (Hunter and McManus, 1999). Therefore, the role of secreted APase in plant adaptation to low phosphorus availability is unclear.
APA may also be related to PUE in the shoot. APase participates in various metabolic processes in plants, and in particular is capable of hydrolyzing orthophosphate monoesters into more mobile orthophosphate anions (Pi; Vincent et al., 1992); therefore, APA in leaf tissues is believed to be related to PUE (Duff et al., 1994). Under phosphorus-limiting conditions, plants are able to remobilize Pi from metabolically less active sites such as old leaves and vacuoles (Schachtman et al., 1998). Furthermore, considering leaf senescence is often accelerated under phosphorus stress (Snapp and Lynch, 1996), it is reasonable to assume that increased APA may be involved in phosphorus remobilization from old leaves to young tissues. However, it has been demonstrated that increased APA in leaves is often associated with the severity of phosphorus deficiency symptoms in the plant (McLachlan et al., 1987); thus, it remains unclear if enhanced APA is a mechanism of phosphorus efficiency or merely an indication of phosphorus deficiency. Because there is generally an inverse relationship between leaf APA and phosphorus concentration in some plants, it has been suggested that leaf APA could be used as a diagnostic criterion for phosphorus deficiency (Besford, 1980; McLachlan et al., 1987).
Common bean (Phaseolus vulgaris) is the most important food legume on earth (Food and Agriculture Organization, 1991). Common bean originated and was domesticated in two primary centers of diversity: Middle America and the Andes (Gepts and Debouck, 1991). Previous studies indicated that some bean genotypes of Andean origin have superior phosphorus efficiency (Yan et al., 1995a, 1995b; Beebe et al., 1997). In the present paper, we compared a phosphorus-inefficient genotype of Mesoamerican origin, DOR364, and a contrasting phosphorus-efficient genotype of Andean origin, G19833, together with recombinant inbred lines (RILs) derived from a cross between them. The objective of this study was to critically evaluate the relationship of tissue APA to phosphorus efficiency, employing bean genotypes that contrast in phosphorus efficiency and also tissue APA.
RESULTS
Genetic Variability for APA
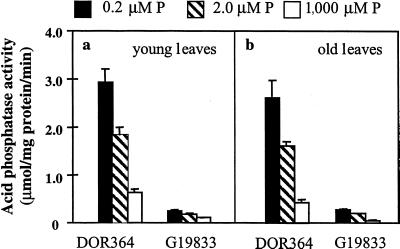
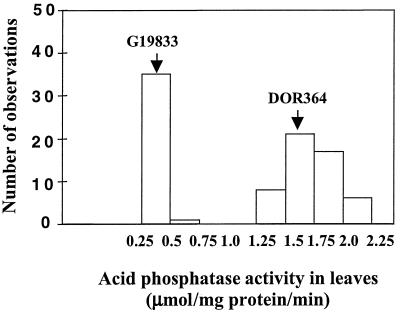
Low phosphorus availability increased leaf APA, especially in DOR364 (Fig. 1). Total leaf APA was much greater in DOR364 than in G19833. Leaf age had no effect on total leaf APA. There was a bimodal segregation of APA in the RILs, with two discrete groups having either high (mean = 1.71 μmol/mg protein/min, resembling that of parent DOR364) or low (mean = 0.36 μmol/mg protein/min, resembling that of parent G19833) APA (Fig. 2). The average difference between the two groups was about 1.5 μmol/mg protein/min. A chi-square test showed that the segregation fits a 1:1 ratio (P < 0.05), which agrees with the hypothesis that the observed difference might be due to a single gene.
Figure 1.
APA in leaves of common bean genotypes DOR364 (phosphorus inefficient) and G19833 (phosphorus efficient) as affected by phosphorus availability. Young leaves (a) were fully expanded trifoliates sampled at 10 d after transplanting and old leaves (b) were at the same stem position sampled 24 d after transplanting. Each bar represents the mean and se of four replicates. ANOVA showed that the effects of genotype, phosphorus availability, and the interaction of genotype and phosphorus availability were all highly significant at P < 0.001, but that leaf age did not affect APA.
Figure 2.
Frequency distribution for APA in RILs derived from the cross between DOR364 and G19833. The plants were grown hydroponically at low phosphorus (2 μm phosphorus) for 14 d. APA was determined with ρ-nitrophenyl phosphate as the substrate. F values of genotype effect from ANOVA (all RILs): 26 (P < 0.001), low APA group 2.3 (P < 0.01); and high APA group 1.4 (NS).
Enzymatic and Molecular Aspects of APA
APase Isoforms
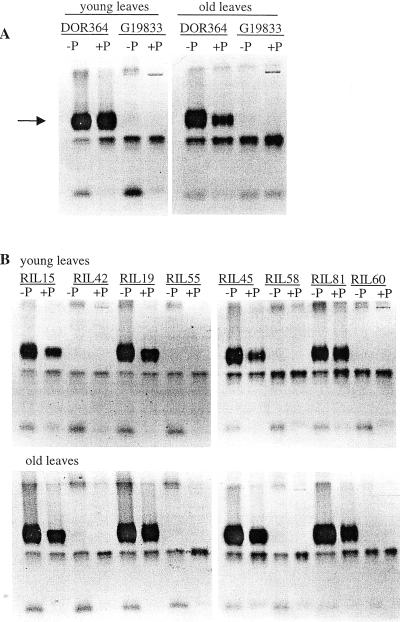
In non-denaturing polyacrylamide gels, at least four isoforms were detected for both parents (Fig. 3A). Three of the four isoforms were induced by phosphorus stress, but the activity of the principal isoform in DOR364 was entirely missing in G19833. This is consistent with the bulk leaf APA measurement where G19833 had much lower APA than DOR364 (Fig. 1). Eight RILs representing either high or low leaf APA were selected for isoform analysis. The isoformic pattern of the two groups resembled that of the parents (Fig. 3B). There was also good consistency between bulk leaf APA and isoform expression. RILs with a low leaf APA corresponded to RILs lacking the major isoform. As the leaves aged, the isoformic pattern of APA was basically unchanged, although older leaves with the primary APA isoform from DOR364 tended to have more activity of this isoform at high phosphorus, possibly related to senescence processes.
Figure 3.
APase isoforms in leaves of parental genotypes (A) and selected RILs (B) grown with low (2 μm) and high (1,000 μm) phosphorus availability for 10 or 24 d. Leaves were sampled at the same stem position at the two harvests, meaning that leaves sampled at 10 d after transplanting were at the beginning of their lives, whereas leaves sampled at 24 d had begun senescence. The isoforms were visualized in non-denaturing polyacrylamide gel with β-naphthyl acid phosphate as the substrate. Note that a major inducible band (arrow) is missing from G19833, the phosphorus-efficient genotype, and some RILs. RILs with a low leaf APA corresponded to RILs lacking the major inducible isoform.
Genetic Analysis of APA
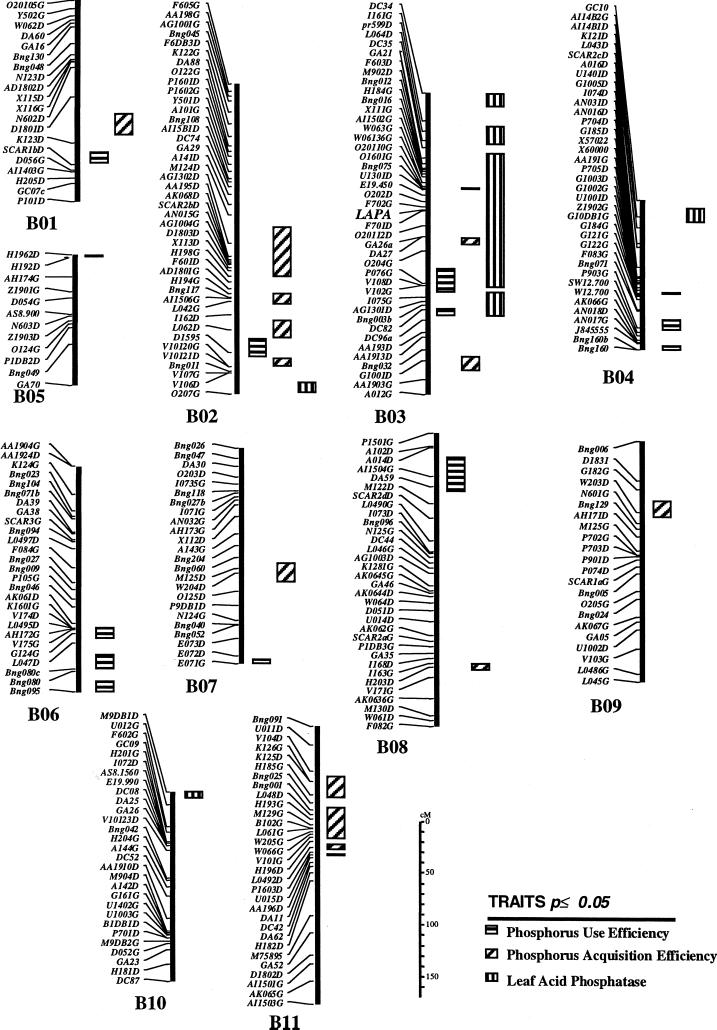
When the locus explaining the bimodal distribution of leaf APA was mapped as a qualitative marker, it fell on linkage group B03, between RFLP Bng075 and Bng003b, about 20 cM from Bng075. This locus is identified as LAPA (Fig. 4). When leaf APA was analyzed by QTL analysis (omitting the qualitative marker from the analysis), a positive response was detected over a long segment of B03 (Fig. 4). However, a very sharp peak was observed that coincided with the same qualitative locus (Fig. 5). A random-amplified polymorphic DNA marker, F701D, was mapped very close to the locus and explained 75.5% of the variability in APA activity in the regression analysis. Thus, mapping as either a qualitative trait or as a quantitative trait produced the same results that were consistent with the Mendelian interpretation of a single major gene. Another three putative minor loci were detected on linkage groups B02, B04, and B10. However, when the respective markers were analyzed by multiple regression together with F701D on B03, variability explained was 76%, which was the same as that explained by F701D alone. Thus, the additional loci did not improve the explanation of variability. Because these QTL were detected at P = 0.05, they may have been false positives. The additive effects were estimated and the results indicate that effects contributing to higher APA come from the parent DOR364 (data not shown).
Figure 4.
Linkage map of quantitative trait loci (QTLs) showing QTLs conferring APA (vertical bars), PAE (slanted bars), and PUE (horizontal bar). Symbols on the left are molecular markers. The qualitative locus for leaf APA is identified as LAPA. See text for detailed description.
Figure 5.
Log of likelihood ratio (LOD) scores for QTL on linkage group B03, APA (solid line), PAE (diamonds), and PUE (triangles).
Relationship between APA and Phosphorus Efficiency
Genetic Variation for PAE and PUE and Their Relationship to APA
The phosphorus-efficient genotype G19833 had significantly higher shoot and root dry weight than DOR364, especially in the low-phosphorus treatments (Table I). The phosphorus-inefficient parent DOR364 had higher phosphorus concentration at low phosphorus availability but lower phosphorus concentration at high phosphorus availability than G19833. The parents had similar root phosphorus concentration. In the RILs, there was continuous variation for plant dry weight and phosphorus concentrations, showing a quantitative pattern of inheritance for these two traits (data not shown).
Table I.
Growth and plant phosphorus concentration of DOR364 (phosphorus inefficient) and G19833 (phosphorus efficient) grown with varying phosphorus availability
| Phosphorus Treatment | Dry
Wt
|
Phosphorus Concentration
|
||||||
|---|---|---|---|---|---|---|---|---|
| Shoot
|
Root
|
Shoot
|
Root
|
|||||
| DOR364 | G19833 | DOR364 | G19833 | DOR364 | G19833 | DOR364 | G19833 | |
| g plant−1 | mg phosphorus g DW−1 | |||||||
| 0.2 μm Phosphorusa | 0.30 (0.02) | 0.85 (0.05) | 0.09 (0.01) | 0.23 (0.01) | 0.99 (0.12) | 0.80 (0.08) | 0.33 (0.10) | 0.41 (0.08) |
| 2 μm P | 0.49 (0.04) | 1.12 (0.09) | 0.14 (0.02) | 0.28 (0.02) | 1.30 (0.31) | 1.01 (0.09) | 0.41 (0.24) | 0.51 (0.02) |
| 1,000 μm P | 1.63 (0.19) | 1.98 (0.15) | 0.17 (0.02) | 0.25 (0.01) | 8.76 (0.30) | 10.28 (0.33) | 3.00 (0.72) | 2.42 (0.10) |
| F values of ANOVA | ||||||||
| P level | 47 (p < 0.001) | 5.4 (p < 0.05) | 883 (p < 0.001) | 35 (p < 0.01) | ||||
| Genotype | 87 (p < 0.001) | 129 (p < 0.001) | 3.3 (p < 0.05) | 0.2 (NS)b | ||||
| Phosphorus × genotype | 3.5 (p < 0.05) | 0.05 (NS) | 9.5 (p < 0.01) | 0.7 (NS) | ||||
Plants were grown for 21 d after transplanting into solutions at the indicated availability of phosphorus. Values are mean and se (in parentheses) of three replicates.
NS, Not significant.
PAE and PUE were calculated for the parents and RILs (Table II). The phosphorus-efficient genotype G19833 had almost twice the PAE of DOR364 in the low-phosphorus treatments. At high phosphorus, the difference in PAE diminished. There was no significant difference in PUE between the two parents. There was no significant correlation of APA with either PAE or PUE (Table II). The lack of relationship between APA and PAE or PUE was confirmed by the results from QTL analysis. Several QTLs were identified at P = 0.05 for PAE and PUE in all linkage groups (Fig. 4). However, none of these loci coincided with either the major APA locus in linkage group B03 or with the putative minor loci in B02, B04, or B10. An apparent overlap of QTLs for PUE, PAE, and APA is observed on B03 (Fig. 4) but this is an artifact of the effect of the major locus that is detected at some distance from the locus per se. QTLs were also sought for PAE and PUE with data from two field trials, one at high phosphorus and another at low phosphorus, and the APA loci were not associated with PAE or PUE in these trials either (S.E. Beebe, D. Beck, and F. Muñoz, unpublished data).
Table II.
PAE and PUE of DOR364 (phosphorus inefficient) and G19833 (phosphorus efficient) and their correlation coefficients with leaf APA
| Phosphorus Treatment | PAE
|
PUE
|
||||
|---|---|---|---|---|---|---|
| DOR364 | G19833 | RILs | DOR364 | G19833 | RILs | |
| mg phosphorus plant−1 | g dry wt mg phosphorus−1 | |||||
| 0.2 μm Phosphorusa | 0.30 (0.05) | 0.69 (0.09) | – | 1.05 (0.15) | 1.27 (0.13) | – |
| 2 μm Phosphorus | 0.62 (0.09) | 1.15 (0.18) | 0.74 (0.23) | 0.85 (0.16) | 1.01 (0.10) | 1.03 (0.20) |
| 1,000 μm Phosphorus | 14.23 (1.67) | 20.33 (1.33) | – | 0.12 (0.00) | 0.10 (0.00) | – |
| F values of ANOVA for parents | ||||||
| Phosphorus level | 239 (p < 0.001) | 49 (p < 0.001) | ||||
| Genotype | 11 (p < 0.01) | 1.8 (NS)b | ||||
| Phosphorus × genotype | 6.9 (p < 0.01) | 0.6 (NS) | ||||
| Correlation coefficient (r) with APAc | −0.1538 (NS) | −0.0885 (NS) | ||||
Plants were grown for 21 d after transplanting into nutrient solutions with the indicated availability of phosphorus. Values are mean and se (in parentheses) of three replicates.
NS, Not significant.
The total no. of observations (parents and RILs) is 88.
Relationship between APA and Phosphorus Remobilization
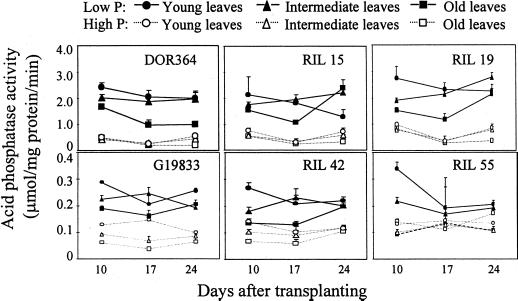
Changes in APA and phosphorus concentration were determined in old, intermediate, and young leaves of DOR364, G19833, and selected RILs (Figs. 6 and 7). For a given genotype, APA was greatest in the young leaves and least in the old leaves, regardless of phosphorus treatment. Under low phosphorus conditions, there was a tendency for APA to decrease as leaves senesced, especially for the primary (old) leaves. The primary leaves of all the genotypes were completely senescent and had fallen off in the low phosphorus treatment, resulting in zero APA. Although the absolute values of APA were different, the general pattern of APA was similar among all the genotypes (Fig. 6).
Figure 6.
Chronological changes in APA in young (the first half-expanded trifoliate from the apical meristem), intermediate (fully expanded trifoliates), and old leaf (primary leaf) tissues of the two parental genotypes and related RILs. Plants were grown in nutrient solutions with low (2 μm) and high (1,000 μm) phosphorus availability. Each point represents the mean and se of three replicates. Note that the scale of the figures is different between the upper and lower groups. F values from ANOVA: genotype 479 (P < 0.001), phosphorus level 73 (P < 0.001), leaf type 30 (P < 0.001), harvest 14 (P < 0.001), and genotype × phosphorus level × leaf type 5.6 (P < 0.001).
Figure 7.
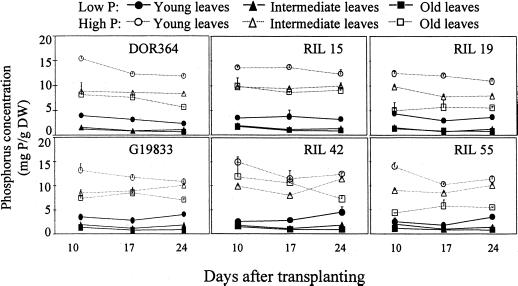
Chronological changes in phosphorus concentration in young (the first half-expanded trifoliate from the apical meristem), intermediate (fully expanded trifoliates), and old (primary leaf) leaf tissues of the two parental genotypes and related RILs. Plants were grown in nutrient solutions with low (2 μm) and high (1,000 μm) phosphorus availability. Each point represents the mean and se of three replicates. F values from ANOVA: genotype 506 (P < 0.001), phosphorus level 21 (P < 0.001), leaf type 202 (P < 0.001), harvest 0.22 (NS), and genotype × phosphorus level × leaf type 3.3 (P < 0.001).
Phosphorus concentration was also greatest in the young leaves and least in the old leaves (Fig. 7). It is interesting that phosphorus concentration was relatively stable in a given leaf tissue and not affected by leaf senescence. In general, there was no apparent difference in phosphorus status between genotypes with contrasting leaf APA; hence, leaf APA did not appear to be related to phosphorus remobilization in the plant.
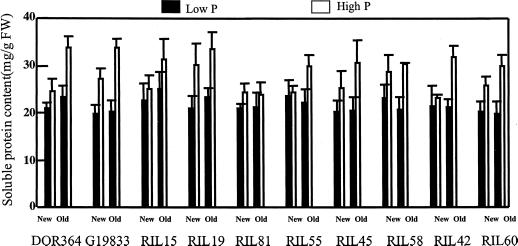
Leaf soluble protein concentration was reduced by low phosphorus availability, especially in old leaves, but was not influenced by genotype (Fig. 8). Therefore, the expression of leaf APA on a soluble protein basis or a biomass basis does not alter our principal conclusions about the role of leaf APA in genotypic differences in phosphorus efficiency.
Figure 8.
Soluble protein content of leaves of common bean genotypes at low and high phosphorus availability. Plants were grown hydroponically at low (2 μm) and high (1,000 μm) phosphorus availability for 10 or 24 d. Leaves were sampled at the same stem position at the two harvests, meaning that leaves sampled at 10 d after transplanting were at the beginning of their lives, whereas leaves sampled at 24 d had begun senescence. Each point represents the mean and se of three replicates. F values from ANOVA: genotype 0.8 (NS), phosphorus level 59 (P < 0.0001), leaf age 8.9 (P = 0.0037), and genotype × phosphorus level 0.74 (NS).
DISCUSSION
APases in plants are a class of enzymes that display considerable heterogeneity with regard to their kinetics and functions (Duff et al., 1994). This complexity may contribute to conflicting reports in the literature regarding the role of APA in phosphorus nutrition, depending on the plant species used and the experimental conditions under which the enzyme was measured (Clark, 1975; McLachlan, 1980; Tarafdar and Jungk, 1987; Goldstein et al., 1988a, 1988b; Tadano et al., 1993; Asmar et al., 1995). Even within a plant species, discrepancy might exist due to different genetic materials employed (Helal, 1990; Fernandez and Ascencio, 1994). Therefore, to understand how APA relates to plant response to phosphorus stress, it is desirable to have plant materials similar in general characteristics but contrasting specifically in APA. In the present study, we employed two common bean genotypes that contrast in phosphorus efficiency and APA, and RILs descending from them. The RILs are especially useful genetic tools because they segregate for APA and for other traits, thus permitting observations about cosegregation of genes for traits of interest, and about relationships among those traits, in genotypes with a common genetic background.
We used both a chemical assay (ρ-nitrophenyl phosphate method) and isoform electrophoresis (non-denaturing polyacrylamide gel/β-naphthyl acid phosphate method) to determine APA in the parents and RILs. The substrate ρ-nitrophenyl phosphate is soluble and does not detect isoform bands in gels. Therefore, we used the substrate β-naphthyl acid phosphate coupled with Fast Black K salt to visualize APase isoforms. Although there may be some difference in substrate specificity, the parent and RILs with reduced ρ-nitrophenyl phosphate activity corresponded directly with the parent and RILs with reduced activity of one leaf isoform detected with β-naphthyl acid phosphate. The isoform electrophoresis analysis revealed that there are at least four isoforms responsible for the APA in the leaves. This multi-band pattern of APA is in accordance with the results from other plants, such as wheat (Guthrie et al., 1991), Arabidopsis (Trull et al., 1997), and white clover (Hunter and McManus, 1999). All these isoforms together might account for the total APA in the leaves. Of the four isoforms detected, three are inducible by the low phosphorus treatment (Fig. 3). In DOR364 and its related RILs, one of these isoforms has higher activity under both high and low phosphorus treatments than the corresponding isoform in G19833. G19833 and its related RILs have substantially lower APA than DOR364. We conclude that the difference in total APA between the two groups of genotypes may be attributed to the activity of this isoform. The above results indicate that although APase isoforms and total leaf APA differ between DOR364 and G19833 and among the RILs, it does not appear to be related to phosphorus efficiency. This conclusion is supported by the lack of significant correlation between APA, PAE, and PUE (Table III). Furthermore, results from molecular mapping show that none of the QTLs conferring PAE and PUE are associated with those conferring APA (Fig. 4), suggesting that these traits are independent.
Although the relationship between APA and PAE or PUE is not reflected at the whole plant level, it is possible that APA may contribute to phosphorus remobilization on an individual leaf basis. It has been suggested that phosphorus remobilization from metabolically less active mature or senescent leaves to young or developing leaves is an important determinant of phosphorus efficiency (Smith et al., 1990). In fact, substantial remobilization of phosphorus from leaves and stems to reproductive tissues has been observed late in ontogeny in many plant species, including wheat (Frank et al., 1989), soybean (Hanway and Weber, 1971), and common bean (Snapp and Lynch, 1996). However, relatively less information is available for phosphorus remobilization at early growth stages and its relation to APA. To test whether plants with different leaf APA have different abilities to remobilize phosphorus from older leaves, we monitored chronological changes in APA and phosphorus pools in old, intermediate, and young leaves of DOR364, G19833, and selected RILs with contrasting APA. Our results did not indicate any relationship between APA and phosphorus status in different leaves (Figs. 6 and 7), suggesting that leaf APA is not related to net phosphorus remobilization in these genotypes.
In conclusion, our results do not support a major role for leaf APA as an adaptive response to low phosphorus availability in common bean. Despite theoretical justification for such a role, and the fact that it is generally up-regulated in phosphorus-deficient plants, comparison of RILs segregating for APA showed no relationship of APA and PAE or PUE. Does APase have some importance that we could not discern under our experimental conditions, or is its regulation by phosphorus availability merely an evolutionary relic from microbial phosphorus response systems (Tarafdar and Claassen, 1988)? These questions remain unanswered and deserve further investigation.
MATERIALS AND METHODS
Plant Material
Two genotypes contrasting in vegetative and grain yield under phosphorus-deficient conditions were used: DOR364 and G19833. DOR364 pertains to race M of the Mesoamerican gene pool (Singh et al., 1991), and is a high-yielding bred cultivar developed in Central America. During its development, DOR364 was selected under relatively fertile conditions. Under severely phosphorus-limiting conditions, DOR364 yields poorly (Centro Internacional de Agricultura Tropical [CIAT], 1996). G19833 is a Peruvian landrace of the Andean gene pool (Singh et al., 1991). G19833 is relatively well adapted under phosphorus-limited conditions, yielding nearly twice that of check varieties under severe phosphorus stress (Yan et al., 1995a, 1995b; CIAT, 1996). These two genotypes were crossed and the progenies advanced by single seed descent to the F5 generation, then advanced by mass selection within each family to F10 RILs (F5.10 RILs).
Plant Growth Conditions
Seeds of two parents and 86 F5.10 RILs were surface sterilized for 1 min in 10% (w/v) NaOCl before germination. Seeds were germinated in 0.5 mm CaSO4 in darkness at 25°C. After 7 d, seedlings were transplanted into 100-L tanks with a nutrient solution composed of: 4.5 mm KNO3, 1.2 mm NH4NO3, 3.6 mm Ca(NO3)2, 3.0 mm MgSO4, 1.2 mm K2SO4, 1.2 mm (NH4)2SO4, 30 μm Fe-EDTA, 4.5 μm MnSO4, 4.5 μm ZnSO4, 1.5 μm CuSO4, 1.5 μm H3BO3, and 0.4 μm NH4Mo7O24. The parental materials were treated with three phosphorus levels (0.2 μm, 2 μm, and 1,000 μm phosphorus as KH2PO4), whereas the RILs were treated with one low phosphorus level (2 μm phosphorus). For more detailed studies, eight contrasting RILs, four having high APA and four having low APA, were grown under high (1,000 μm, KH2PO4) and low (2 μm KH2PO4) phosphorus conditions. For the low phosphorus (0.2 μm and 2 μm) treatments, a solid phase buffer (phosphorus adsorbed onto alumina) was used to maintain realistically low concentrations of phosphorus (Lynch et al., 1990). The solution was well aerated and the pH was maintained between 5.8 and 6.0 with daily additions of 1.0 m KOH or HCl. Plants were grown in a greenhouse with an average temperature of 29°C/20°C (day/night), relative humidity 48%/83% (day/night), and average daytime photosynthetically active radiation between 500 and 1,000 μmol m−2 s−1.
Determination of APA in Leaf Tissue
About 0.1 to 0.2 g of fresh tissue was taken from fully expanded leaves at 10 or 24 d after transplanting. Leaves sampled at 10 d were the only fully expanded trifoliate leaves; at 24 d, leaves of the same position were sampled, i.e. the oldest trifoliate leaf was sampled. Fresh samples were frozen in liquid nitrogen, ground in a cold mortar, and macerated in 5 mL of 0.2 m sodium acetate-acetic acid buffer (pH 5.8). The extract was then centrifuged at 27,000g for 10 min at 4°C. A 50-μL portion of the supernatant was added to 450 μL of buffer and used for assay of APA. Phosphatase activities were assayed using ρ-nitrophenylphosphate as substrate (McLachlan et al., 1987), and phosphatase activity was expressed per unit of soluble protein. Results expressed per unit tissue fresh weight gave qualitatively the same conclusions (data not shown).
Determination of Soluble Protein in Leaf Tissues
Fresh tissue was quickly frozen in liquid nitrogen, ground in a cold mortar, and macerated in 1.0 mL 100 mm Tris buffer (pH 8.0). The extract was then centrifuged at 27,000g for 10 min at 4°C. The soluble protein content was measured by the method of Bradford (1976).
Detection of APase Isoforms
In separate experiments with similar growth conditions, leaves were harvested from the parents and eight selected RILs under high (1,000 μm) and low (2 μm) phosphorus conditions. Proteins were isolated from the tissue as described by Aarts et al. (1991). Protein extracts (10 μL each) were separated by non-denaturing polyacrylamide gel (8% [w/v]) electrophoresis at 4°C. The gels were rinsed twice in 50 mm sodium acetate (pH 5.5) with 10 mm MgCl2 and stained with Fast Black K salt and β-naphthyl acid phosphate as previously described (Trull et al., 1997; Trull and Deikman, 1998). A different substrate was used for staining the gels because ρ-nitrophenyl phosphate is soluble and does not detect bands on a gel. Duplicate denaturing gels were stained with silver nitrate (Morrissey, 1981) to verify that loading in each lane was comparable (data not shown).
Molecular Mapping of APA
DNA was extracted from the parental genotypes and progenies by a modification of the method of Dellaporta (Dellaporta et al., 1983; Vallejos et al., 1992) and was screened with 101 probes in combination with six enzymes (BamHI, DraI, HindIII, EcoRI, EcoRV, and Xba) to detect polymorphisms using Southern blots. Fifty-six probes were chosen to create a framework map covering most of the genome at an approximately 20-cM distance between RFLPs, based on published maps. These probes were analyzed on the 86 RILs (Beebe et al., 1998). In addition, 40 AFLP markers were generated on the RILs using two primer combinations that produce abundant bands in common bean (Phaseolus vulgaris; Tohme et al., 1996). Single copy amplified repeat sequences reported in the literature were used as primers to amplify another seven bands. Finally, 242 random-amplified polymorphic DNAs were generated using 34 primers from Operon Corporation (Alameda, CA). A total of 318 markers were used to create the final map after unlinked markers were eliminated, using the Mapmaker program (Whitehead Institute, Cambridge, MA; Lander et al., 1987; Freyre et al., 1998). Markers were first mapped at LOD 6 to create a framework map, and remaining markers were placed individually at successively lower LOD scores down to LOD 2 using the Assign, Place, and Ripple functions. QTL analysis to detect loci associated with APA was carried out using the Q-Gene program (Nelson, 1997). In addition, a locus for a major gene for APA was mapped as an individual marker, based on bimodal segregation.
Determination of Relationship between APA and Phosphorus Efficiency
Three replicates of the parents and RILs were grown in the greenhouse to 21 d after transplanting, when plant dry weight was taken and phosphorus content analyzed. PAE was calculated as the total amount of phosphorus in the plant (mg phosphorus/plant) and PUE was calculated as the plant dry weight produced per unit of phosphorus (g dry weight/mg phosphorus).
Pearson linear correlation was used to analyze the relationship between PAE or PUE and APA with data from both the parents and the RILs. In addition, QTLs for PAE and PUE were detected and analyzed as described previously to determine their molecular linkage with APA.
In a separate experiment, plants were grown in the greenhouse with similar growth conditions (three replicates) as described above. Plants were harvested at 10, 17, and 24 d after transplanting. Leaf samples from old (initial trifoliate leaves to appear), intermediate (fully expanded trifoliates), and young (the most recent set of trifoliates to have reached about 50% of full expansion) leaves were collected for analysis of APA and phosphorus contents.
Statistical Analyses
Data were analyzed by ANOVA in SYSTAT (Wilkinson et al., 1992). Regression statistics were obtained from Pearson linear correlation, which was used to analyze the relationship between APA and PAE or PUE. APA and phosphorus concentration in the remobilization experiment were analyzed by repeated measures of ANOVA with harvest time as a within factor. Univariate sums of squares were derived from the orthogonal components used in the multivariate calculations. The univariate F statistics presented here were all in agreement with multivariate F statistics (Wilk's Lambda, Pillai Trace, and Hotelling-Lawly Trace; Wilkinson et al., 1992).
ACKNOWLEDGMENTS
The authors thank Bob Snyder and Barbara Knupp for laboratory assistance and Kathleen Brown, Weijun Wang, and Jennifer Tomscha for valuable discussions of the manuscript.
Footnotes
This research was supported by the U.S. Department of Agriculture/National Research Initiative (grant nos. 97–35100–4456 and 99–00632 to J.P.L.), by the National Key Basic Research Special Funds of China (grant no. G1999011700 to X.Y.), and by the National Natural Science Foundation (grant no. 39925025 to X.Y.).
LITERATURE CITED
- Aarts J, Hontelez J, Fischer P, Verkerk R, van Kammen A, Zabel P. Acid phosphatase-1, a tightly linked molecular marker for root-knot nematode resistance in tomato: from protein to gene, using PCR and degenerate primers containing deoxyinosine. Plant Mol Biol. 1991;16:647–661. doi: 10.1007/BF00023429. [DOI] [PubMed] [Google Scholar]
- Ae N, Arihara J, Okada K, Yoshihara T, Johansen C. Phosphorus uptake by pigeon pea and its role in cropping systems of the Indian subcontinent. Science. 1990;248:477–480. doi: 10.1126/science.248.4954.477. [DOI] [PubMed] [Google Scholar]
- Asmar F, Gahoonia T, Nielsen N. Barley genotypes differ in activity of soluble extracellular phosphatase and depletion of organic phosphorus in the rhizosphere soil. Plant Soil. 1995;172:117–122. [Google Scholar]
- Barber SA. Soil Nutrient Bioavailability: A Mechanistic Approach. New York: John Wiley & Sons Inc.; 1995. pp. 202–230. [Google Scholar]
- Beebe S, Lynch J, Galwey N, Tohme J, Ochoa I. A geographical approach to identify phosphorus-efficient genotypes among landraces and wild ancestors of common bean. Euphytica. 1997;95:325–336. [Google Scholar]
- Beebe S, Pedraza F, Rojas M, Gutierrez J, Tohme J. A genetic map of common bean combining RFLP, RAPD, SCAR, and AFLP markers. Annu Rep Bean Improvement Coop. 1998;41:95–96. [Google Scholar]
- Besford RT. A rapid tissue test for diagnosing phosphorus deficiency in tomato plant. Ann Bot. 1980;45:225–227. [Google Scholar]
- Bieleski R. Phosphate pools, phosphate transport, and phosphate availability. Ann Rev Plant Physiol. 1973;24:225–252. [Google Scholar]
- Bradford MM. A rapid and sensitive method for the quantitative of microgram quantities of protein utilizing the principle of protein-dye binding. Anal Biochem. 1976;72:248–254. doi: 10.1016/0003-2697(76)90527-3. [DOI] [PubMed] [Google Scholar]
- CIAT(1996) CIAT Annual Report for 1995. Cali, Colombia
- Clark RB. Characterization of phosphatase of intact maize roots. J Agri Food Chem. 1975;23:458–460. doi: 10.1021/jf60199a002. [DOI] [PubMed] [Google Scholar]
- Clark RB, Duncan RR. Improvement of plant mineral nutrition through breeding. Field Crop Res. 1991;27:219–240. [Google Scholar]
- Dellaporta SL, Wood J, Hicks JB. A plant DNA minipreparation: version II. Plant Mol Biol Rep. 1983;1:19–21. [Google Scholar]
- Duff SMG, Sarath G, Plaxton WC. The role of acid phosphatase in plant phosphorus metabolism. Physiol Plant. 1994;90:791–800. [Google Scholar]
- Fawole I, Gabelman WH, Gerloff GC, Nordheim EV. Heritability of efficiency in phosphorus utilization in beans (Phaseolus vulgaris L.) grown under phosphorus stress. J Am Soc Hortic Sci. 1982;107:98–100. [Google Scholar]
- Fernandez DS, Ascencio J. Acid phosphatase activity in bean and cowpea plants grown under phosphorus stress. J Plant Nutr. 1994;17:229–241. [Google Scholar]
- Food and Agriculture Organization. Production Yearbook, 1990. Vol. 44. Rome: Food and Agriculture Organization; 1991. [Google Scholar]
- Frank AB, Bauer A, Black AL. Carbohydrates, nitrogen, and phosphorus concentrations of spring wheat leaves and stems. Agron J. 1989;81:524–528. [Google Scholar]
- Freyre R, Skroch PW, Geffroy V, Adam-Blondon AF, Shirmohamadali A, Johnson WC, Llaca V, Nodari RO, Pereira PA, Tsai SM. Towards an integrated linkage map of common bean: IV. Development of a core linkage map and alignment of RFLP maps. Theor Appl Genet. 1998;97:847–856. [Google Scholar]
- Gardner WK, Parbery DG, Barber DA. Proteoid root morphology and function in Lupinus albus L. Plant Soil. 1981;60:143–147. [Google Scholar]
- Gepts P, Debouck D. Origin, domestication, end evolution of the common bean (Phaseolus vulgaris L.) In: van Schoonhoven A, Voysest O, editors. Common Beans: Research for Crop Improvement. Wallingford, UK: Commonwealth Agricultural Bureau International/CIAT; 1991. pp. 7–53. [Google Scholar]
- Gerloff GC, Gabelman WH. Lauchli A, Bieleski RL, eds, Encyclopedia of Plant Physiology. 15B. New Series. New York: Springer-Verlag; 1983. Genetic basis of inorganic plant nutrition; pp. 453–476. [Google Scholar]
- Goldstein A, Baertlein D, McDaniel R. Phosphate starvation inducible metabolism in Lycopersicon esculentum: I. Excretion of acid phosphatase by tomato plants and suspension-cultured cells. Plant Physiol. 1988a;87:711–715. doi: 10.1104/pp.87.3.711. [DOI] [PMC free article] [PubMed] [Google Scholar]
- Goldstein A, Danon A, Baertlein D, McDaniel R. Phosphate starvation inducible metabolism in Lycopersicon esculentum: II. Characterization of the phosphate starvation inducible-excreted acid phosphatase. Plant Physiol. 1988b;87:716–720. doi: 10.1104/pp.87.3.716. [DOI] [PMC free article] [PubMed] [Google Scholar]
- Guthrie RE, McLachlan KD, De Marco DG. Acid phosphatases associated with phosphorus deficiency in wheat: partial purification and properties. Aust J Plant Physiol. 1991;18:615–626. [Google Scholar]
- Halsted M, Lynch JP. Phosphorus responses of C3 and C4 species. J Exp Bot. 1996;47:497–505. [Google Scholar]
- Hanway JJ, Weber CR. Accumulation of N, P, and K by soybean (Glycine max (L.) Merrill) plants. Agron J. 1971;63:406–408. [Google Scholar]
- Helal HM. Varietal differences in root phosphatase activity as related to the utilization of organic phosphates. Plant Soil. 1990;123:161–163. [Google Scholar]
- Hoffland E, Van den Boogaard R, Nelemans J, Findenegg G. Biosynthesis and root exudation of citric and malic acids in phosphate-starved rape plants. New Phytol. 1992;122:675–680. [Google Scholar]
- Hunter DA, McManus MT. Comparison of acid phosphatase in two genotypes of wheat clover with different responses to applied phosphorus. J Plant Nutr. 1999;22:679–692. [Google Scholar]
- Lander E, Green P, Abrahamson J, Barlow A, Daley M, Lincoln S, Newburg L. MAPMAKER: an intreactive computer package for constructing primary genetic linkage maps of experimental natural populations. Genomics. 1987;1:174–181. doi: 10.1016/0888-7543(87)90010-3. [DOI] [PubMed] [Google Scholar]
- Lynch J, Beebe S. Adaptation of beans (Phaseolus vulgaris L.) to low phosphorus availability. Hortic Science. 1995;30:1165–1171. [Google Scholar]
- Lynch JP. Root architecture and plant productivity. Plant Physiol. 1995;109:7–13. doi: 10.1104/pp.109.1.7. [DOI] [PMC free article] [PubMed] [Google Scholar]
- Lynch JP. The role of nutrient-efficient crops in modern agriculture. J Crop Prod. 1998;1:241–264. [Google Scholar]
- Lynch JP, Epstein E, Lauchli A, Weight GE. An automated greenhouse sand culture system suitable for studies of P nutrition. Plant Cell Environ. 1990;13:547–554. [Google Scholar]
- Marschner H, Romheld V, Cakmak I. Nutrient availability in the rhizosphere. J Plant Nutr. 1987;10:1174–1184. [Google Scholar]
- McLachlan KD. Acid phosphatase of intact roots and phosphorus nutrition in plants. Aust J Agric Res. 1980;31:441–448. [Google Scholar]
- McLachlan KD, Elliott DE, De Marco DG, Garran JH. Leaf acid phosphatase isozymes in the diagnosis of phosphorus status in field-grown wheat. Aust J Agric Res. 1987;38:1–13. [Google Scholar]
- Morrissey J. Silver stain for proteins in polyacrylamide gels: a modified procedure with enhanced uniform sensitivity. Anal Biochem. 1981;117:307–310. doi: 10.1016/0003-2697(81)90783-1. [DOI] [PubMed] [Google Scholar]
- Nelson C. QGENE software for marker-based genomic analysis and breeding. Mol Br. 1997;3:239–245. [Google Scholar]
- Sample EC, Soper RJ, Racz GJ. Reactions of phosphate fertilizers in soils. In: Khasawneh FE, Sample EC, Kamprath EJ, editors. The Role of Phosphorus in Agriculture. Madison, WI: American Society of Agronomy; 1980. pp. 263–310. [Google Scholar]
- Schachtman DP, Reid RJ, Ayling SM. Phosphorus uptake by plants: from soil to cell. Plant Physiol. 1998;116:447–453. doi: 10.1104/pp.116.2.447. [DOI] [PMC free article] [PubMed] [Google Scholar]
- Singh SP, Gepts P, Debouck D. Races of common bean (Phaseolus vulgaris, Fabacea) Econ Bot. 1991;45:379–396. [Google Scholar]
- Smith FW, Jackson WA, Vanden Berg PJ. Internal phosphorus flows during development of phosphorus stress in Stylosanthes hamata. Aust J Plant Physio. 1990;17:451–464. [Google Scholar]
- Snapp S, Lynch JP. Phosphorus distribution and remobilization in bean plants as influenced by phosphorus nutrition. Crop Sci. 1996;36:929–935. [Google Scholar]
- Stevenson FJ. Cycles of Soil: Carbon, Nitrogen, Phosphorus, Sulfur, Micronutrients. New York: John Wiley & Sons Inc.; 1986. [Google Scholar]
- Tadano T, Ozawa K, Sakai H, Osaki M, Matsui H. Secretion of acid phosphatase by the roots of crop plants under phosphorus-deficient conditions and some properties of the enzyme secreted by lupin roots. Plant Soil. 1993;156:95–98. [Google Scholar]
- Tarafdar JC, Claassen N. Organic phosphorus compounds as a phosphorus source for higher plants through the activity of phosphatase produced by plant roots and microorganisms. Biol Fertil Soils. 1988;5:308–312. [Google Scholar]
- Tarafdar JC, Jungk A. Phosphatase activity in the rhizosphere and its relation to the depletion of soil organic phosphorus. Biol Fertil Soils. 1987;3:199–204. [Google Scholar]
- Tohme J, Gonzalez DO, Beebe S, Duque MC. AFLP analysis of gene pools of a wild bean core collection. Crop Sci. 1996;36:1375–1384. [Google Scholar]
- Trull MC, Deikman J. An Arabidopsis mutant missing one acid phosphatase isoform. Planta. 1998;206:544–550. doi: 10.1007/s004250050431. [DOI] [PubMed] [Google Scholar]
- Trull MC, Guiltinan MJ, Lynch JP, Deikman J. The responses of wild type and ABA mutant Arabidopsis thali-ana plants to phosphorus starvation. Plant Cell Environ. 1997;20:85–92. [Google Scholar]
- Vallejos EC, Sakiyama NS, Chase CD. A molecular marker-based linkage map of Phaseolus vulgaris L. Genetics. 1992;82:353–357. doi: 10.1093/genetics/131.3.733. [DOI] [PMC free article] [PubMed] [Google Scholar]
- Vincent JB, Crowder MW, Averill BA. Hydrolysis of phosphate monoesters: a biological problem with multiple chemical solutions. Trends Biochem Sci. 1992;17:105–110. doi: 10.1016/0968-0004(92)90246-6. [DOI] [PubMed] [Google Scholar]
- Wilkinson L, Hill M, Vang E. SYSTAT Statistics. Evanston, IL: SYSTAT, Inc.; 1992. pp. 116–364. [Google Scholar]
- Yan X, Beebe SE, Lynch JP. Genetic variation for phosphorus efficiency of common bean in contrasting soil types: II. Yield response. Crop Sci. 1995a;35:1094–1099. [Google Scholar]
- Yan X, Lynch JP, Beebe SE. Genetic variation for phosphorus efficiency of common bean in contrasting soil types: I. Vegetative response. Crop Sci. 1995b;35:1086–1093. [Google Scholar]


