

Abstract
With an incidence of ~50%, the absence or reduced protein level of p53 is much more common than TP53 mutations in acute myeloid leukemia (AML). AML with FLT3-ITD (internal tandem duplication) mutations has an unfavorable prognosis and is highly associated with wt-p53 dysfunction. While TP53 mutation in the presence of FLT3-ITD does not induce AML in mice, it is not clear whether p53 haploinsufficiency or loss cooperates with FLT3-ITD in the induction of AML. Here, we generated FLT3-ITD knock-in; p53 knockout (heterozygous and homozygous) double-transgenic mice and found that both alterations strongly cooperated in the induction of cytogenetically normal AML without increasing the self-renewal potential. At the molecular level, we found the strong upregulation of Htra3 and the downregulation of Lin28a, leading to enhanced proliferation and the inhibition of apoptosis and differentiation. The co-occurrence of Htra3 overexpression and Lin28a knockdown, in the presence of FLT3-ITD, induced AML with similar morphology as leukemic cells from double-transgenic mice. These leukemic cells were highly sensitive to the proteasome inhibitor carfilzomib. Carfilzomib strongly enhanced the activity of targeting AXL (upstream of FLT3) against murine and human leukemic cells. Our results unravel a unique role of p53 haploinsufficiency or loss in the development of FLT3-ITD + AML.
Subject terms: Cancer models, Preclinical research
Introduction
Mutations in the TP53 gene are very common in solid tumor with an incidence of up to 90% in certain cancers [1, 2]. TP53 mutations are found in ~60% of AML patients with a complex karyotype but are rare in other AML patients (generally < 10%) [3]. Although TP53 mutation appears to be an early event in the pathogenesis of AML [4], however, the co-occurrence of TP53 mutations and FLT3-ITD is rare in AML [5]. In a mouse model, a p53 mutant in the presence of FLT3-ITD did not induce AML and did not shorten the survival of mice [6]. With an incidence of ~50%, absent/reduced protein level of p53 is much more common than TP53 mutations in AML [3, 7–9]. Moreover, functional nuclear p53 protein has been shown to be strongly reduced in AML patients (up to 98% in patients with FLT3-ITD and NPM1mut) [10]. Deletion of 17p, to which TP53 is mapped, occurs in AML as a single aberration or with additional chromosomal abnormalities, demonstrating an unfavorable cytogenetic category. AML with FLT3-ITD mutations is highly associated with wtp53 dysfunction via additional different ways such as MDM2/MDM4 overexpression [11] (Supplementary Fig. 1), SIRT1 overexpression (resulting p53 deacetylation), PI3K/AKT pathway activation (promoting MDM2-mediated p53 degradation), STAT/MAPK pathway activation with BCL2 accumulation (opposing p53 activity), disturbing the nucleocytoplasmic shuttling of p53 [10], dysregulation of NPM (in patients with FLT3-ITD and NPM1 mutant) [12], and aberrant expression of certain miRNAs (e.g., miR-125b) [13]. Gene set enrichment analysis (GSEA) revealed that the transcriptome data of FLT3-mut AML patients are negatively associated with p53 and p63 targets (Supplementary Fig. 1). In an early mouse study, mutated/activated of FLT3 by insertional mutagenesis was preferentially detected in p53 and p19ARF−/− knockout but not in wild-type tumors, suggesting that FLT3 mutations may be particularly oncogenic in the absence of a functional p19ARF-MDM2-p53 pathway [14]. Activating mutations in FLT3 have been identified in ~30–40% of patients with AML and are associated with an unfavorable prognosis [15, 16]. The recently published multi-institutional RATIFY study (including our institute) demonstrated a statistically significant improvement in the overall survival for FLT3 + AML patients treated with midostaurin (targeting FLT3) and chemotherapy [15]. However, a beneficial effect of midostaurin appeared to be most pronounced in the NPM1wt/FLT3-ITDlow group. FLT3-ITD is a late event in the pathogenesis of AML. The identification of early cooperating events for FLT3 mutations may improve our understanding of the pathogenesis of AML and lead to more efficient treatment and an improved outcome for AML patients.
In this study, we investigated whether p53 haploinsufficiency or loss cooperates with FLT3-ITD in the induction of AML. We found that both alterations strongly cooperated in the induction of cytogenetically normal AML without increasing the self-renewal potential. At the molecular level, strong upregulation of Htra3 and downregulation of Lin28a were observed, that led to increased proliferation and the inhibition of apoptosis and differentiation. Overexpressed Htra3 and knockdown of Lin28a, combined with the presence of FLT3-ITD, induced AML with similar morphology as leukemic cells from double-transgenic mice. Moreover, our data indicate that combined therapy of the proteasome inhibitor carfilzomib and targeting AXL (upstream of FLT3) might be a promising treatment option particularly in FLT3-ITD positive AML.
Materials and methods
FLT3-ITD knock-in and p53 knockout mice, and generation of double-mutant mice
We obtained FLT3-ITD knock-in mice from the Jackson Laboratory (Bar Harbor, ME). FLT3-ITD knock-in mice with C57BL/6J background that carry the human internal tandem duplication (ITD) mutation W51 in exon 14 of the endogenous murine Flt3 locus were generated in Gilliland’s laboratory [17]. The mice were backcrossed to C57BL/6 mice for 9 generations and were crossed to C57BL/6J at least once upon arrival at the Jackson Laboratory. Upon arrival at our animal facility, FLT3-ITD knock-in mice were crossed with C57BL/6J wild-type (WT) mice for at least four generations before crossing with p53 knock-out (KO) mice. We confirmed the ITD mutation by sequencing. FLT3-ITD knock-in mice mainly developed CMML-like disease as reported (Supplementary Figs. 2 and 3). p53 KO mice were obtained from the Jackson Laboratory. Exons 2–6 of the p53 gene in the p53 KO mice were replaced by a neomycin cassette in Weinberg’s laboratory [18]. Upon arrival at the Jackson Laboratory, the C57BL/6J strain was produced by backcrossing the p53 KO mice at least five times to C57BL/6J inbred mice. Upon arrival at our animal facility, we crossed p53 KO mice with C57BL/6J wild-type mice for at least two generations. FLT3-ITD knock-in mice were then crossed with p53 KO mice to generate ITD/ITD; p53+/− mice. ITD/ITD; p53+/− mice were bred with each other to generate ITD/ITD; p53+/−, ITD/ITD; p53−/−, and ITD/ITD; p53+/+ (p53 WT) mice. ITD/ITD; p53 WT, ITD/ITD; p53+/− and ITD/ITD; p53−/− were born at ~22%, 65 and 13% frequencies, respectively. Few ITD/ITD and ITD/ITD; p53+/− animals were obtained from breeding ITD/ITD; p53+/− × ITD/ITD; p53+/+.
Mouse monitoring and tumor phenotyping
All animals were kept in the animal laboratories of Hannover Medical School. Animal experiments were approved by the local ethical committee LAVES (Niedersächsisches Landesamt für Verbraucherschutz und Lebensmittelsicherheit) and performed according to their guidelines. Animals were killed for necropsy when termination criteria were met or the endpoints of the experiment were reached, or were analyzed when found dead before the onset of autolysis [19]. Tumor phenotyping were performed as described previously [19].
RNA-sequencing and raw data processing and TaqMan assay
RNA-Sequencing and raw data processing were performed as previously described [20]. Quantitative (TaqMan) RT-PCR and GSEA were carried out as previously reported [21]. TaqMan probes were purchased from Applied Biosystems (Foster City, CA).
Data analysis and statistics
FACS data were analyzed by FlowJo software (Tree Star, OR, USA). Statistical analyses and figures were generated by Graphpad Prism 6 or 7 (San Diego, CA). To compare difference of data in more than 3 groups, one-way ANOVA test was used. For data in 2 groups, Student’s t-test was used. The results were represented as the means ± SD. Significant differences in Kaplan–Meier survival were evaluated by the log-rank test. IC50 (half maximal inhibitory concentration) values were calculated by dose-response curves using nonlinear regression analysis (curve fit) after log-transformation. P values less than 0.05 were considered statistically significant.
Multicolor fluorescence in situ hybridization (mFISH), colony-forming unit-spleen (CFU-S) assay, small-molecule inhibitor treatment, antibody arrays, and xenograft studies
Please refer to Supplementary Methods.
Results
Strong cooperating effect of FLT3-ITD and p53 haploinsufficiency or loss in the induction of AML
To test whether FLT3-ITD and p53 haploinsufficiency or loss cooperate to initiate AML, we crossed FLT3-ITD knock-in mice [17] with p53 knockout mice [18] to generate mice harboring both ITD/ITD (FLT3-ITD homozygous) and p53 knockout mutations (Fig. 1a). Mice with both FLT3-ITD and p53 knockout were viable and had no evident abnormalities at birth. ITD/ITD; p53+/− (FLT3-ITD homozygous and p53 heterozygous) mice survived much shorter than mice with ITD/ITD or p53+/− alone (Fig. 1b). The median survivals of ITD/ITD; p53+/− mice (n = 76), ITD/ITD mice (littermates/siblings of ITD/ITD; p53+/− mice, n = 24), p53+/− mice (n = 31), and WT mice (n = 15) were 315, 573, 520, and 845 days, respectively (p < 0.0001). Moreover, the median survival of ITD/ITD; p53−/− mice (FLT3-ITD homozygous and p53 homozygous, littermates/siblings of ITD/ITD; p53+/− mice, n = 12) was further reduced (128 days) and significantly shorter than that of ITD/ITD; p53+/− mice and p53−/− mice (median survival: 148 days, n = 15) (Fig. 1c, p < 0.05). Importantly, the cooperation of both FLT3-ITD and p53 KO also significantly altered the disease spectrum in mice (Fig. 1d). The vast majority of ITD/ITD; p53+/− mice developed AML (65%) and acute lymphoblastic leukemia (ALL, 24%) (Figs. 1d and 2a, b), while AML was observed only in 17% of ITD/ITD mice (others developed CMML-like disease (57%, Fig. 2a) and acute lymphoblastic leukemia (ALL, 24%)), and p53+/− mice mainly developed solid tumors (55%) and lymphoma (13%) as reported previously (Fig. 1d; Supplementary Fig. 4) [18]. The incidence of AML was further significantly increased in ITD/ITD; p53−/− mice (83%) (Supplementary Figs. 5 and 6), while most p53−/− mice developed lymphoma/lymphoblastic leukemia (87%) and none of the p53−/− mice developed AML (Supplementary Fig. 7) as reported previously [18]. Compared with ITD/ITD; p53 WT mice, the weight of the thymus in ITD/ITD; p53+/− mice was significantly higher (mean: 869 mg vs. 506 mg), while there was no significant difference in terms of the blood content (WBC, HB, PLT), and the weights of the spleen and liver (Supplementary Fig. 8). Interestingly, 90% of ITD/ITD; p53−/− and 52% of ITD/ITD; p53+/− mice with acute leukemia demonstrated biclonal disease, with the coexistence of AML and ALL/lymphoma (e.g., #1348: Fig. 2a–d; #1352: Supplementary Fig. 5), while this phenomenon was observed only in one ITD/ITD mouse. Interestingly, similar to patients with Li-Fraumeni syndrome, two ITD/ITD; p53+/− mice developed both osteosarcoma and AML (Supplementary Fig. 9). Importantly, AML and ALL cells from ITD/ITD; p53+/− mice were transplantable (Supplementary Fig. 10). Of note, loss of heterozygosity (LOH) for p53 was not observed in ITD/ITD; p53+/− and p53+/− mice. Taken together, our data indicate a strong cooperating effect of FLT3-ITD and p53 haploinsufficiency or loss in the induction of acute leukemia.
Fig. 1. Dismal survival of mice with both p53 knock-out and FLT3-ITD knock-in mutations.

a Genotyping analyses of p53 knockout and FLT3-ITD knock-in by PCR. The genotypes of offspring were detected by PCR amplification of p53 or FLT3-ITD mutations in genomic DNA. Moreover, p53 haploinsufficient (p53+/−) mice (n = 3) showed a 1.8-fold (1.4–2.2-fold) reduction in p53 mRNA expression quantitative PCR assay, while p53 expression was completely absent in p53−/− mice (n = 3) by the TaqMan assay. Mouse #361 = FLT3-ITD heterozygote, #1436 = ITD/ITD, #1381 = p53+/−, #1376 and #1348 = ITD/ITD; p53+/−, #1352 = ITD/ITD; p53−/−, #1345 = p53−/−. ITD/ITD = homozygous FLT3-ITD knock-in mice; p53+/− = heterozygous p53 knock-out mice; p53−/− = homozygous p53 knock-out mice; ITD/ITD; p53+/− =mice with homozygous FLT3-ITD knock-in and heterozygous p53 knock-out; ITD/ITD; p53−/− = mice with homozygous FLT3-ITD knock-in and homozygous p53 knock-out. b Survival curve of WT (wild-type), ITD/ITD; p53+/−, and ITD/ITD; p53+/− mice. ***p < 0.001, ****p < 0.0001. c Survival curve of p53−/− and ITD/ITD; p53−/− mice. *p < 0.05. d Change in the disease spectrum by cooperation of FLT3-ITD and p53 KO. All except three animals (not classifiable) from the survival curves (b, c) were included. Mice with biclonal disease (the coexistence of AML and ALL/lymphoma) were included in the AML group. In the p53+/− group, one mouse developed both a solid tumor and lymphoma and was included in the solid tumor subgroup. One p53−/− mouse developed mixed-phenotype acute leukemia and was included in the ALL/lymphoma subgroup. ALL /lymphoma = almost all are lymphoblastic lymphoma, others = histocytic sarcoma, adenoma/cystic diseases and few animals without pathological abnormality, although termination criteria were met.
Fig. 2. Development of cytogenetically normal AML induced by ITD/ITD and p53 haploinsufficiency or loss.

a Representative Pappenheim-stained blood smears and bone marrow (BM) cytospins, and hematoxylin and eosin (H & E)-stained bone marrow, and liver from p53+/−, ITD/ITD, ITD/ITD; p53+/− mice. Blood smear: there were no blasts and no increased monocytes in mouse #1381 (p53+/−). Monocytes were increased in mouse #1436 (ITD/ITD). Myeloblasts were strongly increased in mouse #1376 (ITD/ITD; p53+/−), while only few blasts were observed in mouse #1348 (ITD/ITD; p53+/−) with biclonal disease. BM cytospins: mouse #1381 showed a normal cellular component. Monocytes were strongly increased in mouse #1436. Myeloblats made up ~60 and 30% of all nucleated cells in mice #1376 and #1348, respectively. BM section: BM histology was consistent with the cellular constituents observed in cytospins. Note the presence of megakaryocytes in mouse #1381 and the reduction/absence of megakaryocytes in other animals with leukemia. Spleen section: white pulp and red pulp were present in mouse #1381, while the structures of the spleen were destroyed in the other 3 mice with leukemia, particularly in #1376 and #1348. Liver section: while mouse #1381 showed a normal liver structure, infiltration of leukemic cells was observed in the other 3 animals, particularly in #1376. Mouse #1381 developed adenocarcinoma and osteosarcoma (Supplementary Fig. 4). However, mouse #1381 demonstrated similar cytology and histology (PB, BM and spleen) as WT mice (data not shown), except for increased granulocytes in blood smear. Data from ITD/ITD; p53−/− mice were presented in Supplementary Fig. 5. b Cytospin from mouse #1348 showing lymphoblastic cells in thymus (left panel). Histology showing strong infiltration of lymphoblastic cells in thymus from mouse #1348 (right panel). c Macroscopic characterization of ITD/ITD; p53+/− mouse #1454. Note strong hepatosplenomegaly of mouse #1454 (upper panel) compared with a healthy control (lower panel). d Flow cytometric analysis of BM samples demonstrated a population of myeloblast/immature cells with lower side scatter (SSC) and CD45dim expression in mice #1376 and #1348, which were positive for CD11b, c-Kit, and CD34 (Supplementary Fig. 6). Moreover, T-lymphoblastic lymphoma cells from the thymus of mouse #1348 showed lower SSC but high CD45 expression [42]. Tumor cells were positive for CD4, CD8 and CD3. Notably, there was no infiltration of T-ALL cells in the BM of mouse #1348. Thus, there were two separate clones present in mouse #1348 (AML in the BM, T-ALL in the thymus). e mFISH analysis of a representative FLT3-ITD; p53+/− BM sample from mouse #1348 showing a normal karyotype (40, XY). Table S1 summarizes the karyotypes found in mice with AML (n = 12). f The replating colony assay demonstrated no increased self-renewal activity in vitro by double mutations. Cells from one ITD/ITD; p53+/− mouse did not form colonies in the 1st plating and cells from another 2 ITD/ITD; p53+/− mice formed <6 colonies in the 2nd replating, while cells from all animals from ITD/ITD and p53+/− groups formed colonies in the 1st plating and >14 colonies in the 2nd replating (except for one mouse in the 2nd replating). Consistent with early reports, p53+/− increased self-renewal activity compared with WT p53 (the only group in which many colonies continued to be observed after the 5th replating), which was abrogated in the presence of ITD/ITD. Results presented are the min to max of colony numbers from each replating. ITD/ITD, n = 5 mice; p53+/−, n = 5; ITD/ITD; p53+/−, n = 7; ITD/ITD; p53−/−, n = 3; p53−/−, n = 5; WT = 4.
Cooperation of FLT3-ITD and p53 knockout induces cytogenetically normal AML without increased self-renewal potential
We performed multicolor fluorescence in situ hybridization (mFISH) analyses on the bone marrow, spleen or thymus cells from ITD/ITD; p53+/− and ITD/ITD; p53−/− mice. Unexpectedly, all analyzed murine leukemias (n = 12) showed normal karyotypes (Fig. 2e; Supplementary Fig. 9; Supplementary Table 1), indicating that p53 haploinsufficiency or loss per se does not lead to genetic instability, and genetic instability is not a major cause for AML and ALL development by the co-occurrence of p53KO and FLT3-ITD. Of note, a cooperation of genetic instability was likely needed for development of solid tumor induced by p53+/− alone (Supplementary Fig. 4). Interestingly, p53 haploinsufficiency in the co-occurrence of ITD/ITD did not increase the self-renewal of hematopoietic stem/progenitor cells, as determined by the serial replating assays in vitro (Fig. 2f). The limiting dilution transplantation of leukemic cells in vivo demonstrated a 10-fold reduction in leukemic stem cell (LSC) frequency in ITD/ITD; p53+/− leukemic cells compared with ITD/ITD cells (Supplementary Table 2). Moreover, the combination of ITD/ITD and p53 loss did not increase replating activity in vitro (Fig. 2f), suggesting that self-renewal activity did not increase. These findings suggest that AML development in our model is unlikely due to increased self-renewal of HSCs/HPCs, in contrast to that in NPM1c/FLT3-ITD and FLT3-ITD/Dnmt3a mutant mice [22, 23]. Recently, we showed that FLT3-N676K mutation has stronger transforming activity than FLT3-ITD, but leukemia induced by FLT3-N676K showed 100-fold less LSC frequency than FLT3-ITD [24]. Moreover, we observed a 10-fold lower LSC frequency by FLT3-ITD-TKD835 when assessed against FLT3-ITD (KH and ZL, unpublished data). These findings suggest that oncogenes/combinations with stronger leukemogenic potency may have a lower LSC frequency. Moreover, we found that Lin− cells were significantly increased in ITD/ITD; p53+/− mice, and LT-HSCs were strongly reduced in FLT3-ITD/ITD and ITD/ITD; p53+/− mice compared with that in WT and p53+/− mice (Fig. 3a). Animals with only AML in the ITD/ITD; p53+/− group showed a significant increase in common myeloid progenitors (CMPs) compared with that in ITD/ITD mice with CMML, p53+/− and WT mice (Fig. 3a, b, Supplementary Fig. S9e), while granulocyte-monocyte progenitors (GMPs) in the ITD/ITD; p53+/− group were not increased compared with that in the ITD/ITD-alone group or WT mice (Supplementary Fig. S9f). However, no difference was found regarding HSC, CMP and GMP in young non-diseased mice from all the groups (data not shown). This finding suggests that AML cells from the ITD/ITD; p53+/− mice with only AML mirror CMPs and the block of differentiation from CMPs to GMPs might have contributed to the development of AML in our model.
Fig. 3. Hematopoietic stem/progenitor compartments in the BM of diseased mice.

a Percentages and absolute cell number of Lin−, LT-HSC, and CMP cells in the BM. Data of other hematopoietic stem/progenitor cells were presented in Supplementary Fig. 9. Reduction of LT-HSCs in FLT3-ITD/ITD and ITD/ITD; p53+/− mice is consistent with a recent published report demonstrating that FLT3-ITD knock-in impairs HSC quiescence/homeostasis, leading to the depletion of LT-HSC [43]. The data shown in graphs represent means ± SD. *p < 0.05, **p < 0.01, n.s. no significant difference. Lin−: lineage negative cells; LT-HSC: long-term hematopoietic stem cells (Lin−c-Kit+Sca-1+CD48−CD150+); CMP: common myeloid progenitors (Lin−IL-7Rα−c-Kit+Sca-1−CD34+FcgR−). WT (wild-type): n = 3 mice; ITD/ITD: n = 6; p53+/−: n = 6; ITD/ITD; p53+/−: n = 6. b Representative flow cytometric analysis showing increased leukemic CMP in mouse #1376. CMP was increased 66-fold in #1376 compared with WT mice. Of note, the frequencies of LSK, CMP and GMP in WT mice were very similar to published data (e.g., 0.29% LSK in our studies vs. 0.24% reported by Sitnicka et al. [44] and CMP: 0.23% vs. 0.13% [44]).
RNA sequencing reveals strong upregulation of Htra3 and downregulation of Lin28a, leading to increased proliferation, the inhibition of differentiation and apoptosis, and leukemia development
To further understand how p53 haploinsufficiency or loss accelerates the leukemogenesis of FLT3-ITD, we prepared RNA samples from BM cells from WT, p53+/−, ITD/ITD; p53+/−, ITD/ITD; p53−/−, and p53−/− mice for comparative RNA-sequencing analysis. We performed hierarchical clustering analysis of 2176 differentially expressed genes (DEGs) after multi group comparison at a corrected p value threshold of < 0.01 (Fig. 4a). Furthermore, we expanded the statistical approach to explore meaningful pairwise comparisons by use of DESeq2 [25]. Interestingly, consistently more genes were downregulated than upregulated in all samples compared with the WT (Fig. 4b–e; Table 1; e.g., 1756 vs. 981 in the ITD/ITD group). Notably, compared with the WT, more genes were differentially expressed in mice with double mutations than the sum of single mutations (Fig. 4b–e; Table 1; e.g., 4430 genes in ITD/ITD; p53+/− vs WT). These findings suggest a specific interaction between ITD/ITD and p53KO.
Fig. 4. RNA-Sequencing analysis.

a Normalized expression profiles of the top 2176 genes with the largest standard deviations across all samples. The dendrogram shows samples in all groups clustered as expected. RNA samples were taken from BM cells from WT, p53+/−, ITD/ITD; p53+/−, ITD/ITD; p53−/−, and p53−/− mice (n = 3 for each group). There were only AML in BM in these ITD/ITD; p53+/− (e.g., #1376, Fig. 2a) and ITD/ITD; p53−/− mice, while p53+/- (e.g., #1381, Fig. 2a) and p53−/− mice did not show infiltration of tumor cells in BM. Differentially expressed p53 target genes in p53+/− mice compared with ITD/ITD mice were presented in Supplementary Fig. 11. Venn diagrams show the overlap of differentially expressed genes among 3 data sets including ITD/ITD; p53+/− (b: downregulated, c: upregulated). Pink = ITD/ITD vs WT; Yellow = p53+/− vs WT; Orange = ITD/ITD; p53+/− vs WT. Genes were considered to be differentially expressed based on DESeq2 statistics applying a corrected p value threshold (false discovery rate) at 0.01. Venn diagrams showing the overlap of differentially expressed genes among three data sets including ITD/ITD; p53−/− (d: downregulated; e: upregulated). Pink = ITD/ITD vs WT; Orange = p53−/− vs WT; Yellow = ITD/ITD; p53−/− vs WT. Venn diagrams show the overlap of differentially expressed genes in 2 pairwise comparisons (ITD/ITD; p53+/− vs ITD/ITD = pink; ITD/ITD; p53−/− vs ITD/ITD = yellow) (f: downregulated, g: upregulated). h TaqMan assays confirmed the RNA-Seq data in analyzed animals. ITD/ITD: n = 3 mice, ITD/ITD; p53+/−: n = 6, ITD/ITD; p53−/−: n = 4, p53+/−: n = 4 (for Lin28a and Sowaha) or 3 (for FLT3 and Htra3), p53−/−: n = 2. i Overexpression of Htra3 inhibited apoptosis induced by TGF-ß. 32D cells were transduced by a retroviral vector [45] expressing murine Htra3, and two clones with almost 100% expression of Htra3 were selected by limited dilution. Transduced 32D cells were cultured in the presence of TGF-ß without IL-3. Results presented are the mean ± SD of at least 4 independent experiments. **p < 0.01. j Representative example of macroscopic spleen colonies (CFU-S) from wild-type irradiated recipients injected with Lin− cells from ITD/ITD donors transduced with Htra3 or control cells from ITD/ITD mice (left panel). Right panel shows CFU-S from recipients injected with Lin− cells from WT donor. Spleens were fixed in Carnoy’s solution. Note that there were around 20% transplanted cells were with Htra3 k. l Represent cytospins showing different morphology of 32D WT and 32D overexpressing Lin28a cells (32D-Lin28a) on day 2 after G-CSF treatment. About 75% 32D-Lin28a cells went to differentiation (myelocytes to segmented neutrophils [45, 46]), while only 11% 32D WT cells differentiated. Similar differences were also observed on day 4, day 6, and day 8 after G-CSF treatment (data not shown). m Cytospin from mouse #1884 with erythroid leukemia showing strong infiltration of erythroblasts in spleen (left panel). Cytospin from mouse #1993 with AML showing >50% myeloblasts in BM spleen. Most myeoloblasts showed morphological features of immature monocytes similar as leukemic cells from double-transgenic mice (Fig. 2a). Mice #1884 and #1994 were transplanted with ITD/ITD lin− cells overexpressing Htra3 and overexpressing Htra3/Lin28a knockdown, respectively.
Table 1.
Pairwise comparisons revealing the numbers of differentially expressed genes.
| Pairwise comparison | Number of differentially expressed genes | Up | Down |
|---|---|---|---|
| ITD/ITD vs WT | 2737 | 981 | 1756 |
| p53+/− vs WT | 529 | 78 | 451 |
| ITD/ITD; p53+/− vs WT | 4430 | 1925 | 2505 |
| ITD/ITD; p53−/− vs WT | 5675 | 2353 | 3322 |
| P53−/− vs WT | 2523 | 762 | 1761 |
| ITD/ITD; p53+/− vs ITD/ITD | 1374 | 780 | 594 |
| ITD/ITD; p53−/− vs ITD/ITD | 279 | 76 | 203 |
We further identified the intersection of DEGs explored in two pairwise comparisons (ITD/ITD; p53+/− vs ITD/ITD and ITD/ITD; p53−/− vs ITD/ITD) and found that 11 and 82 genes were consistently upregulated and downregulated, respectively (Fig. 4f–g; Supplementary Fig. 11). Gene Ontology (GO) analyses revealed several pathways affected by the cooperation of ITD/ITD and p53KO that were directly related to hematopoiesis, including myeloid differentiation and development (Supplementary Table 3). To support our data, we also analyzed gene expression in AML patients with FLT3-ITD vs AML without FLT3-ITD in the publicly available TCGA database [26]. Comparing this dataset with our dataset (ITD/ITD; p53+/− vs ITD/ITD and ITD/ITD; p53−/− vs ITD/ITD), we found eight genes (CARHSP1, OPTN, LIN28A, FLT3, TMCC2, CPEB4, FHDC1, and HMBS) in both datasets. We performed quantitative PCR assays for seven selected genes (e.g., Htra3, FLT3, Lin28a and Sowaha, which belong to the genes with the most changed expression) from these 93 genes (Fig. 4h; Supplementary Fig. 11), and the assays were correlated very well with the RNA-seq data. TaqMan assay demonstrated that Htra3 was up to 149-fold upregulated by the co-operation of ITD/ITD and p53KO, while Htra3 was downregulated by any single mutation. The role of serine protease Htra3 in the leukemogenesis is unknown [27]. Consistent with a report demonstrating Htra3 as an inhibitor of TGF-ß signaling (a tumor suppressor in human hematologic malignancies) [28], we also found that overexpression of Htra3 in 32D murine myeloid cells significantly inhibited TGF-ß-induced apoptosis (Fig. 4i). In CFU-S assays, Lin− cells from ITD/ITD donors transduced with Htra3 gave rise to larger and more numerous CFU-S compared with non-transduced Lin− cells obtained from ITD/ITD donors (Fig. 4j, k, mean colonies/mouse 12 vs. 2, p < 0.05, n = 3 and 5, respectively), whereas no increase in the CFU-S number was observed for Lin− cells from WT donors that were transduced with Htra3 compared with control cells (n = 3 for each). This result indicates strong cooperation between FLT3-ITD and Htra3 in support of multipotent progenitor proliferation, although we did not find any differences in the proliferation capacities between ITD/ITD; p53+/− and ITD/ITD lin− cells in vitro (data not shown). Lin28a was up to 14-fold downregulated by cooperation of ITD/ITD and p53KO. Moreover, the immortalized 32D myeloid cells showed 231-fold reduced expression of Lin28a. Overexpression of Lin28a in 32D cells strongly promoted G-CSF induced differentiation (Fig. 4l). In murine models, miR-125b overexpression leads to downregulation of Lin28a and the development of myeloid leukemia [29]. Although cultured ITD/ITD cells overexpressing Htra3 did not result in an increase in lin− cells, the knockdown of Lin28a in ITD/ITD cells resulted in a 1.5-fold increase in lin− cells after culture in vitro, indicating the inhibition of differentiation by Lin28a knockdown. In the presence of overexpressed Htra3, lin− cells with Lin28a knockdown increased up to 5-fold after culture for over 7 days compared with control cells, indicating a synergistic effect between Lin28a and Htra3 in the differentiation inhibition of ITD/ITD cells. Moreover, we observed AML (erythroid leukemia) development in the group transplanted with ITD/ITD lin− cells overexpressing Htra3 5 months after transplantation (one of five mice, cut off: 1st of August 2021), and the combined knockdown of Lin28a and overexpression of Htra3 in ITD/ITD cells induced AML (two of three mice) with a much shorter latency of one month and a similar morphology as leukemic cells obtained from ITD/ITD; p53 KO double-transgenic mice. The third mouse did not show sign of leukemia about two months after transplantation. By contrast, no sign of leukemia was observed in six mice transplanted with ITD/ITD lin− cells with Lin28a knockdown 4 months after transplantation, indicating a cooperative effect between Htra3, Lin28a, and ITD/ITD in AML induction. We isolated BM cells from both young non-diseased ITD/ITD; p53+/− mice and old leukemic ITD/ITD; p53+/− mice and transplanted these cells into WT recipients. No significant difference was observed in survival between these 2 groups (149 vs 143 days, n = 3 for each), suggesting that a contribution from the BM microenvironment to leukemia development in our model is unlikely.
Importantly, consistent with the lack of enhancement of aberrant self-renewal by the co-occurrence of FLT3-ITD and p53 KO, we observed opposite expression of Arhgap5 and Lin28a that are known for the requirement of HSC self-renewal [30, 31]. Interestingly, overexpression of Htra3 in HSCs/HPCs carrying FLT3-ITD did not increase replating activity in vitro, suggesting no increased self-renewal activity by overexpression of Htra3. Moreover, we found over 30-fold upregulation of FLT3 by the co-occurrence of FLT3-ITD and p53 KO. The loss of self-renewal capacity by upregulation of FLT3 expression in the bone marrow LSK stem cell compartment has been reported previously [32]. Taken together, our data indicate that FLT3-ITD and p53 KO synergistically enhance the expression of Htra3 and reduce the expression of Lin28a, leading to leukemia development by increased proliferation, reduced apoptosis, and enhanced block of differentiation, but without increasing the self-renewal activity.
Potent activity of carfilzomib combined with R428 against preclinical models of AML
Interestingly, we found that p53 haploinsufficiency or loss reduced the sensitivity of murine FLT3-ITD leukemia to crenolanib in vitro but did not reduce their sensitivity to midostaurin (Fig. 5a). Notably, the combination between FLT3 inhibitors and the MDM2 antagonist idasanutlin or the BCL2 inhibitor venetoclax did not enhance the induction of apoptosis in leukemic cells from ITD/ITD; p53+/− mice (data not shown). While p53 missense mutants cooperate with Nrf2 (NFE2L2) to activate proteasome gene transcription [33], resulting in resistance to the proteasome inhibitor carfilzomib, our comparative RNA-sequencing analysis did not reveal the activation of proteasome gene transcription by p53 KO. Consequently, exposure to carfilzomib showed a strong cytotoxic effect against ITD/ITD; p53+/− and ITD/ITD; p53−/− leukemic cells (Fig. 5a). Carfilzomib enhanced the cytotoxicity of crenolanib, midostaurin (both FLT3 inhibitors) or R428 (targeting AXL, the upstream kinase of FLT3 [34]) in murine leukemic cell lines and primary murine leukemic cells from ITD/ITD; p53+/− and ITD/ITD; p53−/− mice (Supplementary Fig. 12 and data not shown).
Fig. 5. Development of efficient therapies for ITD/ITD; p53 KO leukemia.

a Growth inhibition of ITD/ITD, ITD/ITD; p53+/− and ITD/ITD; p53−/− leukemic cells treated with crenolanib, midostaurin, and carfilzomib. Of note, ITD/ITD; p53−/− leukemic cells were highly sensitive to carfilzomib (IC50: 17.1 nM), although ITD/ITD; p53−/− leukemic cells appeared to have decreased sensitivity to carfilzomib compared with ITD/ITD and ITD/ITD; p53+/− cells (IC50: 5.2 nM and 6.8 nM, respectively). Apoptosis was analyzed by Annexin V and propidium iodide (PI) staining. Leukemic cells were treated with different concentrations of crenolanib, midostaurin, and carfilzomib for 48 h before flow cytometric analyses. Survival was defined as Annexin V/PI double-negative staining. Apoptosis was defined as Annexin V-positive or PI-positive staining. Each plot and bar represents the mean viability rate ± SD under treatment with the indicated inhibitors. T-ALL cell lines, but no AML cell lines were generated from individual mice. ITD/ITD, n = 6; ITD/ITD; p53+/−, n = 6; and ITD/ITD; p53−/−, n = 3. b MV4-11 and MV4-11 treated with Sorafenib were simultaneously subject to an antibody array. Treatment with Sorafentib significantly dephosphorylated FLT3 and induced strong AXL activation. Specificity for the phosphorylation of AXL was confirmed by western blot (Supplementary Fig. 13). c Effects of combined therapies in the MV4-11 AML cell line with FLT3-ITD, showing the 20-fold and 4-fold increased expression of MDM2 and MDM4, respectively. The results presented are the mean ± SD of at least three independent experiments. Combination index: carfilzomib/crenolanib = 0.36, carfilzomib/midostaurin = 0.25, carfilzomib/gilteritinib = 0.39, carfilzomib/R428 = 0.36. d Flow cytometric analyses showing the expression of FLT3 and AXL in patient #016. The negative controls were shown as inserts. AXL expression was also found in five of six myeloid leukemic cell lines (data not shown). e A representative flow cytometric analysis showing the strong induction of apoptosis, induced by the combinations of carfilzomib/midostaurin and carfilzomib/R428 in primary AML cells from patient #016 with FLT3-ITD and up to four-fold increased expression levels of MDM2 and MDM4. f Effects of combined therapies in primary patient samples. The results are presented as the mean ± SD of independent experiments. The combination of carfilzomib/R428 induced more apoptotic cells than any single treatment in all patient samples, whereas for other combined therapies an inferior effect was observed in some patient samples when compared with single treatments. For example, carfilzomib/crenolanib induced fewer apoptotic cells than carfilzomib in five patient samples. Up to 25-fold and 41-fold increased expression levels for MDM2 and MDM4, respectively, were observed in samples from FLT3 + patients by TagMan assays. Only one patient harbored a TP53 mutation, for which no additive/synergistic cytotoxicity was observed in the combined therapies. We took both FLT3-ITD and FLT3 WT AML samples for analyses because proteasome inhibitors can downregulate the protein expression of both FLT3-ITD and FLT3 WT [47], and AXL may play an important role in the pathogenesis of FLT3-ITD and FLT3 WT AML [34]. Carfilzomib: n = 22 patients; crenolanib: n = 22; midostaurin: n = 22; gilteritinib: n = 11; R428: n = 14; carfilzomib/crenolanib: n = 22; carfilzomib/midostaurin: n = 22; carfilzomib/gilteritinib: n = 11; carfilzomib/R428: n = 14. *p < 0.05, **p < 0.01, ***p < 0.001, ****p < 0.0001. g Survival curve of NSG mice transplanted with MV4-11 cells. Therapies were started on day 3 and stopped on day 23 (with the transplantation date representing day 0). *p < 0.05, **p < 0.01, ***p < 0.001.
We and others have obtained evidence to support a potential role of AXL in the pathogenesis of AML [35, 36]. In this study, we found that myeloid progenitor 32D cells were easily immortalized by AXL activation (Supplementary Fig. 13 and data not shown), suggesting a potential transforming activity for AXL in hematopoietic cells. Moreover, the inhibition of FLT3 led to the strong activation of AXL (Fig. 5b), which supported earlier reports that suggested drug resistance induced by AXL activation [37]. MV4-11 cells with wt-p53 were sensitive to all combined treatments, including carfilzomib/R428, in vitro (Fig. 5c). Low combination index (<0.4) for all combinations indicate a strong synergistic cytotoxicity in MV4-11 cells. We then analyzed expression and activation of AXL in primary samples from AML patients. The expression of AXL and the strong phosphorylation of AXL were found in 74% (37/50) of primary cells by flow cytometric analysis and in ~31% primary samples (28/90) by phospho-kinase antibody array, respectively (Fig. 5d, and data not shown). Almost all leukemic cells with expression of AXL were also positive for FLT3 (Fig. 5d). We then treated primary leukemic cells from AML patients with or without FLT3-ITD with combinations of carfilzomib and FLT3/AXL inhibition in vitro (Fig. 5e). Totally, all combination therapies induced more apoptotic cells than single therapies (Fig. 5f). However, a significant difference was only observed for carfilzomib /R428 and carfilzomib/midostaurin combinations. Moreover, we also treated samples from 2 AML patients with FLT3-ITD, who relapsed after treatment with FLT3 inhibitors. These leukemic cells were also highly sensitive to carfilzomib and combination with FLT3i/AXLi with a combination index of 0.98 for carfilzomib /R428 combination in one sample. Because monotherapy with carfilzomib or R428 showed only moderate effects in patients with AML [38], we tested the therapeutic effects of the carfilzomib/R428 combination in a xenotransplantation model in vivo. While all of the examined therapies significantly prolonged the survival of mice transplanted with MV4-11 cells, the combined therapy of carfilzomib and R428 was more efficient than any monotherapies with carfilzomib or R428 (Fig. 5g). The mean plasma concentrations of carfilzomib and R428 were among the therapeutic windows reported, which were for example 227 nM at 5 min and 5.6 µM at 6 h after treatment, respectively (Supplementary Table 4). Collectively, carfilzomib and R428 combination led to a strong additive/synergistic cytotoxicity in leukemic cells. Our data suggest that the combination of carfilzomib and R428 or FLT3 inhibitors (e.g., midostaurin) might represent promising treatment options, particularly in FLT3-ITD positive AML.
Discussion
Our study presents a powerful synergy between FLT3-ITD and p53 haploinsufficiency or loss in the induction of AML and emphasizes more careful analysis of p53 deregulation in AML. Our murine model is highly consistent with human disease. With an incidence of ~50%, absent or reduced p53 protein levels are common in AML. Approximately 5% of all AML patients feature a p53 deletion, whereas the frequency of p53 loss has been reported in 29% of patients with a complex aberrant karyotype [39]. Although the biallelic loss of TP53 is a rare event in AML, the TP53 tumor suppressor gene is frequently inactivated in tumors through a two-hit mechanism, in which one allele carries a missense mutation and the other allele is lost by the deletion of human chromosome 17p, which may give rise to the complete loss of wt-p53 function. Although the co-occurrence of a p53 deletion and FLT3-ITD is not common in AML, AML associated with FLT3-ITD mutations is highly associated with wt-p53 dysfunctions via various mechanisms [11]. For example, patients with FLT3-ITD and NPM1 mutations showed a 98% reduction in functional nuclear p53 protein compared with healthy controls [10]. Collectively, the reduced dosage of p53 is common in AML with FLT3-ITD. Our model provides proof-of-principle that demonstrates the important role of reduced p53 dosage in the pathogenesis of FLT3 + AML. In ongoing studies, we plan to explore whether MDM2 or MDM4 overexpression in the presence of FLT3-ITD can induce AML. Because p53 is regulated/modified by many non-genetic factors, analyzing the cooperation between a single non-genetic factor and FLT3-ITD during the induction of AML might be difficult. Notably, overexpressed p53 has also been found in the normal diploid karyotype, particularly in FLT3 mutant patients, and is associated with worse relapse-free survival [40]. Whether overexpressed p53 also promotes the development of FLT3 + AML remains to be determined.
Of note, our RNA sequencing analyses indicate a specific signaling interaction between ITD/ITD and p53 KO (Fig. 4c–j; Table 1). We propose that ITD/ITD and p53 KO synergistically induce AML via the upregulation of Htra3 and the downregulation of Lin28a (Fig. 6). Htra3 inhibited apoptosis, specifically promoted the proliferation of multipotent hematopoietic progenitors bearing FLT3-ITD in vivo, and enhanced the inhibition of differentiation by Lin28a. The upregulation of Htra3 and the downregulation of Lin28a, combined with the presence of ITD/ITD, induced AML with similar morphology as leukemic cells from double-transgenic mice. The extremely short latency of about one month suggest that other molecular event may not be required for AML induction by these three events, although the analyzed cases are limited. Because the role of serine proteases Htra in the leukemogenesis is largely unknown [27], we are currently investigating, in greater detail, the roles of Htra3 and its interaction with Lin28a in leukemogenesis in ongoing studies. It will be important to determine the expression of Htra3 and its impact on prognosis in a large cohort of patients with FLT3mut AML and dysfunction of wtp53. Moreover, the role of other upregulated or downregulated genes (e.g., Sowaha) in hematopoietic cell differentiation and leukemia development remains to be determined. The cooperation of FLT3-ITD and p53 haploinsufficiency or loss demonstrates some unique features. While p53 mutants may enhance the self-renewal activity and induce an abnormal karyotype [41], p53 haploinsufficiency or loss in the presence of FLT3-ITD enhanced proliferation and the blockade of cell differentiation, and reduced apoptosis rather than enabling the aberrant self-renewal activity and chromosomal instability. We demonstrate a clear difference between mutated p53 and reduced p53 dosage in terms of their contributions to FLT3 + AML development. While p53 haploinsufficiency or loss strongly promoted the leukemogenesis of FLT3-ITD (shortened survival and high incidence of AML, Fig. 1), Nabinger et al reported that p53R248W mutation did not cooperate with FLT3-ITD to induce AML and to reduce the survival of mice [6]. Further studies remain necessary to elucidate the mechanisms through which p53 haploinsufficiency or loss exerts different functions than p53 mutations in the presence of FLT3-ITD.
Fig. 6. Proposed model for the cooperation of FLT3-ITD and p53 haploinsufficiency or loss, and combined therapy.
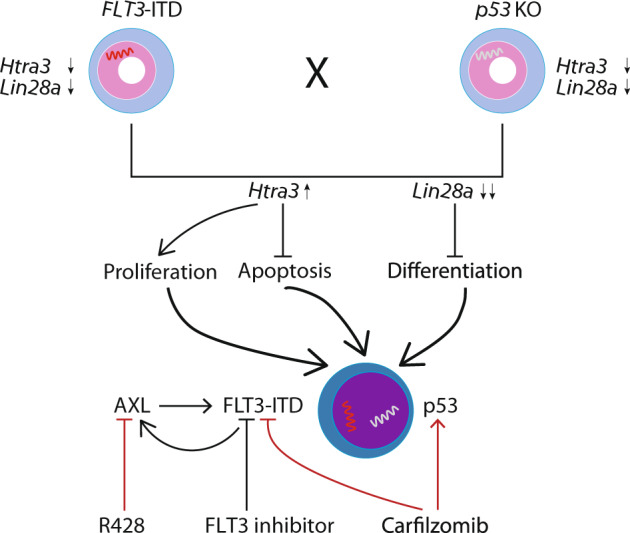
The cooperation of FLT3-ITD and p53 haploinsufficiency or loss synergistically induced the downregulation of Lin28a and the upregulation of Htra3, which led to increased proliferation, the inhibition of differentiation and apoptosis, and leukemia development. Htra3 is likely a central mediator, through inhibition of apoptosis and enhancement of proliferation [48]. Moreover, Htra3 also enhanced the inhibition of differentiation by Lin28a. Of note, Htra3 expression in normal HSCs/HPCs is not increased and similar as other mature blood cells (http://servers.binf.ku.dk/bloodspot/?gene). Proteasome inhibitors induced the cell death of FLT3-ITD-positive AML cells through the autophagy of FLT3-ITD and in part the activation of the p53 pathway [47]. Thus, cells with p53 loss can still be sensitive to proteasome inhibitor. AXL can positively regulate the constitutive activation of FLT3-ITD [34], whereas the inhibition of FLT3-ITD by FLT3 inhibitors can induce increased expression/activation of AXL (Fig. 5b), which might induce resistance to FLT3 inhibitors. The overexpression of AXL has been shown to mediate resistance to other kinase inhibitors [49].
Finally, our results may be relevant to the treatment of acute leukemia. Our data suggest that a clinical trial examining the combination of carfilzomib and R428 in AML patients could provide insightful new data. Because dysfunction of the p53 pathway by other reasons, such as the overexpression of MDM2/MDM4, is also often found in other human cancers [1], therapies containing carfilzomib might be an effective strategy for other human cancers with reduced p53 dosage or loss.
Supplementary information
Acknowledgements
Part of the data was presented in an oral session at the 2018 Annual Meeting of the American Society of Hematology in San Diego. We thank Rena-Mareike Struß, Thomas Fangmann, Maike Hagedorn, Jolanta Adolf, Christine Garen, Ellen Neumann, Kerstin Schantl, Iris Dallmann, Longlong Liu, and Nebal Nsraldeen for technical assistance, and Jörg Frühauf, Martin Werner, and Hans Grundtke (all MHH) for irradiation of animals. We are very grateful to Sonja Loges and Rolf Brekken for providing information of in vivo injection of R428 and carfilzomib, Chio Oka and Guiying Nie for providing Htra3 cDNA. We thank Massenspektrometrie – Metabolomic core unit for measurement of plasma concentration of R428, and Experimental mouse histopathology core unit (MHH) for paraffin bedding and section preparation. We appreciate the support of Christopher Baum, Axel Schambach, Adrian Schwarzer, Gernot Beutel, Jürgen Krauter, Michael Heuser, André Lechel, Lenhard Rudolph, Matthias Gaestel, André Bleich, Alexey Kotlyarov, and Alexandra Koch. This work was supported by the Deutsche José Carreras Leukämie-Stiftung (grants: 13/22 and 21R/2017), Deutsche Forschungsgemeinschaft (grants: Li 1608/2-1 and Li 1608/5-1), the Deutsche Krebshilfe (grant 108245), and Alfred & Angelika Gutermuth-Stiftung (projects 2016/3, 2017/3, 2018/3, 2019/2, and 2020/4). ZP and KH were supported by the China Scholarship Council (201406100008 and 2011638024).
Author contributions
MY and ZP performed experiments, collected, analyzed and interpreted data, and wrote the manuscript; KH performed research; GB performed histological analyses; GG performed mFISH analyses; ODB and ST performed RNA-seq analysis; MS, RS, AC, HL, ME, JS, JZ, KW, NvN, and LL performed experiments, interpreted data and provided support; AG performed part of cytological analyses and interpreted data; ZL conceived the concept, designed the studies, performed research, collected, analyzed and interpreted data, wrote the paper, and took responsibility in the construction of the whole manuscript.
Funding
Open Access funding enabled and organized by Projekt DEAL.
Competing interests
The authors declare no competing interests.
Footnotes
Publisher’s note Springer Nature remains neutral with regard to jurisdictional claims in published maps and institutional affiliations.
These authors contributed equally: Min Yang, Zengkai Pan.
Supplementary information
The online version contains supplementary material available at 10.1038/s41375-021-01452-6.
References
- 1.Levine AJ. p53: 800 million years of evolution and 40 years of discovery. Nat Rev Cancer. 2020;20:471–80. doi: 10.1038/s41568-020-0262-1. [DOI] [PubMed] [Google Scholar]
- 2.Hollstein M, Sidransky D, Vogelstein B, Harris CC. p53 mutations in human cancers. Science. 1991;253:49–53. doi: 10.1126/science.1905840. [DOI] [PubMed] [Google Scholar]
- 3.Papaemmanuil E, Gerstung M, Bullinger L, Gaidzik VI, Paschka P, Roberts ND, et al. Genomic classification and prognosis in acute myeloid leukemia. N. Engl J Med. 2016;374:2209–21. doi: 10.1056/NEJMoa1516192. [DOI] [PMC free article] [PubMed] [Google Scholar]
- 4.Lal R, Lind K, Heitzer E, Ulz P, Aubell K, Kashofer K, et al. Somatic TP53 mutations characterize preleukemic stem cells in acute myeloid leukemia. Blood. 2017;129:2587–91. doi: 10.1182/blood-2016-11-751008. [DOI] [PubMed] [Google Scholar]
- 5.Kadia TM, Jain P, Ravandi F, Garcia-Manero G, Andreef M, Takahashi K, et al. TP53 mutations in newly diagnosed acute myeloid leukemia: Clinicomolecular characteristics, response to therapy, and outcomes. Cancer. 2016;122:3484–91. doi: 10.1002/cncr.30203. [DOI] [PMC free article] [PubMed] [Google Scholar]
- 6.Nabinger SC, Chen S, Gao R, Yao C, Kobayashi M, Vemula S, et al. Mutant p53 enhances leukemia-initiating cell self-renewal to promote leukemia development. Leukemia. 2019;33:1535–9. doi: 10.1038/s41375-019-0377-0. [DOI] [PMC free article] [PubMed] [Google Scholar]
- 7.Fu L, Minden MD, Benchimol S. Translational regulation of human p53 gene expression. EMBO J. 1996;15:4392–401. [PMC free article] [PubMed] [Google Scholar]
- 8.Kastan MB, Radin AI, Kuerbitz SJ, Onyekwere O, Wolkow CA, Civin CI, et al. Levels of p53 protein increase with maturation in human hematopoietic cells. Cancer Res. 1991;51:4279–86. [PubMed] [Google Scholar]
- 9.Fenaux P, Preudhomme C, Quiquandon I, Jonveaux P, Lai JL, Vanrumbeke M, et al. Mutations of the P53 gene in acute myeloid leukaemia. Br J Haematol. 1992;80:178–83. doi: 10.1111/j.1365-2141.1992.tb08897.x. [DOI] [PubMed] [Google Scholar]
- 10.Seipel K, Marques MT, Bozzini MA, Meinken C, Mueller BU, Pabst T. Inactivation of the p53-KLF4-CEBPA axis in acute myeloid leukemia. Clin Cancer Res. 2016;22:746–56. doi: 10.1158/1078-0432.CCR-15-1054. [DOI] [PubMed] [Google Scholar]
- 11.Quintas-Cardama A, Hu C, Qutub A, Qiu YH, Zhang X, Post SM, et al. p53 pathway dysfunction is highly prevalent in acute myeloid leukemia independent of TP53 mutational status. Leukemia. 2017;31:1296–305. doi: 10.1038/leu.2016.350. [DOI] [PubMed] [Google Scholar]
- 12.Kurki S, Peltonen K, Latonen L, Kiviharju TM, Ojala PM, Meek D, et al. Nucleolar protein NPM interacts with HDM2 and protects tumor suppressor protein p53 from HDM2-mediated degradation. Cancer Cell. 2004;5:465–75. doi: 10.1016/s1535-6108(04)00110-2. [DOI] [PubMed] [Google Scholar]
- 13.Prokocimer M, Molchadsky A, Rotter V. Dysfunctional diversity of p53 proteins in adult acute myeloid leukemia: projections on diagnostic workup and therapy. Blood. 2017;130:699–712. doi: 10.1182/blood-2017-02-763086. [DOI] [PMC free article] [PubMed] [Google Scholar]
- 14.Uren AG, Kool J, Matentzoglu K, de Ridder J, Mattison J, van Uitert M, et al. Large-scale mutagenesis in p19(ARF)- and p53-deficient mice identifies cancer genes and their collaborative networks. Cell. 2008;133:727–41. doi: 10.1016/j.cell.2008.03.021. [DOI] [PMC free article] [PubMed] [Google Scholar]
- 15.Stone RM, Mandrekar SJ, Sanford BL, Laumann K, Geyer S, Bloomfield CD, et al. Midostaurin plus chemotherapy for acute myeloid leukemia with a FLT3 mutation. N Engl J Med. 2017;377:454–64. doi: 10.1056/NEJMoa1614359. [DOI] [PMC free article] [PubMed] [Google Scholar]
- 16.Schlenk RF, Dohner K, Krauter J, Frohling S, Corbacioglu A, Bullinger L, et al. Mutations and treatment outcome in cytogenetically normal acute myeloid leukemia. N Engl J Med. 2008;358:1909–18. doi: 10.1056/NEJMoa074306. [DOI] [PubMed] [Google Scholar]
- 17.Lee BH, Tothova Z, Levine RL, Anderson K, Buza-Vidas N, Cullen DE, et al. FLT3 mutations confer enhanced proliferation and survival properties to multipotent progenitors in a murine model of chronic myelomonocytic leukemia. Cancer Cell. 2007;12:367–80. doi: 10.1016/j.ccr.2007.08.031. [DOI] [PMC free article] [PubMed] [Google Scholar]
- 18.Jacks T, Remington L, Williams BO, Schmitt EM, Halachmi S, Bronson RT, et al. Tumor spectrum analysis in p53-mutant mice. Curr Biol. 1994;4:1–7. doi: 10.1016/s0960-9822(00)00002-6. [DOI] [PubMed] [Google Scholar]
- 19.Yang M, Huang K, Busche G, Ganser A, Li Z. Activation of TRKB receptor in murine hematopoietic stem/progenitor cells induced mastocytosis. Blood. 2014;124:1196–7. doi: 10.1182/blood-2014-03-560466. [DOI] [PubMed] [Google Scholar]
- 20.Prajeeth CK, Dittrich-Breiholz O, Talbot SR, Robert PA, Huehn J, Stangel M. IFN-gamma producing Th1 cells induce different transcriptional profiles in microglia and astrocytes. Front Cell Neurosci. 2018;12:352. doi: 10.3389/fncel.2018.00352. [DOI] [PMC free article] [PubMed] [Google Scholar]
- 21.Kustikova O, Fehse B, Modlich U, Yang M, Dullmann J, Kamino K, et al. Clonal dominance of hematopoietic stem cells triggered by retroviral gene marking. Science. 2005;308:1171–4. doi: 10.1126/science.1105063. [DOI] [PubMed] [Google Scholar]
- 22.Mupo A, Celani L, Dovey O, Cooper JL, Grove C, Rad R, et al. A powerful molecular synergy between mutant Nucleophosmin and Flt3-ITD drives acute myeloid leukemia in mice. Leukemia. 2013;27:1917–20. doi: 10.1038/leu.2013.77. [DOI] [PMC free article] [PubMed] [Google Scholar]
- 23.Yang L, Rodriguez B, Mayle A, Park HJ, Lin X, Luo M, et al. DNMT3A loss drives enhancer hypomethylation in FLT3-ITD-associated leukemias. Cancer Cell. 2016;29:922–34. doi: 10.1016/j.ccell.2016.05.003. [DOI] [PMC free article] [PubMed] [Google Scholar]
- 24.Huang K, Yang M, Pan Z, Heidel FH, Scherr M, Eder M, et al. Leukemogenic potency of the novel FLT3-N676K mutant. Ann Hematol. 2016;95:783–91. doi: 10.1007/s00277-016-2616-z. [DOI] [PubMed] [Google Scholar]
- 25.Love MI, Huber W, Anders S. Moderated estimation of fold change and dispersion for RNA-seq data with DESeq2. Genome Biol. 2014;15:550. doi: 10.1186/s13059-014-0550-8. [DOI] [PMC free article] [PubMed] [Google Scholar]
- 26.Network CGAR. Genomic and epigenomic landscapes of adult de novo acute myeloid leukemia. N Engl J Med. 2013;368:2059–74. doi: 10.1056/NEJMoa1301689. [DOI] [PMC free article] [PubMed] [Google Scholar]
- 27.Chien J, Campioni M, Shridhar V, Baldi A. HtrA serine proteases as potential therapeutic targets in cancer. Curr Cancer Drug Targets. 2009;9:451–68. doi: 10.2174/156800909788486704. [DOI] [PMC free article] [PubMed] [Google Scholar]
- 28.Tocharus J, Tsuchiya A, Kajikawa M, Ueta Y, Oka C, Kawaichi M. Developmentally regulated expression of mouse HtrA3 and its role as an inhibitor of TGF-beta signaling. Dev Growth Differ. 2004;46:257–74. doi: 10.1111/j.1440-169X.2004.00743.x. [DOI] [PubMed] [Google Scholar]
- 29.Chaudhuri AA, So AY, Mehta A, Minisandram A, Sinha N, Jonsson VD, et al. Oncomir miR-125b regulates hematopoiesis by targeting the gene Lin28A. Proc Natl Acad Sci USA. 2012;109:4233–8. doi: 10.1073/pnas.1200677109. [DOI] [PMC free article] [PubMed] [Google Scholar]
- 30.Shyh-Chang N, Daley GQ. Lin28: primal regulator of growth and metabolism in stem cells. Cell Stem Cell. 2013;12:395–406. doi: 10.1016/j.stem.2013.03.005. [DOI] [PMC free article] [PubMed] [Google Scholar]
- 31.Hinge A, Xu J, Javier J, Mose E, Kumar S, Kapur R, et al. p190-B RhoGAP and intracellular cytokine signals balance hematopoietic stem and progenitor cell self-renewal and differentiation. Nat Commun. 2017;8:14382. doi: 10.1038/ncomms14382. [DOI] [PMC free article] [PubMed] [Google Scholar]
- 32.Adolfsson J, Borge OJ, Bryder D, Theilgaard-Monch K, Astrand-Grundstrom I, Sitnicka E, et al. Upregulation of Flt3 expression within the bone marrow Lin(-)Sca1(+)c-kit(+) stem cell compartment is accompanied by loss of self-renewal capacity. Immunity. 2001;15:659–69. doi: 10.1016/s1074-7613(01)00220-5. [DOI] [PubMed] [Google Scholar]
- 33.Walerych D, Lisek K, Sommaggio R, Piazza S, Ciani Y, Dalla E, et al. Proteasome machinery is instrumental in a common gain-of-function program of the p53 missense mutants in cancer. Nat Cell Biol. 2016;18:897–909. doi: 10.1038/ncb3380. [DOI] [PubMed] [Google Scholar]
- 34.Park IK, Mishra A, Chandler J, Whitman SP, Marcucci G, Caligiuri MA. Inhibition of the receptor tyrosine kinase Axl impedes activation of the FLT3 internal tandem duplication in human acute myeloid leukemia: implications for Axl as a potential therapeutic target. Blood. 2013;121:2064–73. doi: 10.1182/blood-2012-07-444018. [DOI] [PMC free article] [PubMed] [Google Scholar]
- 35.Ben-Batalla I, Schultze A, Wroblewski M, Erdmann R, Heuser M, Waizenegger JS, et al. Axl, a prognostic and therapeutic target in acute myeloid leukemia mediates paracrine crosstalk of leukemia cells with bone marrow stroma. Blood. 2013;122:2443–52. doi: 10.1182/blood-2013-03-491431. [DOI] [PubMed] [Google Scholar]
- 36.Li Z, Kustikova OS, Kamino K, Neumann T, Rhein M, Grassman E, et al. Insertional mutagenesis by replication-deficient retroviral vectors encoding the large T oncogene. Ann N Y Acad Sci. 2007;1106:95–113. doi: 10.1196/annals.1392.003. [DOI] [PubMed] [Google Scholar]
- 37.Bester AC, Lee JD, Chavez A, Lee YR, Nachmani D, Vora S, et al. An integrated genome-wide CRISPRa approach to functionalize lncRNAs in drug resistance. Cell. 2018;173:649–64 e620. doi: 10.1016/j.cell.2018.03.052. [DOI] [PMC free article] [PubMed] [Google Scholar]
- 38.Wartman LD, Fiala MA, Fletcher T, Hawkins ER, Cashen A, DiPersio JF, et al. A phase I study of carfilzomib for relapsed or refractory acute myeloid and acute lymphoblastic leukemia. Leuk Lymphoma. 2016;57:728–30. doi: 10.3109/10428194.2015.1076930. [DOI] [PMC free article] [PubMed] [Google Scholar]
- 39.Seifert H, Mohr B, Thiede C, Oelschlagel U, Schakel U, Illmer T, et al. The prognostic impact of 17p (p53) deletion in 2272 adults with acute myeloid leukemia. Leukemia. 2009;23:656–63. doi: 10.1038/leu.2008.375. [DOI] [PubMed] [Google Scholar]
- 40.Assi R, Gur HD, Loghavi S, Konoplev SN, Konopleva M, Daver N, et al. P53 protein overexpression in de novo acute myeloid leukemia patients with normal diploid karyotype correlates with FLT3 internal tandem duplication and worse relapse-free survival. Am J Hematol. 2018;93:1376–83. doi: 10.1002/ajh.25255. [DOI] [PubMed] [Google Scholar]
- 41.Song H, Hollstein M, Xu Y. p53 gain-of-function cancer mutants induce genetic instability by inactivating ATM. Nat Cell Biol. 2007;9:573–80. doi: 10.1038/ncb1571. [DOI] [PubMed] [Google Scholar]
- 42.Pan Z, Yang M, Huang K, Busche G, Glage S, Ganser A, et al. Flow cytometric characterization of acute leukemia reveals a distinctive “blast gate” of murine T-lymphoblastic leukemia/lymphoma. Oncotarget. 2018;9:2320–8. doi: 10.18632/oncotarget.23410. [DOI] [PMC free article] [PubMed] [Google Scholar]
- 43.Chu SH, Heiser D, Li L, Kaplan I, Collector M, Huso D, et al. FLT3-ITD knockin impairs hematopoietic stem cell quiescence/homeostasis, leading to myeloproliferative neoplasm. Cell Stem Cell. 2012;11:346–58. doi: 10.1016/j.stem.2012.05.027. [DOI] [PMC free article] [PubMed] [Google Scholar]
- 44.Sitnicka E, Bryder D, Theilgaard-Monch K, Buza-Vidas N, Adolfsson J, Jacobsen SE. Key role of flt3 ligand in regulation of the common lymphoid progenitor but not in maintenance of the hematopoietic stem cell pool. Immunity. 2002;17:463–72. doi: 10.1016/s1074-7613(02)00419-3. [DOI] [PubMed] [Google Scholar]
- 45.Li Z, Dullmann J, Schiedlmeier B, Schmidt M, von Kalle C, Meyer J, et al. Murine leukemia induced by retroviral gene marking. Science. 2002;296:497. doi: 10.1126/science.1068893. [DOI] [PubMed] [Google Scholar]
- 46.Yang M, Busche G, Ganser A, Li Z. Morphology and quantitative composition of hematopoietic cells in murine bone marrow and spleen of healthy subjects. Ann Hematol. 2013;92:587–94. doi: 10.1007/s00277-012-1653-5. [DOI] [PubMed] [Google Scholar]
- 47.Larrue C, Saland E, Boutzen H, Vergez F, David M, Joffre C, et al. Proteasome inhibitors induce FLT3-ITD degradation through autophagy in AML cells. Blood. 2016;127:882–92. doi: 10.1182/blood-2015-05-646497. [DOI] [PubMed] [Google Scholar]
- 48.Evan GI, Vousden KH. Proliferation, cell cycle and apoptosis in cancer. Nature. 2001;411:342–8. doi: 10.1038/35077213. [DOI] [PubMed] [Google Scholar]
- 49.Gay CM, Balaji K, Byers LA. Giving AXL the axe: targeting AXL in human malignancy. Br J Cancer. 2017;116:415–23. doi: 10.1038/bjc.2016.428. [DOI] [PMC free article] [PubMed] [Google Scholar]
Associated Data
This section collects any data citations, data availability statements, or supplementary materials included in this article.