Abstract
Biased signaling of G protein-coupled receptors describes an ability of different ligands that preferentially activate an alternative downstream signaling pathway. In this work, we identified and characterized different N-terminal truncations of endogenous chemokine CCL15 as balanced or biased agonists targeting CCR1, and presented three cryogenic-electron microscopy structures of the CCR1–Gi complex in the ligand-free form or bound to different CCL15 truncations with a resolution of 2.6–2.9 Å, illustrating the structural basis of natural biased signaling that initiates an inflammation response. Complemented with pharmacological and computational studies, these structures revealed it was the conformational change of Tyr291 (Y2917.43) in CCR1 that triggered its polar network rearrangement in the orthosteric binding pocket and allosterically regulated the activation of β-arrestin signaling. Our structure of CCL15-bound CCR1 also exhibited a critical site for ligand binding distinct from many other chemokine–receptor complexes, providing new insights into the mode of chemokine recognition.
Subject terms: X-ray crystallography, Peptides, G protein-coupled receptors, Cell signalling
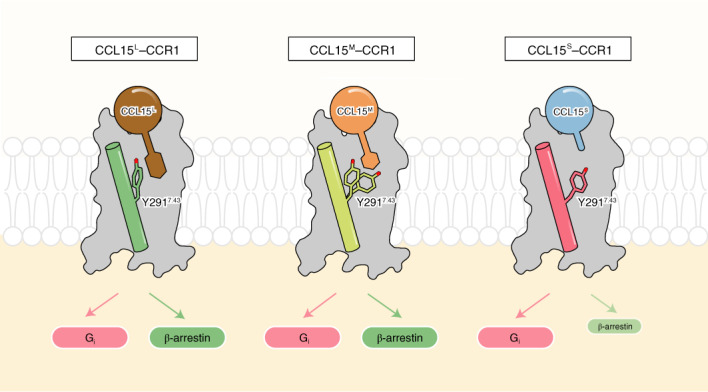
Cryo-EM structures of the CCR1–Gi complex with N-terminal truncations of the endogenous chemokine CCL15 revealed that the conformational change of Tyr291 in CCR1 regulates β-arrestin signaling.
Main
G protein-coupled receptors (GPCRs) constitute the largest family of transmembrane proteins that transmit extracellular stimulus across the plasma membrane and initiate cellular signaling pathways via coupling to heterotrimeric G proteins or β-arrestin1,2. In most cases, the activation of G proteins and β-arrestin corresponds to their own respective downstream effectors, thus performing distinct biological functions3. Specific ligands at some GPCRs, such as the type 1 angiotensin II receptor (AT1R), the neurotensin receptor 1 (NTSR1), the μ-opioid receptor (μOR) and the kappa opioid receptor (κOR), have been demonstrated to preferentially stimulate the G protein or β‐arrestin signaling pathways4–7. This phenomenon is termed ‘biased signaling’, provides new insights into GPCR biology and has a broad prospect of clinical applications, since selective activation or inhibition of specific signaling cascades has been proved to increase the therapeutic use of drugs targeting GPCRs with minimal side effects. Nevertheless, understanding of molecular mechanism underlining biased signaling has so far remained a challenging task3.
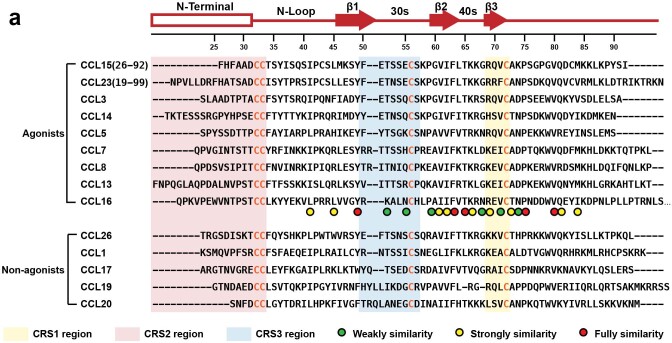
Chemokine–receptor interactions play an essential role in guiding leukocyte trafficking in immune surveillance and inflammation response8,9. According to the number and position of conserved cysteine residues in their N-terminal regions, chemokines are classified as cysteine, cysteine cysteine, cysteine X cysteine (CXC) and cysteine X3 cysteines (CX3C) subsets10–12. So far, at least 50 endogenous chemokines and 20 chemokine receptors have been identified in humans. The interactions between chemokines and their receptors exhibit considerable promiscuity, wherein most receptors can be recognized by multiple chemokines and most chemokines can activate multiple receptors. These chemokine–receptor interactions were previously regarded as redundant, but it is now appreciated that many chemokine interactions display biased agonism, enabling the fine-tuning of a chemokine-induced physiological response3,13. Among the chemokine receptor family, the chemokine receptor CCR1 unusually exhibits the most ligand promiscuity, which can recognize at least nine human cysteine cysteine chemokines, including CCL3, CCL5-9 (CCL6 and CCL9 are murine), CCL13–16 and CCL23 (refs. 9,11,14). CCR1 is widely expressed in various immune cells, and the knockdown of CCR1 has proved effective in suppressing the maturation and migration of immune cells, thus being regarded as an attractive drug target for the treatment of many autoimmune and allergic diseases, such as asthma15–18. Structure-based sequence alignment of CCR1 agonists shows high divergences at the N terminus, with the core region exhibiting conserved similarity, indicating that the N terminus of chemokines contributes to different signal transduction properties of CCR1 (Extended Data Fig. 1a).
Extended Data Fig. 1. Sequence alignment of CC chemokines.
a, Sequence alignment of nine human endogenous CCR1 agonists and other CCR1 non-agonists. The sequences of CRS1, CRS2 and CRS3 regions were highlighted in yellow, red and blue, respectively. And the positions which share fully conserved residues were marked with red circles. Residues with strongly similar properties (scoring > 0.5 in the Gonnet PAM 250 matrix) were marked with yellow circles. Residues with weakly similar properties (scoring < 0.5 in the Gonnet PAM 250 matrix) were marked with green circles.
CCL15 is an endogenous ligand of CCR1 at which the N-terminal signal peptide is cleaved up on its secretion to extracellular media. Identified by mass spectrometry of clinical samples, the N terminus of secreted CCL15 underwent further cleavage and exhibited different N-terminal truncations due to proteolytic processing mediated by activated mast cells and neutrophils19,20. For instance, CCL15 (22–92) was generated after digestion by either chymase or cathepsin G, while CCL15 (29–92) was produced by elastase treatment of CCL15 (ref. 19). More and more studies have suggested that the N terminus of chemokines worked as a determinant for CCR1 activation, as well as giving rise to biased agonism21,22. In this study, we found that compared to the longer form of CCL15 N-terminal truncation (CCL15 (26–92), termed CCL15L), the shorter forms of CCL15 N-terminal truncations (CCL15 (27–92), termed CCL15M, and CCL15 from (28–92) to (31–92), termed CCL15S) displayed poor efficacy in β-arrestin recruitment, thus performing stronger bias toward G protein pathways. To develop an understanding of the structural features that contributes to the biased signaling of CCR1, we determined three cryogenic-electron microscopy (cryo-EM) structures of human CCR1–Gi complexes either in the absence of ligand (apo) or in bound to CCL15L or CCL15M. Together with mutagenesis and functional studies, our results provide a new molecular mechanism to explain biased signaling of CCR1 and reveal the diverse binding modes of chemokine receptors that contribute to ligand-selective recognition.
Results
Biased signaling of CCR1 induced by CCL15
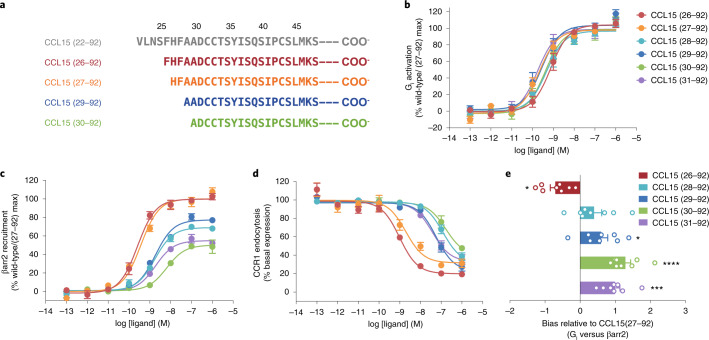
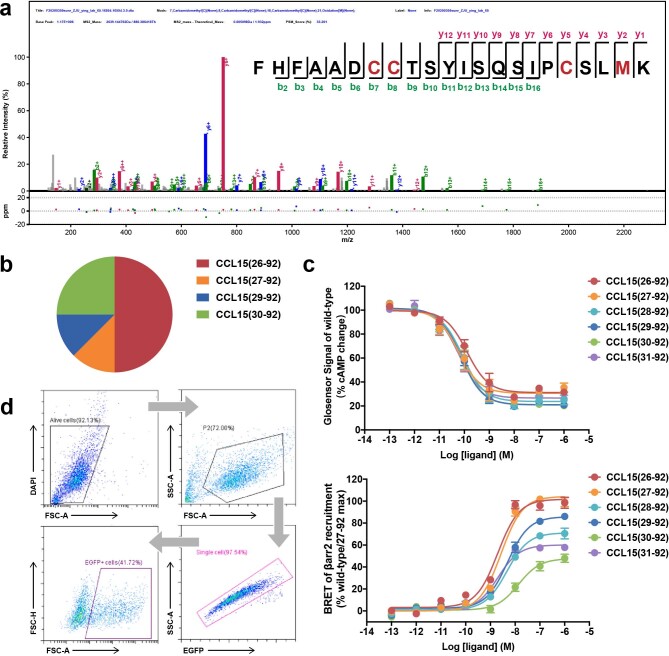
To study the mechanism for CCL15-mediated activation of CCR1, we purified CCL15 (22–92) from insect cells, which was reported as the longest N-terminal digestion product19. Identified by mass spectrometry, we found that the first determined residue of the CCL15 N terminus in the Gi-coupled complex was F26, and the main forms of CCL15 truncations involved in complex formation were CCL15 (26–92), CCL15 (27–92), CCL15 (29–92) and CCL15 (30–92) (Fig. 1a and Extended Data Fig. 2a,b). This phenomenon is consistent with the fact that physiological fluids, proinflammatory proteases or human cell supernatants can truncate the N termini of the cognate chemokines of CCR1, such as CCL6, CCL9, CCL15 and CCL23, thereby enabling the cleaved ligands to activate the receptor19,20.
Fig. 1. Natural biased agonism by CCL15 variants.
a, The N-terminal sequences of CCL15 truncations identified by mass spectrometry. b,c, The effects of different CCL15 N-terminal truncations on CCR1. Dose–response curves for CCL15-induced Gi1 signaling (b) and β-arrestin2 recruitment (c) were measured by NanoBiT assay. N = eight independent experiments, performed with single replicates. d, Dose–response curves of CCR1 endocytosis on THP-1 cells measured by the relative fluorescence intensity. NanoBiT data were normalized to the maximal response of CCL15 (27–92) on CCR1 (wild-type), and the percentage response in the endocytosis of CCR1 was normalized to cells without ligand treatment. N = six independent experiments, performed with single replicates. e, Bias factors of CCL15 truncations relative to CCL15 (27–92). Bias factors derived from curve fit parameters from b,c. The asterisk symbols indicated statistically significant difference (P = 0.015, P = 0.2682, P = 0.0426, P < 0.0001 and P = 0.0003 from top to bottom, *P < 0.05, ***P < 0.001, ****P < 0.0001) for CCL15 truncations versus CCL15 (27–92), determined by one-way ANOVA. N = 8 independent experiments, performed with single replicates. In d,e, all data are shown as mean ± s.e.m.
Extended Data Fig. 2. Comparisons among different N-terminal truncations of CCL15 in biased signaling.
a, The major form of N-terminal protein sequencing of the CCL15 involved in CCR1-Gi complex verified by the mass spectrometry. b, The proportions of CCL15 N-terminal truncations identified in CCL15-CCR1-Gi complex. c, The effects of different CCL15 N-terminal truncations on CCR1. Dose-response curves for CCL15-induced Gi1 signaling measured by Glosensor assay (upper, n= six independent experiments, performed with single replicates) and curves for β-arrestin signaling measured by BRET assay (lower, n= eight independent experiments, performed with single replicates) were shown; Data were shown as mean±SEM. d, Representative flow cytometry plots of flow analysis, illustrating the gating strategy for the endocytosis assay of HEK293T cells overexpresed CCR1. The endocytosis assay of THP-1 cells only included the first two shown steps.
Therefore, we separately purified N-terminal truncations of CCL15 from (26–92) to (31–92) and measured their effects on both G proteins and β-arrestin pathways. All N-terminal truncations of CCL15 exhibited almost the same or with only slightly reduced potency on G protein activation, but removal of the first two N-terminal amino acids, CCL15 truncations from (28–92) to (31–92), generated a strong decline in β-arrestin recruitment (Fig. 1b,c and Extended Data Fig. 2c). These results were in good agreement with the endocytosis of CCR1 in human monocytic THP-1 cells treated with corresponding N-terminal truncations, which was proposed to be mediated by β-arrestin pathway (Fig. 1d and Extended Data Fig. 2d)1. Thus, compared with CCL15 (26–92) and CCL15 (27–92), all the shorter variants, from CCL15 (28–92) to CCL15 (31–92), exhibited strong bias toward Gi-protein pathway (Fig. 1e and Supplementary Table 1). These results were consistent with previous reports on CCR1 that CCL15 (29–92) was biased toward both Gαi activation and cAMP inhibition relative to CCL15 (27–92)22.
Based on the above results, we anticipated that the N terminus of CCL15 was critical for β-arrestin recruitment when these truncations displayed low nanomolar potency albeit with reduced efficacy. Therefore, we grouped these N-terminal truncations of CCL15 into three categories: (1) CCL15 (26–92), which was a long form CCL15 (CCL15L) and showed a bias toward β-arrestin pathway; (2) CCL15 (27–92), which was a medium form CCL15 (CCL15M) and displayed balanced activation between G protein and β-arrestin pathways and (3) CCL15 truncations from (28–92) to (31–92), which were short forms of CCL15 (CCL15S) and were the strong G protein-biased agonists of CCR1. These findings revealed that the N-terminal region of CCL15 was not essential for CCR1-mediated G protein signaling, but critical for β-arrestin recruitment, suggesting the natural biased agonism of chemokine receptors under physiological conditions.
Cryo-EM structures of three CCR1–Gi complexes
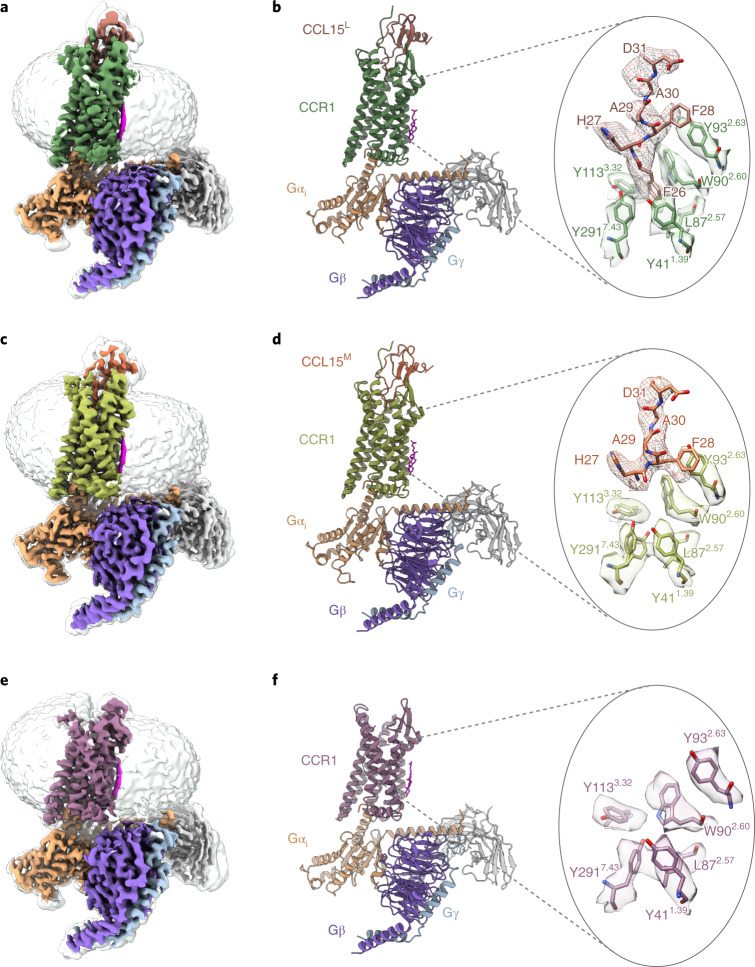
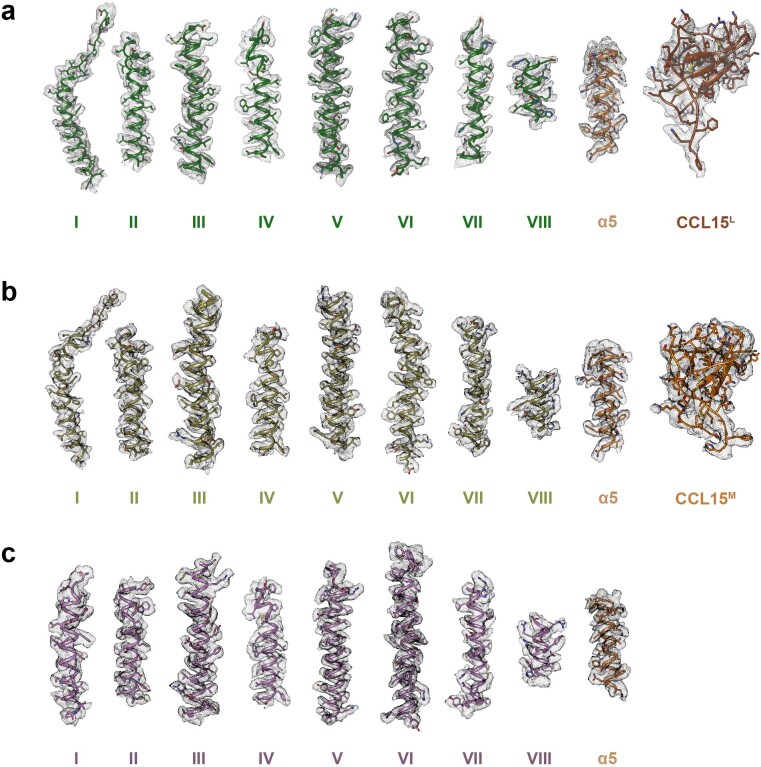
To investigate the molecular basis of signaling bias of CCR1, we aimed to obtain the structures of active CCR1 bound to CCL15 variants of different N-terminal truncations that displayed different bias profiles. The wild-type full-length human CCR1 and different ligands were coexpressed in insect cells for complex formation. A NanoBiT tethering strategy was used for complex stabilization (Extended Data Fig. 3)23,24. By using cryo-EM analyses, three structures of CCR1-Gi complexes in CCL15L-, CCL15M-bound and apo states were determined at overall resolutions of 2.6, 2.7 and 2.9 Å, respectively. Most side chains in the ligand and the seven transmembrane (7TM) domain of CCR1 in all three complexes could be clearly defined and enabled us to build and refine the near-atomic resolution structures of these complexes (Fig. 2 and Extended Data Figs. 4 and 5).
Extended Data Fig. 3. Single particle cryo-EM analysis of CCR1-Gi complexes in the apo and CCL15M-bound states.
a, Schematic diagrams of human CCR1-related constructs used in this study. b, Glosensor cAMP responses of CCR1 on wild-type and modified receptors respectively. N= four independent experiments, performed with single replicates. Data were shown as mean±SEM.
Fig. 2. Cryo-EM structures of CCR1–Gi complexes in the CCL15L-, CCL15M- bound and apo states.
a,c,e, Cryo-EM density maps of CCR1-Gi complexes bound to CCL15L (a), CCL15M(c) and in the apo state (e). b,d,f, Models of CCR1–Gi complexes in three states (left). Sandy brown, Gαi; purple, Gβ; sky blue, Gγ; gray, scFv16 and green, CCL15L-bound CCR1 (b); brown, CCL15L (b); dark khaki, CCL15M-bound CCR1 (d); orange, CCL15M (d) and plum, apo-state CCR1. Cryo-EM maps and atomic resolution models showing the binding pockets in the 7TM domains of two CCR1–Gi complexes (right). Atomic models and EM density shown as sticks and surfaces, respectively. EM density of CCL15L and CCL15M shown as a mesh.
Extended Data Fig. 4. Cryo-EM maps and refined structures.
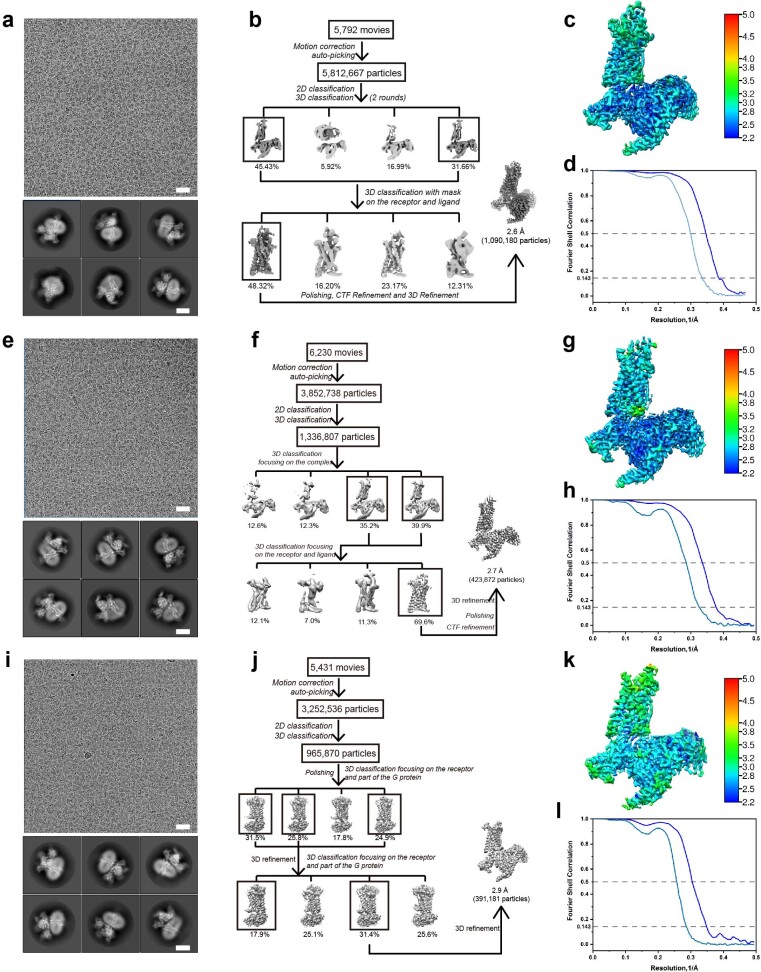
a, e, i, Representative cryo-EM micrographs (scale bar: 30 nm) of the CCL15L-CCR1-Gi (a), CCL15M-CCR1-Gi (e), and apo CCR1-Gi (i) complexes (upper) and representative 2D class (bottom) averages showing distinct secondary structure features from different views (scale bar: 5 nm). b, f, j, Flowchart of cryo-EM data analysis for CCL15L-CCR1-Gi (b), CCL15M-CCR1-Gi (f), and apo CCR1-Gi (j) complexes. c, g, k, Cryo-EM maps of the CCR1-Gi complexes in CCL15L- (c), CCL15M-bound (g), and apo (k) states, colored by local resolution (Å) calculated using Bsoft package. d, h, l, ‘Gold-standard’ FSC curves corresponding to CCL15L-CCR1-Gi (d), CCL15M-CCR1-Gi (h), and apo CCR1-Gi (l) complexes.
Extended Data Fig. 5. Structure comparison of CCR1 in CCL15L-, CCL15M-bound and apo states.
a, Cryo-EM density maps and the models of CCL15L-CCR1-Gi complex were shown for all transmembrane helices, helix 8 of CCR1, helix 5 of Gαi and CCL15L. b, Cryo-EM density maps and the models of CCL15M-CCR1-Gi complex were shown for all transmembrane helices, helix 8 of CCR1, helix 5 of Gαi and CCL15M. c, Cryo-EM density maps and the models of apo CCR1-Gi complex were shown for all transmembrane helices, helix 8 of CCR1 and helix 5 of Gαi.
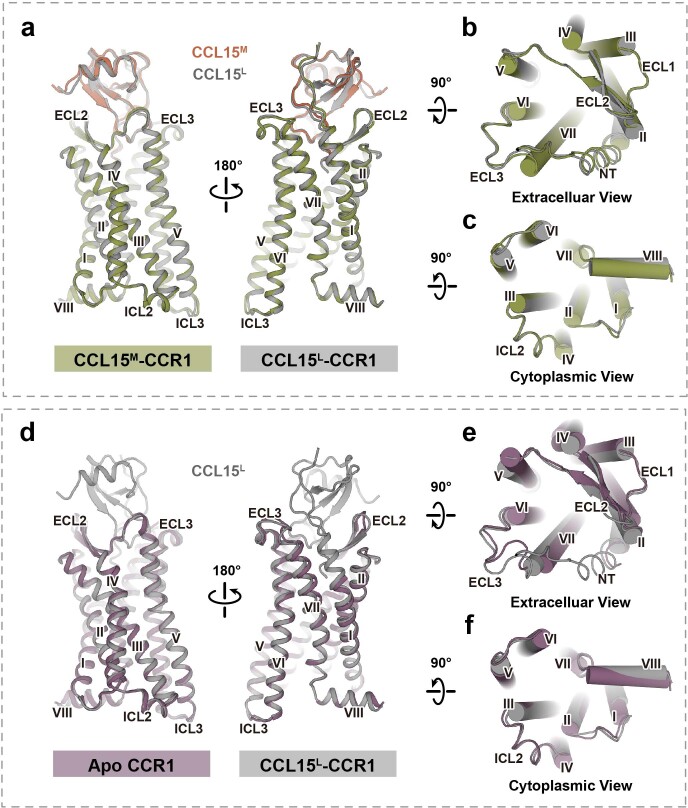
Globally, all these CCR1 structures were similar to each other in their backbone conformations (Extended Data Fig. 6), suggesting a common conformation for G protein activation of CCR1 among these structures. In addition, the structure of the apo CCR1–Gi complex resembles the CCL15L-, CCL15M-bound CCR1–Gi complexes, except that for the bottom of the ligand-binding pockets in apo CCR1 was empty. The formation of the CCR1–Gi complex in the absence of the ligand was consistent with CCR1, which exhibited higher basal activity of Gi signaling compared to other chemokine receptors such as CCR2, CCR5 and CCR10 (ref. 25).
Extended Data Fig. 6. Structural comparison among chemokine-receptor complexes.
a-c, Overlay of CCL15M (sandy brown)-CCR1 (dark khaki) with CCL15L-CCR1 (gray) complex. Side (a), extracellular (b) and cytoplasmic (c) views were shown. d-f, Overlay of apo CCR1 (plum) with CCL15L-CCR1 (grey) complex. Side (d), extracellular (e) and cytoplasmic (f) views were shown.
Recognition of CCR1 by CCL15
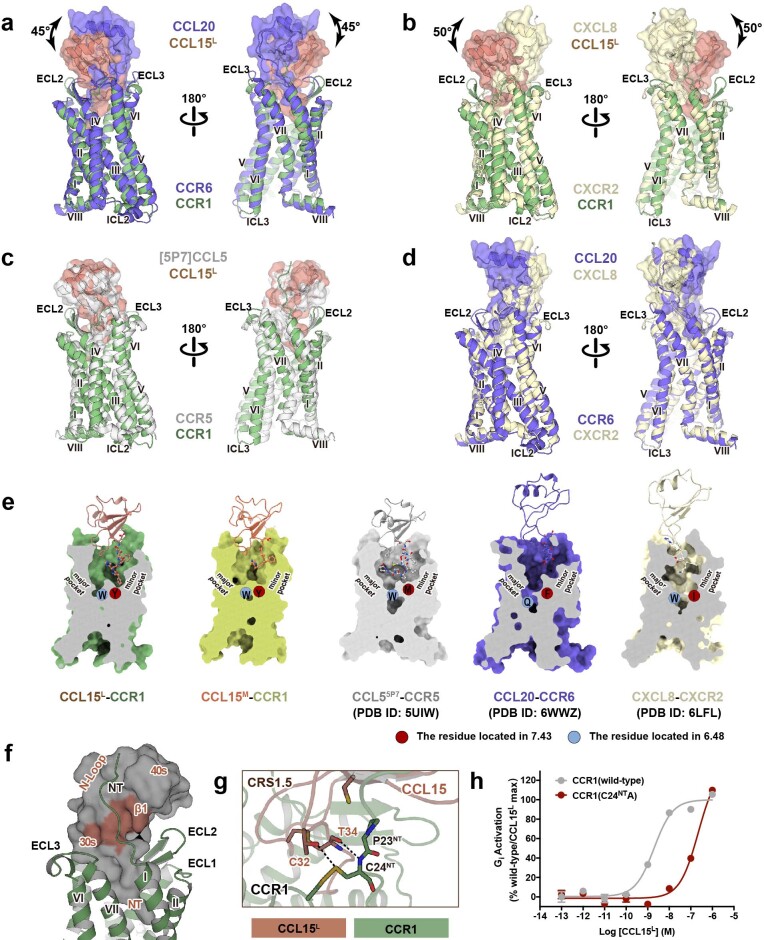
The recognition of a ligand by chemokine receptors is a complex process that is still not fully understood26–28. Since the structural alignment of CCL15L- and CCL15M-CCR1 complexes revealed almost the same binding mode between the ligand and receptor, we used the structure of CCL15L–CCR1 complex as a model for clarity of presentation to explore the mode of CCL15 binding to CCR1 (Extended Data Fig. 6). So far, only a few high-resolution structures of chemokine receptors in complex with chemokines have been resolved29–33. As shown in Extended Data Fig. 7a–d, the orientation of the globular core of CCL15L to CCR1 was similar to that of CCL55P7 bound to CCR5 (Protein Data Bank (PDB) ID 5UIW), but rotated by about 50° when compared to the corresponding chemokines in the CCL20–CCR6 (PDB ID 6WWZ) and CXCL8–CXCR2 (PDB ID 6LFL) complexes, suggesting that diverse recognition modes exist among these chemokine–receptor interactions29–31.
Extended Data Fig. 7. Comparison of apo, CCL15M-, and CCL15L-bound CCR1.
a-d, Different orientations of chemokines (shown as surface) relative to the corresponding receptors (shown as ribbon). CCL15L (brown)-CCR1 (green) vs. CCL20-CCR6 (purple) complex (a); CCL15L (brown)-CCR1(green) vs. CXCL8-CXCR2 (yellow) (b); CCL15L (brown)-CCR1 (green) vs. CCL55P7-CCR5 (grey) (c); CCL20-CCR6 (purple) vs. CXCL8-CXCR2 (yellow) (d). e, Surface cut-away views of chemokine-binding pockets. Receptors were shown as surface, chemokines were shown as ribbon with the N-terminus shown as ball and sticks. CCL20-CCR6 (PDB ID: 6WWZ); CXCL8-CXCR2 (PDB ID: 6LFL); CCL55P7-CCR5 (PDB ID: 5UIW). f, The CRS1.5 binding surface of CCL15L with CCR1. The CRS1.5 region was highlighted in brown. g, Details of interactions between CCR1 and CCL15L at the CRS1.5. Hydrogen bonds were depicted as dash lines. h, Effects of C24NTA mutation on Gi activation. N= three independent experiments, performed with single replicates. Data were shown as mean±SEM.
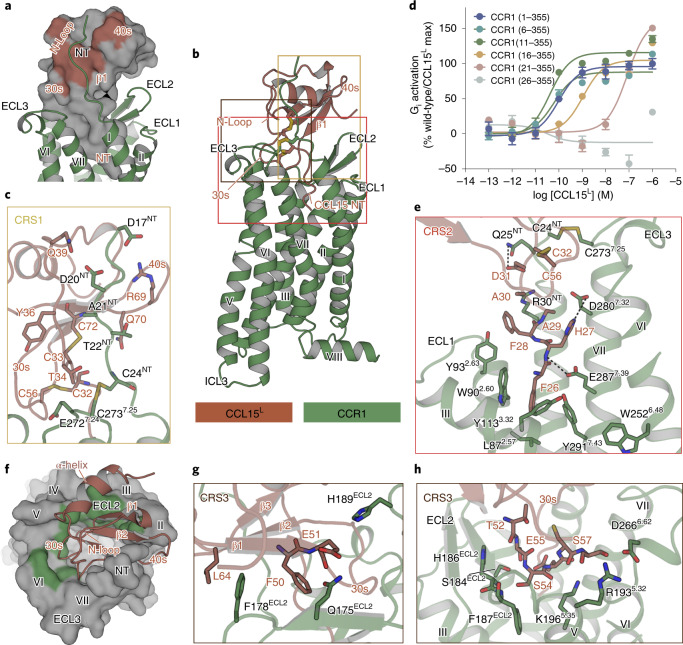
According to the classic ‘two-site’ model, the binding of chemokines to receptors involves two main interaction sites: (1) the chemokine recognition site 1 (CRS1), where the N terminus of the receptor interacts with the globular core of the chemokine and (2) the chemokine recognition site 2 (CRS2), where the N terminus of the chemokine interacts with the transmembrane binding pocket of the receptor32,34. The CCL15L-bound CCR1 structure shows that the CCL15L is stably anchored in the extracellular half of the receptor 7TM domain and inserts deeply into the helical bundle (Fig. 3a). At the CRS1, the N terminus of CCR1 (residue D17YGDATPCQK26) ran parallel with the N-loop region of CCL15L and fitted onto the groove formed by the N-loop and β3 strands of CCL15L, corresponding to a surface buried area of 745 Å2 (740.4 Å2 in CCL15M–CCR1) (Fig. 3a–c and Supplementary Table 3). Although the electron microscopy (EM) maps of both CCL15L–CCR1 and CCL15M–CCR1 only revealed the resolved density starting from the residue D17NT in the N terminus of CCR1, the various N-terminal truncations of the first 20 residues of CCR1 retained partial activities of CCL15-induced G protein activation as determined by NanoBiT assay. Furthermore, the deletion of the first 25 residues of CCR1 almost eliminated CCL15-induced receptor activity, suggesting that the CCR1 N terminus plays a critical role in ligand recognition and receptor activation (Fig. 3d). At the CRS2, the N terminus of CCL15L inserted into the pocket within the 7TM domain in a position that was notably deeper than other chemokines bound to the corresponding chemokine receptors (Extended Data Fig. 7e). As shown in Fig. 3e, the most N-terminal residue of CCL15L, F26, faced toward the minor pocket formed by L872.57, W902.60, Y1133.32 and Y2917.43. The backbone amide of H27 formed a hydrogen bond with E2877.39 (superscripts indicate the Ballesteros–Weinstein numbering scheme)35, consistent with the fact that the critical role of residue E2877.39, which is found in 74% of chemokine receptors and is crucial for chemokine-induced activity in many chemokine receptors36,37. Meanwhile, mutations of these F26-binding residues were previously reported to decrease the inhibitory effect of CCR1-targed small-molecule antagonists, suggesting that they were also important for activity of the antagonists38,39. It was also noteworthy that there were two side chain to side chain hydrogen bonds formed between H27 and D2807.32, D31 and Q25NT, respectively (Fig. 3e).
Fig. 3. The recognition of CCR1 by CCL15.
a, The CRS1 binding surface of CCL15L with CCR1, in which the N terminus of CCR1 interacted with the N-loop of CCL15L. CCR1 is shown as a ribbon diagram in green, CCL15L is shown as a gray surface and the interaction areas are highlighted in brown. b, Side view of the structure of CCL15L–CCR1 complex. c, The CRS1 binding surface of CCL15L with CCR1. d, The dose–response curves of Gi1 signaling in NanoBiT G protein dissociation assays of full-length and N-terminal sequential truncations of CCR1. Data are shown as mean ± s.e.m. N = eight independent experiments, performed with single replicates. e, The CRS2 binding surface of CCL15L with CCR1. f, The CRS3 binding surface of CCL15L with CCR1, in which the 30 s loop and β1 strand of CCL15L interacted with the extracellular region of CCR1. CCL15L is shown as a ribbon diagram in brown, CCR1 is shown as a gray surface and the interaction areas are highlighted in green. g,h, Details of interactions between CCR1 and CCL15L at the CRS3 in different views. Hydrogen bonds are depicted as dashed lines.
Besides the two classical chemokine recognition sites as discussed above, CCL55P7 was previously reported interacting with CCR5 through an epitope designated as the CRS1.5, where the 19PC20 motif of CCR5 packed against the conserved disulfide of its ligand29. CRS1.5 was also observed in the CCL15L–CCR1 complex, with hydrogen bonds forming between C24NT and CCL15 (Extended Data Fig. 7g). In agreement with that, C24NTA substitution significantly impaired the activation of the receptor (Extended Data Fig. 7h). Furthermore, additional interactions were observed between CCL15L and CCR1, where β1-β2 strands and the 30s loop (residue 50FETSSECS57) of CCL15L were found to interact with ECLs 2–3, and with TMs 5–6 of CCR1 (Fig. 3f–h). This recognition site was also observed in the CCL5[5P7]–CCR5 complex, which was designated as the CRS3 hereafter. The buried surface areas of the CRS3 of CCR1 (700 Å2 in CCL15L–CCR1 and 748.2 Å2 in CCL15M–CCR1, respectively) were comparable to the corresponding area in the CCL55P7–CCR5 complex (698.5 Å2), far more significant than that in other chemokine receptor structures including the CXCL8–CXCR2 (300 Å2) and CCL20-CCR6 (448 Å2) complexes (Supplementary Table 3). The CCL15L β1 strand ran antiparallel with ECL2 of CCR1 where these two parts interacted with each other primarily through hydrophobic effects. Meanwhile, the 30s loop of CCL15L submerged into the 7TM pocket of CCR1, where it made contact with ECL2 and ECL3, and with TM5 and TM6 through comprehensive hydrogen bonds and hydrophobic interactions (Fig. 3g,h). Sequence alignment showed that the β1–β2 strands and the 30s loop were relatively more conserved than the N-loop among the endogenous ligands of CCR1, indicating the CRS3 might be a major determinant for ligand binding of CCR1 (Extended Data Fig. 1a).
Y7.43 acted as a ‘toggle switch’ for biased signaling
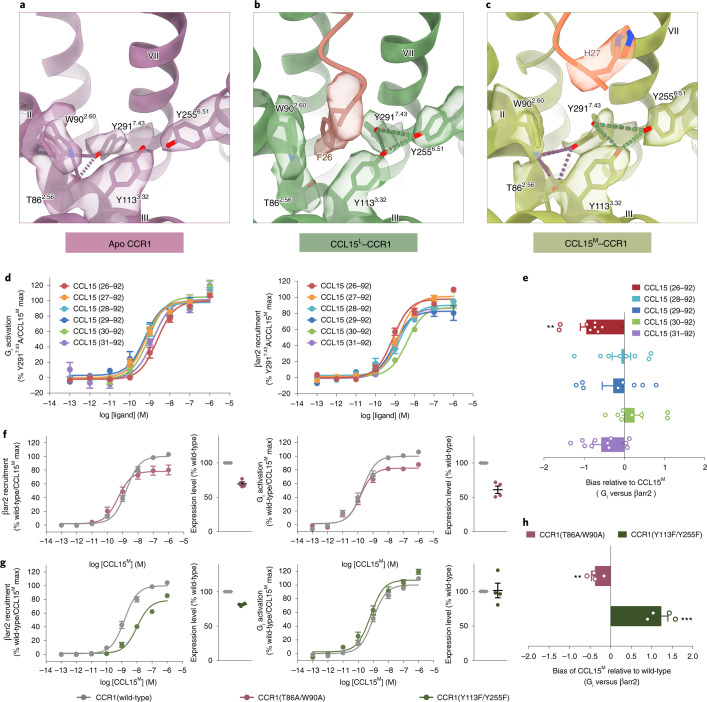
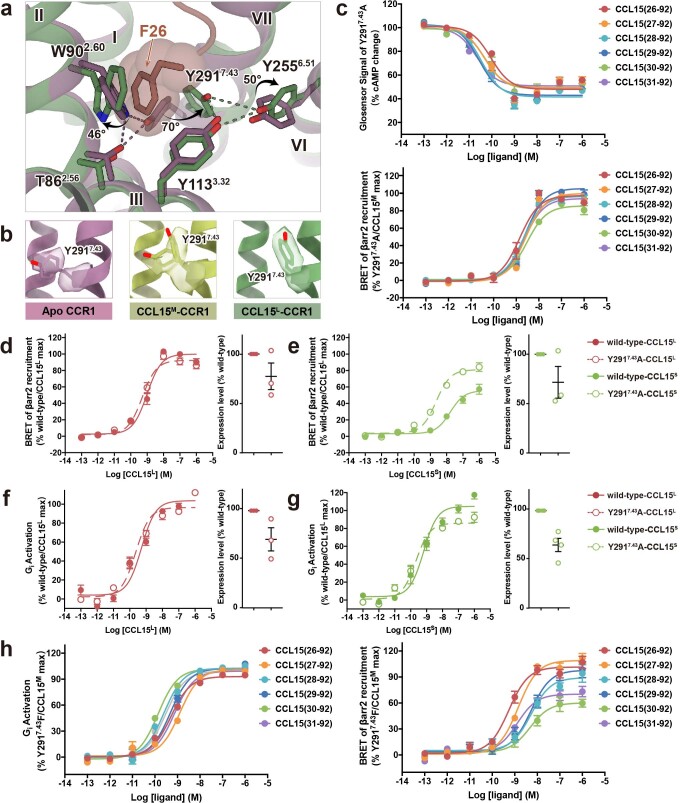
It is widely accepted that interactions between biased agonists and GPCRs result in the stabilization of a unique conformation adopted by the receptor that preferentially activates one downstream signaling2. Structural comparison of the extracellular pocket core of CCR1 among CCL15L-, CCL15M-bound and apo states was performed for the study of biased signaling. In the extracellular pocket core of apo CCR1, the side chain of Y2917.43 pointed toward TM2, forming hydrogen bonds with T862.56 and W902.60 (Fig. 4a). On the binding of the CCL15L into the 7TM pocket of CCR1, the aromatic group of CCL15 F26 formed strong interactions with W902.60 and Y2917.43. Hence, the resulting steric hindrance pushed the side chain of W902.60 and Y2917.43 to sway from their original positions by 46° and 70°, respectively, thereby breaking the Y2917.43–W902.60–T862.56 polar network (Extended Data Fig. 8a). Consequently, the released Y2917.43 then formed hydrogen bonds with Y1133.32 and Y2556.51, establishing CCR1 in a conformation favorable for β-arrestin recruitment without strongly influencing G protein signaling (Figs. 1e and 4b). The density of Y7.43 in the CCL15M–CCR1 complex displayed two alternative conformations, with one conformation resembling the CCL15L-bound state and the other resembling the apo CCR1 state (Fig. 4c and Extended Data Fig. 8b). These findings illustrated that the CCL15M-induced conformation of Y7.43 was flexible and therefore retained partial capability of β-arrestin recruitment, which accounted reasonably well for the functional results (Fig. 1c,d and Extended Data Fig. 2c).
Fig. 4. Structural basis of signal bias in CCR1.
a–c, Close-up view of the CCL15-binding pocket of CCR1s in apo (a), CCL15L-bound (b) and CCL15M-bound (c) states. The EM density of F26 (b) and H27 (c) of CCL15, and residues T862.56, W902.60, Y1133.32, Y2556.51 and Y2917.43 of CCR1 are shown. Hydrogen bonds were depicted as dash lines. d, The effects of CCL15 truncations on CCR1(Y2917.43A). Dose–response curves for CCL15-induced β-arrestin2 recruitment (left) and Gi1 signaling (right) measured by NanoBiT assay. N = eight independent experiments, performed with single replicates. e, Bias factors of CCL15 truncations relative to CCL15M. Bias factors derived from curve fit parameters from d. N = eight independent experiments, performed with single replicates. The asterisk symbols indicate statistically significant difference (P = 0.0067, P = 0.9986, P = 0.7725, P < 0.8323 and P = 0.1613 from top to bottom, **P < 0.01) for CCL15 truncations versus CCL15 (27–92), determined by one-way ANOVA. f,g, The effects of CCR1(T862.56A/W902.60A) (f) and CCR1(Y1133.32F/Y2556.51F) (g) on CCL15M-induced activation. N = four independent experiments, performed with quadruple replicates. h, Bias signaling induced by CCL15M on CCR1(T862.56A/W902.60A) and CCR1(Y1133.32F/Y2556.51F) relative to CCR1(wild-type). Bias factors derived from curve fit parameters from d. N = four independent experiments, performed with quadruple replicates. P values were calculated using a two-tailed Student’s t-test. The asterisk symbols indicate statistically significant difference (P = 0.042 and 0.0003, from top to bottom, **P < 0.01, ***P < 0.001). In d–h, all data are shown as mean ± s.e.m.
Extended Data Fig. 8. Molecular dynamics simulations.
a, The orthosteric binding pocket of CCL15L-bound and apo CCR1. The hydrogen bonds were depicted as dash lines. b, EM density of residue Y2917.43 in CCL15L-bound (left), CCL15M-bound (middle) and apo state (right) CCR1. c, CCL15 truncations-induced Gi1 (upper) and β-arrestin2 (bottom) signaling on CCR1 (Y2917.43A), measured by Glosensor and BRET assays, respectively. N= six (upper) or eight (bottom) independent experiments, performed with single replicates. d-g, The β-arrestin2 (d-e) and Gi signaling (f-g) induced by CCL15L (d, f) and CCL15S [CCL15(30-92)] (e, g). N= three (d-e) or four (g) independent experiments, performed with quadruple replicates. h, CCL15 truncations-induced Gi1 (left) and β-arrestin2 (right) signaling on CCR1 (Y2917.43F), measured by NanoBiT and BRET assays, respectively. N= four (left) or eight (right) independent experiments, performed with single replicates. In c-h, all data were shown as mean±SEM.
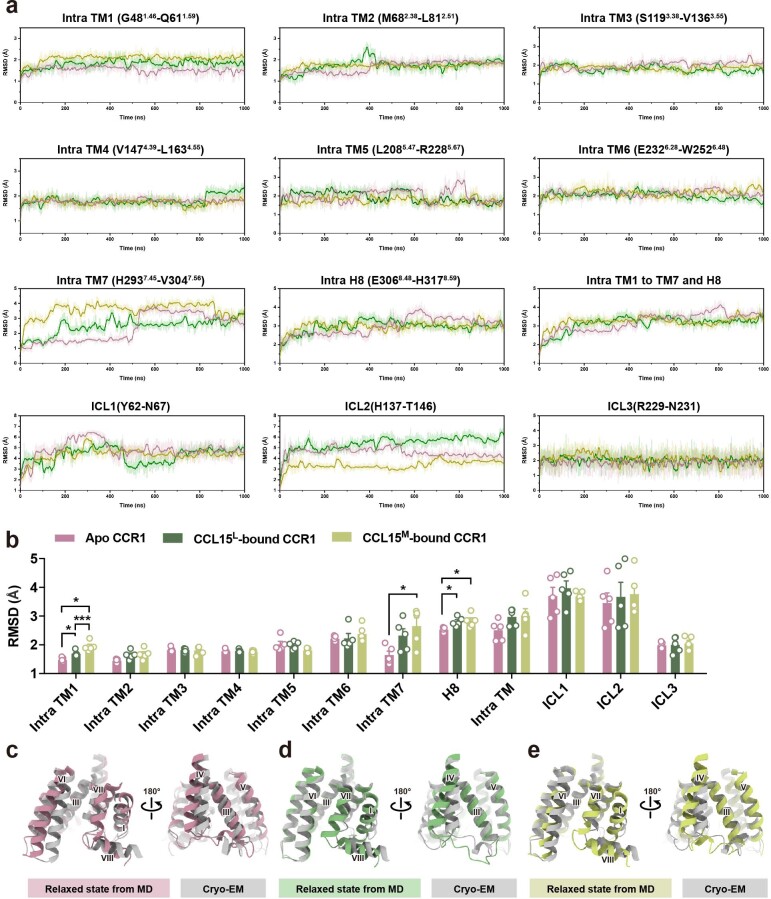
Consistently, the variance of β-arrestin recruitment among all CCL15 N-terminal truncations was significantly decreased with alanine substitution of Y2917.43 in CCR1. By contrast, the effect of Y2917.43A mutation on G protein activation was relatively smaller, resulting in a strong decline in signaling bias of most CCL15S truncations compared to CCL15M (Fig. 4d,e, Extended Data Fig. 8c and Supplementary Table 5). As shown in Extended Data Fig. 8d,e, a Y2917.43A mutation significantly enhanced the CCL15S-induced β-arrestin recruitment pathway of CCR1, but hardly influenced either the CCL15S-induced G protein activation or any downstream signaling induced by CCL15L. A phenylalanine mutation of Y2917.43 in CCR1 was observed to be not strong enough to destroy the biased signaling induced by CCL15S (Extended Data Fig. 8f). Taken together, these results indicate that it was the hydrophobic interaction between F26 and Y2917.43 that triggered the conformational change of Y2917.43, playing a critical role in β-arrestin recruitment. The side chain of Y2917.43 seemed to be unfavorable for β-arrestin recruitment in the presence of CCL15S. Moreover, molecular dynamics simulations of CCR1 with the protein removed showed that three distinctive structural configurations in the orthosteric pocket induced different conformational dynamics at the cytoplasmic half of the receptor, especially at the TM1, TM7 and H8 regions. These results indicate the differential conformational dynamics in response to the extracellular polar network exchange, which might contribute to the natural biased agonism of CCR1 (Extended Data Fig. 9).
Extended Data Fig. 9. Effects of mutations in biased signaling.
a, Representative RMSD analysis of all cytoplasmic part TMs, H8 and ICL region (apo CCR1, plum; CCL15L-bound CCR1, green; CCL15M-bound, dark khaki). b, Statistical analysis preformed on RMSD values. Error bars represented mean and SEM from five replicates. The asterisk symbols indicated statistically significant difference (*P <0.05, ***P <0.001) among CCR1 in different states by two-way ANOVA. c-e, Relaxed state of apo (c, plum), CCL15L-bound (d, green), and CCL15L-bound (e, dark khaki) CCR1s from 1us simulation snapshots with their cryo-EM structures (dark grey), respectively.
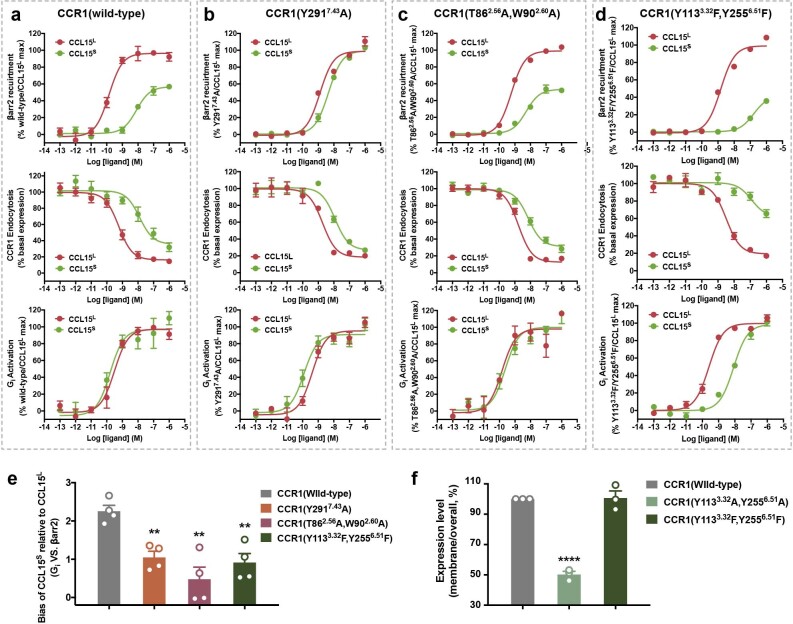
Furthermore, mutations of the complementary residues in the polar networks including the T862.56A/W902.60A and the Y1133.32F/Y2556.51F mutations, were also observed to reduce the difference of signal bias between CCL15S and CCL15L, suggesting that the residues within this region were important for signal transduction of CCR1 (Extended Data Fig. 10a–e). It should be mentioned that the mutation of Y1133.32A/Y2556.51A lead to an almost complete loss of CCR1 expression localized on plasma membrane, suggesting that the residues of Y1133.32 and Y2556.51 participated in maintaining the three-dimensional (3D) structure of CCR1 (Extended Data Fig. 10f). The T862.56A/W902.60A mutant displayed an increased signaling bias toward β-arrestin pathway, while the Y1133.32F/Y2556.51F mutation increased the bias toward G protein signaling (Fig. 4f-h and Supplementary Table 6). Taken together, these results demonstrated that distinct rotamers of Y2917.43 in CCR1 served as a sensor to discriminate different forms of CCL15 truncations, and mutations that disturbed the equilibrium balance of the intracellular polar network of Y2917.43 triggered biased signaling of CCR1.
Extended Data Fig. 10. Effects of mutations in biased signaling.
a-d, Dose-response curves of β-arrestin recruitment (upper), endocytosis (middle) and Gi activation (bottom) on CCR1(wild-type) (a), CCR1(Y2917.43A) (b), CCR1(T862.56A/W902.60A) (c) and CCR1(Y1133.32F/Y2556.51F) (d) induced by CCL15L and CCL15S [CCL15(30-92)]. N= three independent experiments for the endocytosis on CCR1(Y2917.43A) and CCR1(Y1133.32F/Y2556.51F), performed with single replicates. N= four independent experiments for the others, performed with single replicates. e, Biased factors of CCL15S [CCL15(30-92)] on wild-type and mutational CCR1s relative to CCL15L. N= four independent experiments, performed with single replicates. The asterisk symbols indicated statistically significant difference (P =0.0072, P =0.0004, and P=0.0034 from left to right, **P <0.01) for mutants vs. wild-type CCR1 as determined by one-way ANOVA. f, The proportion of membrane to total expression of receptors. N= three independent experiments, performed with single replicates. P values were calculated using two-tailed Student’s t-test. The asterisk symbols indicated statistically significant difference (P <0.001, and P=0.9789 from left to right, ****P <0.0001) for mutants vs. wild-type CCR1. In a-f, all data were shown as mean±SEM.
Discussion
Innate immune cells express multiple chemokine receptors and chemokines to control their migration, activation, differentiation and survival. At a cellular level, chemokines can synergize or antagonize with each other for downstream signal transduction. For instance, chemokine receptors not only could be stimulated by chemokines for G protein recruitments, but also undergo internalization on some chemokine agonist binding, leading to impairment of other chemokines’ efficacies. Therefore, molecular mechanisms of chemokine regulation and signaling bias of chemokine receptors are required for understanding of their functional intricacies.
In this paper, we identified and characterized the biased signaling properties of different CCL15 variants and their binding to CCR1. While the longer form of CCL15 (CCL15L) displayed β-arrestin-biased signaling, the shorter forms of CCL15 (CCL15S) showed gradual biased agonism toward Gi-mediated signaling (Fig. 1). The cryo-EM structures we reported here complemented the molecular mechanisms of immunomodulation induced by these endogenous chemokines. Structural alignments revealed that CCL15 resembled an orientation similar to CCL5[5P7]–CCR5 (PDB ID 5UIW), but rotated by about 50° when compared to other chemokine–receptor complexes. This phenomenon suggested that at least two distinct binding modes existed in the chemokine recognition system (Extended Data Fig. 7a–d). In addition, both the CCL15–CCR1 and CCL5[5P7]–CCR5 complexes showed a new recognition site (the CRS3), where the 30s loop of the ligand was submerged into the 7TM pocket of its receptor, demonstrating it is a major determinant for ligand binding of CCR1 and CCR3.
Structural comparisons and functional experiments confirmed that conformational rearrangement of Y7.43 and exchange of polar networks in the orthosteric binding pocket of CCR1 lead to strongly biased signaling. In particular, the longer form of CCL15 (CCL15L), which has a significant interaction with Y7.43, displayed strong activation of both Gi protein and β-arrestin pathways. The shorter forms of CCL15 forms (CCL15S) have impaired ability to activate the β-arrestin pathway but not Gi-mediated signaling, making them endogenous biased agonists prone to stimulating the G protein pathway. Y7.43 is conserved over 90 class A GPCRs, and 65 class A GPCRs have at least one polar residue at both polar network sides, including the μOR, κOR and AT1R (Supplementary Table 7). In two recent studies on the AT1R, Y7.43 was also found to be important for the allosteric regulation of receptor conformations in response to ligands with different bias profiles4,40. Unlike our observation in CCR1, Y7.43 in AT1R was proposed to be critical for ligand-dependent coupling of Gq signaling rather than β-arrestin coupling. Although the ultimate response to the movement of Y7.43 in CCR1 and AT1R was different, Y7.43 in both receptors was involved in determining the conformation of the intracellular half of TM7, and played a critical role in modulating downstream signaling. The side chain of Y7.43 in both CCL15M–CCR1 and AngII-AT1R complexes displayed highly dynamic changes, which seemed to be typical for more balanced ligands.
Together, our results provide structural insights into chemokine recognition, biased signaling and pharmacology of CCR1. Although CCR1 has been regarded as a candidate target for autoimmune and allergic diseases for a long time, the success of CCR1-targeted drug development has been limited. Manipulating the conformational exchange of the polar networks in the receptor orthosteric binding pocket to achieve bias signaling could be a general framework for the GPCRs with the conserved Y7.43, allowing rational design of biased ligands with an ultimate aim to achieve function-selective therapeutics with fewer side effects.
Methods
Expression and purification of CCL15 N-terminal truncations
The full-length of human CCL15 (1–92) complementary DNA was bought from Miaolingbio. The sequence of CCL15 (26–92) was cloned into a modified pFastBac1 vector, containing a GP67 signal peptide at the N terminus before the ligand to facilitate protein secretion. A maltose-binding protein (MBP) tag followed by a C-terminal 8*His tag was fused into the C terminal of CCL15 (26–92) with a linker containing a 3C protease cleavage site (LEVLFQGP). Using the bac-to-bac system, CCL15 (26–92)-3C-MBP-8*His was overexpressed by High Five insect cells. Insect cell cultures were grown in protein-free insect cell culture medium (Expression Systems ESF 921). After 48 h, the culture medium was collected and the initial purification was performed using Ni-NTA affinity chromatography (GE Healthcare). CCL15 (26–92)-3C-MBP-8*His was eluted with high imidazole elution buffer (20 mM HEPES pH 7.5, 100 mM NaCl and 250 mM imidazole). Then, the removal of C-terminal MBP and 8*His tag were achieved by 3C protease digestion (1:100). Next, 10% (w/v) glycerol was added together with 3C protease. Finally, purification to homogeneity of CCL15 (26–92) was achieved by size exclusion chromatography on a SuperdexTM 75 Increase 10/300 GL column (GE Healthcare) in size exclusion chromatography buffer (20 mM HEPES pH 7.5, 100 mM NaCl and 10% (w/v) glycerol), with the separation of CCL15 (26–92), 3C protease and MPB. About 1 mg of target proteins could be obtained from 1 l of culture medium. The other N-terminal-truncated CCL15 analogs were obtained by following a similar strategy to that described above, with the sequence of CCL15 (26–92) replaced by other truncations in the construction of recombinant plasmids.
GloSensor cAMP assay
We fused a flag-tag into the N terminal of full-length CCR1, and cloned into pcDNA3.1 plasmids. Human embryonic kidney 293T (HEK293T) cells were transfected with a plasmid mixture consisting of pcDNA3.1-flag-CCR1 and the cAMP biosensor GloSensor-22F (Promega) at a ratio of 2:1. After 24 h, transfected cells were plated onto a 96-well plate, which was treated with cell adherent reagent (Applygen) in advance. After another 12 h, cells were treated with Hank’s balanced salt solution for starvation and then incubated in CO2-independent media containing 2% GloSensor cAMP Reagent (Promega) at a volume of 50 μl per well. Then 1 μM Forskolin (5.5 μl) (Sigma) was added to each well and incubated for 20 min at room temperature before measurements for baseline luminescence (Spark Multimode microplate reader, TECAN). Next, test ligands (CCL15 variants, 6 μl) were added at different concentrations from 10−6 to 10−13 M. All luminescence values were first normalized by the initial counts before ligand treatments. Fold-change signals over the treatment of the lowest CCL15 concentration were used to show intracellular cAMP response. We carried out nonlinear regression analysis using a sigmoidal dose response in GraphPad Prism to calculate the values of Emax and half-maximum effective concentration (EC50).
Bioluminescence resonance energy transfer (BRET) assay
β-arrestin recruitment was measured by a BRET assay. The Rluc8 fragment was inserted into the C terminal of CCR1 (1–327 aa) with a linker of 6*His. The Venus fragment was inserted into the N terminal of β-arrestin2. These sequences were then cloned into pBiT1.1 plasmids (Promega). HEK293T cells were transiently transfected with CCR1-Rluc8 and Venus-β-arrestin2 (1:1). The transfected cells were seeded onto a cell adherent reagent (Applygen)-coated plate (Corning). After 48 h, cells were washed once and maintained in the buffer (5 mM HEPES pH 7.4 and 0.01% BSA) at a volume of 20 µl per well. Then, the transfected cells were stimulated with ligands (5 µl) at different concentrations from (10−6 to 10−13 M) for 40 min. After the addition of luciferase substrate coelenterazine h (5 µM), the BRET signals were determined as the ratio of light emitted by Venus-tagged biosensors and light emitted by Rluc8-tagged biosensors. The BRET acceptor (520–560 nm) and BRET donor (460–485 nm) emission signals were measured using the Spark Multimode microplate reader (Tecan). Venus fluorescence was measured before reading luminescence and calculated as average fluorescence from each control well. The BRET signal from the same well was determined as the ratio of the light emitted by Venus (520–560 nm) over that emitted by RLuc8 (460–485 nm). We carried out nonlinear regression analysis using a sigmoidal dose response in GraphPad Prism to calculate the values of Emax and EC50.
Flow cytometry-based endocytosis assays
Human monocytic THP-1 cells (ATCC-TIB-202) were cultured in RPMI 1640 (Hyclone) supplemented with 10% FBS (Invitrogen) and antibiotics (Sangon). First, cells were plated on to a 96-well plate (Corning) and incubated with CCL15 truncations for 2 h at 37 °C. Then the THP-1 cells were counterstained with allophycocyanin (APC) anti-CCR1 (Biolegend, used in 1:1,000 dilution) and 4,6-diamidino-2-phenylindole (DAPI) (C16H15N5·2HCl, Sigma, used in 1:10,000 dilution). DAPI (Thermo Fisher) staining was used to exclude dead cells. With the using of CytoFlex (Beckman CytoFlex), gating using Fourier shell correlation- (FSC-)A versus SSC-A was performed to exclude cell debris. FSC-H versus FSC-A was used to distinguish single cells. The endocytosis of CCR1 mutations was investigated by the use of HEK293T cells. So that the amount of CCR1 expression on infected HEK293T cells could be similar to the amount of endogenous CCR1 expressed on monocytes, we used the pBiT1.1 vector (Promega) with the HSV-TK promoter, which provided constitutive, low-level expression in mammalian cells. The recombined vector used in this assay also contained an enhanced green fluorescent protein reporter downstream of the receptor and separated by a P2A self-cleaving peptide (ATNFSLLKQAGDVEENPGP). The transfected cells were incubated with corresponding CCL15 truncations for 2 h, and then stained with Phycoerythrin (PE) anti-DYKDDDDK Tag Antibody (Biolegend #637310, used in 1:1,000 dilution) and DAPI antibody (Sigma). The gate strategy was similar to that used in THP-1 cells as described above, except that the successful transfected HEK293T cells were further identified with high fluorescein isothiocyanate fluorescence.
Data were acquired on a CytoFlex Cytometer and analyzed with CytExpert software. For THP-1 cells, the endocytosis level was measured by calculating the ratio of the median APC fluorescence intensity between THP-1 cells treated with ligand in a test and lowest concentration (10−13 M). For HEK293T cells, the median PE fluorescence intensity was first normalized by the fluorescence intensity of fluorescein isothiocyanate, then further divided by the corresponding value of HEK293T cells treated with ligand in the lowest concentration (10−13 M). All data were normalized to 100% for presentation. We carried out nonlinear regression analysis using a sigmoidal dose response in GraphPad Prism to calculate the values of Emax and EC50.
Purification of scFv16
The expression and purification of scFv16 were achieved as previously described41. In brief, the scFv16 was overexpressed and secreted into the culture medium of transfected High Five cells. Following affinity chromatography on Ni-NTA, the elution was purified by size exclusion chromatography on a Superdex 200 Increase 10/300 GL column (GE Healthcare). Then the monomeric fractions were concentrated, flash frozen and stored at −80 °C until use.
Expression and purification of CCL15L–CCR1-Gi, CCL15M–CCR1-Gi and apo CCR1–Gi complexes
For the purification of CCL15L–CCR1–Gi, the full-length cDNA sequence of wild-type human CCR1 was fused with a LgBiT subunit (Promega) at the C terminus followed by a double MBP tag via a GS linker containing a 3C protease cleavage site. The sequence of CCL15 (26–92) was fused into the N terminus of CCR1 via a GS linker containing a tobacco etch virus (TEV) protease cleavage site. A dominant-negative Gαi1 (DNGαi1) was generated by site-directed mutagenesis to decrease the affinity of nucleotide-binding, and the Gβ1 was fused with a C-terminal SmBiT (peptide 86, Promega). Using the bac-to-bac system (Invitrogen), the virus of CCL15 (26–92)–CCR1-LgBiT-2*MBP was infected with the ones of Gαi1 and Gβγ-SmBiT at equal multiplicities of infection in SF9 insect cells. After 48 h of expression, the infected SF9 cells were resuspended in 20 mM HEPES pH 7.5, 2 mM MgCl2, 100 mM NaCl and protease inhibitor cocktail. The membranes were then solubilized with the addition of 0.5% (w/v) lauryl maltose neopentyl glycol and 0.1% (w/v) cholesterol hemisuccinate. Following incubation with Amylose resin (NEB), the protein was eluted with 10 mM maltose and treated with the TEV protease treatment to break the linker between chemokine and receptor, the 3C protease for the removal of 2*MBP protein, as well as the antibody scFv16 for complex stabilization. Finally, the purification of CCL15 (26–92)–CCR1–Gi complex to homogeneity was achieved by size exclusion chromatography on a Superose 6 Increase 10/300 GL column (GE Healthcare) in size exclusion chromatography buffer (20 mM HEPES pH 7.5, 100 mM NaCl, 0.00075% lauryl maltose neopentyl glycol, 0.0002% (w/v) cholesterol hemisuccinate and 0.00025% (w/v) glyco-diosgenin). The same strategy was used for the purification of CCL15 (27–92)–CCR1–Gi and apo CCR1–Gi complex, except that the sequence of CCL15 (26–92) was replaced by CCL15 (27–92) or CCL3 (4–69).
N-terminal end sequencing based on mass spectrometry and sample preparation
The cDNA sequence of CCL15 (22–92) was fused into the N terminus of CCR1 via a GS linker containing a TEV protease cleavage site (ENLYFQS). Expression and purification of the CCL15 (22–92)–CCR1–Gi complex were performed by following a strategy similar to that used for obtaining CCL15L- and CL15M-bound CCR1 complexes as described above. Monomeric fractions were loaded on 12.5% SDS–PAGE and stained with Coomassie Blue. The gel band corresponding to the ligand-receptor chimera was cut, digested and subjected to liquid chromatography–tandem mass spectrometry analysis as described previously42. Briefly, the gel was destained in fixing buffer (50% (v/v) methanol, 5% (v/v) acetic acid in water). Following reduction and alkylation, the peptides were digested with trypsin. The peptides were extracted by using gradient acetonitrile and desalted by PierceTM C18 Spin Tips. The cleaned peptides were then separated using the Ultimate 3000 nanoliquid chromatography–tandem mass spectrometry system with a 30-min gradient and analyzed by QE-HFX (Thermo Fisher). The identification and quantification of sequences were analyzed by pFind (v.3.1.5). The search parameters were set as follows: carbamidomethylation of cysteine as the fixed modification, oxidation of methionine as the variable modification and trypsin as the digestion enzyme. The quantification results were ranked by spectra counts (propensity score matching <0.01).
Cryo-EM grid preparation and data collection
The purified CCL15L-, CCL15M-bound or apo CCR1–Gi complexes (3 μl) were applied onto a glow-discharged holey carbon grid (Quantifoil R1.2/1.3) at roughly 5 mg ml−1. The Grids were plunge into liquid ethane using Vitrobot Mark IV (Thermo Fischer Scientific) and subsequently transferred to liquid nitrogen and stored for data collection. Cryo-EM imaging was performed on a Titan Krios at 300 kV using Gatan K2 Summit detector in the Center of Cryo-Electron Microscopy, Zhejiang University (Hangzhou, China). Micrographs were recorded in counting mode at a dose rate of about 8.0 e Å2 s−1 with a defocus ranging from −1.0 to −3.0 μm using SerialEM software43. The total exposure time was 8 s and 40 frames were recorded per micrograph. A total of 5792, 6,230 and 5,431 videos were collected for the CCL15L-, CCL15M-bound or apo CCR1–Gi complex, respectively.
Image processing and map construction
Cryo-EM image stacks were aligned using MotionCor2 v.1.3.2 (ref. 44). Contrast transfer function (CTF) parameters were estimated by Gctf v.1.18 (ref. 45). Particle selections for two-dimensional (2D) and 3D classifications were performed on a binned dataset with a pixel size of 2.028 Å using RELION v.3.0.8.
For the CCL15L–CCR1–Gi complex, 5,812,667 particles yielded by automated particle picking were subjected to 2D classification to discard fuzzy subsets of particles, producing 5,507,136 particles. The map of the NTSR1–Gi complex (EMDB-20180) low-pass filtered to 60 Å was used as an initial reference model for two rounds of 3D classification, resulting in two well-defined subsets with 2,081,356 particles46. The selected subsets were subsequently subjected to 3D classification with a mask on the receptor. One subset shows the high-quality receptor density was selected, producing 1,090,180 particles. The selected subset was subsequently subjected to 3D refinement, CTF refinement, Bayesian polishing to reduce background noise and improve EM map quality. The final refinement generated a map with an indicated global resolution of 2.6 Å at a Fourier shell correlation of 0.143.
For the CCL15M–CCR1–Gi complex, 3,852,738 particles yielded by automated particle picking. Then particles were subjected to 2D and 3D classification to discard fuzzy subsets of particles, producing 1,336,807 particles. The map of the CCL15L–CCR1–Gi complex, low-pass filtered to 60 Å, was used as an initial reference model for the 3D classification, resulting in two well-defined subsets. The selected subsets were subsequently subjected to 3D classification with a mask on the receptor and ligand CCL15M. One subset shows the high-quality receptor density was selected, producing 423,872 particles. The selected subset was subsequently subjected to 3D refinement, CTF refinement, Bayesian polishing to reduce background noise and improve EM map quality. The final refinement generated a map with an indicated global resolution of 2.7 Å at a Fourier shell correlation of 0.143.
For the apo CCR1–Gi complex, 3,252,536 particles yielded by automated particle picking were subjected to 2D classification to discard fuzzy subsets of particles, producing 2,073,895 particles. The map of CCL15M–CCR1–Gi complex low-pass filtered to 40 Å was used as an initial reference model for a round of 3D classification, resulting in a well-defined subset with 965,870 particles. The selected subset was subsequently subjected to two rounds of 3D classification with a mask on the receptor and part of the G protein. Two subsets showing the high-quality density were selected, producing 391,181 particles. The selected particles were subsequently subjected to 3D refinement and the final refinement generated a map with an indicated global resolution of 2.9 Å at a Fourier shell correlation of 0.143. All local resolutions of these complexes were determined using the Bsoft package (v.2.0.7) with half maps as input maps47.
Model building and refinement
For the structure of the CCL15L–CCR1–Gi complex, the initial model of CCR1 was downloaded from the predicted active CCR1 model from GPCRdb, and the initial CCL15 model was built from the NMR CCL15 structure (PDB ID 2HCC)48. The initial Gi and scFv16 complex was generated from the NTSR1–Gi complex (PDB ID 6OS9)46. Then, the CCL15L–bound CCR1-Gi model was used as the initial models of apo and CCL15M-bound CCR1–Gi complexes. The models were docked into the cryo-EM density map using chimera. After the initial docked models were refined using Rosetta, the models were subjected to iterative rounds of manual adjustment and auto refinement in Coot v.0.9.4 and Phenix v.1.18, respectively. The final refinement scores were validated by the module ‘comprehensive validation (cryo-EM)’ in Phenix. The model versus map FSC was used to analysis the fitting of the refined model to the cryo-EM map. The model versus two half maps FSC curves were also compared to avoid the overfitting of model toward the map. Structure figures were prepared by PyMOL v.2.5, Chimera v.1.15 and ChiemraX v.1.2.5.
Ligand bias calculated by NanoBiT assays
The NanoBiT assay performed for the measurement of G protein activation was performed as previously described46. And for the measurement of ligand-induced β-arrestin recruitment, the LgBiT was inserted into the C terminal of CCR1 (1–327 amino acids (aa)), and the SmBiT was N terminally fused to β-arrestin2. These sequences were then cloned into pBiT1.1 plasmids (Promega) to achieve a low-level expression in mammalian cells. These two plasmids were transfected into HEK293T cells in equal proportions. After 24 h of incubation, the transfected cells were plated onto a plate (Corning), which was treated with cell adherent reagent (Applygen) in advance. After another 12 h of incubation, the transfected cells were washed once with Hank’s balanced salt solution buffer, and then maintained in the same buffer containing 5 mM HEPES pH 7.4, 0.01% BSA and 5 µM coelenterazine h (yeasen) at a volume of 25 μl per well. After incubation for 30 min, the plate was measured for baseline luminescence (Spark Multimode microplate reader, TECAN). Every ligand (5 μl) was added at different concentrations from (10−6 to 10−13 M) before second measurement. Luminescence counts were normalized to the initial count. Fold-change signals over the lowest concentration treatment of corresponding ligand were calculated. Finally, data were normalized to 100% of the maximal CCL15 (27–92) response for wild-type CCR1 using a sigmoidal dose response in GraphPad Prism.
The bias factors (β value) were determined by applying the following equation:
where P1 is NanoBiT Gi protein dissociation; P2, NanoBiT β-arrestin recruitments; a β value >0 denotes Gi-protein biased and a β value <0 is β-arrestin biased.
Parameters used in this equation were based on the curve fits of the combined datasets described above.
Molecular dynamics simulations
CCL15L-bound, CCL15M-bound and apo state of CCR1 models were substrate from the CCL15L–CCR1–Gi, CCL15M–CCR1–Gi and apo CCR1–Gi complexes, respectively. The orientations of receptors are calculated by the Orientations of Proteins in Membranes database. Following that, the whole systems were prepared by the CHARM-GUI and embedded in a bilayer consisting of 200 1-palmitoyl-2-oleoyl-sn-glycero-3-phosphocholine lipids by replacement methods. The membrane systems were then solvated into a periodic TIP3P water box supplemented with 0.15 M NaCl. The CHARMM36m Force Field was used to model protein molecules. Then these systems were subjected to minimization for 10,000 steps using the conjugated gradient algorithm, and then heated and equilibrated at 310.13 K and 1 atm for 200 ps with 10.0 kcal mol−1 Å−2 harmonic restraints in the NAMD v.2.13. Then there were five cycles of equilibration for 2 ns each at 310.13 K and 1 atm, at which the harmonic restraints were 5.0, 2.5, 1.0, 0.5 and 0.1 kcal mol−1 Å−2 in sequence. Production simulations were run at 310.13 K and 1 atm in the NPT ensemble using the Langevin thermostat and Nose–Hoover method for 250 ns. Electrostatic interactions were calculated using the particle mesh Ewald method with a cutoff of 12 Å. Throughout the final stages of equilibration and production, 5.0 kcal mol−1 Å−2 harmonic restraints were placed on the residues of two state CCR1 models that were within 5 Å of ligand CCL15 include the five key residues (T862.56, W902.60, Y1133.32, Y2556.51, Y2917.43) related to biased signaling. Trajectories were visualized and analyzed using VMD v.1.9.3. The representative r.m.s.d. analysis presented in Extended Data Fig. 1a was performed by Origin2018, and statistical analysis of Extended Data Fig. 1b was performed by GraphPad Prism v.7.
Flow cytometric analysis of the receptor expression
Flow cytometric analyses were performed by using CytoFlex (Beckman CytoFlex). The transfected cells were stained with PE anti-flag (Biolegend). Cells were gated by FSC-A versus SSC-A to exclude debris and then by FSC-H versus FSC-W to exclude cell doublets. Single cell APC fluorescence intensities were determined from over 3000 cells per experiment, which reflected the membrane protein expression level. All data of mutated CCR1 were normalized to the expression level of wild-type receptor in the same experiment. Values were shown as a percentage of the wild-type, which was set to 100%.
Reporting Summary
Further information on research design is available in the Nature Research Reporting Summary linked to this article.
Online content
Any methods, additional references, Nature Research reporting summaries, source data, extended data, supplementary information, acknowledgements, peer review information; details of author contributions and competing interests; and statements of data and code availability are available at 10.1038/s41589-021-00918-z.
Supplementary information
Supplementary Tables 1–7.
Acknowledgements
We thank S. Chang at the Center of Cryo-Electron Microscopy, Zhejiang University, for his help with cryo-EM data collection. We thank J. Guo at the Center of Cryo-Electron Microscopy, Shanghai Institute of Materia Media, for her help with cryo-EM data collection. We thank T. Guo and R. Sun for technical support in N-terminal sequencing at Westlake University. We also thank Core Facilities, Zhejiang University School of Medicine for their technical support. This work was partially supported by the National Natural Science Foundation of China (grant nos. 81930003 and 82090012 to H.S. and 81922071 to Y.Z., 81870007 and 81920108001 to S.Y.) and the Zhejiang Province National Science Fund (grant nos. LR19H310001 to Y.Z. and LD19H160001 to S.Y.).
Extended data
Source data
Statistical source data.
Statistical source data.
Statistical source data.
Statistical source data.
Statistical source data.
Statistical source data.
Statistical source data.
Statistical source data.
Statistical source data.
Author contributions
H.S., Y.Z. and S.Y. conceived, designed and supervised the overall project. Z.S. and Q.S. purified the CCL15M–CCR1–Gi and apo CCR1–Gi complexes, prepared the final samples for cryo-EM studies, prepared figures and participated in the writing. C.M., Q.S. and D.D.S. performed data collection and electron microscopy data processing. Q.S. performed the model building and molecular dynamics simulations. Y.Z. and Q.S. analyzed the structure, designed the mutations and functional assays with Z.S., B.Y., L.N.C. and H.M. Z.S. and B.Y. performed the functional assays with the assistance of C.Z., W.L., H.Z., X.D. and F.L. H.S., S.Y. and Y.Z. interpreted the data and wrote the paper with the assistance of Z.H.C., Z.S., Q.S. and H.E.X.
Data availability
Cryo-EM maps of apo CCR1–Gi, CCL15M–CCR1–Gi and CCL15L–CCR1–Gi complexes have been deposited in the Electron Microscopy Data Bank under accession codes EMD-32020, EMD-32021 and EMD-32022, respectively. The atomic coordinates of apo CCR1–Gi, CCL15M–CCR1–Gi and CCL15L–CCR1-Gi complexes have been deposited in the PDB under accession codes 7VL8, 7VL9 and 7VLA, respectively. All other data are available upon request to the corresponding authors. Publicly available datasets used in this study are: PDB IDs 5UIW, 6WWZ, 6LFL, 2HCC and 6OS9. Source data are provided with this paper.
Competing interests
The authors declare no competing interests.
Footnotes
Peer review information Nature Chemical Biology thanks James Pease and the other, anonymous, reviewer(s) for their contribution to the peer review of this work.
Publisher’s note Springer Nature remains neutral with regard to jurisdictional claims in published maps and institutional affiliations.
These authors contributed equally: Zhehua Shao, Qingya Shen, Bingpeng Yao.
Contributor Information
Songmin Ying, Email: yings@zju.edu.cn.
Yan Zhang, Email: zhang_yan@zju.edu.cn.
Huahao Shen, Email: huahaoshen@zju.edu.cn.
Extended data
are available for this paper at 10.1038/s41589-021-00918-z.
Supplementary information
The online version contains supplementary material available at 10.1038/s41589-021-00918-z.
References
- 1.Defea K. Beta-arrestins and heterotrimeric G-proteins: collaborators and competitors in signal transduction. Br. J. Pharmacol. 2008;153:S298–S309. doi: 10.1038/sj.bjp.0707508. [DOI] [PMC free article] [PubMed] [Google Scholar]
- 2.Weis WI, Kobilka BK. The molecular basis of G Protein-Coupled receptor activation. Annu. Rev. Biochem. 2018;87:897–919. doi: 10.1146/annurev-biochem-060614-033910. [DOI] [PMC free article] [PubMed] [Google Scholar]
- 3.Smith JS, Lefkowitz RJ, Rajagopal S. Biased signalling: from simple switches to allosteric microprocessors. Nat. Rev. Drug Discovery. 2018;17:243–260. doi: 10.1038/nrd.2017.229. [DOI] [PMC free article] [PubMed] [Google Scholar]
- 4.Wingler LM, et al. Angiotensin and biased analogs induce structurally distinct active conformations within a GPCR. Science. 2020;367:888–892. doi: 10.1126/science.aay9813. [DOI] [PMC free article] [PubMed] [Google Scholar]
- 5.Slosky LM, et al. β-arrestin-biased allosteric modulator of NTSR1 selectively attenuates addictive behaviors. Cell. 2020;181:1364–1379.e1314. doi: 10.1016/j.cell.2020.04.053. [DOI] [PMC free article] [PubMed] [Google Scholar]
- 6.Schmid CL, et al. Bias factor and therapeutic window correlate to predict safer opioid analgesics. Cell. 2017;171:1165–1175.e1113. doi: 10.1016/j.cell.2017.10.035. [DOI] [PMC free article] [PubMed] [Google Scholar]
- 7.Brust TF, et al. Biased agonists of the kappa opioid receptor suppress pain and itch without causing sedation or dysphoria. Sci. Signal. 2016;9:ra117. doi: 10.1126/scisignal.aai8441. [DOI] [PMC free article] [PubMed] [Google Scholar]
- 8.Scholten DJ, et al. Pharmacological modulation of chemokine receptor function. Br. J. Pharmacol. 2012;165:1617–1643. doi: 10.1111/j.1476-5381.2011.01551.x. [DOI] [PMC free article] [PubMed] [Google Scholar]
- 9.Stone MJ, Hayward JA, Huang C, e Huma Z, Sanchez J. Mechanisms of regulation of the chemokine-receptor network. Int. J. Mol. Sci. 2017;18:342. doi: 10.3390/ijms18020342. [DOI] [PMC free article] [PubMed] [Google Scholar]
- 10.Rollins BJ. Chemokines. Blood. 1997;90:909–928. [PubMed] [Google Scholar]
- 11.Murphy PM, et al. International union of pharmacology. XXII. Nomenclature for chemokine receptors. Pharmacol. Rev. 2000;52:145–176. [PubMed] [Google Scholar]
- 12.Zlotnik A, Yoshie O. Chemokines: a new classification system and their role in immunity. Immunity. 2000;12:121–127. doi: 10.1016/s1074-7613(00)80165-x. [DOI] [PubMed] [Google Scholar]
- 13.Eiger DS, Boldizsar N, Honeycutt CC, Gardner J, Rajagopal S. Biased agonism at chemokine receptors. Cell. Signalling. 2021;78:109862. doi: 10.1016/j.cellsig.2020.109862. [DOI] [PMC free article] [PubMed] [Google Scholar]
- 14.Schall TJ, Proudfoot AE. Overcoming hurdles in developing successful drugs targeting chemokine receptors. Nat. Rev. Immunol. 2011;11:355–363. doi: 10.1038/nri2972. [DOI] [PubMed] [Google Scholar]
- 15.Zhang C, et al. Eosinophil-derived CCL-6 impairs hematopoietic stem cell homeostasis. Cell Res. 2018;28:323–335. doi: 10.1038/cr.2018.2. [DOI] [PMC free article] [PubMed] [Google Scholar]
- 16.Du X, et al. Eosinophil-derived chemokine (hCCL15/23, mCCL6) interacts with CCR1 to promote eosinophilic airway inflammation. Signal Transduct. Target. Ther. 2021;6:91. doi: 10.1038/s41392-021-00482-x. [DOI] [PMC free article] [PubMed] [Google Scholar]
- 17.Dairaghi DJ, et al. CCR1 blockade reduces tumor burden and osteolysis in vivo in a mouse model of myeloma bone disease. Blood. 2012;120:1449–1457. doi: 10.1182/blood-2011-10-384784. [DOI] [PMC free article] [PubMed] [Google Scholar]
- 18.Li F, et al. Eosinophilic inflammation promotes CCL6-dependent metastatic tumor growth. Sci. Adv. 2021;7:eabb5943. doi: 10.1126/sciadv.abb5943. [DOI] [PMC free article] [PubMed] [Google Scholar]
- 19.Berahovich RD, et al. Proteolytic activation of alternative CCR1 ligands in inflammation. J. Immunol. 2005;174:7341–7351. doi: 10.4049/jimmunol.174.11.7341. [DOI] [PubMed] [Google Scholar]
- 20.Richter R, et al. Increase of expression and activation of chemokine CCL15 in chronic renal failure. Biochem. Biophys. Res. Commun. 2006;345:1504–1512. doi: 10.1016/j.bbrc.2006.05.057. [DOI] [PubMed] [Google Scholar]
- 21.Sanchez J, et al. Evaluation and extension of the two-site, two-step model for binding and activation of the chemokine receptor CCR1. J. Biol. Chem. 2019;294:3464–3475. doi: 10.1074/jbc.RA118.006535. [DOI] [PMC free article] [PubMed] [Google Scholar]
- 22.Sanchez, J., Lane, J. R., Canals, M. & Stone, M. J. Influence of chemokine N-terminal modification on biased agonism at the chemokine receptor CCR1. Int. J. Mol. Sci.20, 2417 (2019). [DOI] [PMC free article] [PubMed]
- 23.Duan J, et al. Cryo-EM structure of an activated VIP1 receptor–G protein complex revealed by a NanoBiT tethering strategy. Nat. Commun. 2020;11:4121. doi: 10.1038/s41467-020-17933-8. [DOI] [PMC free article] [PubMed] [Google Scholar]
- 24.Zhou F, et al. Structural basis for activation of the growth hormone-releasing hormone receptor. Nat. Commun. 2020;11:5205. doi: 10.1038/s41467-020-18945-0. [DOI] [PMC free article] [PubMed] [Google Scholar]
- 25.Gilliland CT, Salanga CL, Kawamura T, Trejo J, Handel TM. The chemokine receptor CCR1 is constitutively active, which leads to G protein-independent, beta-arrestin-mediated internalization. J. Biol. Chem. 2013;288:32194–32210. doi: 10.1074/jbc.M113.503797. [DOI] [PMC free article] [PubMed] [Google Scholar]
- 26.Hughes CE, Nibbs RJB. A guide to chemokines and their receptors. FEBS J. 2018;285:2944–2971. doi: 10.1111/febs.14466. [DOI] [PMC free article] [PubMed] [Google Scholar]
- 27.Kufareva I, Gustavsson M, Zheng Y, Stephens BS, Handel TM. What do structures tell us about chemokine receptor function and antagonism? Annu. Rev. Biophys. 2017;46:175–198. doi: 10.1146/annurev-biophys-051013-022942. [DOI] [PMC free article] [PubMed] [Google Scholar]
- 28.Griffith JW, Sokol CL, Luster AD. Chemokines and chemokine receptors: positioning cells for host defense and immunity. Ann. Rev. Immunol. 2014;32:659–702. doi: 10.1146/annurev-immunol-032713-120145. [DOI] [PubMed] [Google Scholar]
- 29.Zheng Y, et al. Structure of CC Chemokine Receptor 5 with a potent chemokine antagonist reveals mechanisms of chemokine recognition and molecular mimicry by HIV. Immunity. 2017;46:1005–1017.e1005. doi: 10.1016/j.immuni.2017.05.002. [DOI] [PMC free article] [PubMed] [Google Scholar]
- 30.Wasilko DJ, et al. Structural basis for chemokine receptor CCR6 activation by the endogenous protein ligand CCL20. Nat. Commun. 2020;11:3031. doi: 10.1038/s41467-020-16820-6. [DOI] [PMC free article] [PubMed] [Google Scholar]
- 31.Liu K, et al. Structural basis of CXC chemokine receptor 2 activation and signalling. Nature. 2020;585:135–140. doi: 10.1038/s41586-020-2492-5. [DOI] [PubMed] [Google Scholar]
- 32.Qin L, et al. Structural biology. Crystal structure of the chemokine receptor CXCR4 in complex with a viral chemokine. Science. 2015;347:1117–1122. doi: 10.1126/science.1261064. [DOI] [PMC free article] [PubMed] [Google Scholar]
- 33.Zhang H, et al. Structural basis for chemokine recognition and receptor activation of chemokine receptor CCR5. Nat. Commun. 2021;12:4151. doi: 10.1038/s41467-021-24438-5. [DOI] [PMC free article] [PubMed] [Google Scholar]
- 34.Burg JS, et al. Structural biology. Structural basis for chemokine recognition and activation of a viral G protein-coupled receptor. Science. 2015;347:1113–1117. doi: 10.1126/science.aaa5026. [DOI] [PMC free article] [PubMed] [Google Scholar]
- 35.Ballesteros, J. A. & Weinstein, H. in Methods in Neurosciences Vol. 25. (ed. Sealfon, S. C.) 366–428 (Academic Press, 1995).
- 36.Rosenkilde MM, Schwartz TW. GluVII:06–a highly conserved and selective anchor point for non-peptide ligands in chemokine receptors. Curr. Top. Med. Chem. 2006;6:1319–1333. doi: 10.2174/15680266106061319. [DOI] [PubMed] [Google Scholar]
- 37.Thiele S, Rosenkilde MM. Interaction of chemokines with their receptors–from initial chemokine binding to receptor activating steps. Curr. Med. Chem. 2014;21:3594–3614. doi: 10.2174/0929867321666140716093155. [DOI] [PubMed] [Google Scholar]
- 38.Vaidehi N, et al. Predictions of CCR1 chemokine receptor structure and BX 471 antagonist binding followed by experimental validation. J. Biol. Chem. 2006;281:27613–27620. doi: 10.1074/jbc.M601389200. [DOI] [PubMed] [Google Scholar]
- 39.de Mendonça FL, et al. Site-directed mutagenesis of CC chemokine receptor 1 reveals the mechanism of action of UCB 35625, a small molecule chemokine receptor antagonist. J. Biol. Chem. 2005;280:4808–4816. doi: 10.1074/jbc.M412267200. [DOI] [PubMed] [Google Scholar]
- 40.Suomivuori CM, et al. Molecular mechanism of biased signaling in a prototypical G protein-coupled receptor. Science. 2020;367:881–887. doi: 10.1126/science.aaz0326. [DOI] [PMC free article] [PubMed] [Google Scholar]
- 41.Mao C, et al. Cryo-EM structures of inactive and active GABA(B) receptor. Cell Res. 2020;30:564–573. doi: 10.1038/s41422-020-0350-5. [DOI] [PMC free article] [PubMed] [Google Scholar]
- 42.Li D, et al. pFind: a novel database-searching software system for automated peptide and protein identification via tandem mass spectrometry. Bioinformatics. 2005;21:3049–3050. doi: 10.1093/bioinformatics/bti439. [DOI] [PubMed] [Google Scholar]
- 43.McIntosh R, Nicastro D, Mastronarde D. New views of cells in 3D: an introduction to electron tomography. Trend. Cell Biol. 2005;15:43–51. doi: 10.1016/j.tcb.2004.11.009. [DOI] [PubMed] [Google Scholar]
- 44.Zheng SQ, et al. MotionCor2: anisotropic correction of beam-induced motion for improved cryo-electron microscopy. Nat. Methods. 2017;14:331–332. doi: 10.1038/nmeth.4193. [DOI] [PMC free article] [PubMed] [Google Scholar]
- 45.Zhang K. Gctf: real-time CTF determination and correction. J. Struct. Biol. 2016;193:1–12. doi: 10.1016/j.jsb.2015.11.003. [DOI] [PMC free article] [PubMed] [Google Scholar]
- 46.Kato HE, et al. Conformational transitions of a neurotensin receptor 1-G(i1) complex. Nature. 2019;572:80–85. doi: 10.1038/s41586-019-1337-6. [DOI] [PMC free article] [PubMed] [Google Scholar]
- 47.Heymann JB. Single particle reconstruction and validation using Bsoft for the map challenge. J. Struct. Biol. 2018;204:90–95. doi: 10.1016/j.jsb.2018.07.003. [DOI] [PMC free article] [PubMed] [Google Scholar]
- 48.Sticht H, et al. Solution structure of the human CC chemokine 2: a monomeric representative of the CC chemokine subtype. Biochemistry. 1999;38:5995–6002. doi: 10.1021/bi990065i. [DOI] [PubMed] [Google Scholar]
Associated Data
This section collects any data citations, data availability statements, or supplementary materials included in this article.
Supplementary Materials
Supplementary Tables 1–7.
Data Availability Statement
Cryo-EM maps of apo CCR1–Gi, CCL15M–CCR1–Gi and CCL15L–CCR1–Gi complexes have been deposited in the Electron Microscopy Data Bank under accession codes EMD-32020, EMD-32021 and EMD-32022, respectively. The atomic coordinates of apo CCR1–Gi, CCL15M–CCR1–Gi and CCL15L–CCR1-Gi complexes have been deposited in the PDB under accession codes 7VL8, 7VL9 and 7VLA, respectively. All other data are available upon request to the corresponding authors. Publicly available datasets used in this study are: PDB IDs 5UIW, 6WWZ, 6LFL, 2HCC and 6OS9. Source data are provided with this paper.


