Abstract
SETD2 is a H3K36 trimethyltransferase that is mutated with high prevalence (13%) in clear cell renal cell carcinoma (ccRCC). Genomic profiling of primary ccRCC tumors reveals a positive correlation between SETD2 mutations and metastasis. However, whether and how SETD2 loss promotes metastasis remains unclear. In this study, we used SETD2-mutant metastatic ccRCC patient-derived cell line and xenograft models and showed that H3K36me3 restoration greatly reduced distant metastases of ccRCC in mice in an MMP1-dependent manner. An integrated multi-omics analysis using ATAC-seq, ChIP-seq, and RNA-seq established a tumor suppressor model in which loss of SETD2-mediated H3K36me3 activates enhancers to drive oncogenic transcriptional output through regulation of chromatin accessibility. Furthermore, we uncovered mechanism-based therapeutic strategies for SETD2-deficient cancer through the targeting of specific histone chaperone complexes including ASF1A/B and SPT16. Overall, SETD2 loss creates a permissive epigenetic landscape for cooperating oncogenic drivers to amplify transcriptional output, providing unique therapeutic opportunities.
SETD2 is an RNA Polymerase II (Pol II)-associated histone methyltransferase that catalyzes the co-transcriptional methylation of H3K36me2 to create H3K36me3 marks in gene bodies of actively transcribed genes1–5. H3K36me3 has been implicated in transcription elongation, repression of cryptic transcription initiation, co-transcriptional RNA processing, alternative splicing, DNA mismatch repair, and DNA double-strand break repair by homologous recombination5–9. In addition, two non-histone substrates of SETD2 have been reported. Methylation of α-tubulin is important for mitosis and cytokinesis10 whereas methylation of STAT1 is involved in interferon alpha antiviral response11. SETD2 is one of the most frequently mutated chromatin modifying genes across different cancer types. Based on The Cancer Genome Atlas (TCGA) datasets, SETD2 is mutated in 13% of ccRCC, 9% of lung adenocarcinoma, 9% of uterine corpus endometrial carcinoma, 7% of bladder urothelial carcinoma, 6% of stomach adenocarcinoma, 5% of colorectal adenocarcinoma, 5% of melanoma, and 5% of hepatocellular carcinoma, among others. The majority of SETD2 mutations identified in ccRCC and lung adenocarcinoma are truncating mutations.
ccRCC has long been recognized as a VHL loss-driven disease in which VHL is mutated or silenced in up to 80–90% of tumors and the heterozygous loss of chromosome 3p where VHL resides is identified in >90% of ccRCC12. The other three top mutated genes in ccRCC are also located at chromosome 3p, including PBRM1, SETD2, and BAP113,14. Notably, deletion of Vhl alone is insufficient to induce kidney cancer in mice15–18 whereas combined deletion of Vhl and Pbrm1 results in multifocal, transplantable non-metastatic clear cell kidney cancers19, indicating that Setd2 inactivation is not required for kidney tumor initiation. Human ccRCC genomics and cancer evolution studies revealed that SETD2 mutations often co-occur with VHL and PBRM1 mutations; PBRM1 mutations almost exclusively precede SETD2 mutations; and SETD2 mutations associate with tumor progression12,13,20–22. Nonetheless, the tumor suppressor mechanisms of SETD2 in kidney cancer remain uncharacterized.
Results
Restoration of H3K36me3 in SETD2MT ccRCC suppresses tumor metastases.
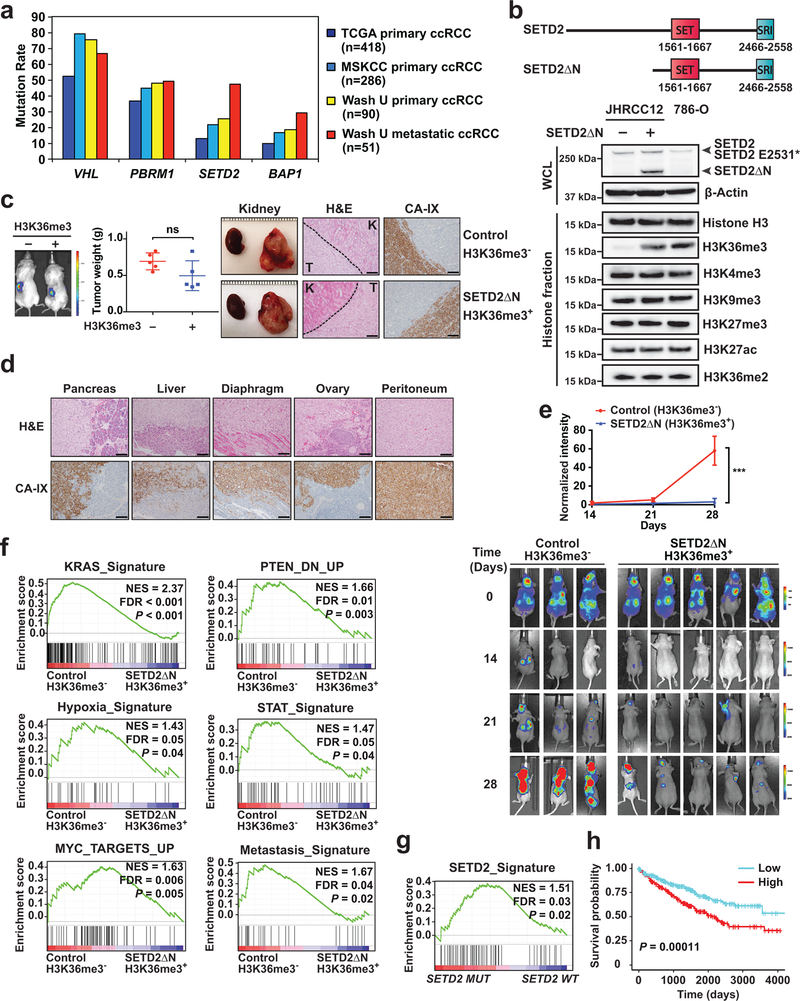
To further assess the association of SETD2 mutations with ccRCC metastasis, targeted next-generation sequencing of 595 cancer-related genes (Tempus Cancer Genome Sequencing Panel) was performed on 90 primary and 51 metastatic ccRCC tumors collected at the Washington University. In addition, a separate collection of 286 primary ccRCC tumors was assessed by the MSK-IMPACT assay23. The SETD2 mutation rate in primary ccRCC tumors increases from 13% in the TCGA cohort to 20–25% in the MSKCC and Washington University cohorts (Fig. 1a), which reflects the lower percentage of stage IV metastatic disease in the TCGA cohort (<2%). Strikingly, the SETD2 mutation rate increases to 47% in metastatic ccRCC tumors (Fig. 1a). The mutation rate of BAP1 also increases in metastatic tumors but to a lesser extent than that of SETD2. Overall, these data reveal a strong selection pressure for SETD2 inactivation during metastasis. To investigate the underlying molecular mechanisms, we employed the patient metastatic tumor-derived ccRCC cell line JHRCC12 that harbors mutations in VHL (p.L169P), PBRM1 (p.1885fs) and SETD2 (p.E2531*)24. The SETD2 mutation in JHRCC12 is located at the SRI domain, which is expected to disrupt the interaction of SETD2 with Pol II while maintaining an intact methyltransferase activity1,2,5. Hence, this SETD2 mutation probably affects the methylation of histones but not non-histone substrates. Due to the large coding sequence of SETD2, efficient transduction of the full-length SETD2 using a retroviral or lentiviral vector was not possible. Nevertheless, it has been reported that the N-terminal truncated SETD2 is fully functional10. Consistently, we demonstrated that the N-terminal truncated SETD2 lacking the first 1241 amino acids while retaining all the important functional domains (SETD2ΔN) was sufficient to fully restore H3K36me3 in JHRCC12 cells to a level comparable to that of 786-O ccRCC cells carrying wild-type SETD2 (Fig. 1b). Notably, H3K36me2 levels were comparable in both SETD2-deficient and -proficient cells (Fig. 1b), which is consistent with the reported findings that mammalian SETD2 is only responsible for the trimethylation of H3K363,4.
Fig. 1 |. SETD2 is highly mutated in metastatic ccRCC tumors and restoration of H3K36me3 in SETD2 mutant ccRCC suppresses tumor metastasis.
a, The mutation rates of VHL, PBRM1, SETD2, and BAP1 in the indicated ccRCC cohorts. b, A schematic diagram of the domain structure of SETD2 and SETD2ΔN. Whole cell lysates (WCL) and histone fractions from the indicated JHRCC12 cells or from 786-O cells were assessed by immunoblots. c, The indicated luciferase-transduced JHRCC12 cells were injected into subrenal capsules of unilateral kidneys of NSG mice to establish orthotopic xenografts. Successful injection was confirmed by bioluminescence imaging. A representative bioluminescence image is shown. The weight of kidney tumors in each mouse was estimated by subtracting the weight of kidney without orthotopic implantation from that of kidney with orthotopic implantation after 5–6 weeks. Data shown are mean ± s.d. (n = 5 mice for each group, two-tailed unpaired Student’s t-test). Representative gross images of bilateral kidneys (only left kidney with orthotopic xenograft tumors), H&E staining and immunohistochemistry staining for CA-IX are shown. T, tumor; K, adjacent normal kidney. Scale bars, 100 μm. d,, Representative H&E staining and IHC staining for CA-IX of the indicated organs with metastatic tumors developed in mice received orthotopic implantation of JHRCC12 cells. Scale bars, 100 μm. e, Bioluminescence images of athymic nude mice at the indicated times after intracardiac injection of the indicated luciferase-transduced JHRCC12 cells (mean ± s.d., n = 3 mice for H3K36me3-deficient and n = 5 mice for H3K36me3-proficient). ***, P = 0.0002 (two-way ANOVA). f, GSEA plots of the differentially expressed genes (FDR < 0.05) comparing control (H3K36me3−) with SETD2ΔN-transduced (H3K36me3+) JHRCC12 cells using the indicated gene sets. NES, normalized enrichment score. g, GSEA plot of the differentially expressed genes (FDR < 0.05) comparing SETD2MT with SETD2WT human ccRCC from TCGA using the SETD2-dependent gene signature defined in JHRCC12 cells. h, Kaplan-Meier analysis of overall survival in ccRCC patients from TCGA based on the expression of the refined SETD2 signature (the top 50% highly expressed are shown in red and the bottom 50% are shown in blue). P = 0.00038 (Mantel–Cox test).
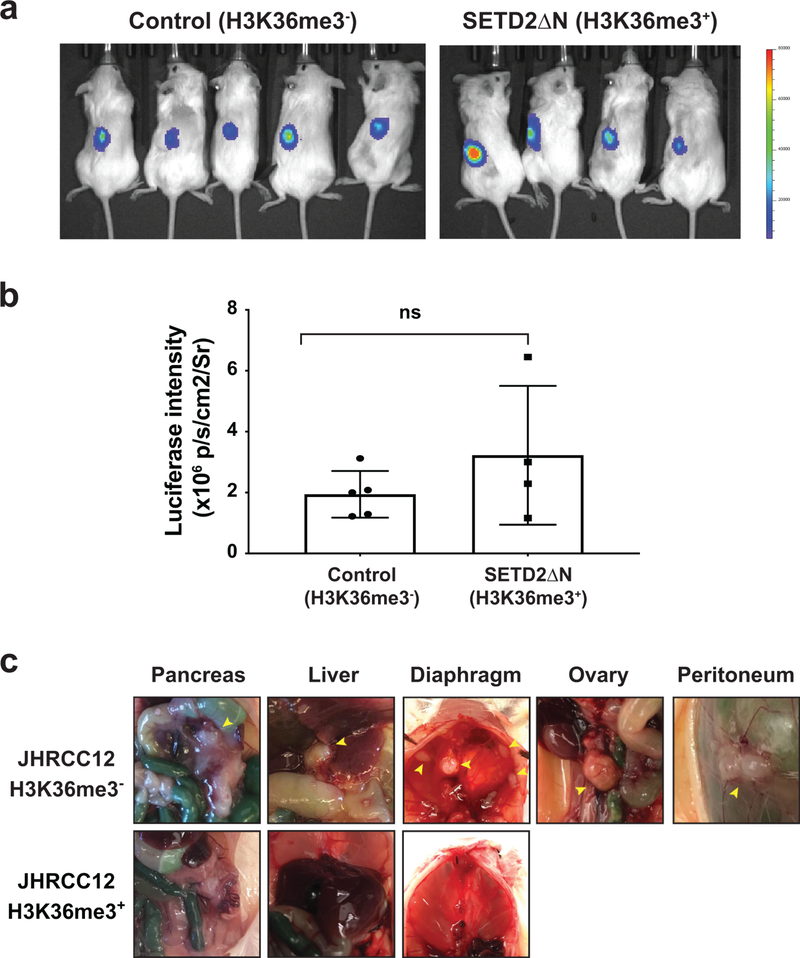
To study the impact of SETD2-mediated H3K36me3 in kidney tumorigenesis in vivo, luciferase-labeled JHRCC12 cells without or with retroviral transduction of SETD2ΔN to restore H3K36me3 were injected into the subrenal capsules of immuno-deficient mice to establish orthotopic xenografts (Fig. 1c and Extended Data Fig. 1a,b). Restoration of H3K36me3 in JHRCC12 had no significant effect on the growth of orthotopic xenografts (Fig. 1c), which is consistent with the findings that SETD2 loss is not required for kidney tumor initiation in Vhl−/−Pbrm1−/− mice19. The orthotopic kidney tumors derived from JHRCC12 cells without or with H3K36me3 showed comparable histological features and were stained positive for carbonic anhydrase IX (CA-IX), a marker for human ccRCC25,26 (Fig. 1c). More than 90% of the 15 mice bearing orthotopic xenografts of parental JHRCC12 developed pancreatic metastases and up to 80% of the mice developed metastases to liver and diaphragm (Table 1 and Extended Data Fig. 1c). Metastases were also detected in ovary (13.3%) and peritoneum (13.3%). Strikingly, restoration of H3K36me3 completely suppressed the metastatic capacity of JHRCC12 cells and no distant metastasis was detected in any of the mice analyzed (Table 1). Metastatic JHRCC12 tumors were validated by IHC staining for CA-IX (Fig. 1d). To further confirm the role of SETD2 in metastasis, intracardiac injection of JHRCC12 cells was performed in immuno-deficient mice (Fig. 1e). Again, restoration of H3K36me3 upon SETD2ΔN transduction greatly reduced metastases of JHRCC12 cells to brain, lung and liver as revealed by quantitative bioluminescent imaging (Fig. 1e). Altogether, our data provide compelling evidence that loss of SETD2-mediated H3K36me3 promotes kidney cancer metastasis.
Table 1.
Summary of metastatic events in NSG mice at 5–6 weeks after subcapsular injection of the indicated JHRCC12 cells into unilateral kidneys.
| JHRCC12 | Pancreas | Liver | Diaphragm | Ovary | Peritoneum |
|---|---|---|---|---|---|
| H3K36me3− | 14/15 (93.3%) | 12/15 (80.0%) | 12/15 (80.0%) | 2/15 (13.3%) | 2/15 (13.3%) |
| H3K36me3+ | 0/9 (0.0%) | 0/9 (0.0%) | 0/9 (0.0%) | 0/9 (0.0%) | 0/9 (0.0%) |
SETD2 loss upregulates oncogenic transcriptional programs in ccRCC.
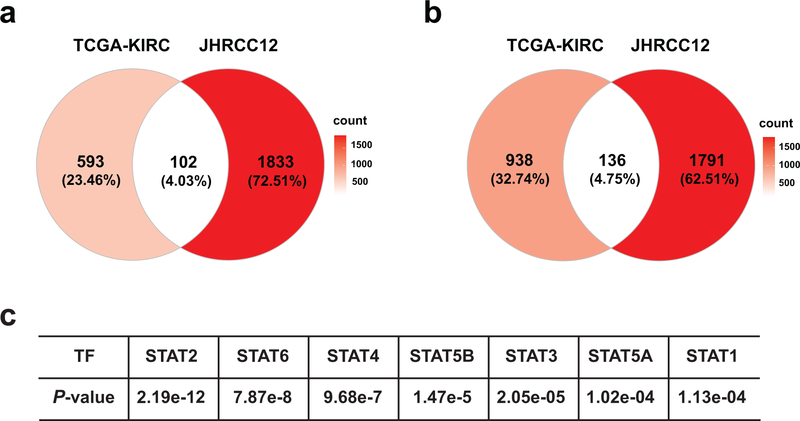
We next investigated H3K36me3 loss-induced transcriptome changes in JHRCC12 cells. GSEA of differentially expressed genes (FDR < 0.05) detected by RNA-seq showed downregulation of several oncogenic pathways upon restoration of H3K36me3 by SETD2ΔN transduction in JHRCC12, such as the KRAS transcriptional signature and the PTEN-loss transcriptional signature (Fig. 1f, Supplementary Table 1 and Supplementary Table 2). Oncogenic pathways that are central to the pathogenesis of ccRCC were also highly enriched in H3K36me3-deficient JHRCC12, including the hypoxia transcriptional signature, the STAT signature, and the MYC transcriptional signature (Fig. 1f). Notably, our molecular characterization of mouse Vhl−/−Pbrm1−/− ccRCC tumors revealed that PBRM1 loss amplifies the transcriptional output of HIF and STAT incurred by the VHL loss19. Hence, SETD2 inactivation appears to further magnify the oncogenic transcriptional output caused by the combined loss of VHL and PBRM1. Notably, a previously reported metastatic signature that mediates breast cancer metastasis to brain27 was enriched in H3K36me3-deficient JHRCC12 (Fig. 1f). Based on the RNA-seq data, we generated a SETD2-dependent gene signature that is significantly upregulated in H3K36me3-deficient compared to H3K36me3-proficient JHRCC12 cells. Analysis of RNA-seq data in the TCGA ccRCC dataset revealed that SETD2 mutant (SETD2MT) ccRCC tumors were highly enriched with the SETD2 signature defined in JHRCC12 (Fig. 1g). We further refined the SETD2 signature to include only genes that are also upregulated in SETD2 mutant ccRCC tumors in TCGA cohort (Supplementary Table 3, Supplementary Table 4 and Extended Data Fig. 2a,b). Importantly, high expression of the refined SETD2 signature correlated with poor survival in ccRCC patients from the TCGA cohort (Fig. 1h). Taken together, our data indicate that loss of SETD2-mediated H3K36me3 in ccRCC amplifies the oncogenic transcriptional output to promote ccRCC metastasis.
SETD2 loss induces a genome-wide increase in chromatin accessibility.
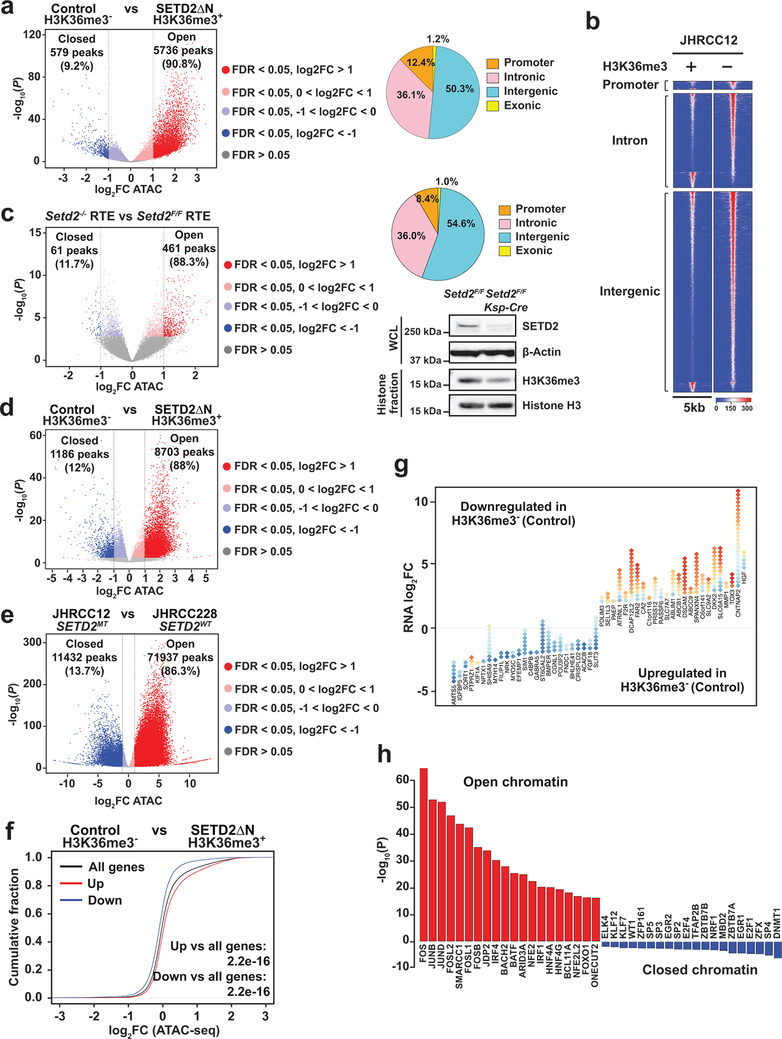
To determine whether increased transcriptional output of oncogenic pathways in SETD2MT ccRCC is caused by an altered epigenetic landscape upon depletion of H3K36me3, ATAC-seq was performed in JHRCC12 cells to assess the impact of H3K36me3 on chromatin accessibility. Loss of H3K36me3 in ccRCC led to genome-wide alterations in chromatin accessibility at ~6.3K sites (FDR < 0.05 and log2(fold change; FC) > 1), which represented ~8% of the total reproducible ATAC-seq peaks (Supplementary Table 5). Among these significantly altered ATAC-seq peaks, 90.8% showed increased chromatin accessibility upon the loss of H3K36me3 (Fig. 2a). The majority of all differentially accessible ATAC-seq peaks (FDR < 0.05, 30.5% of total peaks) were found at introns (36.1%) and intergenic regions (50.3%); 12.4% were at promoters and 1.2% at exons (Fig. 2a,b). This is consistent with the reported association of SETD2 mutations with increased chromatin accessibility in human ccRCC tumors28. To further confirm the association of SETD2 loss with increased chromatin accessibility, ATAC-seq was performed in primary renal tubular epithelial (RTE) cells cultured from Setd2F/FKsp-Cre+ and littermate Setd2F/F mice. The Ksp-Cre transgene expresses Cre specifically in renal tubules19. A genome-wide increase in chromatin accessibility was also observed in Setd2-deficient RTE cells (Fig. 2c), indicating that the increased chromatin accessibility is a primary phenotype caused by loss of SETD2-mediated H3K36me3 in both normal and malignant kidney cells. To further confirm SETD2-loss induced increase in chromatin accessibility in vivo, ATAC-seq was performed in SETD2-proficient and SETD2-deficient ccRCC patient-derived xenografts (PDXs). Consistent with the in vitro study (Fig. 2a), restoration of H3K36me3 greatly reduced chromatin accessibility in JHRCC12 PDXs (Fig. 2d). Importantly, increased chromatin accessibility was noted in VHLMTPBRM1MTSETD2MT JHRCC12 PDXs compared to VHLMTPBRM1MTSETD2WT JHRCC228 PDX (Fig. 2e).
Fig. 2 |. Loss of SETD2-mediated H3K36me3 induces a genome-wide increase in chromatin accessibility that correlates with increased oncogenic transcriptional output.
a, Volcano plot of ATAC-seq peaks comparing control (H3K36me3−) with SETD2ΔN-transduced (H3K36me3+) JHRCC12 cells. Peaks with differential chromatin accessibility upon H3K36me3 restoration (FDR < 0.05; n = 24016) are highlighted. The number of peaks with significant changes (FDR < 0.05 and log2(fold change; FC) > 1; n = 6315 peaks) upon H3K36me3 restoration is shown. Pie chart showing the percentage of differentially accessible ATAC-seq peaks (FDR < 0.05) at promoter, intronic, intergenic, and exonic regions. b, Heatmap of differentially accessible ATAC-seq peaks described in a (FDR < 0.05 and log2(FC) > 1) in 5kb window grouped by localization at promoter, intron, and intergenic regions. c, Volcano plot of ATAC-seq peaks comparing primary murine renal tubular epithelial (RTE) cells cultured from Setd2F/FKsp-Cre+ mice with those from littermate Setd2F/F mice. Peaks with differential chromatin accessibility upon Setd2 deletion (FDR < 0.05) are highlighted. The number of peaks with significant changes (FDR < 0.05 and log2(FC) > 1) is shown. Whole cell lysates (WCL) and histone fractions from the indicated RTE cells were assessed by immunoblots. d-e, Volcano plots of ATAC-seq peaks comparing H3K36me3− with H3K36me3+ (SETD2ΔN-transduced) JHRCC12 PDXs (d) or comparing JHRCC12 (VHLMTPBRM1MTSETD2MT) PDXs with JHRCC228 (VHLMTPBRM1MTSETD2WT) PDXs (e). Peaks with differential chromatin accessibility (FDR < 0.05) are highlighted (red, open chromatin; blue, closed chromatin). The number of peaks with significant changes (FDR < 0.05 and log2(FC) > 1) is shown. P values were obtained using DESeq2 (Methods). f, Distribution of chromatin accessibility changes associated with significantly upregulated (red) or downregulated (blue) genes comparing H3K36me3− with H3K36me3+ JHRCC12 cells. P values calculated using one-sided KS test comparing peaks associated with differentially expressed genes to all genes. g, Diamond plots of changes in chromatin accessibility for the top 25 most upregulated and 25 most downregulated genes comparing H3K36me3− with H3K36me3+ JHRCC12 cells. Red, open chromatin; blue, closed chromatin. h, The 20 most significantly enriched transcription factor binding motifs in open (red) and closed (blue) chromatin peaks comparing H3K36me3− with H3K36me3+ JHRCC12 cells.
We next assessed the correlation between SETD2 loss-induced alterations in chromatin accessibility and transcriptional output by integrating ATAC-seq data with RNA-seq data. In general, a correlation between H3K36me3-loss induced changes in chromatin accessibility and gene expression was observed, i.e. the upregulated genes exhibited more open chromatin whereas the downregulated ones more closed chromatin (Fig. 2f,g). To identify key transcription factors that drive oncogenic gene expression upon SETD2 loss, motif analysis of differentially accessible ATAC-seq peaks was performed using FIMO29. Open chromatin regions induced by H3K36me3 loss in JHRCC12 cells were highly enriched with binding motifs for the AP1 (JUN/FOS) family of transcription factors (Fig. 2h), consistent with the upregulation of the KRAS transcriptional signature (Fig. 1f). Of note, it has been reported that the JUN/FOS-mediated transcription program is active in ccRCC13. Enrichment of STAT family transcription factor binding motifs was also identified in open chromatin regions upon the loss of H3K36me3 (Extended Data Fig. 2c), which is in accordance with the enriched STAT transcriptional signature (Fig. 1f). Collectively, our data reveal that loss of SETD2-mediated H3K36me3 increases chromatin accessibility to enhance the oncogenic transcriptional output in kidney cancer.
SETD2 loss induces epigenetic remodeling and activation of enhancers.
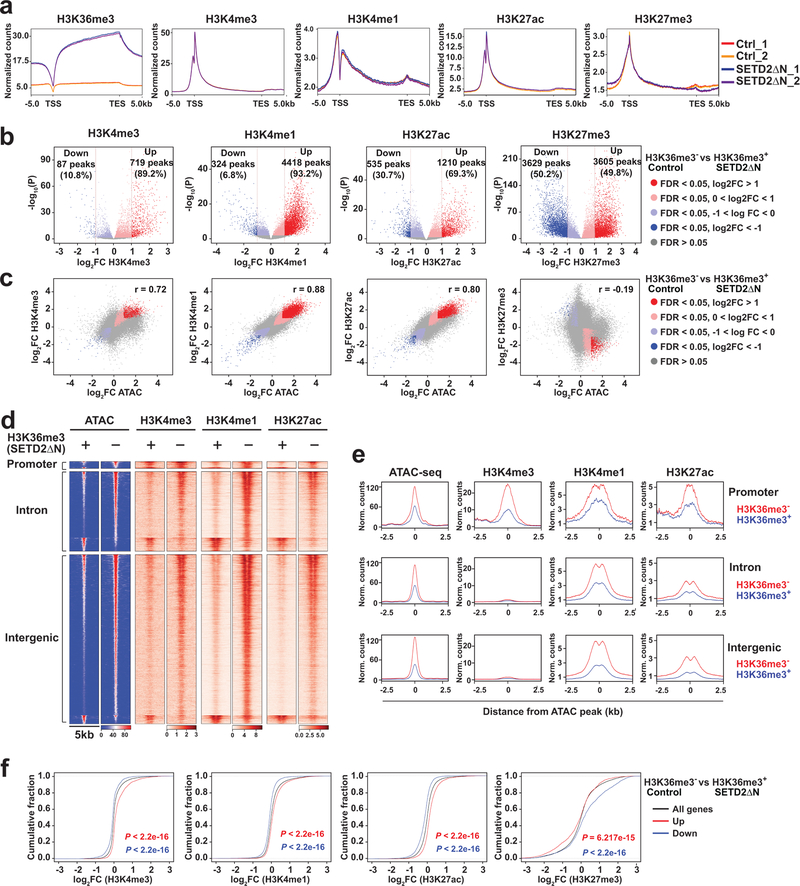
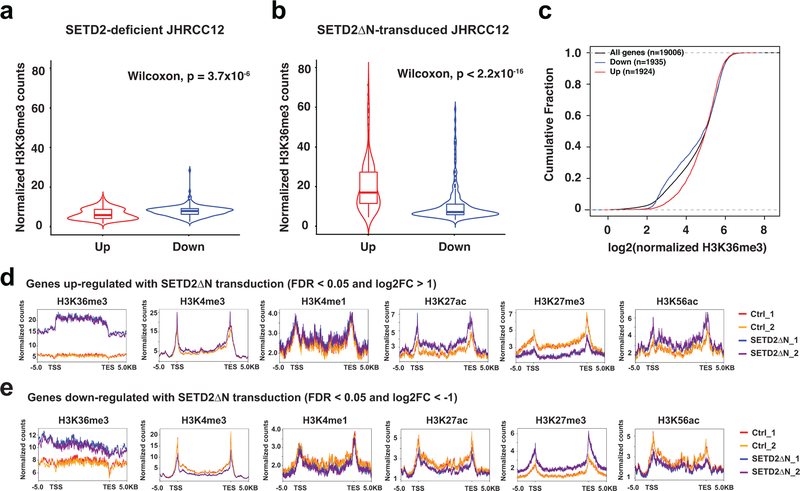
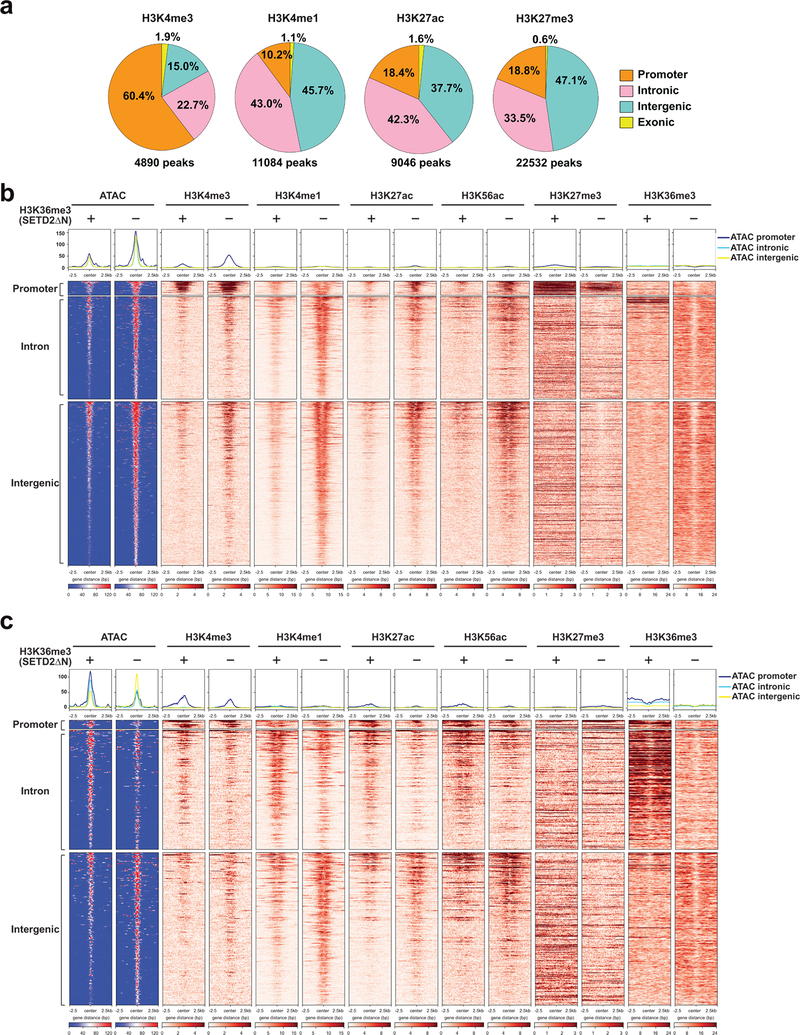
Given that H3K36me3 loss-induced open chromatin mainly concentrates in intronic and intergenic regions that often contain enhancers, we hypothesized that loss of H3K36me3 may increase chromatin accessibility to transcription factors and chromatin modifiers, which activates enhancers and induces gene expression. Accordingly, an integrated ATAC-seq and ChIP-seq approach was undertaken to interrogate the genome-wide correlation between increased chromatin accessibility and enhancer activities (Supplementary Table 5 and Supplementary Table 6). H3K36me3-deficient or proficient JHRCC12 cells were subjected to ChIP-seq for the enhancer marks H3K4me1 and H3K27ac. We also performed ChIP-seq for the promoter mark H3K4me3 and the repressive mark H3K27me3. ChIP-seq for H3K36me3 confirmed that SETD2ΔN transduction restored H3K36me3 mainly over the gene bodies but not the promoters as reported5 (Fig. 3a). Consistent with the notion that SETD2 catalyzes the co-transcriptional trimethylation of H3K361–5, the genes that were upregulated in SETD2ΔN-transduced compared to SETD2-deficient JHRCC12 cells had higher H3K36me3 levels in SETD2ΔN-transduced cells due to their active transcription in these cells (Extended Data Fig. 3). In contrast, the genes that were downregulated in SETD2ΔN-transduced compared to SETD2-deficient JHRCC12 cells had lower H3K36me3 levels in SETD2ΔN-transduced cells due to their lower expression in these cells (Extended Data Fig. 3). On average, H3K36me3 restoration had no conspicuous effect on the distribution of H3K4me3, H3K4me1, H3K27ac, and H3K27me3 over gene bodies (Fig. 3a). However, significantly upregulated genes (FDR < 0.05 and log2(FC) > 1) had increased H3K27ac and decreased H3K27me3 levels while significantly downregulated genes (FDR < 0.05 and log2(FC) < −1) had decreased H3K27ac and increased H3K27me3 levels (Extended Data Fig. 3d,e). In accordance with the expected genomic localization patterns, the majority of the differential H3K4me3 peaks were found at the promoters and the differential H3K4me1 and H3K27ac peaks at the introns and intergenic regions (Extended Data Fig. 4a and Supplementary Table 5).
Fig. 3 |. Loss of SETD2-mediated H3K36me3 induces genome-wide epigenetic reprogramming and activation of enhancers.
a, Metaplots showing the normalized average levels of H3K36me3, H3K4me3, H3K4me1, H3K27ac, and H3K27me3 across gene bodies comparing control (H3K36me3−) with SETD2ΔN-transduced (H3K36me3+) JHRCC12 cells by ChIP-seq. TSS, transcription start site; TES, transcription end site. b, Volcano plots showing changes in ChIP-seq for the indicated histone modifications comparing H3K36me3− with H3K36me3+ JHRCC12 cells. Peaks with differential enrichment for each histone modification (FDR < 0.05) are highlighted. The number of peaks with significant changes (FDR < 0.05 and log2(FC) > 1) in each histone modification is shown. c, Scatter plots showing correlation between log2(FC) of ChIP-seq for each histone modification and log2(FC) of ATAC-seq comparing H3K36me3− with H3K36me3+ JHRCC12 cells. Peaks with significant changes (FDR < 0.05) in both histone modification and chromatin accessibility are highlighted. d, Heatmaps of differentially accessible ATAC-seq peaks (FDR < 0.05 and log2(FC) > 1; n = 6280) in 5kb window grouped by localization at promoter, intron, and intergenic regions as well as ChIP-seq signals for the indicated histone modifications in the same regions of ATAC-seq peaks. e, Metapeak plots of differentially accessible ATAC-seq peaks (FDR < 0.05 and log2(FC) > 1) and ChIP-seq signals as described in d. f, Cumulative distribution of histone modification changes in significantly upregulated (red) or downregulated (blue) genes (FDR < 0.05) comparing H3K36me3− with H3K36me3+ (SETD2ΔN-transduced) JHRCC12 cells. P values calculated using one-sided KS test comparing peaks associated with differentially expressed genes to all genes.
Further detailed assessment of genome-wide changes of each histone modification showed that restoration of H3K36me3 upon SETD2ΔN transduction induced significant changes of enhancer marks H3K4me1 and H3K27ac at ~4.7K and ~1.7K sites, respectively (FDR < 0.05 and log2(FC) > 1) (Fig. 3b and Supplementary Table 5). Remarkably, the majority of differentially enriched enhancer marks showed increased deposition upon the loss of H3K36me3 (Fig. 3b). Up to 93.2% of the differential H3K4me1 peaks and 69.3% of the differential H3K27ac peaks showed increased signals in H3K36me3-depleted parental JHRCC12 cells (Fig. 3b), which is consistent with the association of H3K36me3 loss with increased enhancer activities. Furthermore, there was a striking positive correlation between changes in ATAC-seq and changes in H3K4me1 ChIP-seq (Pearson correlation coefficient = 0.88) as well as H3K27ac ChIP-seq (Pearson correlation coefficient = 0.80) (Fig. 3c and Supplementary Table 6), which supports our hypothesis that H3K36me3-loss increases chromatin accessibility and thereby activates enhancers. Restoration of H3K36me3 in H3K36me3-depleted JHRCC12 cells also induced significant changes of H3K4me3 at ~0.8K sites of which 89.2% exhibited increased H3K4me3 signals in H3K36me3-depleted cells (Fig. 3b and Supplementary Table 5). A positive correlation between changes in ATAC-seq and changes in H3K4me3 was also observed (Pearson correlation coefficient = 0.72) but to a lesser extent compared to the enhancer marks (Fig. 3c and Supplementary Table 6).
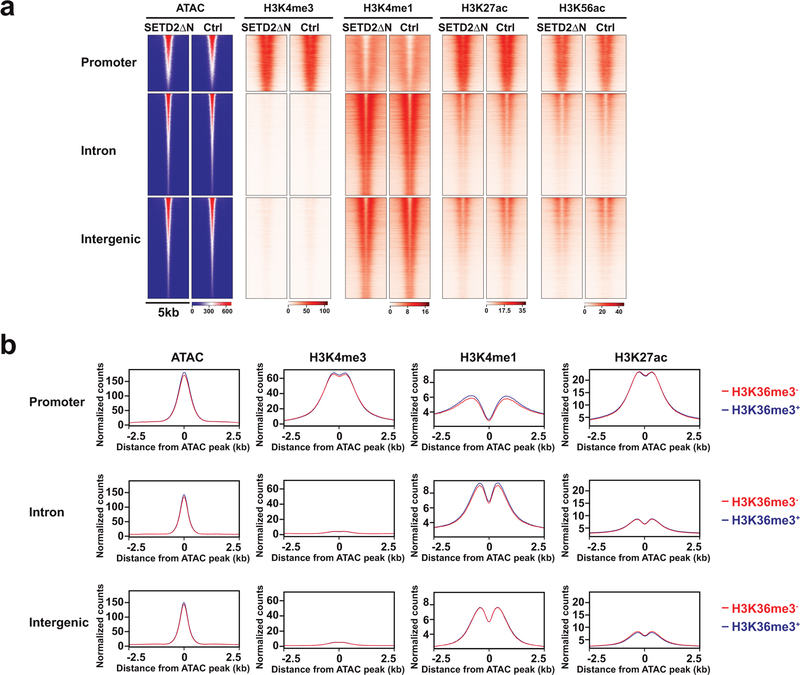
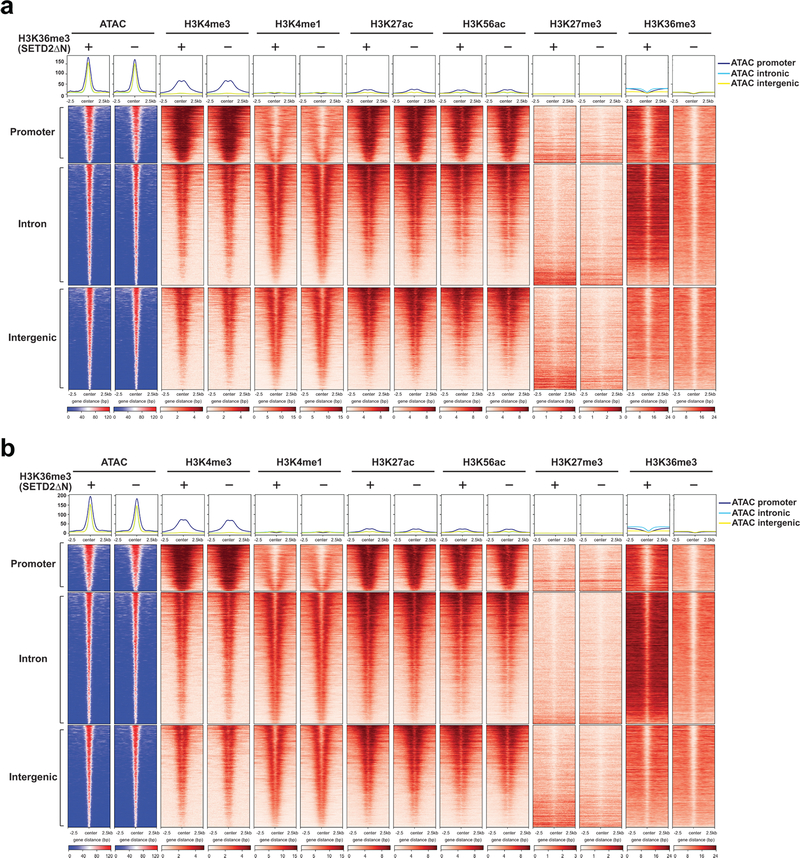
The correlation between chromatin accessibility and active/permissive histone marks was further interrogated focusing on differentially accessible ATAC-seq peaks caused by loss of H3K36me3 (FDR < 0.05 and log2(FC) > 1). Loss of H3K36me3 induced a genome-wide increase in chromatin accessibility, especially in the intergenic and intronic regions, which coincided with increased H3K4me1 and H3K27ac (Fig. 3d,e and Extended Data Fig. 4b,c). The ATAC-seq signals at the intron and intergenic regions displayed a bimodal spatial enrichment of H3K4me1 and H3K27ac with central depletion of both histone marks (Fig. 3e), suggesting centrally depleted nucleosomes that allow binding of transcription factors. Loss of H3K36me3 also led to an increase of H3K4me3 in accessible genomic loci mainly at the promoters (Fig. 3d,e). In contrast, open chromatin regions that were not affected by the status of H3K36me3 showed no differences in both enhancer and promoter marks (Extended Data Fig. 5 and Extended Data Fig. 6).
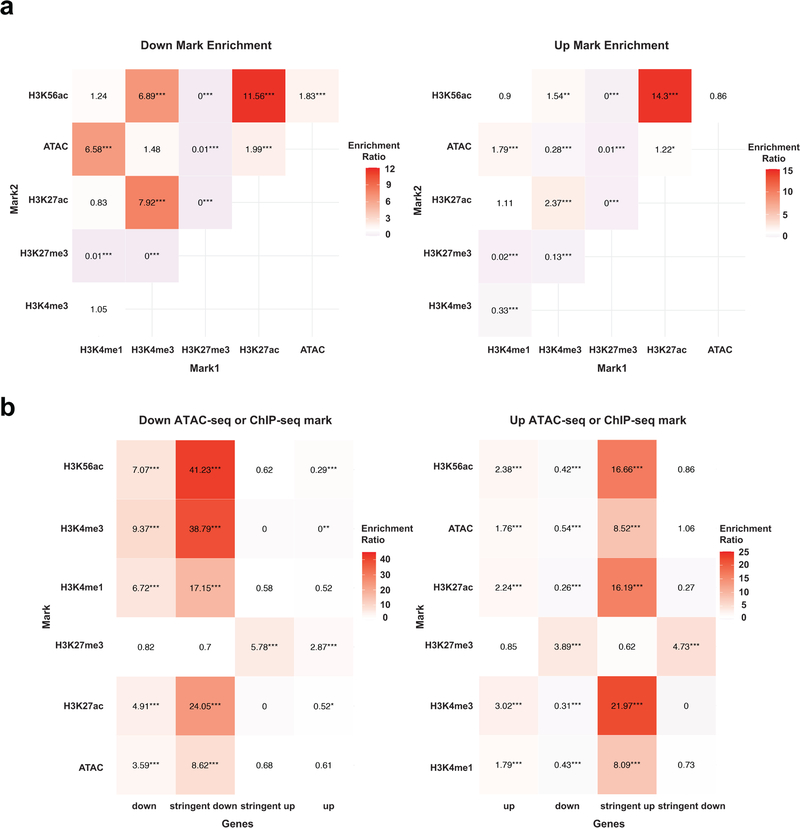
Overall, loss of SETD2-mediated H3K36me3 appears to induce a genome-wide increase of active/permissive histone marks that correlate with increased chromatin accessibility (Fig. 3c–e and Extended Data Fig. 7a, odds ratio > 1.2 and P < 0.0001 for all ATAC-seq vs. active histone mark comparisons, Fisher’s exact text), which probably enhances oncogenic transcriptional output. Indeed, aggregated analysis of transcriptome and epigenome data revealed that chromatin regions within upregulated genes gained H3K4me3, H3K4me1, and H3K27ac, whereas transcriptionally repressed genes showed decreased abundance of aforementioned histone marks (Fig. 3f and Extended Data Fig. 7b, odds ratio > 1.7 and P < 0.0001 for all pairwise comparisons, Fisher’s exact test). Restoration of H3K36me3 also induced significant changes of the repressive mark H3K27me3 at ~7.2K sites (FDR < 0.05 and log2(FC) > 1), of which near equal numbers of sites showed increased or decreased H3K27me3 signals (Fig. 3b and Supplementary Table 5). Consistent with the repressive function of H3K27me3, those transcriptionally repressed genes showed increased H3K27me3 deposition (Fig. 3f and Extended Data Fig. 3d,e). Altogether, our data support that loss of SETD2-mediated H3K36me3 creates an epigenetic landscape consisting of widespread open chromatin that amplifies oncogenic transcriptional output through aberrant activation of enhancers. Although loss of SETD2-mediated H3K36me3 in gene bodies would primarily affect intronic enhancers, binding of transcription factors and chromatin modifiers to intronic enhancers may alter the 3D chromosome architecture to increase enhancer-promoter interactions as well as activate intergenic enhancers. Consistent with our findings, activation of enhancers to drive the functional output of oncogenic signaling and metastatic programs has been reported on several cancer types including ccRCC30–32.
SETD2 loss induces MMP1 expression to promote ccRCC metastases.
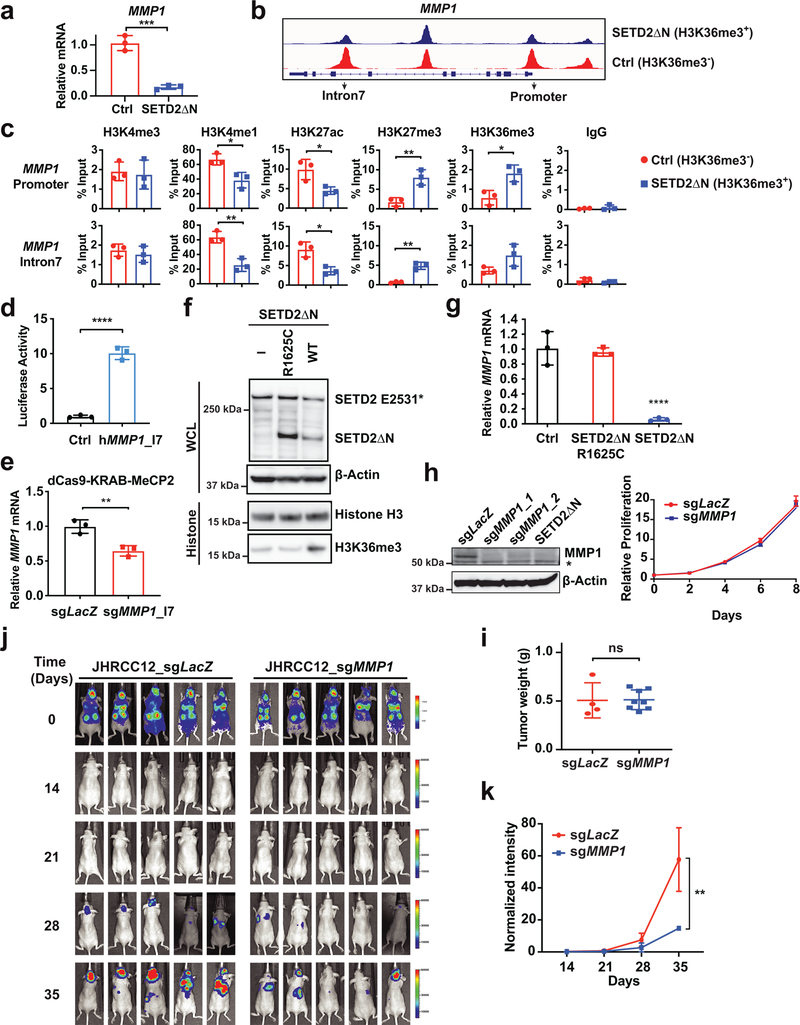
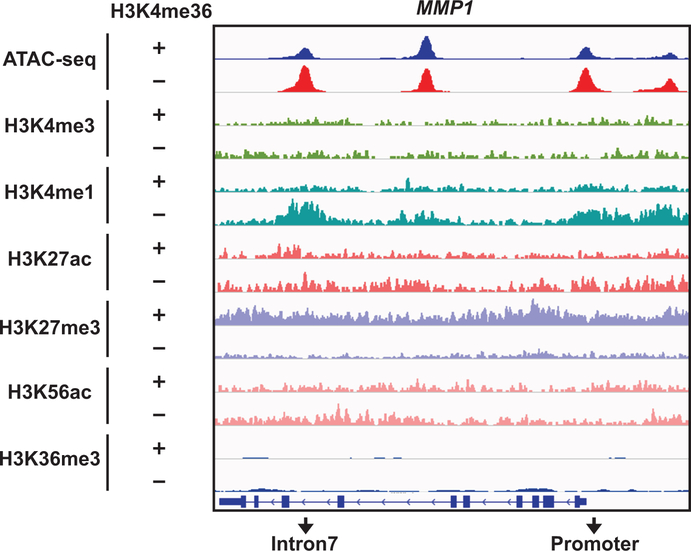
To demonstrate that loss of SETD2-mediated H3K36me3 increases chromatin accessibility to activate enhancers and thereby induce genes involved in metastasis, we focused on MMP1, a well-established metastasis-promoting gene33 that is reported to be upregulated in SETD2MT ccRCC compared to SETD2WT ccRCC in the TCGA dataset13. Indeed, restoration of H3K36me3 downregulated MMP1 expression and reduced chromatin accessibility at both the promoter and intron 7 of MMP1 in JHRCC12 (Fig. 4a,b). Notably, the ATAC-seq peak at the intron 7 of MMP1 coincided with the ChIP-seq peaks for H3K4me1 in H3K36me3-depleted JHRCC12 (Extended Data Fig. 8), suggesting that the intron 7 of MMP1 probably contains an intronic enhancer that could be activated upon the loss of H3K36me3 in JHRCC12 due to increased chromatin accessibility. ChIP-qPCR confirmed that restoration of H3K36me3 through SETD2ΔN transduction in JHRCC12 greatly reduced H3K4me1 and H3K27ac at both the promoter and intron 7 of MMP1 (Fig. 4c). In contrast, restoration of H3K36me3 significantly increased H3K27me3 levels at these regions (Fig. 4c). To further prove the presence of enhancer activity in this intron, we cloned the DNA fragment from the ATAC-seq peak region within the intron 7 into a luciferase reporter construct that was subsequently transfected into CAKI-2, a human SETD2WT ccRCC cell line that harbors mutations in VHL (p.R177*) and PBRM1 (p.IY861fs). Indeed, this DNA fragment conferred a ~10 fold increase in luciferase activity upon transient transfection (Fig. 4d). Furthermore, targeting dCas9–KRAB–MeCP2 repressor34 to the intron 7 enhancer in MMP1 suppressed MMP1 expression (Fig. 4e), supporting the regulation of MMP1 expression by this enhancer.
Fig. 4 |. SETD2 loss-of-function induces MMP1 expression to promote ccRCC metastasis.
a, The MMP1 mRNA was assessed in the indicated JHRCC12 cells by qRT-PCR. Data were normalized against β-Actin (mean ± s.d., n = 3 independent experiments). b, ATAC-seq tracks at the MMP1 locus in the indicated JHRCC12 cells. c, The indicated JHRCC12 cells were assessed by ChIP-qPCR for the promoter and intron 7 of MMP1. Data shown are the percent input (mean ± s.d., n = 3 independent experiments). d, CAKI-2 cells were transiently transfected with either pGL2-pro or pGL2-pro containing the DNA fragment from the ATAC-seq peak at the intron 7 of MMP1 together with pRL-SV40. The firefly and Renilla luciferase activities were assessed and normalized (mean ± s.d., n = 3 independent experiments). e, The MMP1 mRNA was assessed in JHRCC12 cells transfected with dCas9–KRAB–MeCP2 and the indicated sgRNAs as in a. f, Whole cell lysates (WCL) and histone fractions from the indicated JHRCC12 cells were assessed by immunoblots. g, The MMP1 mRNA was assessed in the indicated JHRCC12 cells by qRT-PCR as in a. h, The indicated JHRCC12 cells were assessed by immunoblots. The asterisk denotes a cross-reactive band. Cellular proliferation was assessed by CellTiter-Glo assays. i, The indicated luciferase-transduced JHRCC12 cells were injected into subrenal capsules of unilateral kidneys of NSG mice to establish orthotopic xenografts. The weight of kidney tumors in each mouse was estimated by subtracting the weight of kidney without orthotopic implantation from that of kidney received subcapsular injection of the indicated JHRCC12 cells after 5–6 weeks. Data shown are mean ± s.d. (n = 4 mice for sgLacZ and n = 8 mice for sgMMP1). j, Bioluminescence images of athymic nude mice at the indicated times after intracardiac injection of the indicated luciferase-transduced JHRCC12 cells. k, Quantification of bioluminescence shown in j (mean ± s.d., n = 5 mice for each group). P = 0.0055 (two-way ANOVA). P values in a, c, d, e and g were determined by two-tailed unpaired Student’s t-test. *, P < 0.05; **, P < 0.01; ***, P < 0.001; ****, P < 0.0001.
To determine whether the ability of SETD2ΔN to suppress MMP1 expression requires its histone methyltrasferase activity, a previously reported recurrent mutation in human cancers that inactivates the histone methyltrasferase activity of SETD2 (R1625C)35 was introduced into SETD2ΔN. The R1265C mutation abrogated the ability of SETD2ΔN to restore H3K36me3 and to suppress MMP1 expression in JHRCC12 cells (Fig. 4f,g), supporting that SETD2-mediated trimethylation of H3K36 is responsible for the regulation of MMP1 expression. To determine the functional significance of MMP1 in promoting kidney tumor metastasis, CRISPR/Cas9-mediated knockout of MMP1 was performed in parental JHRCC12 cells followed by orthotopic transplantation and intracardiac injection. KO of MMP1 neither affected cell proliferation in vitro nor the growth of orthotopic xenografts in vivo when compared to the LacZ control (Fig. 4h,i). Importantly, KO of MMP1 greatly reduced metastases of JHRCC12 to liver and diaphragm and slightly reduced metastases to pancreas (Table 2). Intracardiac injection further confirmed that KO of MMP1 suppressed tumor metastases to brain, lung, and liver (Fig. 4j,k). Collectively, our data showed that loss of SETD2-mediated H3K36me3 increased chromatin accessibility and intronic enhancer activity of MMP1 to induce its expression, contributing to kidney cancer metastasis.
Table 2.
Summary of metastatic events of NSG mice at 5–6 weeks after subcapsular injection of the indicated JHRCC12 cells into unilateral kidneys.
| JHRCC12 | Pancreas | Liver | Diaphragm |
|---|---|---|---|
| sgLacZ | 4/4 (100%) | 4/4 (100%) | 3/4 (75%) |
| sgMMP1 | 6/8 (75%) | 2/8 (25.0%) | 2/8 (25.0%) |
SETD2 loss increases histone chaperone recruitment to chromatin.
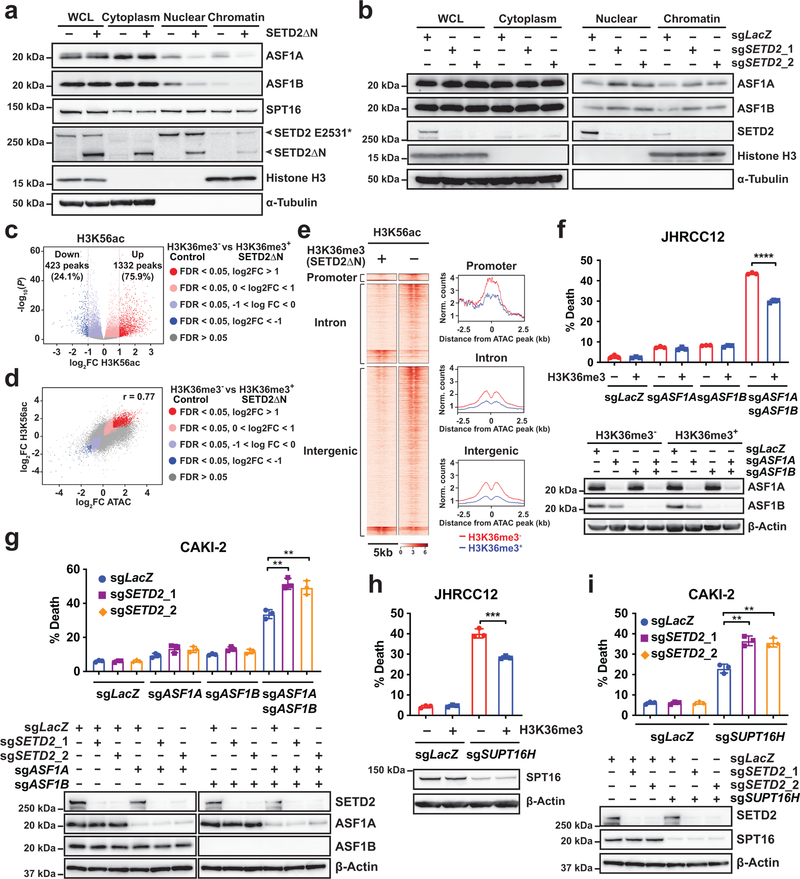
Histone chaperones regulate nucleosome assembly and disassembly and control chromatin dynamics36,37. In yeast, Set2 (the ortholog of SETD2)-mediated H3K36me3 has been shown to suppress the interaction of H3 with histone chaperones Asf1 and Spt16, prevent histone exchange over coding regions, and reduce the accessibility to Pol II in gene bodies6,37,38. Accordingly, we hypothesized that H3K36me3 loss-induced increase in chromatin accessibility may be caused by aberrant histone chaperone recruitment and activity. Indeed, restoration of H3K36me3 in JHRCC12 cells greatly reduced ASF1A and ASF1B (human orthologs of Asf1), but not SPT16 (the human ortholog of Spt16), in the nuclear and chromatin fractions (Fig. 5a). Reciprocally, KO of SETD2 increased the chromatin association of ASF1A and ASF1B in CAKI-2 kidney cancer cells (Fig. 5b). Of note, yeast Set2 can catalyze mono-, di-, and tri-methylation of H3K36 whereas mammalian SETD2 is only responsible for the trimethylation of H3K363–6.
Fig. 5 |. Loss of SETD2-mediated H3K36me3 increases histone chaperone recruitment and sensitizes cancer cells to genetic inactivation of histone chaperones.
a, Whole cell lysates (WCL), cytoplasm, nuclear, and chromatin fractions of the indicated JHRCC12 cells were analyzed by immunoblots. b, WCL, cytoplasm, nuclear, and chromatin fractions of the indicated CAKI-2 cells were analyzed by immunoblots. c, Volcano plot showing changes in ChIP-seq for H3K56ac comparing control (H3K36me3−) with SETD2ΔN-transduced (H3K36me3+) JHRCC12 cells. Peaks with differential enrichment for H3K56ac (FDR < 0.05; n = 11251) are highlighted. The number of peaks with significant changes (FDR < 0.05 and log2(FC) > 1; n = 1755) in H3K56ac is shown. d, Scatter plot showing correlation between log2(FC) of H3K56ac ChIP-seq and log2(FC) of ATAC-seq comparing H3K36me3− with H3K36me3+ JHRCC12 cells. Peaks with significant changes (FDR < 0.05) in both histone modification and chromatin accessibility are highlighted. e, Heatmaps and metapeak plots showing H3K56ac ChIP-seq in the same regions of ATAC-seq peaks in 5kb window. f, H3K36me3− and H3K36me3+ (SETD2ΔN-transduced) JHRCC12 cells were subjected to lentiviral CRISPR/Cas9-mediated KO of ASF1A (exon 1), ASF1B, or both ASF1A (exon 1) and ASF1B, and analyzed by immunoblots. Cell death was quantified by annexin-V staining (mean ± s.d., n = 3 independent transductions). g, CAKI-2 cells transduced with lentivirus expressing sgRNAs targeting LacZ or SETD2 were subsequently transduced with lentivirus expressing sgRNAs targeting LacZ, ASF1A, ASF1B, or both ASF1A and ASF1B, and analyzed by immunoblots. Cell death was quantified by annexin-V staining (mean ± s.d., n = 3 transductions). h, H3K36me3− and H3K36me3+ (SETD2ΔN-transduced) JHRCC12 cells were subjected to lentiviral CRISPR/Cas9-mediated KO of SUPT16H and analyzed by immunoblots. Cell death was quantified by annexin-V staining (mean ± s.d., n = 3 transductions). i, CAKI-2 cells transduced with lentivirus expressing sgRNAs targeting LacZ or SETD2 were subsequently transduced with lentivirus expressing sgRNAs targeting LacZ or SUPT16H. Cell death was quantified by annexin-V staining (mean ± s.d., n = 3 transductions). P values in f, g, h and i were determined by two-tailed unpaired Student’s t-test. *, P < 0.05; **, P < 0.01; ***, P < 0.001; ****, P < 0.0001.
Set2-loss induced increase in the chromatin recruitment of Asf1 has been shown to result in the enrichment of H3K56ac due to Asf1-mediated exchange of H3K56ac6,37,38. Because acetylation of H3K56 by the acetyltransferase Rtt109 occurs on soluble histones rather than on chromatin, H3K56ac is enriched at genomic regions undergoing histone exchange mediated by Asf16,39. We next examined whether loss of H3K36me3 in JHRCC12 cells affects histone exchange and consequently increases H3K56ac deposition. Indeed, ChIP-seq for H3K56ac revealed differential changes of H3K56ac at ~11.3K sites (FDR < 0.05) upon restoration of H3K36me3 in JHRCC12 cells (Supplementary Table 5), of which 34.9% were localized at introns, 41.9% at intergenic regions, and 22.1% at promoters (Extended Data Fig. 9). The majority of the differentially enriched H3K56ac peaks (FDR < 0.05) showed increased deposition upon H3K36me3 loss (Fig. 5c). Importantly, changes in H3K56ac positively correlated with alterations in chromatin accessibility induced by H3K36me3 loss in JHRCC12 (Fig. 5d,e and Supplementary Table 6). Collectively, loss of SETD2-mediated H3K36me3 is associated with increased nuclear/chromatin association of ASF1A/B and H3K56ac deposition, analogous to that observed in Set2-deficient yeast6,37,38.
SETD2 loss sensitizes cancer to inhibition of histone chaperones.
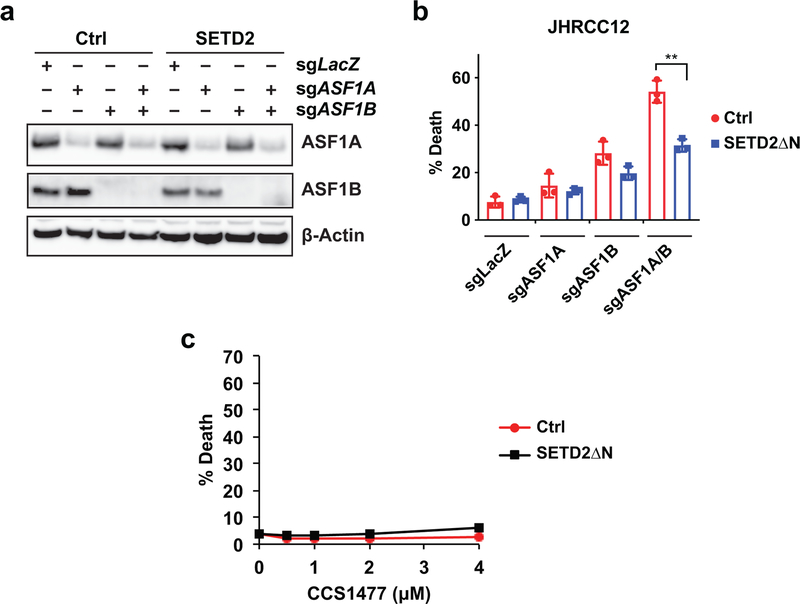
If H3K36me3-loss induced increase in histone exchange is required for creating a permissive epigenetic landscape to enhance oncogenic transcriptional output, it is conceivable that SETD2-deficient cancer would be more sensitive than SETD2-proficient cancer to the inactivation of ASF1A/B. Indeed, we found that KO of both ASF1A and ASF1B induced more apoptosis in H3K36me3-deficient than H3K36me3-proficient JHRCC12 cells (Fig. 5f and Extended Data Fig. 10a,b). Reciprocally, KO of SETD2 using two independent sgRNAs sensitized CAKI-2 cells to undergoing apoptosis upon KO of both ASF1A and ASF1B (Fig. 5g). Although loss of H3K36me3 had minimal impact on the chromatin association of SPT16, SETD2 loss-of-function sensitized both JHRCC12 and CAKI-2 to apoptosis triggered by KO of SUPT16H (gene name of SPT16) (Fig. 5h,i). H3K36me3 loss-induced chromatin recruitment of ASF1A/B potentially leads to increased chromatin accessibility to other histone chaperones including SPT16, establishing a feed-forward amplification loop for the maintenance of open chromatin status.
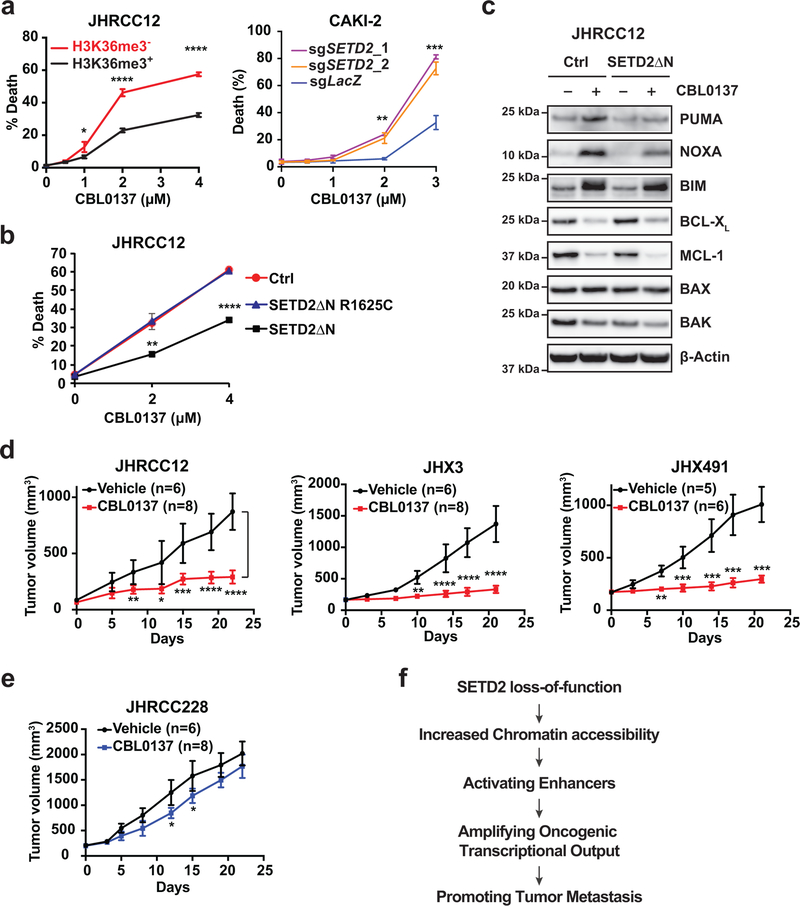
As SPT16 is a component of the FACT (facilitates chromatin transcription) complex, we next examined whether SETD2 loss also sensitizes cancer cells to the FACT complex inhibitor CBL013740. Similar to KO of SUPT16H, loss of SETD2-mediated H3K36me3 sensitized JHRCC12 and CAKI-2 to apoptosis triggered by CBL0137 (Fig. 6a). Notably, the catalytic inactive mutation R1625C abrogated the ability of SETD2ΔN to suppress CBL0137-induced apoptosis in JHRCC12 cells (Fig. 6b), suggesting that SETD2-mediated trimethylation of H3K36 determines the sensitivity of cancer cells to CBL0137-induced apoptosis. p300/CBP can acetylate both H3K56 and H3K27; however, only acetylation of H3K56 is dependent on ASF1 because K56 is located in the H3 histone-fold domain41,42. In stark contrast to the sensitization of SETD2-deficient cancer cells to genetic or chemical inhibition of histone chaperones (Fig. 5 and Fig. 6), loss of SETD2-mediated H3K36me3 did not sensitize cancer cells to the inhibitor of p300/CBP, CCS1477 (Extended Data Fig. 10c). These data indicate that histone chaperone activity rather than histone acetylation is required for the maintenance of SETD2-deficient cancer. Activation of enhancers appears to contribute to tumor metastasis rather than tumor maintenance in SETD2-deficient cancer. Overall, our data reveal a critical role of histone chaperons in the tumor suppressor function of SETD2.
Fig. 6 |. Loss of SETD2-mediated H3K36me3 sensitizes cancer cells to inhibition of the FACT complex.
a, H3K36me3− and H3K36me3+ (SETD2ΔN-transduced) JHRCC12 cells as well as CAKI-2 cells transduced with the indicated sgRNAs were treated with the FACT complex inhibitor CBL0137 at the indicated concentrations. Cell death was quantified by annexin-V staining (mean ± s.d., n = 3 independent experiments). *, P < 0.05; **, P < 0.01; ***, P < 0.001; ****, P < 0.0001 (two-tailed unpaired Student’s t-test). b, JHRCC12 cells infected with control retrovirus or retrovirus expressing SETD2ΔN_R1625C or SETD2ΔN_WT were treated with CBL0137 at the indicated concentrations. Cell death was quantified by annexin-V staining (mean ± s.d., n = 3 independent experiments). **, P < 0.01; ****, P < 0.0001 (two-tailed unpaired Student’s t-test). c, JHRCC12 cells infected with control retrovirus or retrovirus expressing SETD2ΔN were untreated or treated with CBL0137 (2 μM) and assessed by the indicated immunoblots. d, NSG mice bearing patient-derived VHLMTPBRM1MTSETD2MT ccRCC xenografts (JHRCC12, JHX3 and JHX491) were treated with vehicle or CBL0137 (60 mg/kg, twice weekly). *, P < 0.05; **, P < 0.01; ***, P < 0.001; ****, P < 0.0001 (Multiple t-test, Sidak-bonferroni). e, NSG mice bearing patient-derived VHLMTPBRM1MTSETD2WT ccRCC xenografts (JHRCC228) were treated with vehicle or CBL0137 (60 mg/kg, twice weekly). *, P < 0.05 (Multiple t-test, Sidak-bonferroni). f, A schematic summarizing the tumor suppressor model of SETD2 in kidney cancer metastasis. In panels d, e: n = number of mice.
To understand why SETD2-deficient cancer cells are more prone to undergo apoptosis in response to CBL0137 than SETD2-proficent cancer cells, we focused on the BCL-2 family proteins that control a crucial checkpoint of apoptosis at the mitochondria43. Initiation of the BCL-2 regulated apoptotic cascade occurs through the transcriptional and post-translational activation of proapoptotic BH3-only molecules (BH3s), which serve as death sentinels that either directly activate the apoptotic effectors BAX and BAK (“activator” BH3s, such as BID, BIM, PUMA, and NOXA) or inactivate anti-apoptotic BCL-2, BCL-XL, and MCL-1 (“inactivator” BH3s, such as BAD)44–48. Interestingly, more PUMA, NOXA, and BIM were induced in H3K36me3− than H3K36me3+ JHRCC12 cells upon CBL0137 treatment (Fig. 6c), which would contribute to more apoptotic induction in H3K36me3− than H3K36me3+ JHRCC12 cells (Fig. 6a). Comparable downregulation of anti-apoptotic BCL-XL and MCL-1 was observed in both H3K36me3− and H3K36me3+ JHRCC12 cells. Of note, JHRCC12 expressed little BCL-2. We next assessed the in vivo therapeutic efficacy of CBL0137 in mice bearing JHRCC12 xenografts as well as two additional patient-derived VHLMTPBRM1MTSETD2MT ccRCC xenografts (JHX3 and JHX491). CBL0137 treatment markedly suppressed the growth of all three models (Fig. 6d). Consistent with our in vitro findings that loss of SETD2-mediated H3K36me3 sensitizes cancer cells to CBL0137-induced apoptosis (Fig. 6a,b), mice bearing patient-derived VHLMTPBRM1MTSETD2WT ccRCC xenografts (JHRCC228) responded minimally to CBL0137 treatment (Fig. 6e).
Discussion
Our integrated analyses of RNA-seq, ATAC-seq, and ChIP-seq data uncovered an epigenetic tumor suppressor model of SETD2 in which loss of SETD2-mediated H3K36me3 creates a permissive epigenetic landscape, consisting of open chromatin architecture and active/permissive histone modifications, enabling cooperating oncogenic drivers to further amplify the transcriptional output (Fig. 6f). It is conceivable that the oncogenic transcription programs activated upon loss of SETD2 will not only depend on the respective cooperating drivers but also the participating transcription factors and chromatin modifiers present in different cancer types, thereby conferring context-dependent requirement of distinct oncogenic cooperation. This helps explain why SETD2 mutations occur in a wide variety of human cancers and are associated with diverse oncogenic drivers. Mechanistically, we showed that loss of H3K36me3 led to increased chromatin association of histone chaperones ASF1A/B, increased exchange of H3K56ac, and consequently a genome-wide increase of H3K56ac that coincided with open chromatin. Consistent with the requirement of histone chaperones for the establishment of an epigenetic landscape permissive for tumorigenesis upon the loss of H3K36me3, SETD2-deficient cancer cells were more sensitive to genetic and chemical inhibition of histone chaperones. Importantly, the in vivo therapeutic efficacy of the FACT complex inhibitor CBL0137 was demonstrated in mice bearing VHLMTPBRM1MTSETD2MT but not VHLMTPBRM1MTSETD2WT ccRCC xenografts (Fig. 6d,e). Of note, SETD2 deficiency is reported to confer resistance to genotoxic chemotherapy in leukemia49.
Although SETD2-dependent H3K36me3 marks are enriched in actively transcribed gene bodies5,50, our results indicate that loss of SETD2 and H3K36me3 counterintuitively increases transcriptional output. Our data suggest that SETD2-mediated co-transcriptional methylation of H3K36 appears to maintain closed chromatin structure over gene bodies by reducing the binding affinity of histone chaperones for histones and limiting histone dynamics, which is analogous to the reported role of Set2-mediated H3K36me3 in preventing cryptic transcription initiation in yeast6. The discovery of epigenetic regulators as a new major class of cancer genes presents challenges as well as opportunities for the development of novel cancer therapeutics. Our studies illustrate how the mechanistic elucidation of the tumor suppressor function of SETD2 can help discover therapeutic vulnerabilities and render actionable therapeutic targets for the treatment of SETD2-deficient cancers. Given that SETD2 is mutated in a wide variety of human cancers, our findings are poised to provide insights into cancer biology and therapeutics beyond kidney cancer.
Methods
Mice and in vivo procedures.
All animal experiments were performed in accordance with the Institutional Animal Care and Use Committee at Memorial Sloan Kettering Cancer Center (MSKCC). Ksp-Cre+ mice were obtained from the Jackson Laboratory. Setd2F/F mice were generated by Beijing Biocytogen Co., Ltd. Ksp-Cre+ and Setd2F/F mice were bred to generate Setd2F/FKsp-Cre+ mice. All animals were maintained on a mixed C57BL/6J x 129SvJ genetic background. To establish orthotopic xenografts, 1×10⁵ luciferase-labeled cells were resuspended in 20 μl PBS and inoculated under the renal capsules of left kidneys of 7–8 week-old NOD.Cg-Prkdcscid Il2rgtm1Wjl/SzJ (NSG, the Jackson Laboratory) mice. For intracardiac injection, athymic nude mice (NU(NCr)-Foxn1nu, Charles River Laboratories) were anesthetized and 1×10⁵ luciferase-labeled cells resuspended in 100 μl PBS were injected into the left ventricle via the third intercostal space. Tumor burden and distant metastases were monitored by bioluminescence imaging every week starting from 2 weeks after intracardiac injection. For imaging, 75 mg/kg of D-Luciferin (Xenogen) in PBS was injected retro-orbitally into anesthetized mice. Bioluminescence images were obtained with the IVIS Imaging System (Xenogen) and analyzed using the Living Image software (Xenogen). The mice with tumors detected by bioluminescence imaging were closely monitored and euthanized at 5–6 weeks post injection. Local tumor invasion and metastases to pancreas, lung, liver, bone, brain etc. were examined. Tumors were harvested for histopathological and molecular analyses. The PDX models (JHRCC12, JHRCC228, JHX3 and JHX491) were derived from ccRCC patients in accordance with the MSKCC Institutional Review Board approved tissue collection protocol with informed consent from the patient and propagated in female 7–8 week-old NSG mice. For the treatment of PDX models, dissociated patient-derived tumor samples in 0.2 ml 50% Matrigel (BD Biosciences) were injected subcutaneously in NSG mice. Tumor growth was monitored by calipers (volume = length x width2/2) twice weekly. Tumor-bearing mice were randomized into treatment groups when tumor volume reached ~150 mm3. CBL0137 (Selleck Chemicals) was formulated in 50 mg/mL Captisol and administered intravenously twice weekly at 60 mg/kg for 3 weeks. The body weights of the mice were monitored twice weekly.
Cell culture and viability assay.
CAKI-2, 786-O and A549 cell lines were obtained from the American Type Culture Collection (ATCC) and cultured according to the recommendations of ATCC. JHRCC12 cell line was generated and cultured as described24. For generation and culture of renal tubular epithelial cells, kidneys were dissected from sex-matched Setd2F/FKsp-Cre+ and Setd2F/F mice at 4–5 weeks of age. Kidney cortices were minced and digested in advanced DMEM/F12 (Thermo Fisher Scientific) containing liberase (Sigma) for 1h at 37 °C. Digested samples were filtered through 40 μm strainers (BD Biosciences) and washed with cold Hank’s Balanced Salt Solution (Thermo Fisher Scientific) twice. Finally, samples were resuspended in advanced DMEM/F12 supplemented with penicillin/streptomycin (Thermo Fisher Scientific), non-essential amino acids (Thermo Fisher Scientific), glutamine (Thermo Fisher Scientific), 10 mM HEPES (Thermo Fisher Scientific), Insulin-Transferrin-Selenium (Thermo Fisher Scientific), 20 ng/ml EGF (R & D Systems), and 100 nM hydrocortisone (Sigma), and plated in dishes. Cell death was quantified by annexin-V (BioVision) staining as described51, followed by flow cytometric analyses using an LSRFortessa (BD Biosciences). Data were analyzed using FACSDiva (BD Biosciences).
Immunohistochemistry.
Mouse kidneys were fixed in 10% formalin overnight at room temperature. The fixed kidneys were processed and embedded in paraffin. Immunohistochemistry (IHC) for H3K36me3 and CA-IX was performed on Ventana (Discovery XT platform) by the Laboratory of Comparative Pathology at MSKCC. The following primary antibodies were used for IHC: H3K36me3 (Abcam, ab9050) and CA-IX (Novus Biologicals, NB100–417).
Plasmid construction and CRISPR/Cas9-mediated genome editing.
Human SETD2 with deletion of the N-terminal 1241 amino acid residues was tagged with 3xFLAG at the N-terminus and cloned into pBABE-puro (Addgene). sgRNAs were designed using Optimized CRISPR Design (http://crispr.mit.edu/) and cloned into lentiCRISPRv252 (Addgene). sgRNA targeting the intron 7 enhancer in MMP1 was cloned into LRG53 (Lenti_sgRNA_EFS_GFP, Addgene). All constructs were confirmed by DNA sequencing. dCas9–KRAB–MeCP2 was obtained from Addgene34. Lentivirus was produced as described51. The sequences of sgRNAs were summarized in Supplementary Table 7.
Reverse transcription and quantitative real-time PCR.
Total RNA was extracted from cells or tissues using Trizol (Thermo Fisher Scientific). Reverse transcription was performed with oligo-dT plus random decamer primers (Thermo Fisher Scientific) using Superscript II (Thermo Fisher Scientific). Quantitative PCR was performed with SYBR green master mix (Thermo Fisher Scientific) in duplicates using the gene specific primers on a ViiA 7 Real-Time PCR System (Thermo Fisher Scientific). Data were normalized against β-Actin. Primers for qRT-PCR are listed in Supplementary Table 7.
Histone extraction and immunoblot analysis.
To extract histones, cells were lysed in lysis buffer (0.5% Triton X-100, 150 mM NaCl, 1.5 mM MgCl2, 4 mM Sodium butyrate, 100 mM Tris pH 7.5) supplemented with complete protease inhibitors (Roche) for 10 min on ice, washed once with the lysis buffer, and re-resuspended in 0.4N HCl for 1h on ice. After centrifugation at 13,000 rpm, proteins in the supernatant were precipitated with 10X volume of acetone at −20 °C overnight. The pellet was then washed once with cold acetone and resuspended in deionized water. To prepare whole cell lysates, cultured cells were lysed in RIPA buffer, and dissected tumors were minced to pieces in RIPA buffer and homogenized by FastPrep-24 homogenizer (MP Biomedicals). Protein concentration was determined by BCA kit (Pierce). Extracted histones or whole cell lysates were resolved by 10 % or 4–12% NuPAGE gels (Thermo Fisher Scientific) and transferred onto PVDF membranes (Immobilon-P, Millipore). Antibody detection was accomplished using enhanced chemiluminescence method (Western Lightning Plus-ECL, PerkinElmer) and LAS-3000 Imaging system (FUJIFILM). Antibodies used for immunoblot analyses are listed as follows: anti-SETD2 (Sigma, HPA042451), anti-H3K4me3 (Abcam, ab8580), anti-H3K9me3 (Abcam, ab8898), anti-H3K27me3 (Cell Signaling Technology, 9733), anti-H3K27ac (Abcam, ab4729), anti-H3K36me3 (Abcam, ab9050), anti-H3 (Cell Signaling Technology, 14269), anti-ASF1A (Cell Signaling Technology, 2990S), anti-ASF1B (Cell Signaling Technology, 2902S), anti-SPT16 (Cell Signaling Technology, 12191), anti-MMP1 (Proteintech, 10371–2-AP), anti-Actin (Sigma, A1978), anti-Tubulin (Millipore, MAB1637), anti-BCL-2 (6C8), anti-BCL-XL (Cell Signaling Technology, 2762), anti-MCL-1 (Santa Cruz Biotechnology, sc-819), anti-BAK (Cell Signaling Technology, 12105), anti-BAX (Santa Cruz Biotechnology, sc-493), anti-BIM (Covance), anti-PUMA (Cell Signaling Technology, 12450S), and anti-NOXA (Thermo Fisher Scientific, MA1–41000). Immunoblots were quantified using ImageJ software.
Chromatin Fractionation.
Chromatin fractionation was performed as described previously54. Briefly, 10 million cells were collected, washed with PBS, and lysed in buffer A (10 mM HEPES, pH7.9, 10 mM KCl, 1.5 mM MgCl2, 0.34 M sucrose, 10% Glycerol, 1 mM DTT, 0.1% Triton X-100) supplemented with complete protease inhibitors (Roche). Cells were incubated on ice for 8 min followed by centrifugation at 1,300g at 4°C for 5 min. The supernatant was further clarified by centrifugation at 20,000g at 4°C for 15 min to obtain the supernatant as the cytosolic fraction. The nuclei pellet was washed with buffer A twice and lysed in buffer B (3 mM EDTA, 0.2 mM EGTA, 1 mM DTT) supplemented with complete protease inhibitors (Roche) on ice for 30 min. Chromatin was collected by centrifugation at 1,700 g at 4°C for 5 min.
Dual-luciferase reporter assay.
The indicated sequence of human MMP1 intron 7 was amplified from genomic DNA by PCR and cloned into pGL2-Promoter vector (Promega) upstream of the SV40 promoter. CAKI-2 cells were co-transfected with pGL2-Pro or pGL2-Pro containing the aforementioned DNA fragment together with pRL-SV40 (Promega) using Lipofectamine 2000 (Thermo Fisher Scientific). The firefly and Renilla luciferase activities were assessed 36 hours after transfection using the Dual-Luciferase Reporter Assay System (Promega). The firefly luciferase activity was normalized against the Renilla luciferase activity.
ATAC-seq and analysis.
50,000 cells were used for the transposition reaction at 37 °C for 30 min. After purification of the DNA with the MinElute PCR purification kit (Qiagen), material was amplified for 5 cycles as described previously55. Additional PCR cycles were evaluated by real time PCR. Final product was cleaned by AMPure Beads at a 1.5x ratio. Libraries were sequenced by the Integrated Genomics Operation Core Facility at MSKCC on a HiSeq 2500 1T in a 50bp/50bp paired-end run using the TruSeq SBS Kit v3 (Illumina). An average of 50 million paired reads were generated per sample. Raw reads were trimmed and filtered for quality using Trimmomatic56. Trimmed reads were mapped to the mm10 or hg19 genome assembly using Bowtie257 and non-uniquely mapping reads were removed. The reads were adjusted by shifting all positive-strand reads 4bp downstream and all negative-strand reads 5bp upstream to center the reads on the transposase binding event. Peak calling was performed on each replicate and all replicates were merged together using MACS2 with ‘--extsize 200 --shift −100 --nomodel’ parameters58. Using MACS2 bdgcmp with ‘-m ppois’ parameter, the Poisson p-value was generated for each individual replicate. To find a set of peaks that are reproducible across replicates, we calculated the irreproducible discovery rate (IDR)59 on peaks called from merged samples using p-values computed separately in each replicate of each cell type. We excluded peaks with an IDR greater than 0.05 across every pair of replicates within each cell type. Peaks found reproducibly in each condition were combined to create a genome-wide atlas of accessible chromatin sites. The annotation of the atlas and differential accessibility analysis of the peaks was performed as previously described60. Using the MEME44-curated CisBP45 transcription factor binding motif (TFBM) reference, we scanned the ATAC-seq peak atlas with FIMO29 to find peaks likely to contain each TFBM (P < 10−5). Relative transcription factor accessibility was determined using two one-sided Wilcoxon rank sum tests comparing the distributions of peak heights for peaks containing FIMO predicted transcription factor binding sites.
ATAC-seq peak atlas summary.
For JHRCC12 cells, a total number of 78,647 reproducible ATAC-seq peaks were identified. Among these peaks, 18.6% were found in promoters, 37.9% in introns, 41.9% in intergenic regions, and 1.6% in exons. For murine renal tubular epithelial cells, a total number of 63,293 reproducible ATAC-seq peaks were identified. Among these peaks, 21.4% were found in promoters, 36.1% in introns, 41.3% in intergenic regions, and 1.2% in exons.
RNA-seq and analysis.
JHRCC12 cells were lysed in Trizol. Total RNA was extracted and cleaned up using RNeasy Mini Kit (Qiagen). Library preparation and sequencing were performed by the Integrated Genomics Operation Core Facility at MSKCC. After RiboGreen quantification and quality control of Agilent BioAnalyzer, 6–15 ng of total RNA underwent amplification (12 cycles) using the SMART-seq V4 (Clontech) Ultra Low Input RNA kit for sequencing. 10 ng of amplified cDNA was used to prepare Illumina HiSeq libraries with the Kapa DNA library preparation chemistry (Kapa Biosystems) using 8 cycles of PCR. Samples were barcoded and run on a HiSeq 4000 in a 50bp/50bp Paired end run, using the TruSeq SBS Kit v3 (Illumina). An average of 60 million paired reads were generated per sample and the percent of mRNA bases was 73% on average. Raw reads were trimmed and filtered for quality using Trimmomatic56. Processed reads were then aligned against the mm10 version of the mouse genome or hg19 version of the human genome using STAR61. For each RefSeq annotated gene, reads overlapping with exon regions were counted using HTSeq62. Gene-level differential expression analysis was conducted using DESeq263. Differentially expressed genes detected by RNA-seq (FDR < 0.05) were subjected to GSEA analysis using the JAVA GSEA 3.0 program64. The gene sets from the Molecular Signature Database (MSigDB) including c2 (curated gene sets), c5 (gene ontology gene sets), and c6 (oncogenic signatures gene sets) were used for the analysis. The composite KRAS signature was generated by merging the gene sets from MSigDB including KRAS.600_UP.V1_UP, KRAS.600.LUNG.BREAST_UP.V1_UP, KRAS.BREAST_UP.V1_UP, KRAS.LUNG_UP.V1_UP, KRAS.KIDNEY_UP.V1_UP. The PTEN_DN_UP signature was generated by merging PTEN_DN.V1_UP and PTEN_DN.V2_UP data sets from MSigDB. The metastasis signature was derived from the genes that were upregulated in metastatic tumors in brain compared to the primary breast cancer27. WINTER_HYPOXIA_UP was used as the hypoxia signature. KIM_MYC_AMPLIFICATION_TARGETS_UP was used as the MYC signature. The STAT signature was generated by merging GO_REGULATION_OF_STAT_CASCADE and KEGG_JAK_STAT_SIGNALING_PATHWAY gene sets from MSigDB.
Diamond plots.
Genes with both differential expression detected by RNA-seq (FDR < 0.05) and differentially accessible ATAC-seq peaks (FDR < 0.05) in response to restoration of H3K36me3 were used to generate the diamond plots. The top 25 most upregulated and 25 most downregulated genes were presented. In these plots, the accessibility landscape of each gene is represented by a stack of diamonds corresponding to accessible chromatin sites assigned to the gene. The y coordinate of the bottom-most peak in this stack gives the log2 fold change (log2FC) in expression of the gene. The diamonds are colored according to the accessibility change of the ATAC-seq peak, with blue indicating closing and red indicating opening. The color scale was based on the rank-order of the peak accessibility changes. The color scale ranges from a log2 fold change of −2.24 to 2.87 for the transcriptome data in JHRCC12.
Transcriptome analysis of human clear cell renal cell carcinoma.
RNA-seq data of human ccRCC samples were obtained from The Cancer Genome Atlas (TCGA). Samples with PBRM1 mutations but no BAP1 mutations were selected. Gene-level differential expression analysis was conducted using DESeq2 to compare transcriptome of SETD2 mutant (n = 29) with SETD2 wild-type (n = 113) ccRCC samples.
Survival analysis of human clear cell renal cell carcinoma patients.
The singscore R package65 was used for single sample SETD2 signature enrichment score calculation in the TCGA KIRC cohort. The top 50% patients with the highest signature enrichment score was defined as the “highest 50%” group and the bottom 50% with the lowest signature enrichment score was defined as the “lowest 50%” group. Kaplan-Meier survival analysis for these two groups was conducted using the TCGAbiolinks R package66.
ChIP-seq and analysis.
ChIP-seq for H3K4me1, H3K4me3, H3K27ac, H3K27me3, H3K36me3 and H3K56ac were performed in JHRCC12 cells. Library preparation and sequencing were performed by the Integrated Genomics Operation Core Facility at MSKCC on a HiSeq 2500 1T in a 50bp/50bp paired-end run. Reads were aligned to hg19 using BWA with parameters ‘-q 5 -l 32 -k 2’67. Uniquely aligned paired reads were extracted using SAMtools with parameters ‘view -F 1804 -f 2 -q 30’68. PCR duplicates were removed using Picard tools. Peak calling was performed for each individual and pooled replicates of each cell type using MACS2 v2.1.2 with parameters ‘-g hs -p 0.01 --keep-dup all --no-model -c $input_dna_control’58. To find reproducible peaks across replicates for each histone mark, we calculated the irreproducible discovery rate (IDR) using IDR v2 with parameters ‘--samples rep1.narrowPeak rep2.narrowPeak --peak-list pooled.narrowPeak -o --plot’59. We combined peaks passing an IDR threshold of 0.05 in each condition for each histone mark. Then, each peak was assigned to the closest gene as previously described60. ChIP-seq read counts in the peak atlas were obtained for each histone mark using featureCounts69. DESeq263 was applied to these counts to find the differential occupancy of each histone mark between conditions. Bedtools genomeCoverageBed70 was used to generate bedgraph files scaled with DESeq2 sample size factors, and bedgraph files were converted to bigwig using UCSC bedgraph2bigwig71 for all histone marks except H3K36me3. To estimate sample size factors for H3K36me3, we applied DESeq2 to read counts in gene deserts, defined as regions with at least 1 Mbp length without gene annotations. Metaplots were generated for each histone mark from DESeq2-normalized bigwig files using deeptools72.
ChIP-seq peak atlas summary.
For H3K4me3, a total number of 23,554 reproducible peaks were identified in JHRCC12 cells. Among these peaks, 61.3% were found in promoters, 19.6% in introns, 17.9% in intergenic regions, and 1.2% in exons. For H3K4me1, a total number of 107,699 reproducible peaks were identified. Among these peaks, 22.7% were found in promoters, 43.0% in introns, 32.8% in intergenic regions, and 1.5% in exons. For H3K27ac, a total number of 49,639 reproducible peaks were identified. Among these peaks, 30.7% were found in promoters, 37.6% in introns, 30.2% in intergenic regions, and 1.5% in exons. For H3K27me3, a total number of 32,768 reproducible peaks were identified. Among these peaks, 18.4% were found in promoters, 32.9% in introns, 48.1% in intergenic regions, and 0.6% in exons. For H3K56ac, a total number of 42,027 reproducible H3K56ac peaks were identified. Among these peaks, 34.9% were found in promoters, 31.2% in introns, 32.9% in intergenic regions, and 1.0% in exons.
Chromatin immunoprecipitation and quantitative PCR.
2 × 10⁶ cells were cross-linked with 1% paraformaldehyde for 10 min at room temperature and quenched by glycine. Cells were washed with cold PBS, pelleted by centrifugation, and lysed. After sonication, samples were spun down and incubated with 1 μg primary antibody for each ChIP experiment at 4 °C overnight. Magnetic beads (Thermo Fisher Scientific) were added the next day and incubated at 4 °C for 2h. Samples were then washed, and histone complexes were eluted. The eluted samples were treated with RNase A, proteinase K, reversed crosslink, and purified with Qiagen PCR purification kit. The purified DNA samples were subjected to quantitative PCR using the gene specific primers listed in Supplementary Table 7. Antibodies used for ChIP are listed as follows: H3K4me3 (Abcam, ab8580), H3K4me1 (Abcam, ab8895), H3K27me3 (Cell Signaling Technology, 9733), H3K27ac (Abcam, ab4729), H3K36me3 (Abcam, ab9050), H3K56ac (Millipore, 07–677), and rabbit IgG (Abcam, ab171870). Data were normalized as percentage of input.
Statistics and reproducibility.
IHC quantification, qRT-PCR, dual-luciferase reporter assays, cell death assays, and ChIP-qPCR were analyzed for statistical significance using two-tailed unpaired parametric Student’s t-test (Prism 6.0 and 8.0, GraphPad Software). Data were presented as mean ± s.d. with P < 0.05 considered statistically significant unless otherwise stated. Statistical significance was denoted as *, P < 0.05; **, P < 0.01; ***, P < 0.001; ****, P < 0.0001. The number of independent experiments, samples or events were indicated in the figure legends. No data were excluded from the analyses. No statistical method was used to predetermine sample size. For all of the in vivo experiments, animals were randomly assigned to experimental groups. The starting tumor burden in the treatment and control groups was similar before treatment. For the in vitro experiments, all samples were analyzed equally with no sub-sampling; therefore, there was no requirement for randomization. For the in vivo experiments, tumor measurements by digital caliper were performed in a blinded manner. The in vitro experiments were not performed in a blinded manner as the investigator needed to know the treatment groups in order to complete the study.
Reporting Summary.
Further information on research design is available in the Nature Research Reporting Summary linked to this article.
Data availability
Raw ATAC-seq, RNA-seq and ChIP-seq sequencing data as well as the normalized tracks that support the findings of this study have been deposited in the GEO database under GSE146583. Further information and requests for resources and reagents should be directed to the corresponding author. All unique/stable reagents generated in this study are available from the corresponding author with a completed Materials Transfer Agreement. Source data are provided with this paper.
Code Availability
Sequencing data processing and analysis was performed using open-source software packages. RNA-seq analysis was conducted using Trimmomatic (v0.38), STAR (v2.7.1a), HTSeq (v0.11.2), and DESeq2 (v1.22.2) as reported60. ATAC-seq analysis was performed using Trimmomatic (v0.38), Bowtie2 (v2.3.4.3), MACS2 (v2.1.2), and IDR (v2.0.3) by using scripts in https://github.com/ENCODE-DCC/atac-seq-pipeline/tree/master/src with setting ‘--extsize 200 --shift −100 --nomodel’ for the peak calling step. ChIP-seq analysis was performed using BWA (v0.7.17-r1188), SAMtools (v1.9), Picard (v2.18.16), MACS2 (v2.1.2), and IDR (v2.0.3) by using scripts in https://github.com/ENCODE-DCC/chip-seq-pipeline2/tree/master/src. Each ATAC-seq and ChIP-seq peak was assigned to the closest gene as in https://github.com/hchintalapudi/ATAC-seq-ATAC-array/blob/777fbb6d9e281e7715ba15b7522c846f3b6234b2/As_Atlas_creation.R and counts in these peaks were obtained using featureCounts (v1.6.4). The differential analyses were performed using gene counts for RNA-seq and peak counts for ATAC-seq and ChIP-seq following DESeq2 (v1.22.2) pipeline (https://github.com/mikelove/DESeq2). Bedgraph files for each genomic dataset were generated using bedtools (v2.27.1) genomeCoverageBed scaled with (-scale) DESeq2 size factors (https://github.com/arq5x/bedtools/blob/master/docs/content/tools/genomecov.rst). Those scaled bedgraph files were converted to normalized bigwig tracks using UCSC bedgraph2bigwig. Heatmaps and metaplots of ChIP-seq and ATAC-seq data were generated using deepTools (v3.1.1) plotHeatmap (https://github.com/deeptools/deepTools/blob/master/docs/content/tools/plotHeatmap.rst) and plotProfile (https://github.com/deeptools/deepTools/blob/master/docs/content/tools/plotProfile.rst) functions by providing peaks as bed files and normalized bigwig files.
Extended Data
Extended Data Fig. 1. Restoration of H3K36me3 in SETD2 mutant ccRCC cells suppresses tumor metastasis.
a-b, Representative bioluminescence images of NOD.Cg-Prkdcscid Il2rgtm1Wjl/SzJ (NSG) mice injected with the indicated JHRCC12 cells into subrenal capsules of unilateral kidneys are shown in a and the quantification of bioluminescence is shown in b (mean ± s.d., n = 5 for H3K36me3-deficient and n = 4 for H3K36me3-proficient). n.s., not significant (two-tailed unpaired Student’s t-test). c, Representative gross images of the indicated organs in mice received subrenal capsule injection of the indicated JHRCC12 cells. Yellow arrowheads indicate metastatic tumors.
Extended Data Fig. 2. Summary of differentially expressed genes in H3K36me3− compared to H3K36me3+ JHRCC12 cells as well as in SETD2MT compared to SETD2WT ccRCC.
a, Venn diagram showing overlap of differentially upregulated genes (FDR < 0.05, log2(FC) > 0) in H3K36me3− compared to H3K36me3+ (SETD2ΔN-transduced) JHRCC12 cells and differentially upregulated genes (FDR < 0.05, log2(FC) > 0) in SETD2MT compared to SETD2WT ccRCC from the TCGA-KIRC dataset. b, Venn diagram showing overlap of differentially downregulated genes (FDR < 0.05, log2(FC) < 0) in H3K36me3− compared to H3K36me3+ (SETD2ΔN-transduced) JHRCC12 cells and differentially downregulated genes (FDR < 0.05, log2(FC) < 0) in SETD2MT compared to SETD2WT ccRCC from the TCGA-KIRC dataset. c, The open chromatin peaks comparing H3K36me3-with H3K36me3+ JHRCC12 cells were enriched for the binding motifs of STAT family transcription factors.
Extended Data Fig. 3. Genes that are upregulated in SETD2ΔN-transduced compared to SETD2-deficient JHRCC12 cells have higher H3K36me3 levels than downregulated genes in SETD2ΔN-transduced cells.
a, Normalized H3K36me3 ChIP-seq counts in SETD2-deficient JHRCC12 cells over gene bodies of stringently up- and down-regulated genes (FDR < 0.05 and log2(FC) >1) in SETD2-proficient (SETD2ΔN-transduced) compared to SETD2-deficient cells. b, Normalized H3K36me3 ChIP-seq counts in SETD2ΔN-transduced JHRCC12 cells over gene bodies of stringently up- and down-regulated genes (FDR < 0.05 and log2(FC) >1) in SETD2-proficient (SETD2ΔN-transduced) compared to SETD2-deficient cells. Centers of the boxes indicate median values, the lower and upper hinges correspond to the first and third quartiles and the upper (lower) whiskers extend from the hinge to the largest (smallest) value no further than 1.5 times the distance between the first and third quartiles. P values were calculated using one-sided Wilcoxon rank sum tests. c, Cumulative distribution of H3K36me3 levels in SETD2ΔN-transduced cells over gene bodies of significantly upregulated (red) or downregulated (blue) genes (FDR < 0.05) in SETD2-proficient (SETD2ΔN-transduced) compared to SETD2-deficient cells. P values were calculated using one-sided KS test comparing H3K36me3 levels in differentially expressed genes to all genes. d, Metaplots showing the normalized average levels of histone marks across gene bodies of stringently upregulated genes (FDR < 0.05 and log2(FC) > 1, n=174) comparing H3K36me3+ (SETD2ΔN-transduced) with H3K36me3− (control) JHRCC12 cells by ChIP-seq. e, Metaplots showing the normalized average levels of histone marks across gene bodies of stringently downregulated genes (FDR < 0.05 and log2(FC) < −1, n=194) comparing H3K36me3+ (SETD2ΔN-transduced) with H3K36me3− (control) JHRCC12 cells by ChIP-seq. TSS, transcription start site; TES, transcription end site.
Extended Data Fig. 4. Loss of SETD2-mediated H3K36me3 induces genome-wide epigenetic changes.
a. Pie chart showing the percentage of differentially enriched ChIP-seq peaks (FDR < 0.05) for each histone mark in promoter, intronic, intergenic, and exonic regions comparing H3K36me3− with H3K36me3+ (SETD2ΔN-transduced) JHRCC12 cells. b. Heatmap of differentially accessible ATAC-seq peaks (FDR < 0.05 and log2(FC) > 1) assigned to an upregulated gene, in a 5kb window grouped by localization at promoter, intron, and intergenic regions (n = 1012). c. Heatmap of differentially accessible ATAC-seq peaks (FDR < 0.05 and log2(FC) > 1) assigned to a downregulated gene, in a 5kb window grouped by localization at promoter, intron, and intergenic regions (n = 456).
Extended Data Fig. 5. Open chromatin regions that are not affected by the status of H3K36me3 show no differences in both enhancer and promoter marks.
a. Heatmaps for non-differential ATAC-seq peaks (FDR > 0.05; n = 24016) in 5kb window grouped by localization at promoter, intron, and intergenic regions and heatmaps showing histone modifications in 5kb window in the same regions of ATAC-seq peaks. b. Metapeak plots of non-differential ATAC-seq peaks (FDR > 0.05) in 5kb window grouped by localization at promoter, intron, and intergenic regions and metapeak plots of histone modifications in 5kb window in the same regions of ATAC-seq peaks.
Extended Data Fig. 6. Open chromatin regions that are not affected by the status of H3K36me3 show no differences in histone modifications.
a. Heatmap of non-differential ATAC-seq peaks assigned to an upregulated gene in a 5kb window grouped by localization at promoter, intron, and intergenic regions (n = 6313) and heatmaps showing histone modifications in 5kb window in the same regions of ATAC-seq peaks. b. Heatmap of non-differential ATAC-seq peaks assigned to a downregulated gene in a 5kb window grouped by localization at promoter, intron, and intergenic regions (n = 7835) and heatmaps showing histone modifications in 5kb window in the same regions of ATAC-seq peaks.
Extended Data Fig. 7. Loss of SETD2-mediated H3K36me3 induces a genome-wide increase of active/permissive histone marks that correlate with increased chromatin accessibility.
a, The extent of co-occurrence of two up/downregulated histone modification ChIP-seq or ATAC-seq peaks were assessed using Fisher’s exact test for each pairwise comparison of those peaks. The plot shows the odds ratio and Bonferroni adjusted P value from Fisher’s exact test. Enrichment ratios greater than 1 implies the peaks of interest are more likely to co-occur, whereas enrichment ratios less than 1 means that the peaks of interest are less likely to co-occur (*, P < 0.05; **, P < 0.01; ***, P < 0.001). b, The extent of co-occurrence of up- or downregulated genes with up- or downregulated histone modification ChIP-seq or ATAC-seq peaks were assessed using Fisher’s exact test for each pairwise comparison. The plot shows the odds ratio and Bonferroni adjusted P value from Fisher’s exact test. Enrichment ratios greater than 1 implies that up- (or down-) regulated genes are enriched in up- (or down-) regulated peaks, while enrichment ratios less than 1 implies that up- (or down-) regulated genes are depleted in up- (or down-) regulated peaks (*, P < 0.05; **, P < 0.01; ***, P < 0.001).
Extended Data Fig. 8. Comparison of ATAC-seq and ChIP-seq at the MMP1 locus.
ATAC-seq tracks and ChIP-seq tracks for the indicated histone marks at the MMP1 locus in H3K36me3− or H3K36me3+ (SETD2ΔN-transduced) JHRCC12 cells.
Extended Data Fig. 9. Loss of SETD2-mediated H3K36me3 increases H3K56ac levels.
a. Metaplots showing the normalized distribution profiles of H3K56ac across gene bodies. b. Pie chart showing the percentage of differentially enriched ChIP-seq peaks for H3K56ac (FDR < 0.05; n = 11251) in promoter, intronic, intergenic, and exonic regions comparing H3K36me3− (control) with H3K36me3+ (SETD2ΔN-transduced) JHRCC12 cells.
Extended Data Fig. 10. Loss of SETD2-mediated H3K36me3 sensitizes cancer cells to KO of both ASF1A and ASF1B but not the inhibitor of p300/CBP, CCS1477.
a-b, JHRCC12 cells infected with control retrovirus or retrovirus expressing SETD2ΔN were subjected to lentiviral CRISPR/Cas9-mediated KO of ASF1A (exon 3), ASF1B, or both ASF1A (exon 3) and ASF1B and analyzed by the indicated immunoblots in a. Cell death was quantified by annexin-V staining (mean ± s.d., n = 3) in b. **, P < 0.01 (two-tailed unpaired Student’s t-test). c, JHRCC12 cells infected with control retrovirus or retrovirus expressing SETD2ΔN were treated with the p300/CBP inhibitor CCS1477 at the indicated concentrations. Cell death was quantified by annexin-V staining (mean ± s.d., n = 3).
Supplementary Material
Acknowledgements
We apologize to all the investigators whose research could not be appropriately cited due to space limitations. This work was supported by the NIH grant to E. Cheng (R01 CA223231) as well as the NCI Cancer Center Support Grant (P30 CA008748). Y. Xie was supported by the NCI Predoctoral to Postdoctoral Fellow Transition Award (F99 CA234949).
Competing interests
J.J.H. has consulted for Eisai and BostonGene; he has received clinical trial funding from Bristol Myers Squibb, Merck, AstraZeneca, Exelixis, Calithera, and SillaJen; he has received research funding from Merck, BostonGene, and TScan. All other authors have no competing interests to declare.
References
- 1.Sun X-J et al. Identification and characterization of a novel human histone H3 lysine 36-specific methyltransferase. Journal of Biological Chemistry 280, 35261–35271 (2005). [DOI] [PubMed] [Google Scholar]
- 2.Kizer KO et al. A novel domain in Set2 mediates RNA polymerase II interaction and couples histone H3 K36 methylation with transcript elongation. Mol Cell Biol 25, 3305–3316, doi: 10.1128/mcb.25.8.3305-3316.2005 (2005). [DOI] [PMC free article] [PubMed] [Google Scholar]
- 3.Edmunds JW, Mahadevan LC & Clayton AL Dynamic histone H3 methylation during gene induction: HYPB/Setd2 mediates all H3K36 trimethylation. The EMBO journal 27, 406–420 (2008). [DOI] [PMC free article] [PubMed] [Google Scholar]
- 4.Hu M et al. Histone H3 lysine 36 methyltransferase Hypb/Setd2 is required for embryonic vascular remodeling. Proceedings of the National Academy of Sciences of the United States of America 107, 2956–2961, doi: 10.1073/pnas.0915033107 (2010). [DOI] [PMC free article] [PubMed] [Google Scholar]
- 5.Wagner EJ & Carpenter PB Understanding the language of Lys36 methylation at histone H3. Nature reviews Molecular cell biology 13, 115 (2012). [DOI] [PMC free article] [PubMed] [Google Scholar]
- 6.Venkatesh S et al. Set2 methylation of histone H3 lysine 36 suppresses histone exchange on transcribed genes. Nature 489, 452 (2012). [DOI] [PubMed] [Google Scholar]
- 7.Luco RF et al. Regulation of alternative splicing by histone modifications. Science 327, 996–1000 (2010). [DOI] [PMC free article] [PubMed] [Google Scholar]
- 8.Pfister SX et al. SETD2-dependent histone H3K36 trimethylation is required for homologous recombination repair and genome stability. Cell reports 7, 2006–2018, doi: 10.1016/j.celrep.2014.05.026 (2014). [DOI] [PMC free article] [PubMed] [Google Scholar]
- 9.Carvalho S et al. SETD2 is required for DNA double-strand break repair and activation of the p53-mediated checkpoint. eLife 3, e02482, doi: 10.7554/eLife.02482 (2014). [DOI] [PMC free article] [PubMed] [Google Scholar]
- 10.Park IY et al. Dual chromatin and cytoskeletal remodeling by SETD2. Cell 166, 950–962 (2016). [DOI] [PMC free article] [PubMed] [Google Scholar]
- 11.Chen K et al. Methyltransferase SETD2-mediated methylation of STAT1 is critical for interferon antiviral activity. Cell 170, 492–506. e414 (2017). [DOI] [PubMed] [Google Scholar]
- 12.Hsieh JJ et al. Chromosome 3p loss–orchestrated VHL, HIF, and epigenetic deregulation in clear cell renal cell carcinoma. Journal of Clinical Oncology 36, 3533–3539 (2018). [DOI] [PMC free article] [PubMed] [Google Scholar]
- 13.(TCGA), T. C. G. A. R. N. Comprehensive molecular characterization of clear cell renal cell carcinoma. Nature 499, 43–49, doi: 10.1038/nature12222 (2013). [DOI] [PMC free article] [PubMed] [Google Scholar]
- 14.Hsieh JJ et al. Renal cell carcinoma. Nature Reviews Disease Primers 3, 17009, doi: 10.1038/nrdp.2017.9 (2017). [DOI] [PMC free article] [PubMed] [Google Scholar]
- 15.Haase VH, Glickman JN, Socolovsky M & Jaenisch R Vascular tumors in livers with targeted inactivation of the von Hippel–Lindau tumor suppressor. Proceedings of the National Academy of Sciences 98, 1583–1588 (2001). [DOI] [PMC free article] [PubMed] [Google Scholar]
- 16.Kleymenova E et al. Susceptibility to vascular neoplasms but no increased susceptibility to renal carcinogenesis in Vhl knockout mice. Carcinogenesis 25, 309–315 (2004). [DOI] [PubMed] [Google Scholar]
- 17.Rankin EB, Tomaszewski JE & Haase VH Renal cyst development in mice with conditional inactivation of the von Hippel-Lindau tumor suppressor. Cancer research 66, 2576–2583 (2006). [DOI] [PMC free article] [PubMed] [Google Scholar]
- 18.Kapitsinou PP & Haase VH The VHL tumor suppressor and HIF: insights from genetic studies in mice. Cell Death Differ 15, 650–659, doi: 10.1038/sj.cdd.4402313 (2008). [DOI] [PMC free article] [PubMed] [Google Scholar]
- 19.Nargund AM et al. The SWI/SNF protein PBRM1 restrains VHL-loss-driven clear cell renal cell carcinoma. Cell reports 18, 2893–2906 (2017). [DOI] [PMC free article] [PubMed] [Google Scholar]
- 20.Hakimi AA et al. Adverse outcomes in clear cell renal cell carcinoma with mutations of 3p21 epigenetic regulators BAP1 and SETD2: a report by MSKCC and the KIRC TCGA research network. Clinical Cancer Research 19, 3259–3267 (2013). [DOI] [PMC free article] [PubMed] [Google Scholar]
- 21.Turajlic S et al. Deterministic evolutionary trajectories influence primary tumor growth: TRACERx renal. Cell 173, 595–610. e511 (2018). [DOI] [PMC free article] [PubMed] [Google Scholar]
- 22.Ho TH et al. High-resolution profiling of histone h3 lysine 36 trimethylation in metastatic renal cell carcinoma. Oncogene 35, 1565 (2016). [DOI] [PMC free article] [PubMed] [Google Scholar]
- 23.Zehir A et al. Mutational landscape of metastatic cancer revealed from prospective clinical sequencing of 10,000 patients. Nature medicine 23, 703–713, doi: 10.1038/nm.4333 (2017). [DOI] [PMC free article] [PubMed] [Google Scholar]
- 24.Dong Y et al. Tumor xenografts of human clear cell renal cell carcinoma but not corresponding cell lines recapitulate clinical response to sunitinib: feasibility of using biopsy samples. European urology focus 3, 590–598 (2017). [DOI] [PMC free article] [PubMed] [Google Scholar]
- 25.Mandriota SJ et al. HIF activation identifies early lesions in VHL kidneys: evidence for site-specific tumor suppressor function in the nephron. Cancer cell 1, 459–468 (2002). [DOI] [PubMed] [Google Scholar]
- 26.Semenza GL HIF-1 mediates metabolic responses to intratumoral hypoxia and oncogenic mutations. The Journal of clinical investigation 123, 3664–3671 (2013). [DOI] [PMC free article] [PubMed] [Google Scholar]
- 27.Bos PD et al. Genes that mediate breast cancer metastasis to the brain. Nature 459, 1005 (2009). [DOI] [PMC free article] [PubMed] [Google Scholar]
- 28.Simon JM et al. Variation in chromatin accessibility in human kidney cancer links H3K36 methyltransferase loss with widespread RNA processing defects. Genome research 24, 241–250 (2014). [DOI] [PMC free article] [PubMed] [Google Scholar]
- 29.Grant CE, Bailey TL & Noble WS FIMO: scanning for occurrences of a given motif. Bioinformatics 27, 1017–1018 (2011). [DOI] [PMC free article] [PubMed] [Google Scholar]
- 30.Denny SK et al. Nfib Promotes Metastasis through a Widespread Increase in Chromatin Accessibility. Cell 166, 328–342, doi: 10.1016/j.cell.2016.05.052 (2016). [DOI] [PMC free article] [PubMed] [Google Scholar]
- 31.Morrow JJ et al. Positively selected enhancer elements endow osteosarcoma cells with metastatic competence. Nature medicine 24, 176–185, doi: 10.1038/nm.4475 (2018). [DOI] [PMC free article] [PubMed] [Google Scholar]
- 32.Rodrigues P et al. NF-κB-Dependent Lymphoid Enhancer Co-option Promotes Renal Carcinoma Metastasis. Cancer discovery 8, 850–865, doi: 10.1158/2159-8290.Cd-17-1211 (2018). [DOI] [PMC free article] [PubMed] [Google Scholar]
- 33.Kessenbrock K, Plaks V & Werb Z Matrix metalloproteinases: regulators of the tumor microenvironment. Cell 141, 52–67 (2010). [DOI] [PMC free article] [PubMed] [Google Scholar]
- 34.Yeo NC et al. An enhanced CRISPR repressor for targeted mammalian gene regulation. Nature methods 15, 611–616, doi: 10.1038/s41592-018-0048-5 (2018). [DOI] [PMC free article] [PubMed] [Google Scholar]
- 35.Hacker KE et al. Structure/Function Analysis of Recurrent Mutations in SETD2 Protein Reveals a Critical and Conserved Role for a SET Domain Residue in Maintaining Protein Stability and Histone H3 Lys-36 Trimethylation. The Journal of biological chemistry 291, 21283–21295, doi: 10.1074/jbc.M116.739375 (2016). [DOI] [PMC free article] [PubMed] [Google Scholar]
- 36.Burgess RJ & Zhang Z Histone chaperones in nucleosome assembly and human disease. Nature structural & molecular biology 20, 14 (2013). [DOI] [PMC free article] [PubMed] [Google Scholar]
- 37.Venkatesh S & Workman JL Histone exchange, chromatin structure and the regulation of transcription. Nature reviews Molecular cell biology 16, 178 (2015). [DOI] [PubMed] [Google Scholar]
- 38.Smolle M, Workman JL & Venkatesh S reSETting chromatin during transcription elongation. Epigenetics 8, 10–15 (2013). [DOI] [PMC free article] [PubMed] [Google Scholar]
- 39.Tsubota T et al. Histone H3-K56 acetylation is catalyzed by histone chaperone-dependent complexes. Molecular cell 25, 703–712 (2007). [DOI] [PMC free article] [PubMed] [Google Scholar]
- 40.Carter DR et al. Therapeutic targeting of the MYC signal by inhibition of histone chaperone FACT in neuroblastoma. Science translational medicine 7, 312ra176–312ra176 (2015). [DOI] [PMC free article] [PubMed] [Google Scholar]
- 41.Tsubota T et al. Histone H3-K56 acetylation is catalyzed by histone chaperone-dependent complexes. Mol Cell 25, 703–712, doi: 10.1016/j.molcel.2007.02.006 (2007). [DOI] [PMC free article] [PubMed] [Google Scholar]
- 42.Zhang L et al. Multisite Substrate Recognition in Asf1-Dependent Acetylation of Histone H3 K56 by Rtt109. Cell 174, 818–830.e811, doi: 10.1016/j.cell.2018.07.005 (2018). [DOI] [PMC free article] [PubMed] [Google Scholar]
- 43.Jeng PS, Inoue-Yamauchi A, Hsieh JJ & Cheng EH BH3-Dependent and Independent Activation of BAX and BAK in Mitochondrial Apoptosis. Current Opinion in Physiology (2018). [DOI] [PMC free article] [PubMed] [Google Scholar]
- 44.Cheng EH et al. BCL-2, BCL-X(L) sequester BH3 domain-only molecules preventing BAX- and BAK-mediated mitochondrial apoptosis. Mol Cell 8, 705–711 (2001). [DOI] [PubMed] [Google Scholar]
- 45.Kim H et al. Hierarchical regulation of mitochondrion-dependent apoptosis by BCL-2 subfamilies. Nature cell biology 8, 1348–1358, doi: 10.1038/ncb1499 (2006). [DOI] [PubMed] [Google Scholar]
- 46.Kim H et al. Stepwise activation of BAX and BAK by tBID, BIM, and PUMA initiates mitochondrial apoptosis. Mol Cell 36, 487–499, doi: 10.1016/j.molcel.2009.09.030 (2009). [DOI] [PMC free article] [PubMed] [Google Scholar]
- 47.Ren D et al. BID, BIM, and PUMA are essential for activation of the BAX- and BAK-dependent cell death program. Science 330, 1390–1393, doi: 10.1126/science.1190217 (2010). [DOI] [PMC free article] [PubMed] [Google Scholar]
- 48.Chen HC et al. An interconnected hierarchical model of cell death regulation by the BCL-2 family. Nature cell biology 17, 1270–1281, doi: 10.1038/ncb3236 (2015). [DOI] [PMC free article] [PubMed] [Google Scholar]
- 49.Mar BG et al. SETD2 alterations impair DNA damage recognition and lead to resistance to chemotherapy in leukemia. Blood 130, 2631–2641, doi: 10.1182/blood-2017-03-775569 (2017). [DOI] [PMC free article] [PubMed] [Google Scholar]
- 50.Guenther MG, Levine SS, Boyer LA, Jaenisch R & Young RA A chromatin landmark and transcription initiation at most promoters in human cells. Cell 130, 77–88 (2007). [DOI] [PMC free article] [PubMed] [Google Scholar]
- 51.Wang GX et al. ΔNp63 inhibits oxidative stress-induced cell death, including ferroptosis, and cooperates with the BCL-2 family to promote clonogenic survival. Cell reports 21, 2926–2939 (2017). [DOI] [PMC free article] [PubMed] [Google Scholar]
- 52.Sanjana NE, Shalem O & Zhang F Improved vectors and genome-wide libraries for CRISPR screening. Nature methods 11, 783 (2014). [DOI] [PMC free article] [PubMed] [Google Scholar]
- 53.Shi J et al. Discovery of cancer drug targets by CRISPR-Cas9 screening of protein domains. Nature biotechnology 33, 661–667, doi: 10.1038/nbt.3235 (2015). [DOI] [PMC free article] [PubMed] [Google Scholar]
- 54.Lu C et al. Histone H3K36 mutations promote sarcomagenesis through altered histone methylation landscape. Science 352, 844–849 (2016). [DOI] [PMC free article] [PubMed] [Google Scholar]
- 55.Buenrostro JD, Giresi PG, Zaba LC, Chang HY & Greenleaf WJ Transposition of native chromatin for fast and sensitive epigenomic profiling of open chromatin, DNA-binding proteins and nucleosome position. Nature methods 10, 1213 (2013). [DOI] [PMC free article] [PubMed] [Google Scholar]
- 56.Bolger AM, Lohse M & Usadel B Trimmomatic: a flexible trimmer for Illumina sequence data. Bioinformatics 30, 2114–2120 (2014). [DOI] [PMC free article] [PubMed] [Google Scholar]
- 57.Langmead B, Trapnell C, Pop M & Salzberg SL Ultrafast and memory-efficient alignment of short DNA sequences to the human genome. Genome biology 10, R25 (2009). [DOI] [PMC free article] [PubMed] [Google Scholar]
- 58.Zhang Y et al. Model-based analysis of ChIP-Seq (MACS). Genome biology 9, R137 (2008). [DOI] [PMC free article] [PubMed] [Google Scholar]
- 59.Li Q, Brown JB, Huang H & Bickel PJ Measuring reproducibility of high-throughput experiments. The annals of applied statistics 5, 1752–1779 (2011). [Google Scholar]
- 60.Philip M et al. Chromatin states define tumour-specific T cell dysfunction and reprogramming. Nature 545, 452 (2017). [DOI] [PMC free article] [PubMed] [Google Scholar]
- 61.Dobin A et al. STAR: ultrafast universal RNA-seq aligner. Bioinformatics 29, 15–21 (2013). [DOI] [PMC free article] [PubMed] [Google Scholar]
- 62.Anders S, Pyl PT & Huber W HTSeq—a Python framework to work with high-throughput sequencing data. Bioinformatics 31, 166–169 (2015). [DOI] [PMC free article] [PubMed] [Google Scholar]
- 63.Love MI, Huber W & Anders S Moderated estimation of fold change and dispersion for RNA-seq data with DESeq2. Genome biology 15, 550 (2014). [DOI] [PMC free article] [PubMed] [Google Scholar]
- 64.Subramanian A et al. Gene set enrichment analysis: a knowledge-based approach for interpreting genome-wide expression profiles. Proceedings of the National Academy of Sciences 102, 15545–15550 (2005). [DOI] [PMC free article] [PubMed] [Google Scholar]
- 65.Foroutan M et al. Single sample scoring of molecular phenotypes. BMC bioinformatics 19, 1–10 (2018). [DOI] [PMC free article] [PubMed] [Google Scholar]
- 66.Colaprico A et al. TCGAbiolinks: an R/Bioconductor package for integrative analysis of TCGA data. Nucleic acids research 44, e71–e71 (2016). [DOI] [PMC free article] [PubMed] [Google Scholar]
- 67.Li H & Durbin R Fast and accurate short read alignment with Burrows–Wheeler transform. bioinformatics 25, 1754–1760 (2009). [DOI] [PMC free article] [PubMed] [Google Scholar]
- 68.Subgroup, G. P. D. P. et al. The Sequence Alignment/Map format and SAMtools. Bioinformatics 25, 2078–2079, doi: 10.1093/bioinformatics/btp352 (2009). [DOI] [PMC free article] [PubMed] [Google Scholar]
- 69.Smyth GK, Shi W & Liao Y featureCounts: an efficient general purpose program for assigning sequence reads to genomic features. Bioinformatics 30, 923–930, doi: 10.1093/bioinformatics/btt656 (2013). [DOI] [PubMed] [Google Scholar]
- 70.Quinlan AR & Hall IM BEDTools: a flexible suite of utilities for comparing genomic features. Bioinformatics 26, 841–842, doi: 10.1093/bioinformatics/btq033 (2010). [DOI] [PMC free article] [PubMed] [Google Scholar]
- 71.Hinrichs AS, Zweig AS, Karolchik D, Barber G & Kent WJ BigWig and BigBed: enabling browsing of large distributed datasets. Bioinformatics 26, 2204–2207, doi: 10.1093/bioinformatics/btq351 (2010). [DOI] [PMC free article] [PubMed] [Google Scholar]
- 72.Richter AS et al. deepTools2: a next generation web server for deep-sequencing data analysis. Nucleic Acids Research 44, W160–W165, doi: 10.1093/nar/gkw257 (2016). [DOI] [PMC free article] [PubMed] [Google Scholar]
Associated Data
This section collects any data citations, data availability statements, or supplementary materials included in this article.
Supplementary Materials
Data Availability Statement
Raw ATAC-seq, RNA-seq and ChIP-seq sequencing data as well as the normalized tracks that support the findings of this study have been deposited in the GEO database under GSE146583. Further information and requests for resources and reagents should be directed to the corresponding author. All unique/stable reagents generated in this study are available from the corresponding author with a completed Materials Transfer Agreement. Source data are provided with this paper.


