Abstract
A characteristic rigid spatial arrangement of collagen fibrils in the stroma is critical for corneal transparency. This unique organization of collagen fibrils in corneal stroma can be impacted by the presence and interactions of proteoglycans and extracellular matrix (ECM) proteins in a corneal microenvironment. Earlier studies revealed that decorin, a leucine-rich proteoglycan in stroma, regulates keratocyte-collagen matrix assembly and wound healing in the cornea. This study investigated the role of decorin in the regulation of stromal fibrillogenesis and corneal transparency in vivo employing a loss-of-function genetic approach using decorin null (dcn−/−) and wild type (dcn+/+) mice and a standard alkali-injury model. A time-dependent ocular examinations with Slit lamp microscope in live animals assessed corneal clarity, haze, and neovascularization levels in normal and injured eyes. Morphometric changes in normal and injured dcn+/+ and dcn−/− corneas, post-euthanasia, were analyzed with Masson’s Trichrome and Periodic Acid-Schiff (PAS) histology evaluations. The ultrastructure changes in all corneas were investigated with transmission electron microscopy (TEM). Injury to eye produced clinically relevant corneal haze and neovascularization in dcn−/− and dcn+/+ mice while corneas of uninjured eyes remained clear and avascular. A clinically significant haze and neovascularization appeared in injured dcn−/− corneas compared to the dcn+/+ corneas at day 21 post-injury and not at early tested times. Histological examinations revealed noticeably abnormal morphology and compromised collagen levels in injured dcn−/− corneas compared to the injured/normal dcn+/+ and uninjured dcn−/− corneas. TEM analysis exhibited remarkably uneven collagen fibrils size and distribution in the stroma with asymmetrical organization and loose packing in injured dcn−/− corneas than injured/normal dcn+/+ and uninjured dcn−/− corneas. The minimum and maximum inter-fibril distances were markedly irregular in injured dcn−/− corneas compared to all other corneas. Together, results of clinical, histological, and ultrastructural investigations in a genetic knockout model suggested that decorin influenced stromal fibrillogenesis and transparency in healing cornea.
Keywords: Cornea, Collagen fibrillogenesis, Decorin null mice (dcn−/−), Transmission electron microscopy (TEM), Wound healing
1. Introduction
The cornea is a transparent and avascular tissue that provides two-thirds of the refractive power required for normal vision. Collagens are major structural component of the cornea within the tissue. The transparency and strength of the cornea arise from the highly organized spatial arrangement of the collagen fibrils and its interactions with stromal extracellular matrix organization (ECM) (Chen et al., 2015; Chaurasia et al., 2015). The mechanical strength and shape of the cornea are compactly related to the highly organized three-dimensional (3D) architecture of the corneal stroma (Gardner et al., 2015). In the stromal ECM, collagen fibrils are arranged in a high degree of lateral order with relatively uniform diameters throughout the stroma providing tensile strength and transparency to the corneal tissue (White et al., 2017). Corneal cells interact with a rich variety of in vivo biophysical stimuli: the stroma and basement membranes present them with a range of stiffnesses and complex topographies (Abrams et al., 2000).
Any trauma, like mechanical, surgical, chemical insults, etc. disturbs stromal fibril organization and affects corneal transparency, which eventually leads to fibrosis/scar formation and corneal neovascularization (CNV) (Gronkiewicz et al., 2016; Wilson et al., 2017). A plethora of research and clinical data reveals that in addition to cytokines and growth factors such as vascular endothelial growth factor (VEGF) (Mohan et al., 2011c), transforming growth factor-β (TGFβ) (Massague, 1998), a variety of other peptides and insoluble ECM macromolecules especially the reorganization of collagen fibrils are of utmost importance for the maintenance of corneal transparency (BenEzra et al., 1997). Corneal wounds result in the degradation, disorganization of collagen fibers, and rupture of collagen struts in the ECM of corneal tissue with compromised corneal transparency. The process of collagen fibrillogenesis regulates collagen synthesis and metabolism that regulates collagen fiber assembly and structural integrity changes (Weis et al., 2005). In collagen fibrillogenesis, the ECM has a prominent influence on cell behavior, influencing shape, polarity, movement, metabolism, modulating cell growth, differentiation, and development (Brown et al., 2002). But how proteoglycans interact with the collagen architecture in the ECM during corneal wound healing has remained poorly understood.
Decorin is a small leucine-rich proteoglycan (SLRP) and accounts for nearly 40% of the total proteoglycans in the cornea (Gregory et al., 1982; Iozzo, 1998). It is shown to play an important role to regulate cellular structure, tissue organization, fibrillogenesis, tissue repair, and organization of ECM architecture (Lim et al., 2018; Mohan et al., 2010; Mohan et al., 2011a). The protein cores of these proteoglycans contain leucine-rich repeats in the central part of the molecule that forms a curved solenoid structure with convex and concave faces flanked by cysteine-rich domains on two sides. The individual proteoglycan core proteins are thought to bind with collagen fibrils at specific axial sites along the collagen fibrils (Meek and Knupp, 2015). Previous reports suggest that decorin plays an essential role in collagen fibrillogenesis and interacts with all major type I and II collagen-rich tissues and co-localizes with large helical collagen fibers (Mohan et al., 2011a). Therefore, collagen organization in the ECM assembly and its interactions with decorin are the critical events during corneal wound healing. The dcn null transgenic mouse (dcn−/−) can provide an evidence and better understanding of the role of dcn in collagen tissue assembly and in collagen fibrillogenesis in corneal tissue. The dcn−/− mice are healthy, viable, and show no visible anatomical abnormalities (Reed and Iozzo, 2002). The body anatomy and weight of dcn−/− mice are of normal size like their wild type (dcn+/+) strain. However, in dcn−/− mice, the collagen network in the skin was found loosely packed with irregular contours and lateral fusion of collagen fibrils (Brown et al., 2002; Danielson et al., 1997). While the eye appears normal and cornea maintains its integrity in dcn−/− mice, what happens to the cornea after trauma or injury is still unknown. In the present study, we sought to determine the functional role of dcn in the regulation of spatial arrangement of collagen fibrils at the ultrastructure levels with transmission electron microscopy in relevance to injury. Additionally, we graded corneal transparency clinically with Slit lamp microscope to recognize its impact during wound healing post-injury.
2. Materials and Methods
2.1. Animals
A heterozygous strain (dcn+/−) breeding pair of C57BL/6J background was obtained from Renato V. Iozzo, PhD, Department of Pathology, Anatomy, and Cell Biology, and Translational Cellular Oncology Program, Thomas Jefferson University, Philadelphia, Pennsylvania, USA. The homozygous dcn−/− and wild-type (dcn+/+) colonies were generated with by using multiple heterozygous strain (dcn+/−) breeding pairs. In this study, decorin homozygous null (dcn−/−) and wild type (dcn+/+) mice were used. The study was approved by the Institutional Animal Care and Use Committees of the Harry S. Truman Memorial Veterans’ Hospital, Columbia, MO and the University of Missouri, Columbia, MO. Animals were treated in accordance with the ARVO Statement of the Use of Animals in Ophthalmic and Vision Research and housed in the animal facility under 12:12 hour light-dark cycle with ambient room temperature (25 °C) and ad libitum access to food and water. Anesthesia was performed in mice by intraperitoneal injection of a cocktail containing ketamine hydrochloride (100 mg/kg) and xylazine hydrochloride (10 mg/kg). Topical ophthalmic anesthesia solution, proparacaine hydrochloride, was applied prior to any procedure. The study has four groups (dcn−/− with no corneal injury, dcn−/− with corneal injury, dcn+/+ with no corneal injury and dcn+/+ with corneal injury) and each group has 12 mice (6 males and 6 females) ranging 10–14 weeks of age. Eyes of each group are collected at day 3, 7, 14, and 21 post injury.
2.2. Induction of corneal injury
The corneal wound was generated in mouse eye by a well-established corneal alkali wounding procedure (Balne et al., 2021). Only one eye of each animal, selected randomly, was used for alkali wounding. In an anesthetized mouse, one drop of 0.5% proparacaine hydrochloride solution was instilled into the eye and then alkali injury was performed. In brief, alkali injury was produced by topically applying 2 mm diameter filter paper disc soaked in 0.5M sodium hydroxide (NaOH) for 30 seconds. The eye was then copiously washed with balanced salt solution (BSS) to remove NaOH. Thermal support was provided to animal throughout the procedure and during the recovery period.
2.3. Slit lamp biomicroscopic Imaging and clinical analysis
All mice underwent eye examination and imaging at regular intervals (day 3, 7, 14, and 21) after injury with a stereomicroscope equipped with a digital camera (SpotCam RT KE, Diagnostic Instruments Inc., USA). Eye health was evaluated using a slit lamp microscope (SL-15 portable Slit lamp, Kowa Optimed Inc. Torrance, CA, USA) as reported earlier (Fantes et al., 1990; Gupta et al., 2018; Mohan et al., 2011c).
2.4. Tissue Collection and Histology
Mice were humanely euthanized with an intraperitoneal injection of 150 mg/kg pentobarbital under ketamine/xylazine anesthesia. Eyeballs were collected for histology and corneas excised from globes for ultrastructural investigation. For histology, eyeballs enucleated from animals were placed immediately in optical cutting temperature (OCT) compound, snap-frozen, and stored at −80°C. For ultrastructural analysis, corneas were dissected from globes and immersed in TEM buffer following recently reported method (Sinha et al., 2021). Frozen tissues were sectioned at 8-μm thickness with a cryostat, placed on a glass slide, and stored frozen at −80°C until staining was performed following previously reported method (Gupta et al., 2017).
2.5. Transmission electron microscopy (TEM) Microscopy
The mouse corneal tissues were collected from experimental groups and immediately processed for TEM sample preparation. Unless otherwise stated, all reagents were purchased from Electron Microscopy Sciences, and all specimen preparation was performed at the Electron Microscopy Core Facility, University of Missouri, Columbia, MO. In brief, the dissected cornea tissue was washed with ice-cold 1X PBS divided into 3 pieces and immediately fixed in 2% paraformaldehyde + 2% glutaraldehyde containing 100 mM sodium cacodylate buffer (pH=7.35). Next, fixed tissues were rinsed with 100 mM sodium cacodylate buffer, (pH 7.35) containing 130 mM sucrose. Secondary fixation was performed using 1% osmium tetroxide (Ted Pella, Inc. Redding, California) in cacodylate buffer using a Pelco Biowave (Ted Pella, Inc. Redding, California) operated at 100 Watts for 1 minute. Specimens were next incubated at 4°C for 1 hour, then rinsed with cacodylate buffer and further with distilled water. Using the Pelco Biowave, a graded dehydration series (per exchange, 100 Watts for 40sec) was performed using ethanol, transitioned into acetone, and dehydrated tissues were then infiltrated with epoxy resin (250 Watt for 3 min) and polymerized at 60°C overnight. For light microscopy, 0.5-μm sections were cut with an ultra-microtome (UC6; Leica EM, Wetzler, Germany), and the sections were stained with 1% toluidine blue.
For TEM, sections were cut to a thickness of 85 nm using an ultramicrotome (Ultracut UCT, Leica Microsystems, Germany) and a diamond knife (Diatome, Hatfield PA). These sections floated on distilled water and mounted on copper grids. The grids were dried and observed at magnifications 600–50000 X at 80 kV. Post-sectioning staining with uranyl acetate and Sato’s lead stain was performed. A Transmission electron microscope (JEM-1400; JEOL, Peabody, MA) at 80 kV on a Gatan Ultrascan 1000 CCD (Gatan, Inc, Pleasanton, CA) equipped with a CCD camera (USC1000 2Kx2K; Gatan, Pleasanton, CA) and located at the Electron Microscopy Core Facility (University of Missouri) was used to collect images of each corneal layer from individual eyes of dcn+/+ and dcn−/− mice.
2.6. Biocomputing and TEM image data analysis
Collagen fibril arrangement was analyzed in cross-section of TEM images taken from mid stromal region between the anterior and posterior stromal areas (Figure 3E) by computing 10 fibers per image in six to nine images for each experimental group. The fibril area, diameters, and inter fibril distances in all TEM images were quantified using automatic image analysis software developed and reported previously (Gronkiewicz et al., 2016). In brief, it consists of four main modules: (i) image preprocessing, (ii) fibril segmentation, (iii) fibril shape analysis and cluster decomposition, and (iv) size and inter-fibrillar distance analysis. The details given below.
Figure 3.
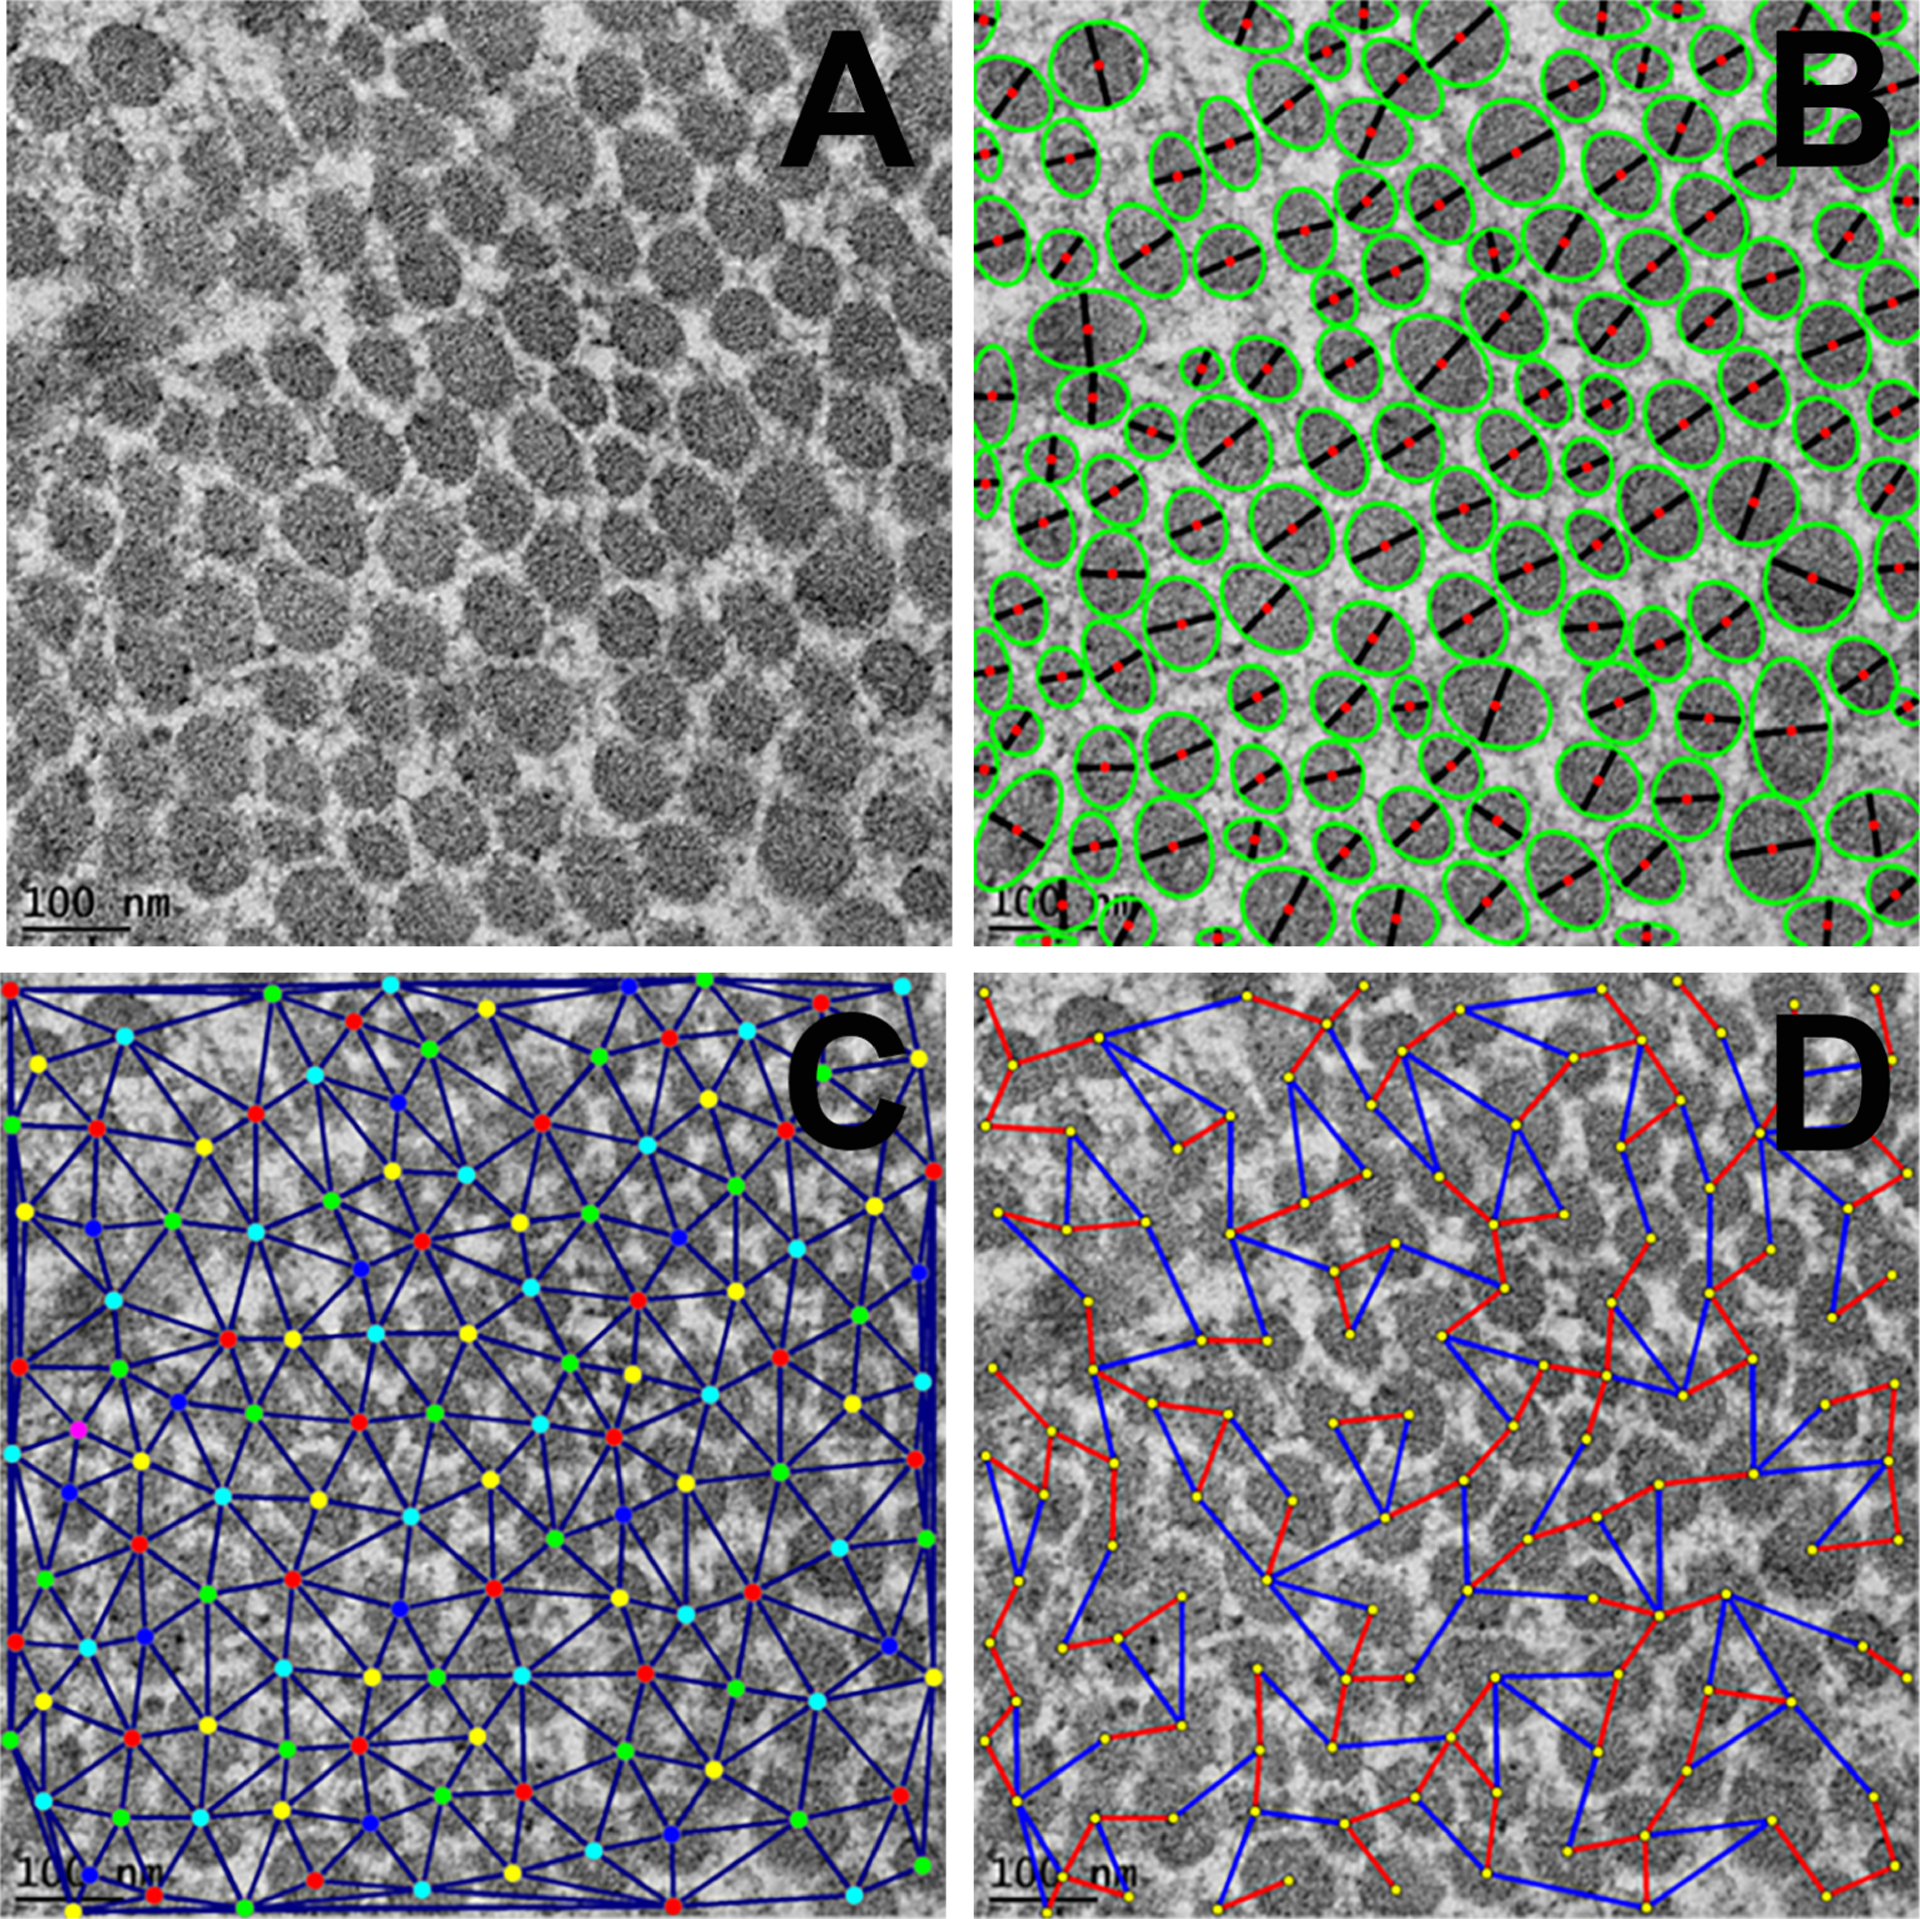
Representative TEM images of corneal tissue sections showing arrangement and pattern of fibrils in cross-sections at 25,000X magnification. A: unprocessed TEM image; B: processed TEM image showing segmentation for collagen fibrils (green: ellipses fitted to individual blobs (bead like structure), black: ellipse minor axes, red: blob centroids); C: processed TEM image showing fibril centroids and neighborhood and D: processed TEM image showing nearest (red) and farthest (blue) inter fibril distances (IFD). Scale bar = 100 nm.
2.6.1. Image Preprocessing
The image processing step involved noise removal using linear and non-linear image filtering, specifically using Gaussian and median filters and normalization of uneven background from the original TEM images. The image background (regions not occupied by collagen fibrils) was modeled by polygonal surface fitting to the local gray-level intensity maxima. Matlab software (Matlab 2019) curve or surface fitting function with quadratic polygon fitting option was used to model the image background. This processing is important for removing background intensity bias while automatically locating the fibril cross-sections in the TEM images.
2.6.2. Fibril Segmentation
TEM image segmentation refers to the process of partitioning or dividing an image into non-overlapping regions with similar attributes (i.e. intensity, color, texture, shape etc.) that are meaningful for the particular application in hand. This step aims to partition the input images into regions occupied by collagen fibril cross-sections versus by background. Fibril segmentation process was performed using a combination of intensity-based threshold and Hessian-based blob detection approaches. The obtained segmentation mask was post-processed with mathematical morphology operations to remove small spurious detections and to fill small holes. Hessian matrix (Equation 1) describes the second-order structure of local intensity variations around each point of the image L (x, y). Eigenvalues λ1,2 (Equation 2) of the Hessian matrix can be used to detect blob-like, or ridge-like structures (Frangi et al., 1998). Table 2 shows possible local orientation patterns based on the eigenvalues of the Hessian matrix.
| (1) |
| (2) |
Table 2.
Possible orientation patterns based on the value of eigenvalues λ1 and λ2 of the Hessian matrix (Iλ1I ≥ Iλ2I) (Frangi et al., 1998).
| λ1 | λ2 | Orientation Pattern |
|---|---|---|
| Low | Low | Flat or Noise no preferred direction |
| High− | Low | Bright tubular structure |
| High+ | Low | Dark tubular structure |
| High− | High− | Bright blob-like structure |
| High+ | High+ | Dark blob-like structure |
Hessian matrix was computed by convolving the TEM image with derivatives of the Gaussian kernel where scale σ represents the standard deviation of the Gaussian kernel and controls the radius of the detected structures. Initial coarse segmentation of the fibril cross-sections was generated by computing Hessian matrix and threshold λ1(Hessian) was calculated (Equation 3)
| (3) |
2.6.3. Shape Analysis and Cluster Decomposition
The shape analysis and cluster decomposition module were applied to refine the initial segmentation masks to identify individual collagen fibrils accurately after efficient detection of segment regions occupied by fibrils free from the factors such as noise, background structures, low contrast, weak or blurred boundaries, and intensity variations following our reported earlier methods (Ersoy et al., 2012; Sun et al., 2014; Gronkiewicz et al., 2016;). To refine segmentation, first connected component labeling was applied to the mask and disconnected blobs Bi were determined, and their areas were computed. Ellipses (Ei) were then fitted to each blob (Bi) and ellipse areas were calculated. Larger blobs with area difference ratio (ADR) were larger than a threshold, an indication of large deviation from the elliptical shape were further processed by cluster decomposition module to segment individual fibrils within the cluster (Equation 4).
| (4) |
Marker-controlled watershed transformation (Vincent, 1991) was used to decompose fibril clusters into individual fibrils. Regional maxima of distance transform were used as markers. To suppress spurious regional maxima and to prevent over-segmentation H-maxima transform (Soille, 2003) was applied to the distance transform prior to the detection of regional maxima. The obtained masks were visually inspected and in very rare cases were manually corrected to ensure correct quantitative analysis.
2.6.4. Fibril Size and Inter-fibrillar Distance (IFD) Analysis
This module computes parameters related to fibril morphology and spacing such as fibril radius and inter-fibrillar distance. From the refined segmentation mask obtained after cluster decomposition, fibril cross-section areas and centroids were computed. Since blob major axis length is more affected by sample preparation (e.g., diagonal cross-sections result in larger major axis), blob minor axis length was used as an estimate of the fibril radius. Delaunay triangulation & vertex coloring were applied to fibril centroids to construct a colored neighborhood graph (Nath et al., 2006; Ersoy et al., 2012; Gronkiewicz et al., 2016). In the neighborhood graph, nodes correspond to individual fibrils and the edges link to immediate neighbors. For each node in this neighborhood graph, two specific neighbors, a nearest immediate neighbor, and a farthest immediate neighbor were identified. A second graph, the nearest/farthest neighborhood graph, was constructed using only these specific links. On these created neighborhood graphs, distance from a fibril to its nearest immediate neighbor fibril was termed as minimum inter fibril distance (min IFD) and distance from a fibril to its farthest immediate neighbor fibril was termed as maximum inter fibril distance (max IFD). Fibril-to-fibril interactions and spatial organization of collagen fibrils were quantified using these two neighborhood graphs (Nath et al., 2006; Ersoy et al., 2012; Gronkiewicz et al., 2016, Sinha et al. 2021).
2.7. Morphometric and Histopathological analysis of Masson’s Trichrome and periodic acid-Schiff (PAS) stained corneal sections
Masson’s Trichrome and PAS staining are used to characterize the severity of the collagen organization, collagen production, and glycoprotein pattern in the anterior to posterior corneal tissue. Serial transverse corneal sections obtained after routine histologic processing (8 μm sections) were mounted on glass slides for staining with Masson’s Trichrome and periodic acid-Schiff (PAS) for comparative morphometric evaluation as described previously (Gronkiewicz et al., 2016; Gupta et al., 2018). After each staining, the morphometric evaluations of slides were performed using light microscopy. Corneal tissue sections were analyzed for any histopathological abnormalities.
2.8. Statistical Analysis
Statistical analysis was performed with GraphPad Prism 8 software (GraphPad Software, Inc., San Diego, CA, USA). The results were expressed as the mean ± standard error of the mean (SEM). A priori power statistical G*Power 3.0.10 software was used for power, effect, and sample size calculations (Faul et al., 2007). Statistical analysis was performed with Student’s t-test and one-way analysis of variance (ANOVA) followed by post hoc test in different experimental groups. A value of p<0.05 was considered statistically significant.
3. Results
3.1. Clinical observation and grading of haze and CNV
To test the role of dcn gene in collagen fibrillogenesis during corneal wound healing, an alkali induced in vivo mice model (dcn+/+ and dcn−/−) was used. A time-dependent comparative responses of injury on dcn+/+ and dcn−/− corneas were shown in slit-lamp microscopic images (Figure 1). The slit-lamp microscopic images showed a vital role of decorin in corneal transparency and wound healing response in both dcn+/+ (Figure 1B–E) and dcn−/− (Figure 1G–J) groups as compared to the corresponding no-injury groups (Figure 1A & F). At day 21, the dcn−/− strain showed the more prominent haze and less transparent area in corneal tissue (Figure 1J) when compared to the dcn+/+ strain (Figure 1E). At day 3, 7, and 14, no appreciable differences in corneal haze or neovascularization score were observed in dcn−/− (Figure 1G–I) versus dcn+/+ (Figure 1B–D) animals. Also, eyes of the no-injury control groups of both the dcn+/+ and dcn−/− demonstrated the avascular, clear, and normal corneas (Figure 1A & F).
Figure 1.
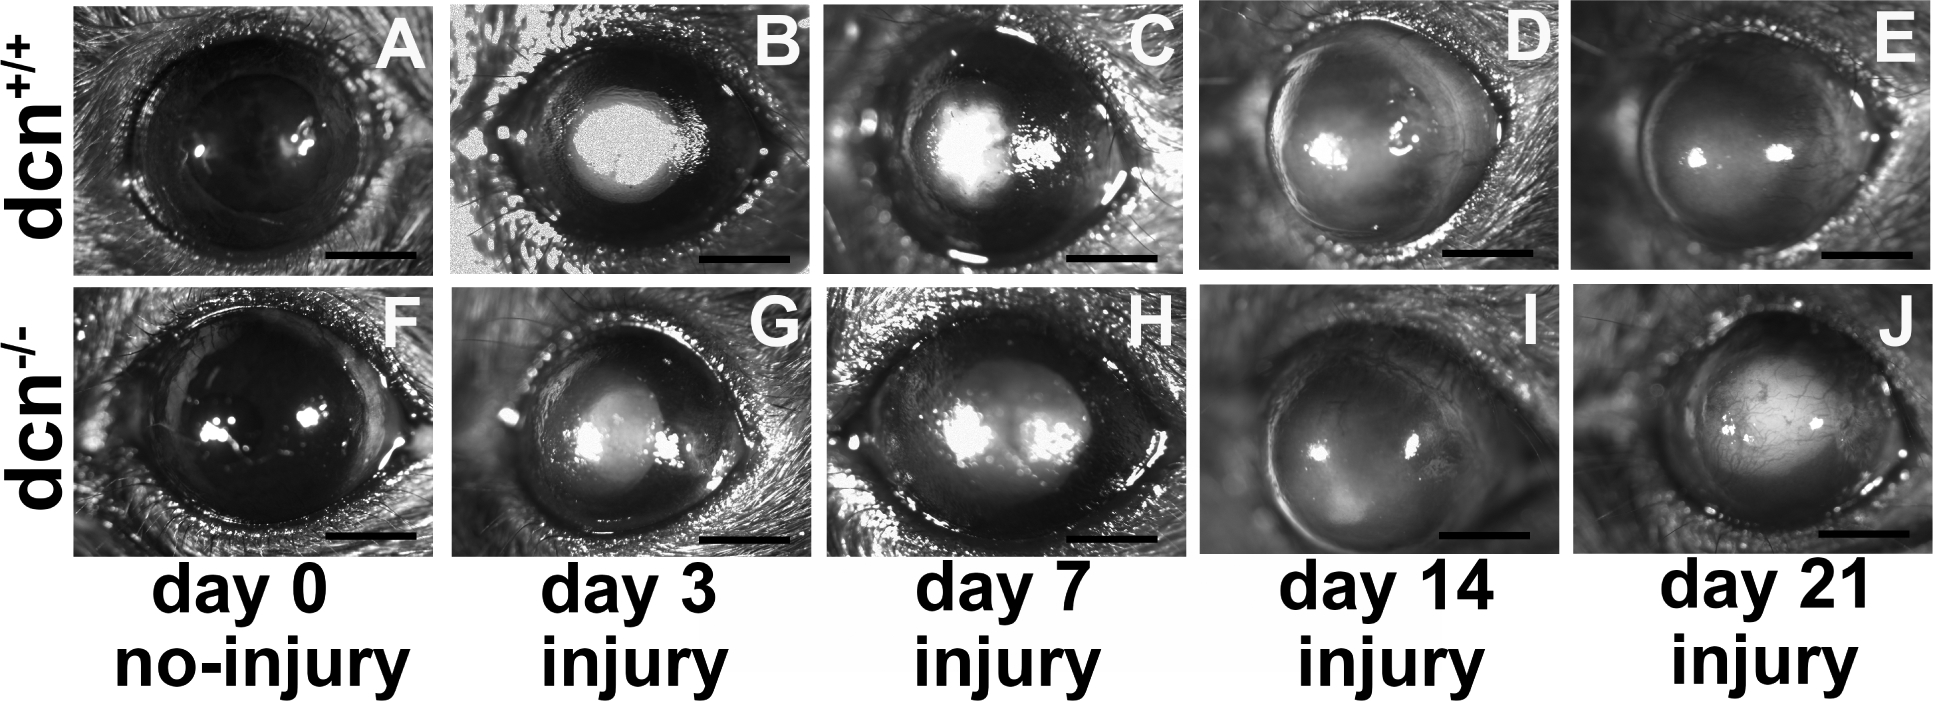
Representative slit lamp biomicroscopy images showing the dcn+/+ and dcn−/− corneas in +/− injury. Uninjured dcn+/+ and dcn−/− corneas were clear and avascular (A & F). Conversely, alkali injured cornea showed notable haze and/or neovascularization in dcn+/+ (A-E) and dcn−/− (F-J) mice at all tested times. The differences in corneal haze and neovascularization levels were more prominent in injured dcn−/− corneas (J) compared to the dcn+/+ corneas (E) at day 21. These changes were not remarkably different at earlier times in injured dcn−/− (G-I) and dcn+/+ (B-D) corneas. Scale bar = 1.0 mm.
The corneal haze was quantified in a masked manner using Fantes haze grading scale and slit-lamp microscope. At day 21, a significantly higher haze was observed in dcn−/− after alkali injury (p < 0.001; Figure 2A) compared to the dcn+/+. Likewise, dcn−/− mice showed a significantly higher corneal neovascularization compared to dcn+/+ after alkali injury at day 21 (p < 0.001; Figure 2B) but and at earlier times. The corneal haze and neovascularization levels in injured dcn+/+ and dcn−/− animals at the day 3, 7, or 14 were clinically relevant but found statistically insignificant. All uninjured corneas of the dcn+/+ and dcn−/− were transparent and avascular cornea.
Figure 2.

Quantification of corneal haze (A) and neovascularization (B) in uninjured and injured corneas of the dcn+/+ and dcn−/− mice. The corneas of no-injury groups are shown in green bars and injury groups in red bars. Injured dcn−/− corneas showed significantly less haze and neovascularization compared to the dcn+/+ corneas at day 21. Although injured corneas of the dcn+/+ and dcn−/− mice at earlier times (days 3, 7 and 14) exhibited clinically relevant haze and neovascularization but differences between two groups were statistically not significant. Data are expressed in ± SEM and ***P < 0.001.
3.2. Ultrastructure changes and role of decorin protein in collagen fibrillogenesis
The collagen fibrillogenesis and role of decorin were analyzed using the TEM high magnification images, and the structural changes were quantified using the Biocomputing software tools (Figure 3). The reference images represent the analysis pattern and quantification procedure used in the study for all different groups. Figure 3A shows the original TEM images at 25,000 X magnification; Figure 3B shows the segmentation pattern where green color ellipses are fitted to individual blobs, black lines denote ellipse minor axes and red dot denotes the blob centroid. In the same way, Figure 3C portrays fibril centroids and fibril neighborhood graphs while Figure 3D red and blue connecting lines symbolize minimum IFD and maximum IFD, respectively.
3.3. Collagen fibril distribution and lateral packing
The distribution and arrangement of fibrils at ultrastructural level in corneas were analyzed using TEM images taken at 1500x from ultrathin sections of the uninjured and injured corneas of the dcn+/+ and dcn−/− mice at day 21 (Figure 4). The zone of analysis for the ultrastructural investigation is shown in Figure 4E. The corneas of injury groups of dcn+/+ and dcn−/− mice revealed highly disrupted fibril distribution, organization, and packing (Figure 4C & D) compared to the corneas of the corresponding no-injury groups (Figure 4A & B). The injured dcn−/− corneas showed numerous non-parallel and loose packing of collagen fibrils (Figure 4D and magnified inset) compared to the injured dcn+/+ (Figure 4C and magnified inset). The TEM images of no-injury groups of dcn+/+ (Figure 4A and magnified inset) and dcn−/− (Figure 4B and magnified inset) corneas showed typical dense packing and organized collagen fibril distribution.
Figure 4.
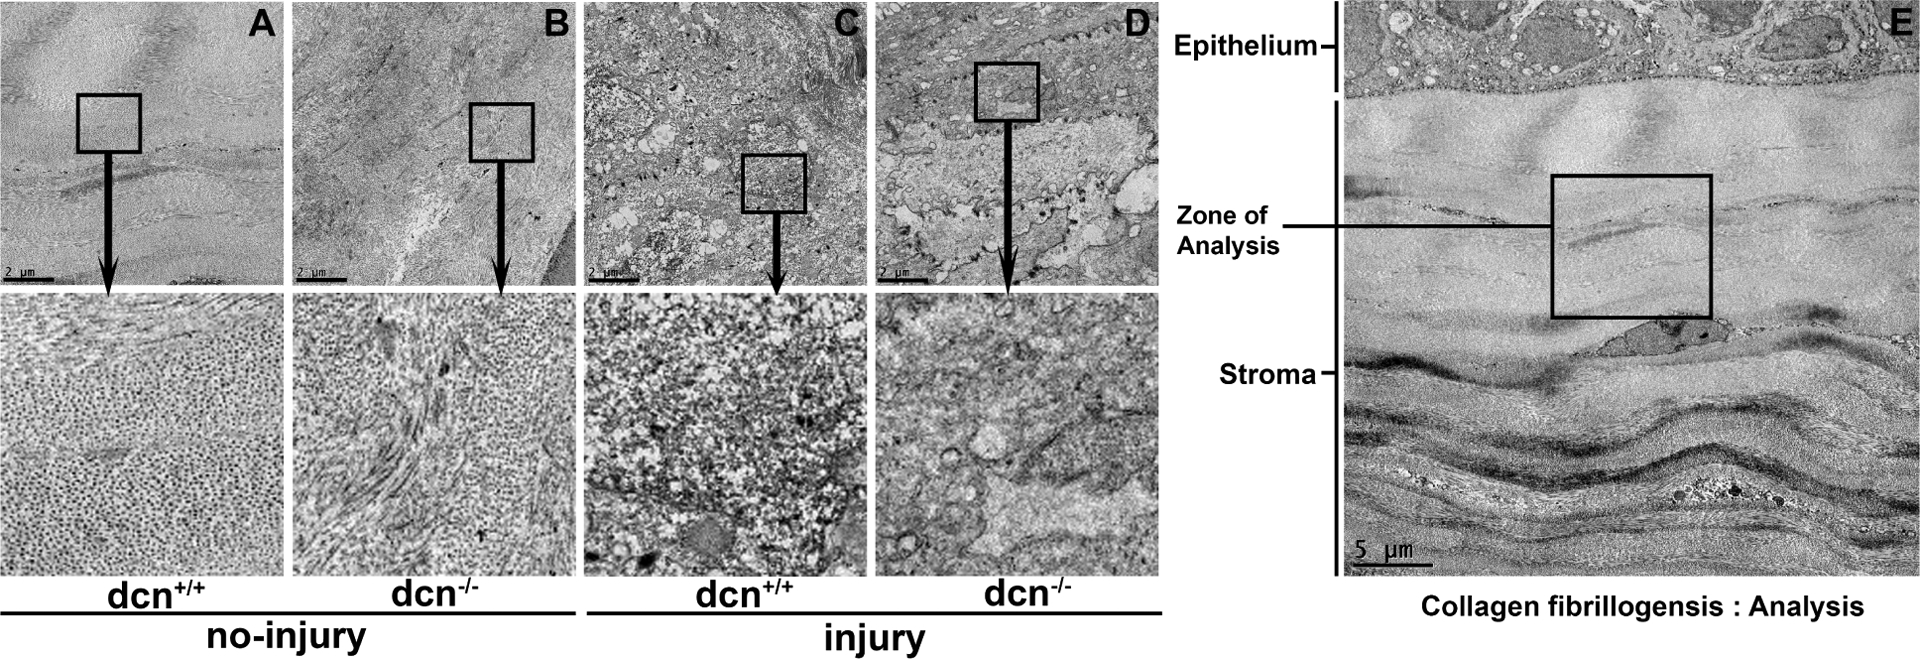
The TEM images taken from ultrathin sections of no-injury and post-injury corneas of the dcn+/+ and dcn−/− mice at 1500X magnification at day 21. The TEM image (4E; 500X magnification) showing “zone of analysis” in stroma chosen for ultrastructural investigation. Injured dcn+/+ (C) and dcn−/− (D) corneas showed notable disruptions in fibril distribution, organization, and packing in stroma compared to the corresponding no-injury corneas (A & B). The insets show magnified view of selected area. Scale bar = 2 μm (A-D) and 5 μm (E).
3.4. Collagen fibril area and diameter arrangement showing the frequency of distribution in dcn+/+ and dcn−/− mice
To quantify changes in distribution pattern and packing of collagen fibrils in the uninjured and injured corneas of the dcn+/+ and dcn−/− mice, fibril area, diameter, and inter fibril distances (IFD) were measured using TEM images collected at 25,000X magnification. The corneas of the dcn+/+ and dcn−/− mice revealed substantial changes in collagen fibril area, diameter, and minimum/maximum IFDs after injury (Figure 5C & D). Further, fibrils in injured dcn−/− corneas were poorly distributed and unevenly packed (Figure 5D) than the dcn+/+ corneas (Figure 5C). It was evident from the ultrastructure images of corneas that the collagen fibrils did not have a perfect hexagonal lattice. The images depicted that the geometry of the adjacent collagen fibrils was not systematic in dcn+/+ and dcn−/− mice (no-injury and alkali injury). The changes in adjacent collagen fibril distances were likely due to a consequence of the balancing of two opposite forces interim on fibrils brought by the decorin proteoglycans (Meek and Knupp, 2015). The TEM comparative analysis of dcn+/+ and dcn−/− corneas indicated the importance of decorin protein in corneal stromal fibrillogenesis.
Figure 5.
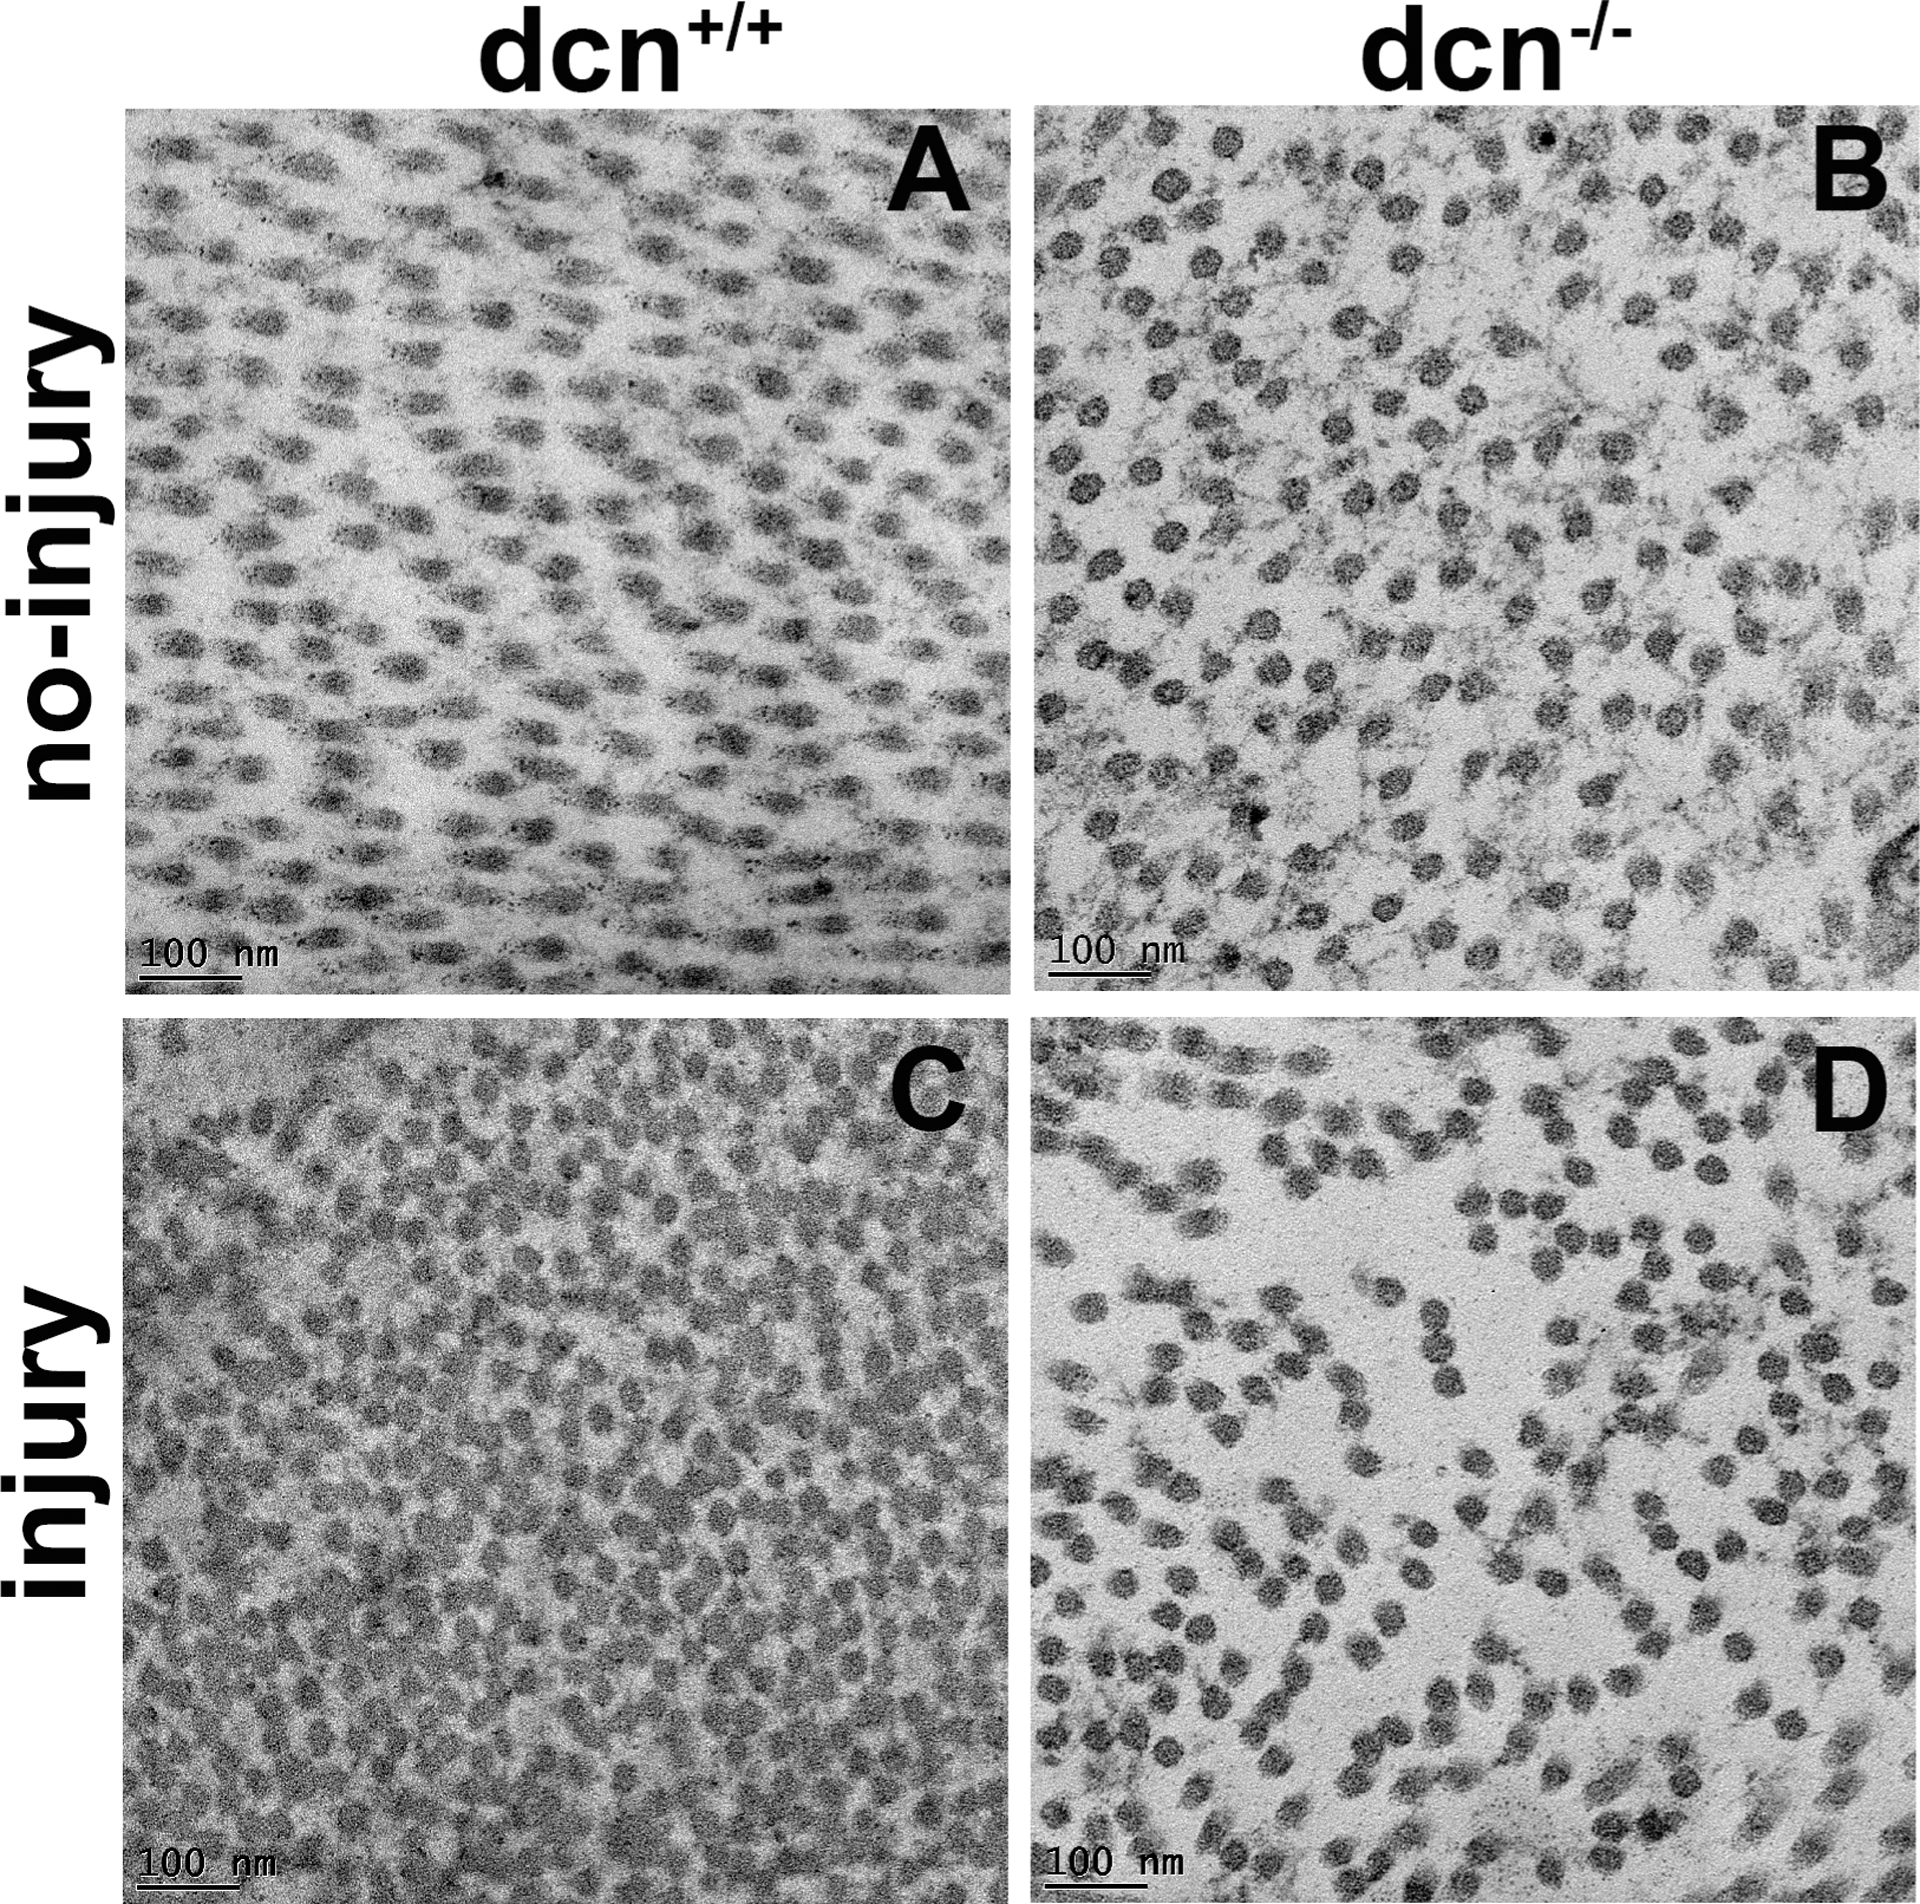
Representative TEM images of no-injury and post-injury corneas of the dcn+/+ and dcn−/− mice at 25,000X magnification at day 21. Substantially disorganized fibril size and arrangement pattern were observed in injured dcn+/+ (C) and dcn−/− (D) corneas compared to the corresponding no-injury corneas (A & B). Scale bar = 100 nm.
In corneal stroma, the collagen particles are organized in a regular fashion and create a unique crystal-like fibril arrangement. This unique distribution of collagen fibrils has the advantage for the quantification of collagen fibril distribution patterns. To study the collagen organization at the nanoscale in the corneal stroma, TEM analysis was performed to visualize and quantify structural changes about the collagen fibrils area and diameter using biocomputing tools. The comparisons of collagen fibril distribution and area of collagen fibril cross-sections are presented in Figure 6. We found that the collagen fibril area of the no-injury group was tightly clustered (Figure 6A & B) (dcn+/+ mice: average area pixels: 3736, SEM: 29 and dcn−/− mice: average area pixels: 3604, SEM: 25). On the contrary, the distribution of collagen fibril area of injury group was loosely clustered (Figure 6C & D) (dcn+/+ mice: average area pixels: 2917, SEM: 24 and dcn−/− mice: average area pixels: 4303, SEM: 30). The comparative area distribution graph of dcn−/− corneas after injury (Figure 6E) showed significant changes in area pixel as compared to dcn+/+ mice after injury (area pixels 4303 and 2917 respectively; p<0.001) revealing the role of decorin protein in collagen fibril organization.
Figure 6.
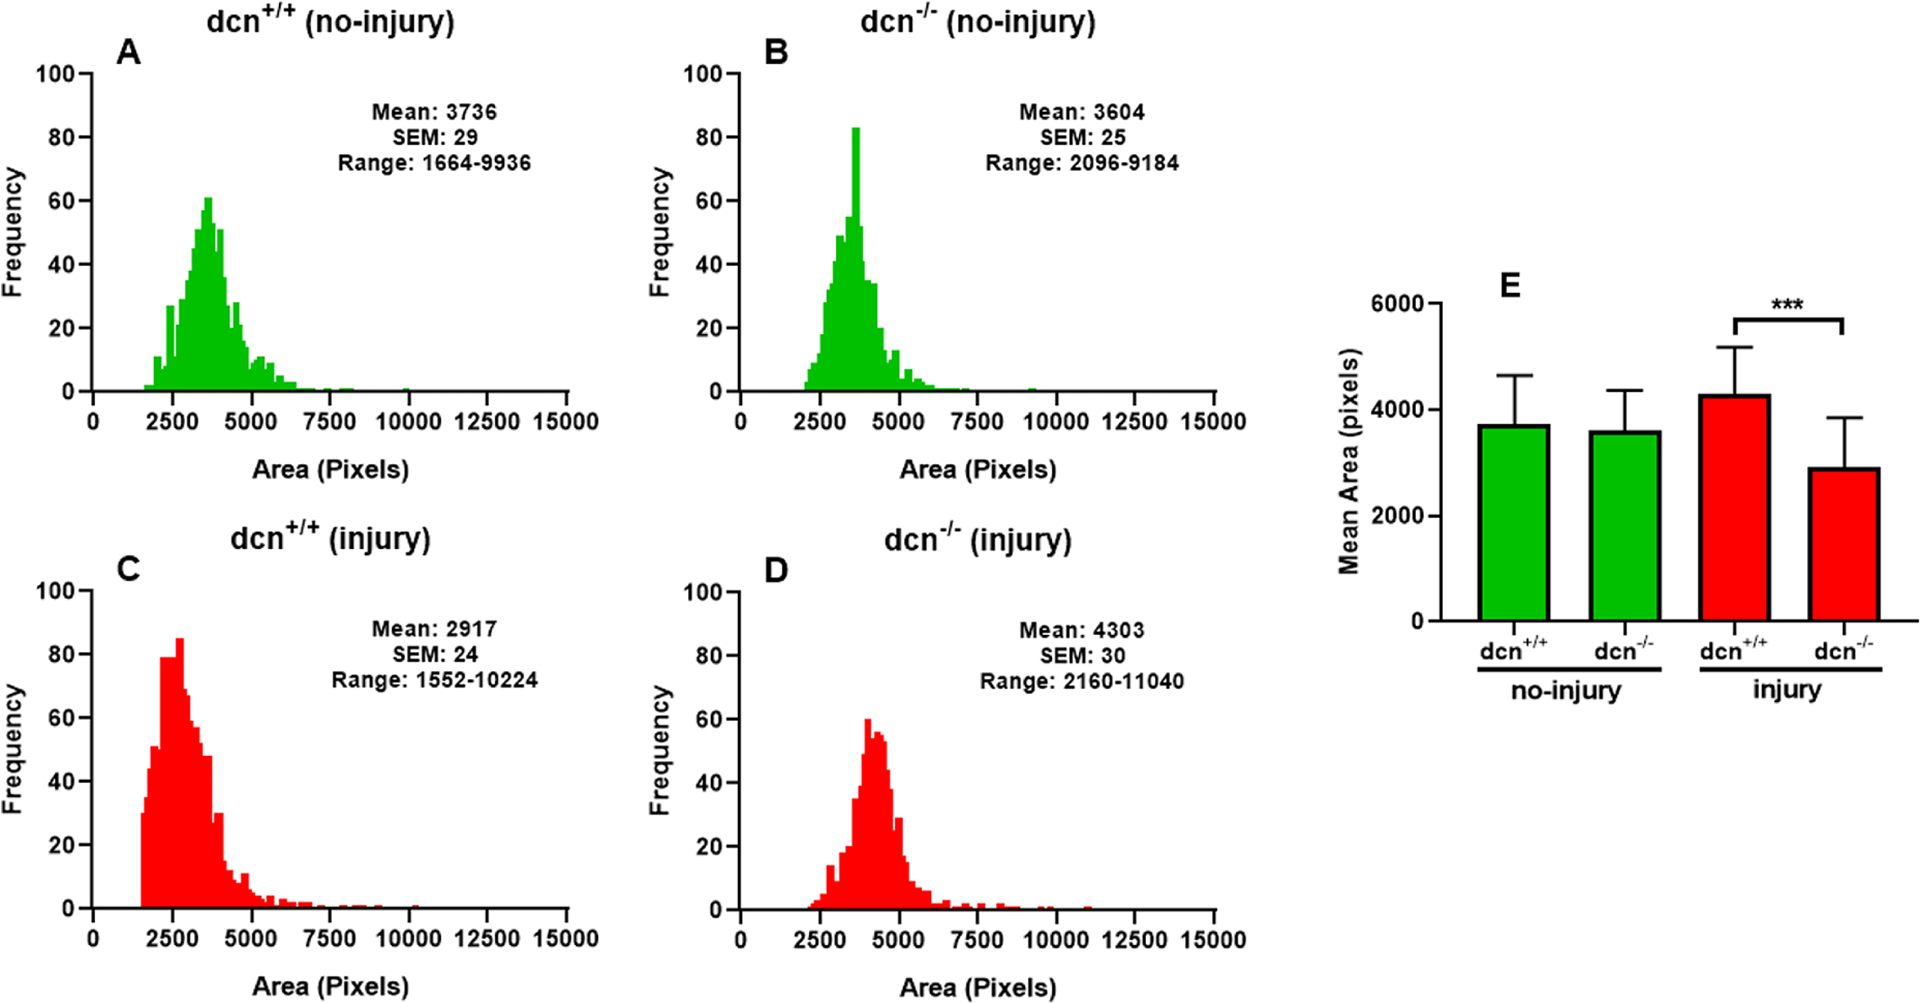
Histogram showing the changes in area of fibrils at day 21 in no-injury and post-injury dcn+/+ and dcn−/− mouse corneas. A vividly enhanced uneven distribution of fibrils was noted in dcn−/− corneas (D) compared to dcn+/+ corneas (C) after injury. The corresponding no-injury corneas (A & B) did not show such abnormality. Quantification found changes were significant between dcn−/− and dcn+/+ corneas post injury (E). Data are expressed in ± SEM and ***P < 0.001.
The diameter of each collagen fibril was also measured using the masking of each collagen fibril (Figure 7) in corneas of dcn+/+ and dcn−/− mice (no-injury and injury). The wide distribution of collagen fibril diameter in dcn−/− mice suggested impaired lateral packing. The histogram graph represented the frequency of collagen fibril diameter of dcn−/− corneas randomly in size of 65–70 pixels; (Figure 7B & D) while the frequency of collagen fibril diameter of dcn+/+ corneas in size of 45–65 pixels (Figure 7A & C). The structural changes in the corneas of the dcn−/− mice after injury were depicted by the non-uniform collagen fibril diameter and abnormal packing. The corneal TEM images and the biocomputing pattern of collagen fibril diameter demonstrated a significant reduction in collagen fibril diameter between the two different genotypes after injury, and this was consistent in the radial zone of injury. The collagen fibril diameter remained constant, and no noticeable changes were recorded in dcn+/+ and dcn−/− non-injured corneas (Figure 7E). The altered distribution of collagen fibril orientation, area, and diameter from injury to a no-injury condition in the stroma indicated a transition of anisotropic microstructure in dcn+/+ mice to a more orthotropic microstructure in dcn−/− mice. Together, these data demonstrated that injured dcn−/− corneas had poorly organized collagen fibrils compared to dcn+/+ corneas and supported the hypothesis that decorin protein plays a role in collagen fibril assembly.
Figure 7.
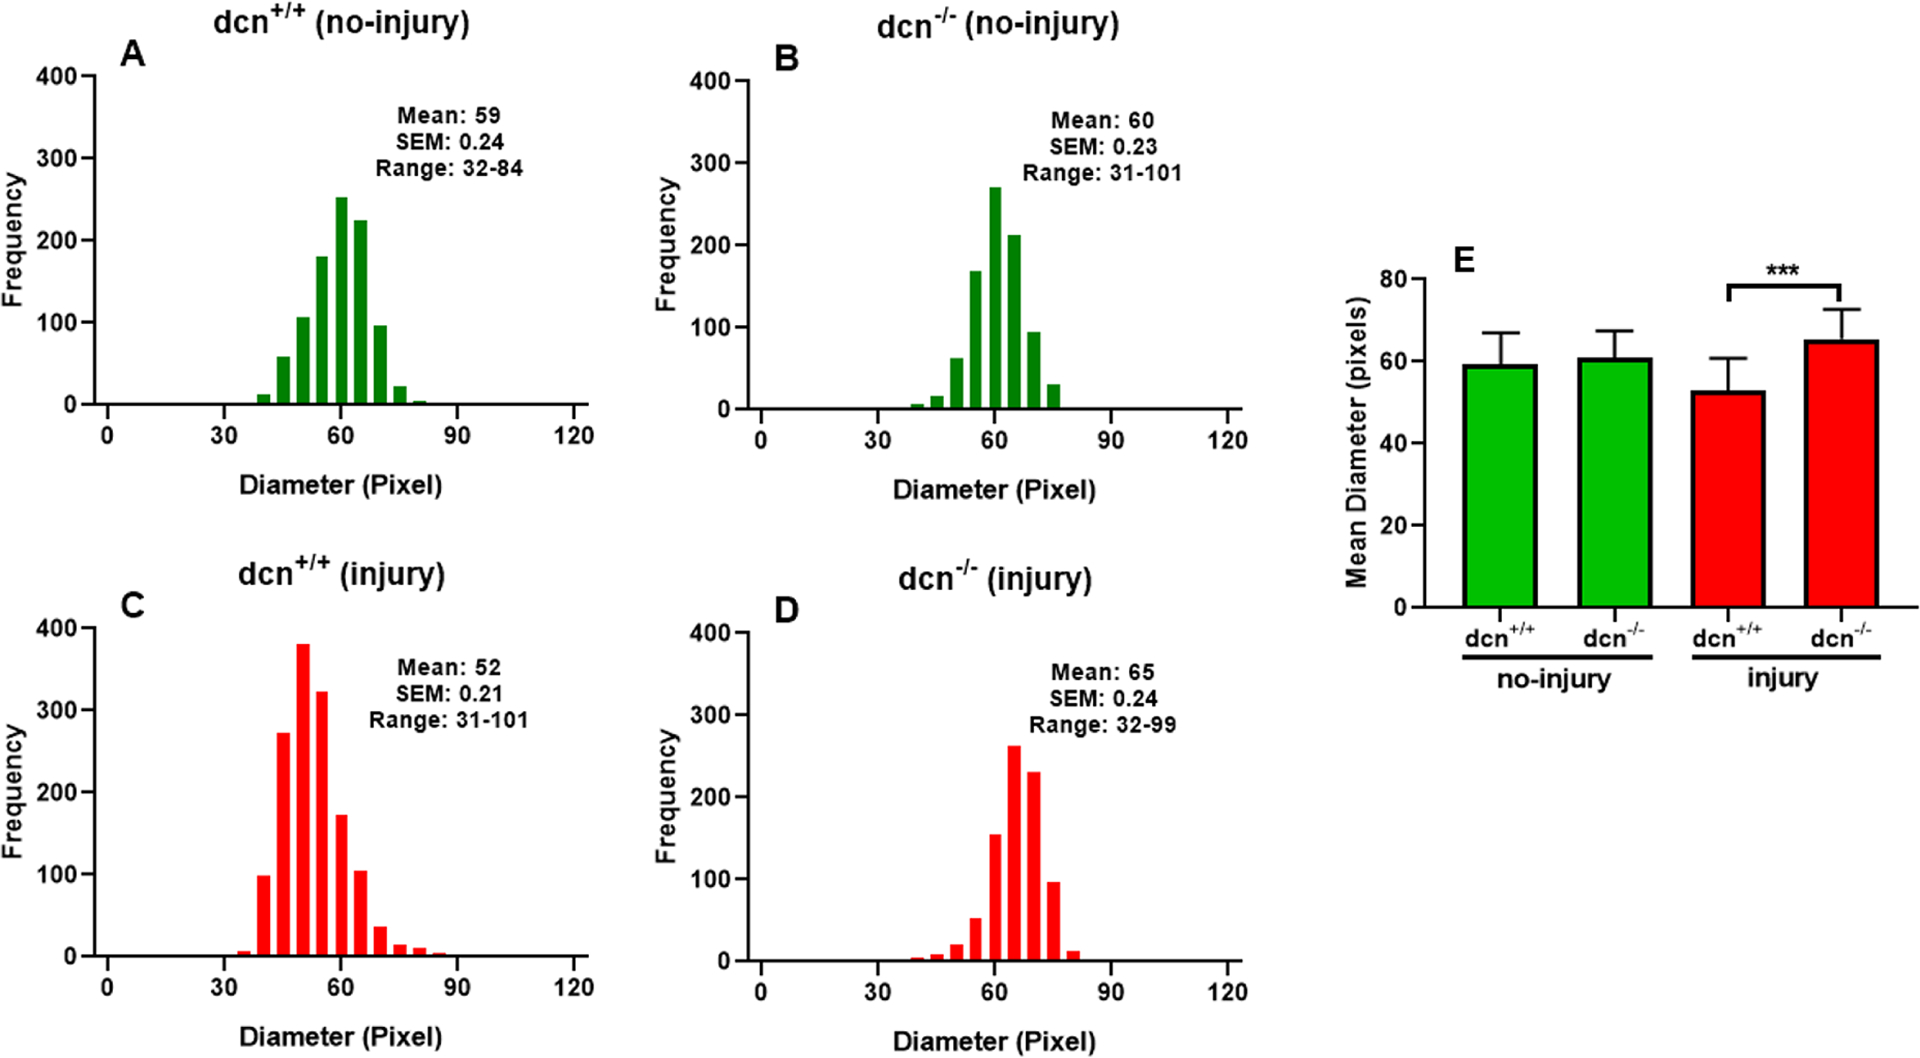
Histogram showing the changes in the diameter of collagen fibrils at day 21 in no-injury and post-injury dcn+/+ and dcn−/− mouse corneas. Injured dcn−/− corneas (D) showed striking changes in collagen fibril diameter compared to the dcn+/+ corneas (C) after injury. Quantification found changes were significant between dcn−/− and dcn+/+ corneas post injury (E). Data were expressed in ±SEM and ***P < 0.001.
3.5. Inter fibril distance depicting the collagen fibril distribution pattern in dcn+/+ and dcn−/− mice
Inter fibril distance (IFD) pattern defines the smoothness of collagen fibrillogenesis and spatial organization in the cornea. The min and max IFD analysis of each collagen fibril showed the organization and distribution pattern of fibrillogenesis in four experimental groups (Figure 8). The red-connecting lines represent min IFD, while blue-connecting lines represent max IFD of each collagen fibril. The TEM masking figure demonstrated the min and max IFD pattern in each group as evident from loose and tight organization of collagen fibrils (Figure 8). We found alteration in measurements of average collagen inter-fibril spacing and corresponding images revealing higher and random fibril spacing in the injury groups (Figure 8C & D) of dcn+/+ and dcn−/− mice compared to the no-injury groups (Figure 8A & B), respectively.
Figure 8.
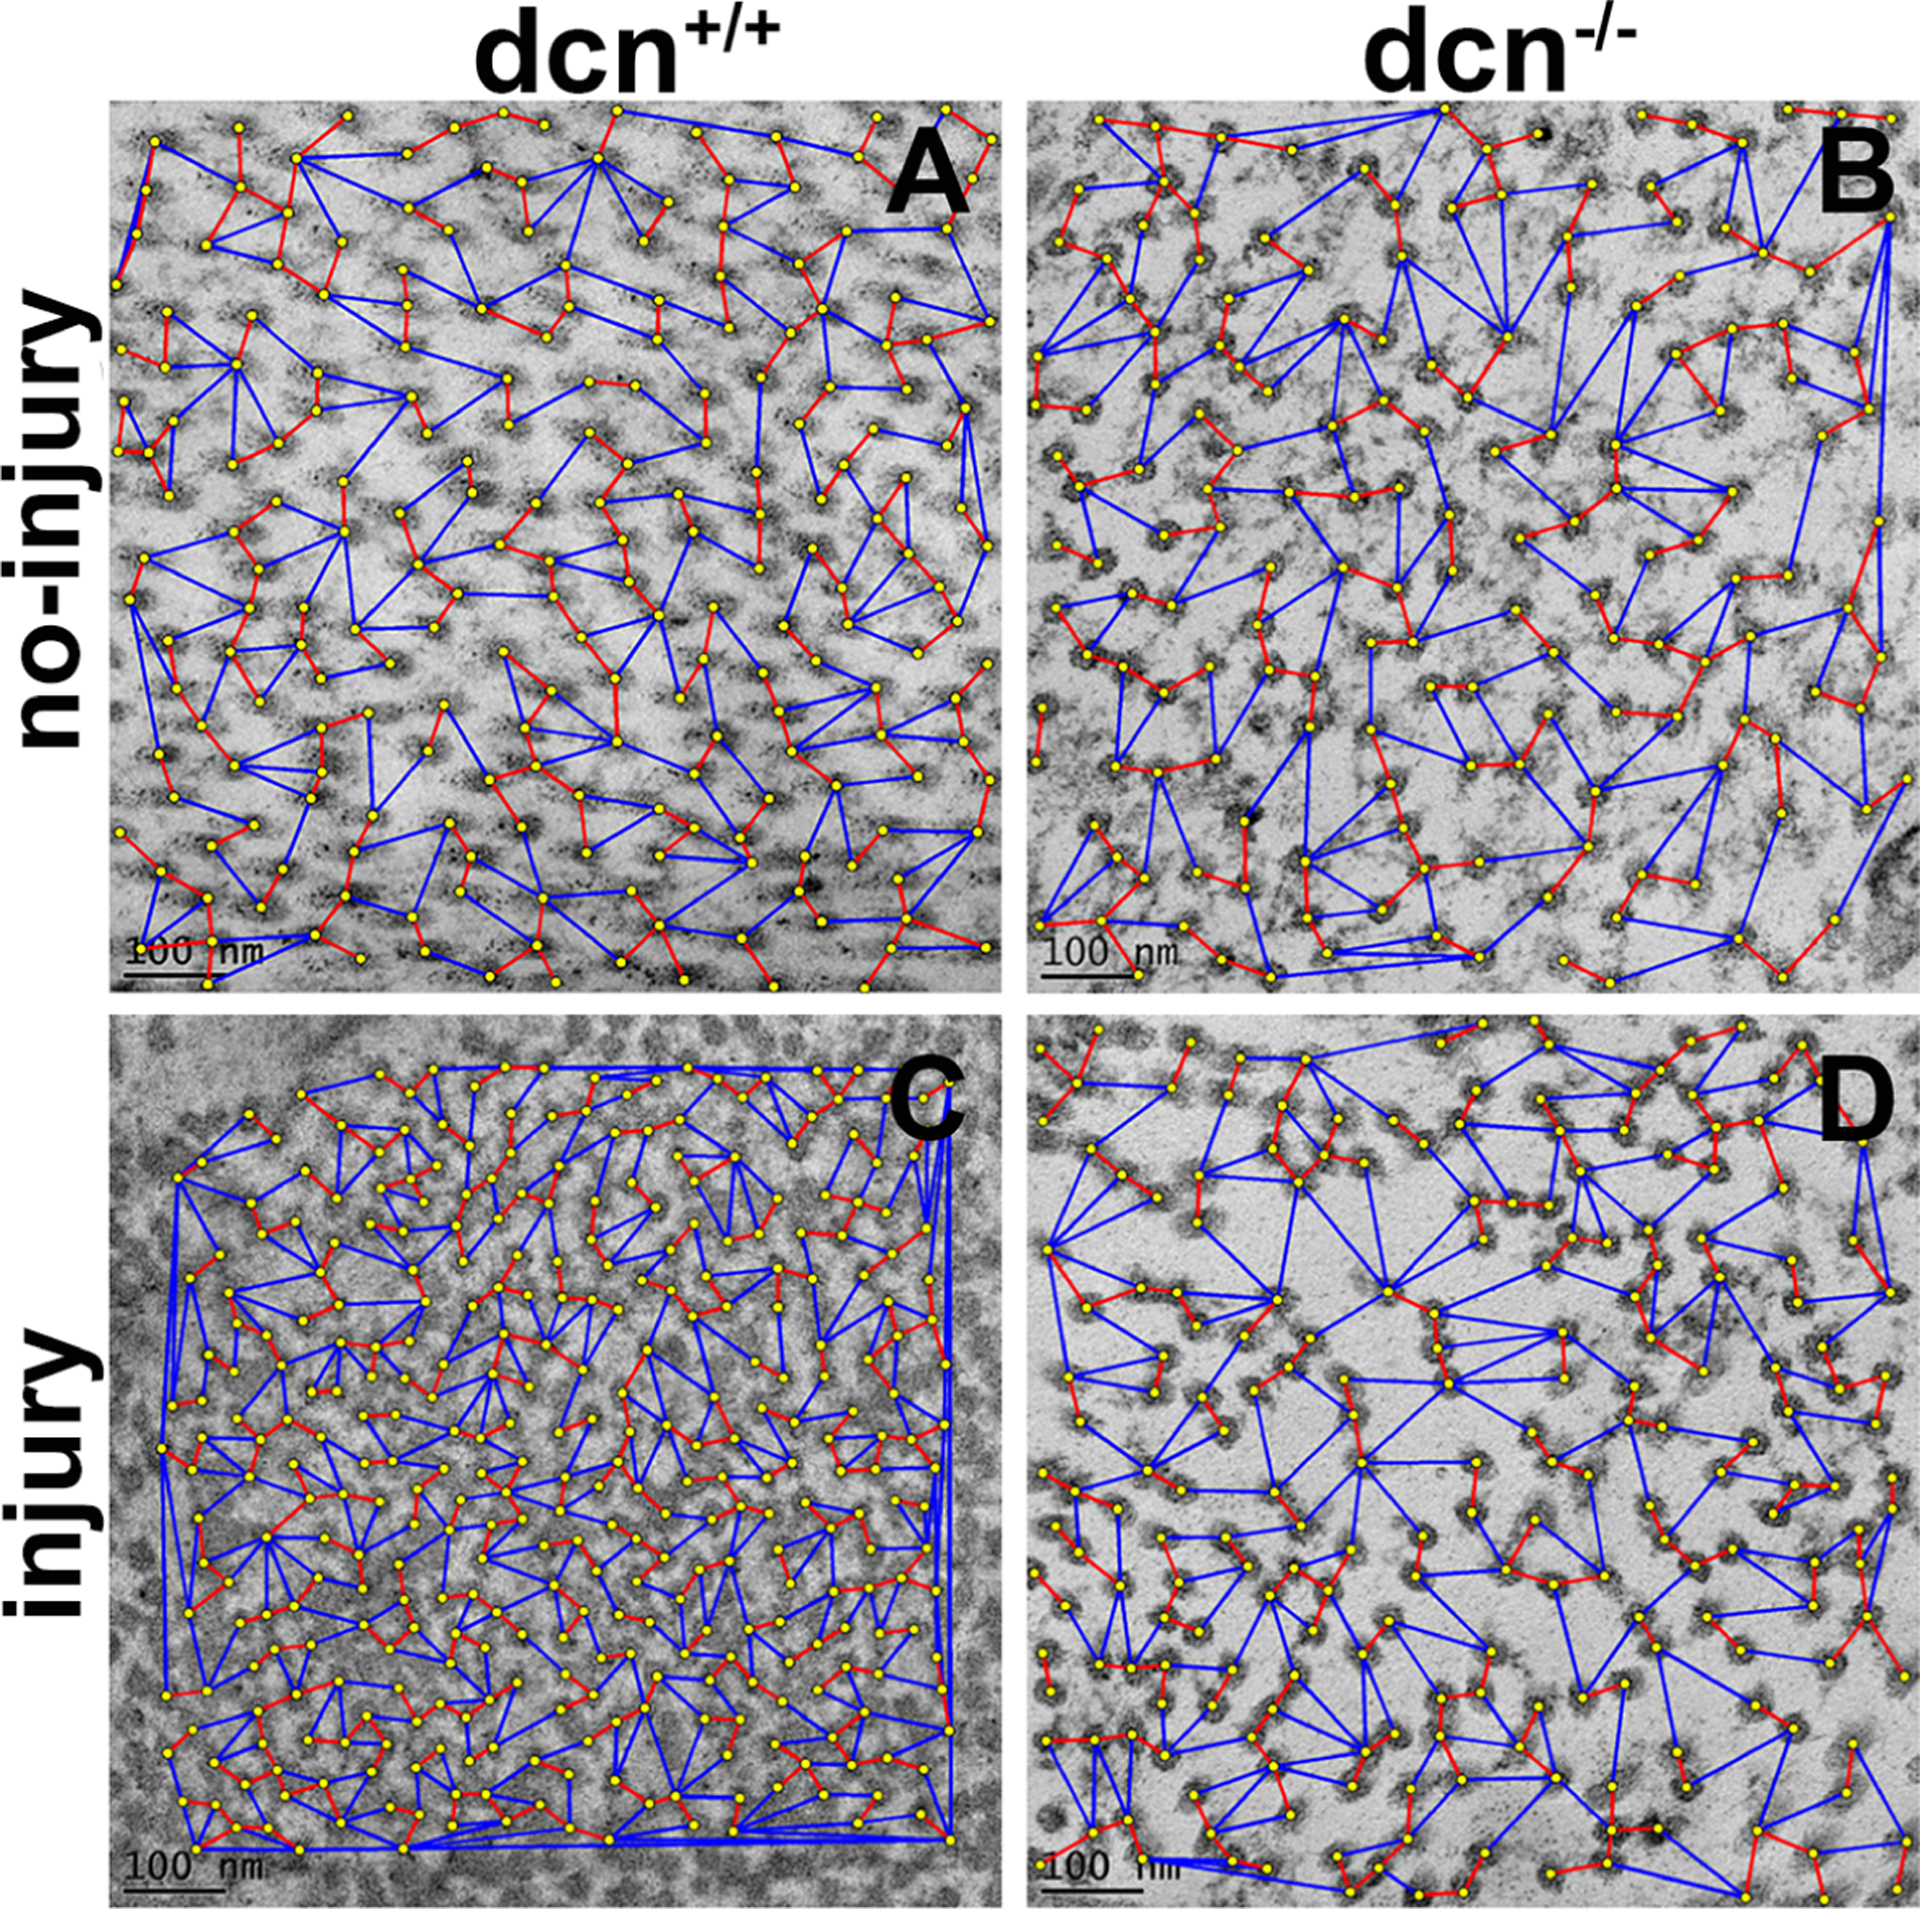
Representative TEM images showing organization and distribution pattern of fibrils in stroma at day 21 in no-injury and post-injury dcn+/+ and dcn−/− mouse corneas. The minimum IFD is shown by red lines and maximum IFD by blue lines. Injured dcn−/− corneas (D) showed largest minimum and maximum IFDs compared to the dcn+/+ corneas (C). Uninjured dcn+/+ (A) and dcn−/− (B) corneas showed unremarkable changes in IFDs. Scale bar = 100 nm.
Similarly, the min IFD and max IFD of collagen fibrils were measured using the masking of each collagen fibril in dcn+/+ and dcn−/− corneas (no-injury and injury groups) using a biocomputing tool (Figure 9). The min and max IFDs of entire fibril population of dcn+/+ and dcn−/− corneas of no-injury and injury groups were analyzed and plotted as violin graphs (Figure 9). The comparisons of IFD data showed uniform arrangement (Figure 9A & B) in non-injured corneas of the dcn+/+ and dcn−/− mice. Biocomputing and statistical analysis of the min/max IFD of non-injured dcn+/+ and dcn−/− (average minimum IFD 107±0.5 and 118±0.7, and average maximum IFD 284±6.6 and 286±6.1) showed no significant changes (p>0.05). On the other hand, the comparative analysis of IFD graphs of injured-corneas of the dcn+/+ and dcn−/− mice showed the random and jagged distribution of collagen fibrils (Figure 9C & D). The violin graph shows min IFD and max IFD in injured corneas of dcn+/+ and dcn−/− mice (average minimum IFD 81±0.3 and 108±0.8, and average maximum IFD 200±4.9 and 310±7.5) that were found statistically significant (p<0.05). The mean of min and max IFDs (Figure 9E & F) of collagen fibrils in dcn+/+ and dcn−/− showed significant changes in the injured groups when compared with the no-injury groups. Overall, this analysis reflects that injury in dcn−/− cornea caused disorganization of collagen fibril distribution pattern.
Figure 9.
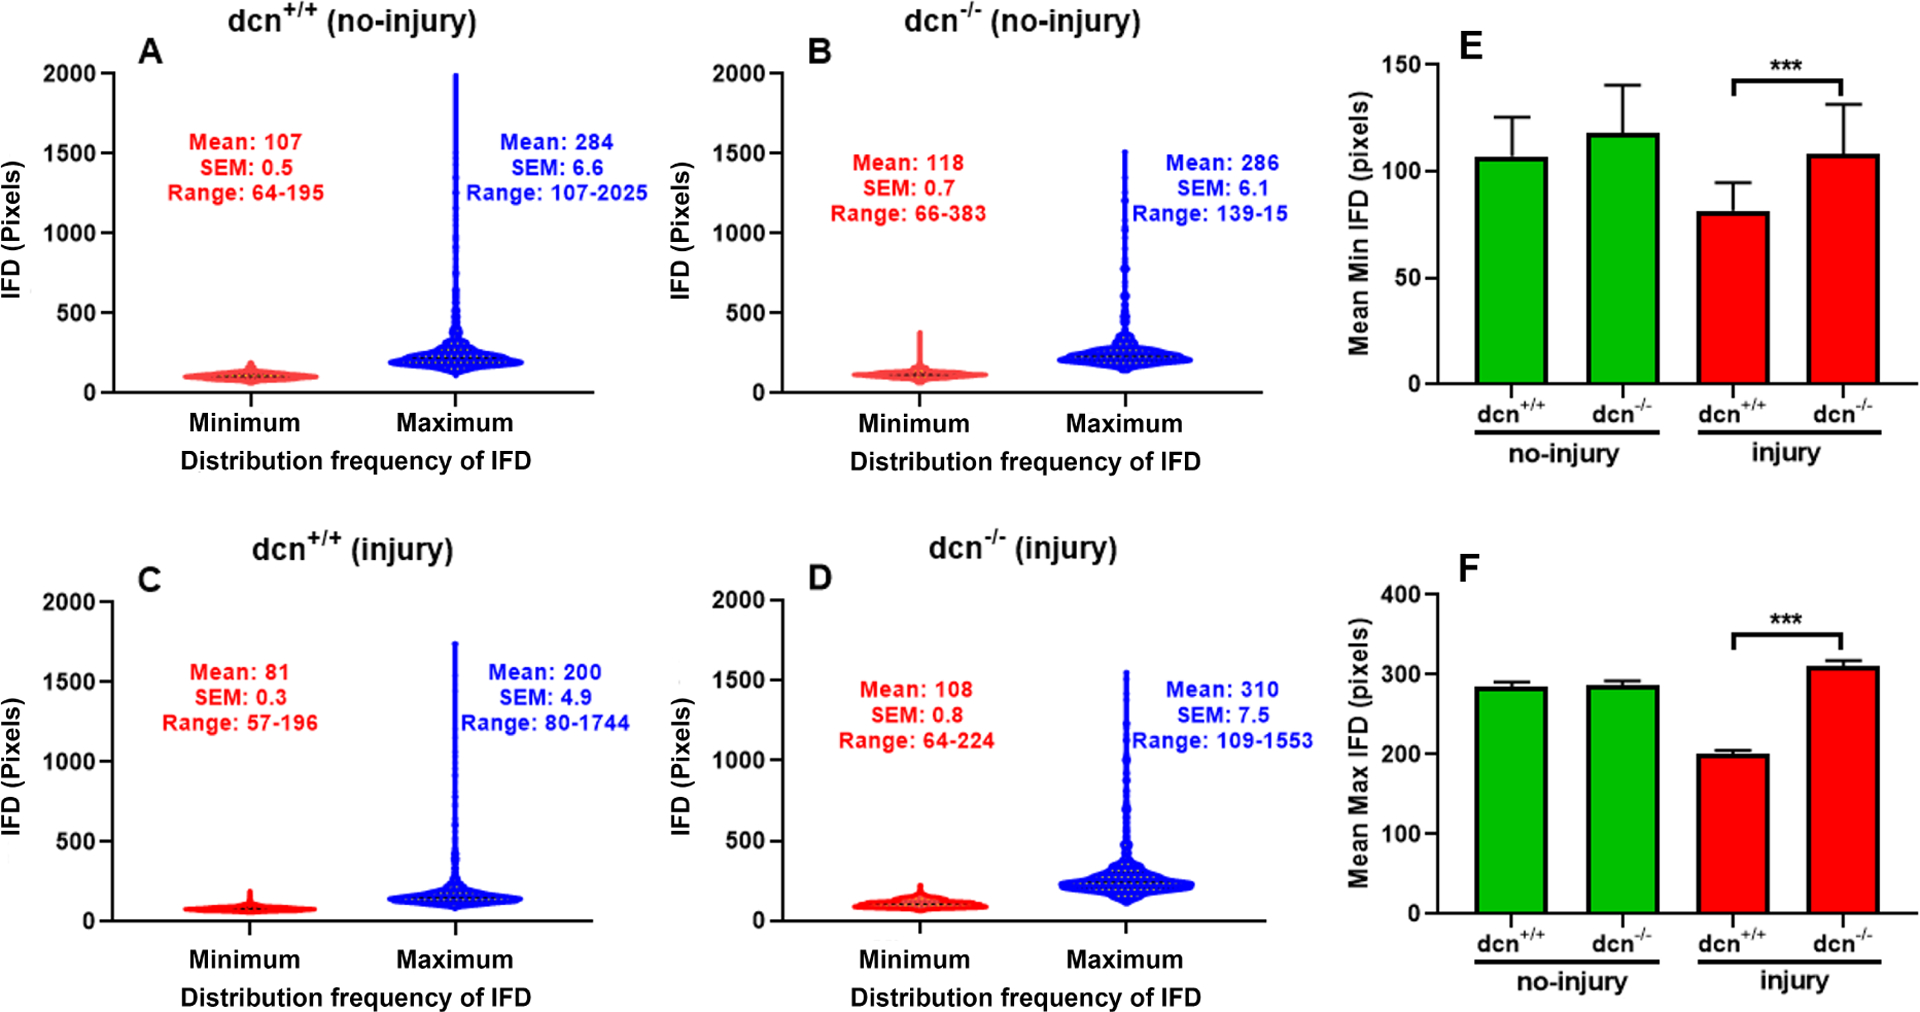
Violin graphs show inter fibril distances (IFD) and distribution frequency of IFD in stroma at day 21 in no-injury and post-injury dcn+/+ and dcn−/− mouse corneas. In violin graphs, minimum IFD is drawn in red color while maximum IFD in blue color. Injured dcn−/− corneas (D) showed prominent differences in minimum/maximum IFDs and its distribution frequency compared to the dcn+/+ corneas (C). These differences were unremarkable in uninjured dcn+/+ (A) and dcn−/− (B) corneas. Quantification found minimum (E) and maximum (F) IFDs significantly different in dcn−/− compared to the dcn+/+ corneas post injury. Data were expressed in ± SEM and ***P < 0.001.
3.6. Histology evaluation, collagen level changes and role of proteoglycan in collagen fibrillogenesis in dcn+/+ and dcn−/− mice
The changes in corneal morphology and collagen were studied with PAS (Figure 10) and Masson’s trichrome staining (Figure 11). The PAS staining showed remarkable morphologic alterations in injured corneas of dcn−/− and dcn+/+ mice (Figure 10C & D) but not in non-injured eyes (Figure 10A & B) at day 21. Similarly, the Masson’s trichrome staining showed noticeable changes in collagen levels in injured corneas (Figure 10C & D) compared to the non-injured corneas of dcn+/+ and dcn−/− mice (Figure 11A & B). An expected neo blood vessels were observed in alkali injured corneas of the dcn−/− and dcn+/+ (Figure 11C & D) but not in non-injured eyes (Figure 11A & B) mice at day 21. A montage of PAS stained images taken at 40x magnification from injured dcn−/− and dcn+/+ corneal sections revealed greater neovascularization in the injured dcn−/− corneas (Figure 11F) compared to the dcn+/+ corneas (Figure 11E), No neovascularization was observed in uninjured dcn−/− and dcn+/+ corneas (data not shown).
Figure 10.
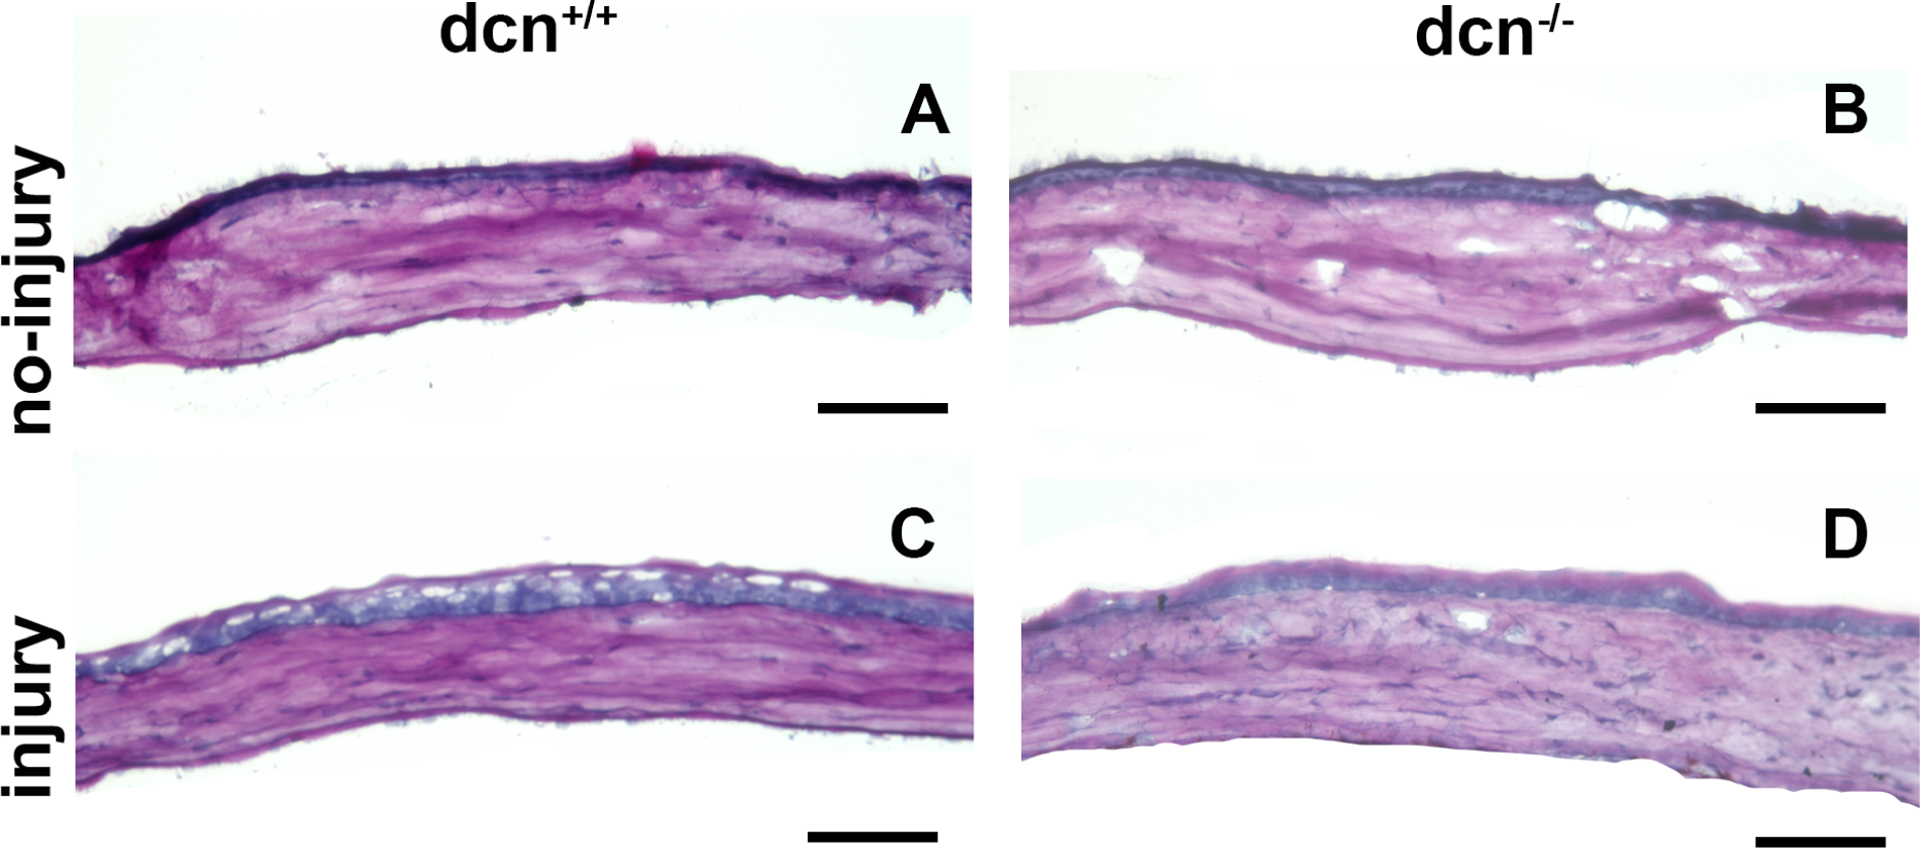
Representative PAS histology images of no-injury and post-injury dcn+/+ and dcn−/− mouse corneas at day 21. Injured dcn−/− (D) and dcn+/+ corneas (C) showed many morphologic alterations in tissue sections, which were unremarkable in uninjured dcn+/+ (A) and dcn−/− (B) corneas. Scale bar = 100 μm.
Figure 11.
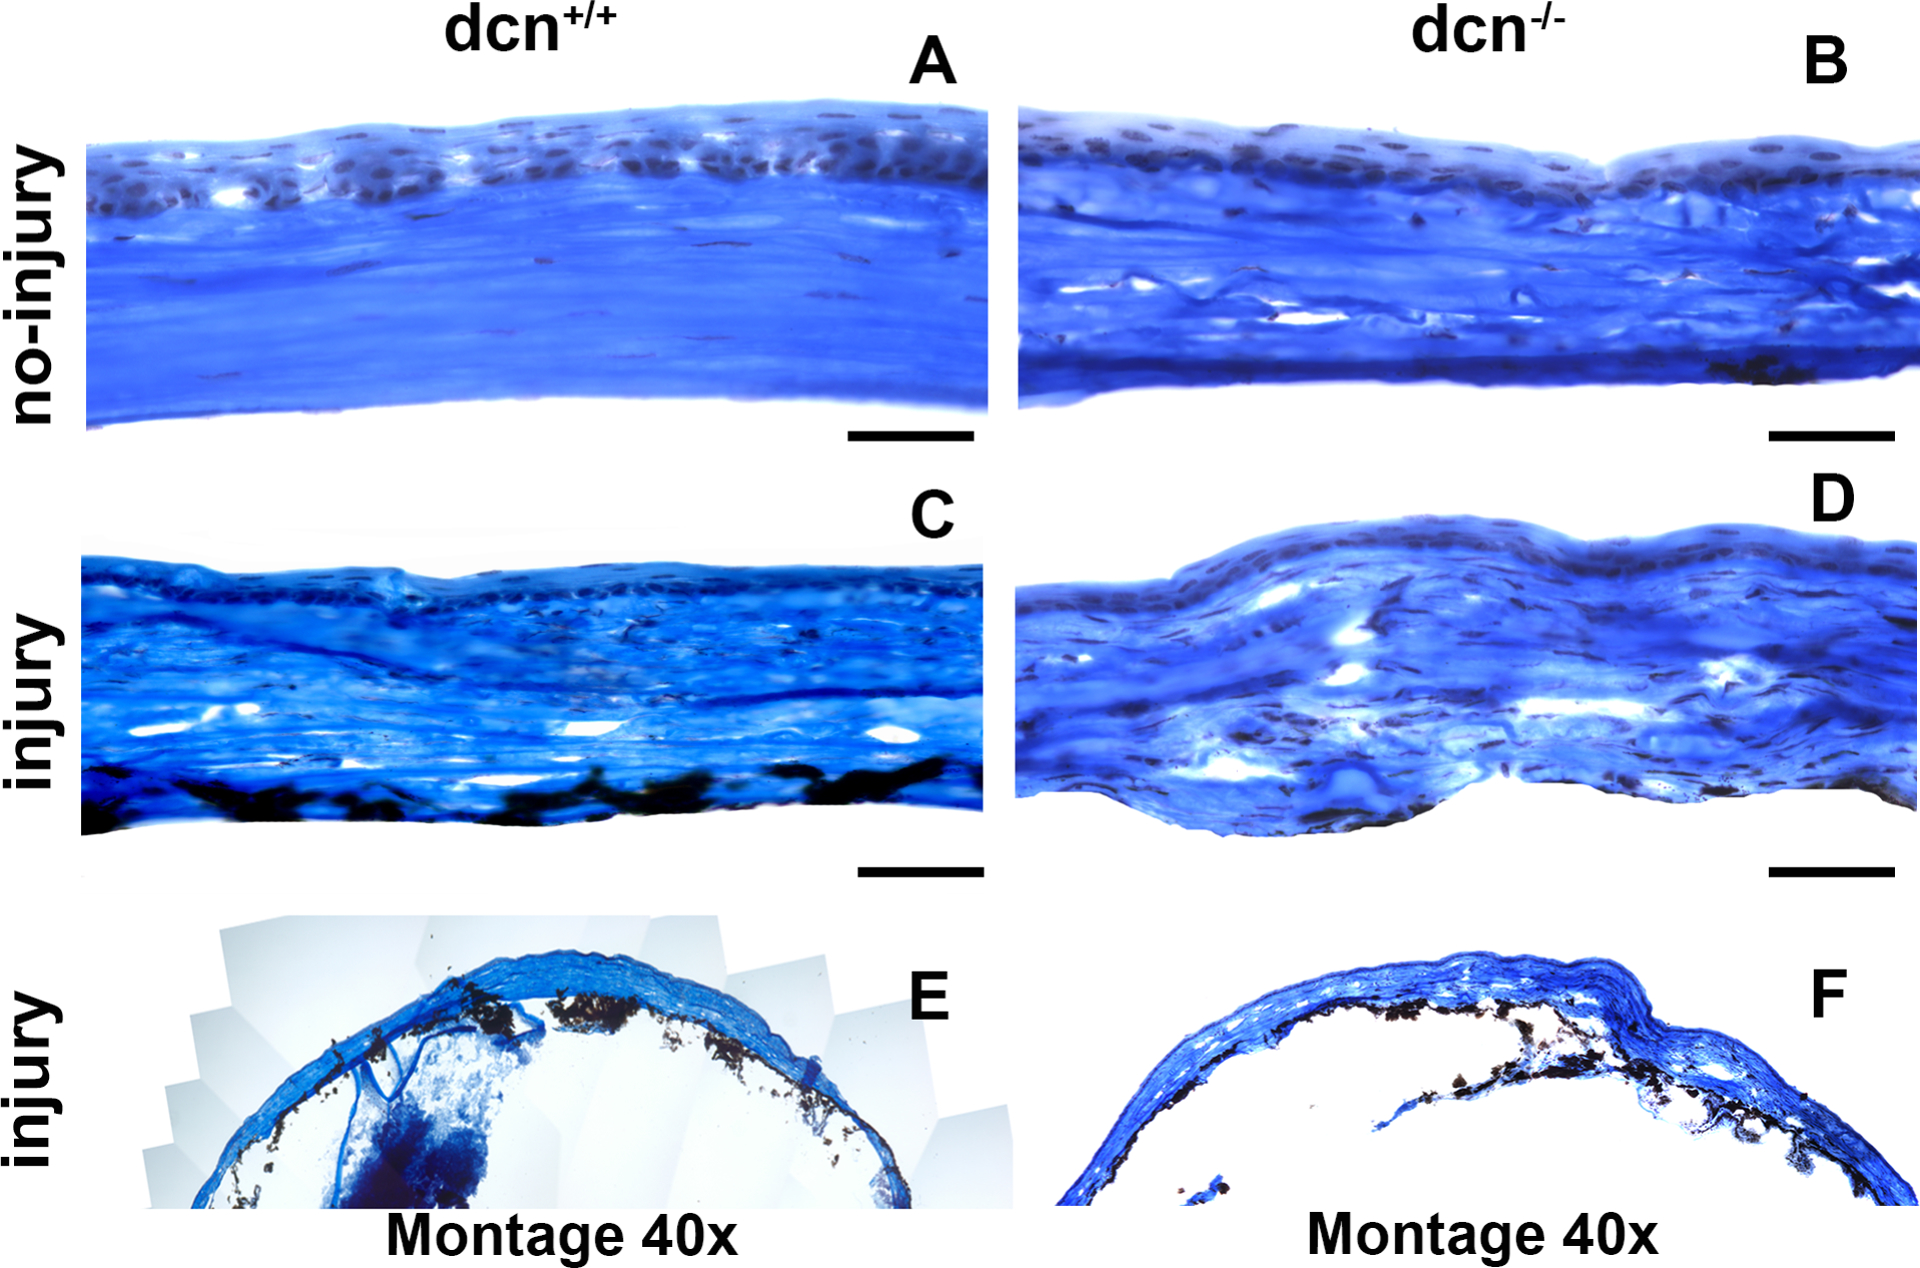
Representative Masson’s Trichrome histology images of no-injury and post-injury dcn+/+ and dcn−/− mouse corneas at day 21. Injured dcn−/− (D) and dcn+/+ corneas (C) exhibited notable differences in morphological details and collagen levels compared to the corresponding no-injury corneas (A & B). Montages created using 40X images show these effects on entire cornea of the injured dcn+/+ (E) and dcn−/− (F) animals. Scale bar = 100 μm.
4. Discussion
The corneal stroma consists of three primary non-aqueous constituents: collagens, proteoglycans, and cells (Meek and Knupp, 2015). The cornea is unique among connective tissues in exhibiting high mechanical strength and transparency. This is made possible with the highly specialized organization of collagen fibrils embedded in a hydrated fibrillar matrix (Boote et al., 2011) of the corneal stroma. The well-organized and uniform pattern of fibrils with multiple lamellae in ECM provides transparency and strength to the corneal tissue (Boote et al., 2011; Komai and Ushiki, 1991; Maurice, 1957). The shape of the corneal tissue is prospectively influenced by the size and arrangement of collagen fibrils between tissue regions (Meek and Knupp, 2015).
Collagens play a key role in maintaining corneal shape, size, and refractive properties through their distinctive uniform diameter and arrangement with a high degree of definite ordering (Sinha et al. 2021). The major collagens in the cornea are type I, III, V, VI, and XIII. The arrangement, disarrangement, and rearrangement of collagen fibrils in extracellular matrices are dynamic processes and affect corneal function. Previous studies show that the collagen fibrils in corneal stroma are embedded with proteoglycans (Hoffman et al., 1957; Meyer and Anderson, 1965). The distribution of collagen lamellae, organization, and IFD are important for normal corneal function and wound healing. The normal human corneal stroma contains four small leucine-rich proteoglycans: decorin, lumican, keratocan, and mimecan. The c-terminal capping motifs in decorin, lumican, and keratocan have an “ear repeat”, a leucine-rich repeat that extends outward from the convex face and probably helps to maintain protein conformation and collagen-binding ability (Meek and Knupp, 2015; Meek and Leonard, 1993). The individual proteoglycan core proteins are thought to bind to collagen fibrils at specific axial sites along the collagen fibrils (Meek and Holmes, 1983; Scott and Haigh, 1988). The fibril organization in corneal stroma is tissue-specific and perhaps affected by the molar ratios and spatial distributions of fibrils, non-collagenous macromolecules associated with the fibril, and assembly conditions. The present study mainly focuses on analyzing the compositional aspects of fibril assembly in the stroma of an uninjured and injured corneas of the dcn−/− and dcn+/+ mice at ultrastructural level to better understand its role in corneal function.
The precise organization of collagen fibrils in stroma is paramount to corneal refractive and transparent properties (Hassell and Birk, 2010). With the advent of new computational tools to quantify TEM imaging data, it has become possible to collect precise information about the distinctive collagen fibril organization in stroma and its relevance in the context of corneal transparency. The current work expands on this by examining alterations in collagen fibrillogenesis in −/+ injury and −/+ decorin in vivo. In the cornea, decorin is synthesized by the stromal fibroblasts/keratocytes in the ECM network and has an ability to interact with various growth factor and receptors such as transforming growth factor beta, epithelial growth factor receptor, pigmented epithelium derived factor, vascular endothelial growth factor, etc. and regulate their biological activities (Mohan et al., 2010, 2011b, 2019). The glycosaminoglycans (GAGs) side chain of the decorin can intermingle with stromal fibrils and act as a reservoir of growth factors. Decorin can fill the interstitial spaces within a tissue microenvironment and facilitate ECM interactions by acting as a ligand for cell surface receptors (Baghy et al., 2012; Fust et al., 2005). The chopping of the ECM with GAGs regulates the ECM architecture. However, interactions of decorin with growth factors, cytokines, and ECM molecules are complex and tightly regulated in tissue homeostasis and wound repair in ocular and non-ocular tissues (Bonnans et al., 2014; Mohan et al., 2011b; Kamil and Mohan 2021). Our previous reports exhibited the role of decorin in modulating corneal wound healing, fibrosis, and neovascularization using gain-of-function model by delivering decorin gene into human corneal fibroblasts in vitro (Mohan et al., 2010) and rabbit cornea in vivo (Mohan et al., 2011a; 2011c). The current study shows the role of decorin in modulating corneal collagen fibrillogenesis using a loss-of-function in vivo mouse model. To the best of our knowledge, this is the first study with decorin null mice to exhibit that ocular injury disrupts characteristic spatial arrangement of fibrils in stroma and corneal integrity in vivo.
There are many limitations to our present study. Proteoglycans play an important role in extending mechanical properties to the cornea and other ocular and non-ocular tissues (Fust et al., 2004; Quantock and Young 2008; Hatami-Marbini and Pinsky, 2010). In the present study, we did not investigate the effects of decorin on mechanical properties of the cornea and how they impact normal corneal function. The cornea is known to express other SLPRs such as biglycan and lumican besides decorin (Mohan et al. 2010b). Both, decorin and biglycan share a common binding site for collagen I but decorin binds to collagen I with greater affinity than the biglycan (Robinson et al., 2017). In this study, we did not examine the effects of biglycan, if any, on stromal fibrillogenesis following injury. Furthermore, utilized decorin null mice are truncated decorin knockouts, thereby the observed changes in the stromal fibrillogenesis within the cornea and vision loss after injury may be more than reported in this study. In present study, we observed significantly less haze and neovascularization (Figure 1, 2, 10, &11) and disruption in the distinctive stromal fibrillogenesis (Figure 4–9) in injured dcn−/− mouse corneas at day 21 compared to the dcn+/+ corneas under similar injury condition. It led us to speculate that the rescue effects of decorin on corneal wound healing events post injury are time depended. However, we did not use multiple late timepoints in the study, and therefore unable to tell if observed rescue of corneal irregularities by decorin remain same, get worst, or improve over time.
In conclusion, present study demonstrates the effects of decorin in regulating collagen fibrillogenesis in stroma of the normal and healing cornea in vivo using decorin null and wild type mice in conjunction with a standard injury technique.
Table 1.
List of primers used for confirmation of genotypes of mice strains
| Alleles | Sequence |
|---|---|
| decorin (dcn), shared (dcn+/−) | forward: 5’-ccttctggcacaagtctcttgg |
| decorin wild type, (dcn+/+) | reverse: 5’-tcgaagatgacactggcatcgg |
| decorin null, (dcn−/−) | reverse: 5’-tggatgtggaatgtgtgcgag |
Highlights.
Decorin plays a functional role in the maintenance of corneal architecture.
Decorin affects characteristic corneal collagen fibrillogenesis.
Collagen organization, ECM assembly and its interactions with decorin during corneal wound healing.
Acknowledgments
This work was primarily supported by the NEI/NIH R01EY017294, R01EY030774, and U01EY031650 grants (RRM), and partial support from the United States Department of Veterans Health Affairs Merit 1I01BX00357 and IK6BX005646 Senior Research Career Scientist grants (RRM), and Ruth M. Kraeuchi Missouri Endowed Chair Ophthalmology University of Missouri Fund (RRM). The authors thank Ashika Srivastava, an intern, for her help in assembling the manuscript draft.
Footnotes
Publisher's Disclaimer: This is a PDF file of an unedited manuscript that has been accepted for publication. As a service to our customers we are providing this early version of the manuscript. The manuscript will undergo copyediting, typesetting, and review of the resulting proof before it is published in its final form. Please note that during the production process errors may be discovered which could affect the content, and all legal disclaimers that apply to the journal pertain.
None of the authors have any conflict of interest to disclose.
References
- Abrams GA, Schaus SS, Goodman SL, Nealey PF, Murphy CJ, 2000. Nanoscale topography of the corneal epithelial basement membrane and Descemet’s membrane of the human. Cornea. 19, 57–64. 10.1097/00003226-200001000-00012. [DOI] [PubMed] [Google Scholar]
- Baghy K, Iozzo RV, Kovalszky I, 2012. Decorin-TGFβ axis in hepatic fibrosis and cirrhosis. J Histochem Cytochem. 60(4), 262–268. https://doi: 10.1369/0022155412438104. [DOI] [PMC free article] [PubMed] [Google Scholar]
- Balne PK, Gupta S, Zhang J, Bristow D, Faubion M, Heil SD, Sinha PR, Green SL, Iozzo RV, Mohan RR, 2021. The functional role of decorin in corneal neovascularization in vivo. Exp. Eye Res 207, 108610. 10.1016/j.exer.2021.108610. [DOI] [PMC free article] [PubMed] [Google Scholar]
- BenEzra D, Griffin BW, Maftzir G, Sharif NA, Clark AF, 1997. Topical formulations of novel angiostatic steroids inhibit rabbit corneal neovascularization. Invest. Ophthalmol. Vis. Sci 38(10), 1954–62. [PubMed] [Google Scholar]
- Bonnans C, Chou J, Werb Z, 2014. Remodelling the extracellular matrix in development and disease. Nat Rev Mol Cell Biol. 15(12), 786–801. 10.1038/nrm3904. [DOI] [PMC free article] [PubMed] [Google Scholar]
- Boote C, Kamma-Lorger Christina S., Hayes S, Harris J, Burghammer M, Hiller J, Terrill, Nicholas J, Meek Keith M., 2011. Quantification of Collagen Organization in the Peripheral Human Cornea at Micron-Scale Resolution. Biophys. J 101(1), 33–42. 10.1016/j.bpj.2011.05.029. [DOI] [PMC free article] [PubMed] [Google Scholar]
- Brown CT, Lin P, Walsh MT, Gantz D, Nugent MA, Trinkaus-Randall V, 2002. Extraction and purification of decorin from corneal stroma retain structure and biological activity. Protein Expr. Purif 25, 389–399. 10.1016/S1046-5928(02)00025-6 [DOI] [PubMed] [Google Scholar]
- Chaurasia SS, Lim RR, Lakshminarayanan R, Mohan RR., 2015. Nanomedicine approaches for corneal diseases. J. Funct. Biomater 6, 277–298. 10.3390/jfb6020277. [DOI] [PMC free article] [PubMed] [Google Scholar]
- Chen S, Mienaltowski MJ, Birk DE, 2015. Regulation of corneal stroma extracellular matrix assembly. Exp. Eye Res 133, 69–80. 10.1016/j.exer.2014.08.001. [DOI] [PMC free article] [PubMed] [Google Scholar]
- Danielson KG, Baribault H, Holmes DF, Graham H, Kadler KE, Iozzo RV, 1997. Targeted disruption of decorin leads to abnormal collagen fibril morphology and skin fragility. J. Cell Biol 136, 729–743. 10.1083/jcb.136.3.729. [DOI] [PMC free article] [PubMed] [Google Scholar]
- Ersoy I, Bunyak F, Higgins JM, Palaniappan K, 2012. Coupled edge profile active contours for red blood cell flow analysis, 2012 9th IEEE International Symposium on Biomedical Imaging (ISBI), pp. 748–751. 10.1109/ISBI.2012.6235656. [DOI] [Google Scholar]
- Fantes FE, Hanna KD, Waring GO 3rd, Pouliquen Y, Thompson KP, Savoldelli M, 1990. Wound healing after excimer laser keratomileusis (photorefractive keratectomy) in monkeys. Arch. Ophthalmol 108, 665–675. 10.1001/archopht.1990.01070070051034. [DOI] [PubMed] [Google Scholar]
- Faul F, Erdfelder E, Lang A-G, Buchner A, 2007. G*Power 3: A flexible statistical power analysis program for the social, behavioral, and biomedical sciences. Behav. Rea. Methods 39, 175–191. 10.3758/bf03193146. [DOI] [PubMed] [Google Scholar]
- Frangi AF, Niessen WJ, Vincken KL, Viergever MA, 1998. Multiscale vessel enhancement filtering, in: Wells WM, Colchester A, Delp S (Eds.), Med. Image Comput. Comput Assist. Interv Springer; Berlin Heidelberg, Germany, pp. 130–137. 10.1007/BFb0056195. [DOI] [Google Scholar]
- Fust A, LeBellego F, Iozzo RV, Roughley PJ, Ludwig MS, 2005. Alterations in lung mechanics in decorin-deficient mice. Am. J. Physiol. Lung Cell. Mol. Physiol 288 (1), L159–66. 10.1152/ajplung.00089.2004. [DOI] [PubMed] [Google Scholar]
- Gardner S, Gardner SJ, White N, Albon J, Knupp C, Kamma-Lorger CS, Meek KM, 2015. Measuring the refractive Index of bovine corneal stromal cells using quantitative phase imaging. Biophys. J 109(8), 1592–1599. 10.1016/j.bpj.2015.08.046. [DOI] [PMC free article] [PubMed] [Google Scholar]
- Gregory JD, Cöster L, Damle SP, 1982. Proteoglycans of rabbit corneal stroma. Isolation and partial characterization. J. Biol. Chem 257(12), 6965–6970. [PubMed] [Google Scholar]
- Gronkiewicz KM, Giuliano EA, Kuroki K, Bunyak F, Sharma A, Teixeira LBC, Hamm CW, Mohan RR, 2016. Development of a novel in vivo corneal fibrosis model in the dog. Exp. Eye Res 143, 75–88. 10.1016/j.exer.2015.09.010. [DOI] [PMC free article] [PubMed] [Google Scholar]
- Gupta S, Fink MK, Ghosh A, Tripathi R, Sinha PR, Sharma A, Hesemann NP, Chaurasia SS, Giuliano EA, Mohan RR, 2018. Novel combination BMP7 and HGF gene therapy instigates selective myofibroblast apoptosis and reduces corneal haze in vivo. Invest. Ophthalmol. Vis. Sci 59, 1045–1057. 10.1167/iovs.17-23308. [DOI] [PMC free article] [PubMed] [Google Scholar]
- Gupta S, Rodier JT, Sharma A, Giuliano EA, Sinha PR, Hesemann NP, Ghosh A, Mohan RR, 2017. Targeted AAV5-Smad7 gene therapy inhibits corneal scarring in vivo. PLoS One. 12(3):e0172928. 10.1371/journal.pone.0172928. [DOI] [PMC free article] [PubMed] [Google Scholar]
- Hassell JR, Birk DE, 2010. The molecular basis of corneal transparency. Exp. Eye Res 91(3), 326–35. 10.1016/j.exer.2010.06.021. [DOI] [PMC free article] [PubMed] [Google Scholar]
- Hatami-Marbini H, Pinsky PM, 2010. “The contribution of proteoglycans on the mechanical properties of the corneal stroma.” Proceedings of the ASME 2010 First Global Congress on Nano-Engineering for Medicine and Biology; 299–300. 10.1115/NEMB2010-13175. [DOI] [Google Scholar]
- Hoffman P, Linker A, Meyer K, 1957. The acid mucopolysaccharides of connective tissues. II. Further experiments on chondroitin sulfate B. Arch. Biochem. Biophys 69, 435–440. 10.1016/0003-9861(57)90508-8. [DOI] [PubMed] [Google Scholar]
- Iozzo RV, 1998. Matrix proteoglycans: from molecular design to cellular function. Annu. Rev. Biochem 67, 609–52. 10.1146/annurev.biochem.67.1.609. [DOI] [PubMed] [Google Scholar]
- Kamil S, Mohan RR, 2021. Corneal stromal wound healing: Major regulators and therapeutic targets. Ocul. Surf 19, 290–306. 10.1016/j.jtos.2020.10.006. [DOI] [PMC free article] [PubMed] [Google Scholar]
- Komai Y, Ushiki T, 1991. The three-dimensional organization of collagen fibrils in the human cornea and sclera. Invest. Ophthalmol. Vis. Sci 32(8), 2244–58. [PubMed] [Google Scholar]
- Lim R, Gupta S, Grant D, Sinha PR, Mohan R, Chaurasia S, 2018. Retinal ultrastructural and microvascular defects in decorin deficient (dcn−/−) mice. Microsc. Microanal 24(S1), 1264–65. https://doi.org/doi: 10.1017/S1431927618006803. [DOI] [Google Scholar]
- Massague J, 1998. TGF-beta signal transduction. Annu. Rev. Biochem 67, 753–91. 10.1146/annurev.biochem.67.1.753. [DOI] [PubMed] [Google Scholar]
- Matlab, 2019. Version 9.6.0 (R2019a), Natick, Massachusetts: The MathWorks Inc. [Google Scholar]
- Maurice DM, 1957. The structure and transparency of the cornea. J. Physiol 136, 263–286. 10.1113/jphysiol.1957.sp005758. [DOI] [PMC free article] [PubMed] [Google Scholar]
- Meek KM, Holmes DF, 1983. Interpretation of the electron microscopical appearance of collagen fibrils from the corneal stroma. Int. J. Biol. Macromol 5(1), 17–25. 10.1016/0141-8130(83)90073-9. [DOI] [Google Scholar]
- Meek KM, Knupp C, 2015. Corneal structure and transparency. Prog Retin Eye Res 49, 1–16. 10.1016/j.preteyeres.2015.07.001. [DOI] [PMC free article] [PubMed] [Google Scholar]
- Meek KM, Leonard DW, 1993. Ultrastructure of the corneal stroma: a comparative study. Biophys. J 64, 273–280. 10.1016/S0006-3495(93)81364-X. [DOI] [PMC free article] [PubMed] [Google Scholar]
- Meyer K, Anderson B, 1965. The chemical specificity of the mucopolysaccharides of the cornea. Exp. Eye Res 4, 346–348. 10.1016/s00144835(65)80050-1. [DOI] [PubMed] [Google Scholar]
- Mohan RR, Gupta R, Mehan MK, Cowden JW, Sinha S, 2010. Decorin transfection suppresses profibrogenic genes and myofibroblast formation in human corneal fibroblasts. Exp. Eye Res 91, 238–245. 10.1016/j.exer.2010.05.013. [DOI] [PMC free article] [PubMed] [Google Scholar]
- Mohan RR, Tandon A, Sharma A, Cowden JW, Tovey JCK, 2011a. Significant inhibition of corneal scarring in vivo with tissue-selective, targeted AAV5 decorin gene therapy. Invest. Ophthalmol. Vis. Sci 52(7), 4833–41. 10.1167/iovs.11-7357. [DOI] [PMC free article] [PubMed] [Google Scholar]
- Mohan RR, Tovey JC, Gupta R, Sharma A, Tandon A, 2011b. Decorin biology, expression, function, and therapy in the cornea. Curr. Mol. Med 11(2), 110–28. 10.2174/156652411794859241. [DOI] [PubMed] [Google Scholar]
- Mohan RR, Tovey JC, Sharma A, Schultz GS, Cowden JW, Tandon A, 2011c. Targeted decorin gene therapy delivered with adeno-associated virus effectively retards corneal neovascularization in vivo. PLoS One 6(10), e26432. 10.1371/journal.pone.0026432. [DOI] [PMC free article] [PubMed] [Google Scholar]
- Mohan RR, Tripathi R, Sharma A, Sinha PR, Giuliano EA, Hesemann NP, Chaurasia SS, 2019. Decorin antagonizes corneal fibroblast migration via caveolae-mediated endocytosis of epidermal growth factor receptor. Exp. Eye Res 180, 200–207. https://doi.10.1016/j.exer.2019.01.001. [DOI] [PMC free article] [PubMed] [Google Scholar]
- Nath SK, Palaniappan K, Bunyak F, 2006. Cell segmentation using coupled level sets and graph-vertex coloring. Med. Image Comput. Comput Assist. Interv 9(1), 101–108. 10.1007/11866565_13. [DOI] [PMC free article] [PubMed] [Google Scholar]
- Quantock AJ, Young RD, 2008. Development of the corneal stroma, and the collagen–proteoglycan associations that help define its structure and function. Dev Dyn. 237, 2607–2621. 10.1002/dvdy.21579. [DOI] [PubMed] [Google Scholar]
- Reed CC, Iozzo RV, 2002. The role of decorin in collagen fibrillogenesis and skin homeostasis. Glycoconj. J 19(4), 249–55. 10.1023/A:1025383913444. [DOI] [PubMed] [Google Scholar]
- Robinson KA, Sun M, Barnum CE, Weiss SN, Huegel J, Shetye SS, Lin L, Saez D, Adams SM, Iozzo RV, Soslowsky LJ, Birk DE, 2017. Decorin and biglycan are necessary for maintaining collagen fibril structure, fiber realignment, and mechanical properties of mature tendons. Matrix Biol. 64, 81–93. https://doi: 10.1016/j.matbio.2017.08.004. [DOI] [PMC free article] [PubMed] [Google Scholar]
- Scott JE, Haigh M, 1988. Identification of specific binding sites for keratan sulphate proteoglycans and chondroitin-dermatan sulphate proteoglycans on collagen fibrils in cornea by the use of cupromeronic blue in ‘critical-electrolyte-concentration’ techniques. Biochem. J 253(2), 607–10. 10.1042/bj2530607. [DOI] [PMC free article] [PubMed] [Google Scholar]
- Sinha NR, Balne PK, Bunyak F, Hofmann AC, Lim RR, Mohan RR, Chaurasia SS, 2021. Collagen matrix perturbations in corneal stroma of Ossabaw mini pigs with type 2 diabetes. Mol. Vis 27, 666–678. http://www.molvis.org/molvis/v27/666. [PMC free article] [PubMed] [Google Scholar]
- Soille P, 2003. Morphological Image Analysis: Principles and Applications. Springer; Berlin Heidelberg, Germany. 10.1007/978-3-662-03939-7. [DOI] [Google Scholar]
- Sun M, Huang J, Bunyak F, Gumpper K, De G, Sermersheim M, Liu G, Lin P-H, Palaniappan K, Ma J, 2014. Superresolution microscope image reconstruction by spatiotemporal object decomposition and association: application in resolving t-tubule structure in skeletal muscle. Opt. Express 22(10), 12160–76. 10.1364/OE.22.012160. [DOI] [PMC free article] [PubMed] [Google Scholar]
- Vincent L, Soille P, 1991. Watersheds in digital spaces: an efficient algorithm based on immersion simulations. Pattern Anal. Mach. Intell. IEEE Trans. Pattern Anal. Mach. Intell 13(6), 583–98. 10.1109/34.87344. [DOI] [Google Scholar]
- Weis SM, Zimmerman SD, Shah M, Covell JW, Omens JH, Ross J Jr., Dalton N, Jones Y, Reed CC, Iozzo RV, McCulloch AD, 2005. A role for decorin in the remodeling of myocardial infarction. Matrix Biol. 24(4), 313–24. 10.1016/j.matbio.2005.05.003. [DOI] [PubMed] [Google Scholar]
- White TL, Lewis PN, Young RD, Kitazawa K, Inatomi T, Kinoshita S, Meek KM, 2017. Elastic microfibril distribution in the cornea: Differences between normal and keratoconic stroma. Exp. Eye Res 159, 40–48. 10.1016/j.exer.2017.03.002. [DOI] [PMC free article] [PubMed] [Google Scholar]
- Wilson SE, Marino GK, Torricelli AAM, Medeiros CS, 2017. Injury and defective regeneration of the epithelial basement membrane in corneal fibrosis: A paradigm for fibrosis in other organs? Matrix Biol. 64, 17–26. 10.1016/j.matbio.2017.06.003. [DOI] [PMC free article] [PubMed] [Google Scholar]


