Abstract
Background
Accumulating evidence suggests a strong association between polycystic ovary syndrome (PCOS) and ovarian cancer (OC), but the potential molecular mechanism remains unclear. In this study, we identified previously unrecognized genes that are significantly correlated with PCOS and OC via bioinformatics.
Materials and methods
Multiple bioinformatic analyses, such as differential expression analysis, univariate Cox analysis, functional and pathway enrichment analysis, protein–protein interaction (PPI) network construction, survival analysis, and immune infiltration analysis, were utilized. We further evaluated the effect of OGN on FSHR expression via immunofluorescence.
Results
TCGA-OC, GSE140082 (for OC) and GSE34526 (for PCOS) datasets were downloaded. Twelve genes, including RNF144B, LPAR3, CRISPLD2, JCHAIN, OR7E14P, IL27RA, PTPRD, STAT1, NR4A1, OGN, GALNT6 and CXCL11, were identified as signature genes. Drug sensitivity analysis showed that OGN might represent a hub gene in the progression of PCOS and OC. Experimental analysis found that OGN could increase FSHR expression, indicating that OGN could regulate the hormonal response in PCOS and OC. Furthermore, correlation analysis indicated that OGN function might be closely related to m6A and ferroptosis.
Conclusions
Our study identified a 12-gene signature that might be involved in the prognostic significance of OC. Furthermore, the hub gene OGN represent a significant gene involved in OC and PCOS progression by regulating the hormonal response.
Supplementary Information
The online version contains supplementary material available at 10.1186/s13048-022-00962-w.
Keywords: Ovarian cancer, Polycystic ovary syndrome, Bioinformatic analysis, OGN, Prognostic marker
Introduction
Polycystic ovary syndrome (PCOS), a multisystem reproductive metabolic disease of the reproductive system, is characterized by the pathological accumulation of nonmaturating and atretic follicles, ovarian and stromal abnormal hyperplasia, hyperandrogenaemia (HA), hyperinsulinaemia, insulin resistance (IR), aberrant metabolism, an imbalance in the ratio of luteinizing hormone (LH) to follicle-stimulating hormone (FSH), and polycystic ovaries [1]. The mRNA and microRNA profiles of PCOS patients were extremely similar to ovarian cancer (OC) patients, indicating that the same molecular mechanisms might be involved in OC and PCOS patients [2, 3].
During PCOS progression, HA is an important factor for promoting ovulatory dysfunction [4], increasing the frequency and amplitude of LH and GnRH pulse secretion [5], inducing lipid metabolism disorders [6], mediating hyperinsulinaemia and insulin resistance [7], and dysregulating the ratio of LH to FSH [8].
For the clinical management of patients with PCOS, anti-androgen therapy is the first line of treatment for patients diagnosed with PCOS [9]. Over recent years, the relationship between PCOS and OC progression has been a hot topic for these studies because the AR signalling axis and metabolic disorders are correlated with a high risk of OC [3, 10, 11]. Both OC and PCOS are multifactorial diseases with genetic, endogenous, endocrine-maladjusted, metabolically disturbed and environmental factors. Therefore, a better understanding of the physiopathologic mechanism regulating these complex molecular effects is urgently needed to promote the research and development of new drugs and to improve these patients’ prognoses.
With the development of bioinformatic analysis and public databases, such as The Cancer Genome Atlas (TCGA) [12] and Gene Expression Omnibus (GEO) [13], understanding the molecular mechanisms of currently available treatments against PCOS and OC provides a means to emphasize targets for effective treatments. For example, Surleen Kaur found that in PCOS tissues, certain differentially expressed genes correlated with metabolic disorders and oxidative stress and exhibited a potential relationship with cancer [14]. HSA2 and CBLN1 were all identified in a PCOS dataset [15]. Another study identified 36 highly altered genes, among which 10 were common to endometrial cancer (EC), OC and breast cancer (BC), promoting cell proliferation, hormone response, and endogenous stimulation [16]. A series of bioinformatics tools were used for integrated analysis and detection of metabolism-related genes (MRGs) in OC. For example, we found that ENPP1, FH, CYP2E1, HPGDS, ADCY9, NDUFA5, ADH1B and PYGB were correlated with the underlying mechanisms of metabolic reprogramming in OC progression [17]. Yang et al. found that CCNB2, TYMS, KIF11, KIF4A, BIRC5, BUB1B, FOXM1, and CDC20 might represent potential therapeutic targets for OC patients [18]. Nevertheless, whether these hub genes are uniquely involved in individual disease progression remains unclear.
To determine the potential molecular mechanisms between PCOS and OC, we integrated two datasets, namely, PCOS and OC. Utilizing multiple bioinformatic and experimental analyses, we sought to validate hub genes and pathways of interest and to search for potential therapeutic drugs or targets in PCOS and OC.
Materials and methods
Data extraction
The TCGA database [12] (https://portal.gdc.cancer.gov/) is the largest cancer gene information database and includes data concerning gene expression. We extracted data for 374 cases of OSC patients. Moreover, we downloaded level three FPKM data for subsequent analysis. The transcriptome RNA-sequencing and clinical information of 88 normal ovarian samples were extracted from the GTEX database (https://www.gtexportal.org/) [19]. Furthermore, the GSE140082 and GSE34526 datasets were downloaded from the GEO database [13].
Functional enrichment analyses
Functional enrichment analyses were also performed as previously published [17]. The DAVID database (https://david.ncifcrf.gov/) [20] is mainly used to perform functional and pathway enrichment analyses of differentially expressed genes and is a very good tool used by many researchers. We submitted the 128 common DEGs to the DAVID database and performed GO function and KEGG pathway analyses.
PPI network construction
GeneMANIA (http://genemania.org) [21] is an extremely interactive online analysis site based on proteomics and genomics data that is used to construct the PPI network for 128 common DEGs associated with PCOS and OC patients.
Establishing prognostic indicators based on DEGs
Univariate Cox analysis was used to select genes associated with prognosis, and a prognostic correlation model was further constructed. After incorporating the expression value of each specific gene, a risk score formula was constructed for each patient. According to the risk score formula, patients were divided into a low-risk group and a high-risk group using the median risk score as the cut-off point. Kaplan–Meier analysis was used to evaluate the survival difference between the two groups, and the log-rank statistical method was used for comparison. Finally, receiver operating characteristic (ROC) curves were used to study the accuracy of model prediction.
OGN protein expression based on bioinformatic analysis
OGN protein expression in OC was confirmed using the HPA database (https://www.proteinatlas.org/) [22] and CPTAC database (https://cptac-data-portal.georgetown.edu/) [23].
The relationship between key genes and immune infiltration
The correlation between immune cell content and the expression level of 5 key genes (JCHAIN, CXCL11, OGN, STAT1, and GALNT6) was confirmed using the TIMER database (https://cistrome.shinyapps.io/timer/) [24].
GSVA and GSEA
Gene set variation analysis (GSVA) is a nonparametric and unsupervised method for assessing the enrichment of transcriptome gene sets. GSVA converts gene-level changes into pathway-level changes by comprehensively scoring the sets of genes of interest to judge the biological function of the samples. In this study, gene sets will be downloaded from The Molecular Signatures Database (v7.0), and each gene set will be comprehensively scored using the GSVA algorithm to evaluate the potential biological function changes of different samples.
GSEA uses a predefined set of genes, orders genes according the level of differential expression in the two types of samples, and then tests whether the predefined set of genes is enriched at the top or bottom of the sequencing table. In this study, the possible molecular mechanism of the difference in prognosis of different ovarian cancer patients was explored by comparing the differences in signal pathways between the high-expression group and the low-expression group using GSEA. Specifically the number of replacements was set to 1000, and the replacement type was set to phenotype.
Cell culture and transfection
Human ovarian cancer cell lines (SKOV3 and KGN) were purchased from the American Type Culture Collection (ATCC, VA, USA). Dulbecco’s modified Eagle’s medium (DMEM) containing 10% (v/v) foetal bovine serum (FBS; Gibco, Invitrogen, Carlsbad, CA, USA) and 1% penicillin/streptomycin (GIBCO, CA, USA) growth media was used to culture SKOV3 and KGN cells. All cells were incubated at 37 °C and 5% CO2. OGN overexpression and empty vector plasmids were purchased from GeneCopoeia Biotechnology (GeneCopoeia Biotechnology, MD, USA). For transient cell transfection, SKOV3 and KGN cells were seeded in 6-well plates for 24 h. After incubation, cells were transfected with 3 μg empty vector and 3 μg OGN overexpression plasmid using Lipofectamine 3000 (Invitrogen, Carlsbad, CA, USA) according to the protocol to establish a cell line with upregulated OGN expression.
qRT–PCR analysis
Total RNA was extracted by TRIzol (Invitrogen, CA, USA) according to the manufacturer’s instructions. cDNA was produced using a reverse transcription kit (TaKaRa, Dalian, China). PCR was performed using an ABI 7500 fast system (Applied Biosystems, CA, USA). Primer sequences were as follows: OGN Forward, 5´-TCTACACTTCTCCTGTTACTGCT-3´; OGN Reverse, 5´-GAGGTAATGGTGTTAT TGCCTCA-3´.
Immunofluorescence
The immunofluorescence assays were performed with anti-FSHR (Abcam, 1:300) according to the manufacturer’s protocol. The primary antibody used in this study was against FSHR (ab113421). The cells were incubated with the corresponding FITC-conjugated secondary antibodies (Abcam, 1:200). Two hours later, 0.1% DAPI was used to stain the nucleus for 30 min. Images were detected by confocal microscopy (Leica, Jena, Germany).
Statistical analysis
All statistical analyses were performed in the R language (Version 3.6). All statistical tests were bilateral, and P < 0.05 was considered statistically significant.
Results
Identification of 128 common significant differentially expressed genes (DEGs) in PCOS and OC
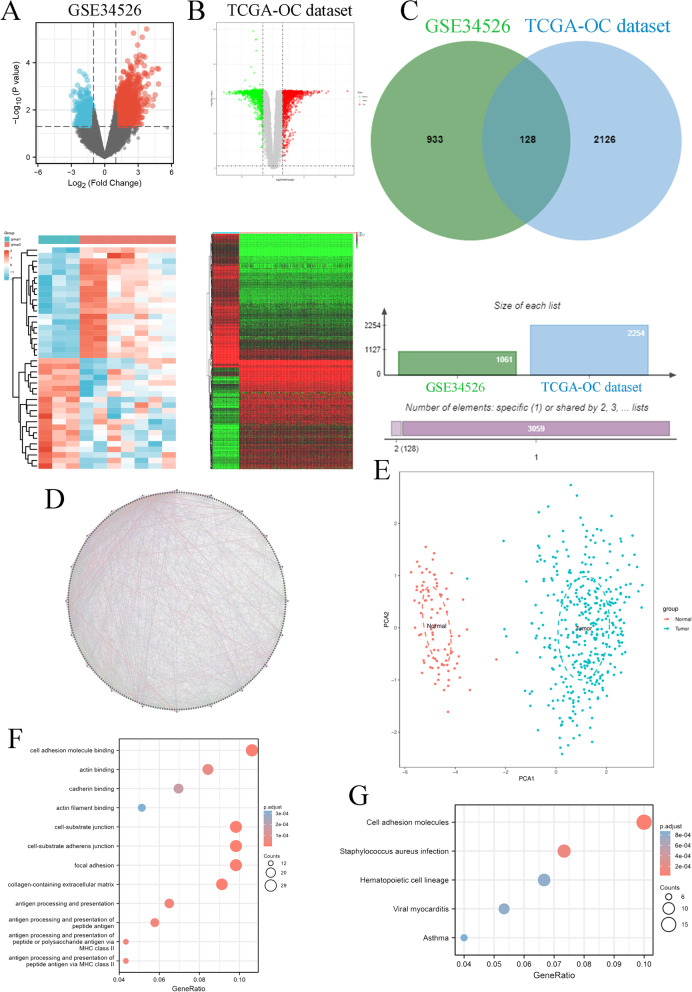
First, we found 1061 DEGs in the PCOS patients compared to normal women based on the GSE34526 dataset of the GEO database and 2254 DEGs in the OC patient samples compared to normal ovary samples based on the OC dataset of the TCGA database (Fig. 1A&B). Moreover, we found 128 common DEGs in PCOS and OC progression (Fig. 1C). We also constructed a protein–protein interaction (PPI) network to identify all 120 genes in the PCOS and OC datasets. These networks were visualized using the GeneMANIA database (Fig. 1D), which revealed that these genes have close interactions. PCA found that the expression of these DEGs could well discriminate between ovarian cancer (blue) and normal (red) tissues (Fig. 1E). We extracted GO and KEGG pathway data for these genes based on the DAVID database. Regarding GO enrichment terms, these genes were enriched in cell adhesion molecule binding, actin binding, cadherin binding, actin filament binding, cell-substrate junction, cell-substrate adherens junction, focal adhesion, collagen-containing extracellular matrix, and antigen processing and presentation (Fig. 1F). Regarding KEGG enrichment terms, these genes were enriched in cell adhesion molecules, Staphylococcus aureus infection, haematopoietic cell lineage, viral myocarditis, and asthma (Fig. 1G). In summary, these results indicated that common DEGs highlighted the significant role of cell adhesion in the relationship between PCOS and OC.
Fig. 1.
Identification of DEGs associated with PCOS and OC. A The DEGs in PCOS based on GSE34526 datasets. B The DEGs in OC based on TCGA-OC datasets. C The common DEGs in PCOS and OC. D The PPI network of 128 common DEGs in PCOS and OC. E The PCA between OC patient samples (TCGA-OC dataset) and normal ovary samples (GTEx-ovary datasets) based on 128 DEGs. F GO functional enrichment analysis for 128 DEGs. G KEGG enrichment analysis for 128 DEGs
Evaluation of clinical outcomes in OC based on the 128 common DEGs
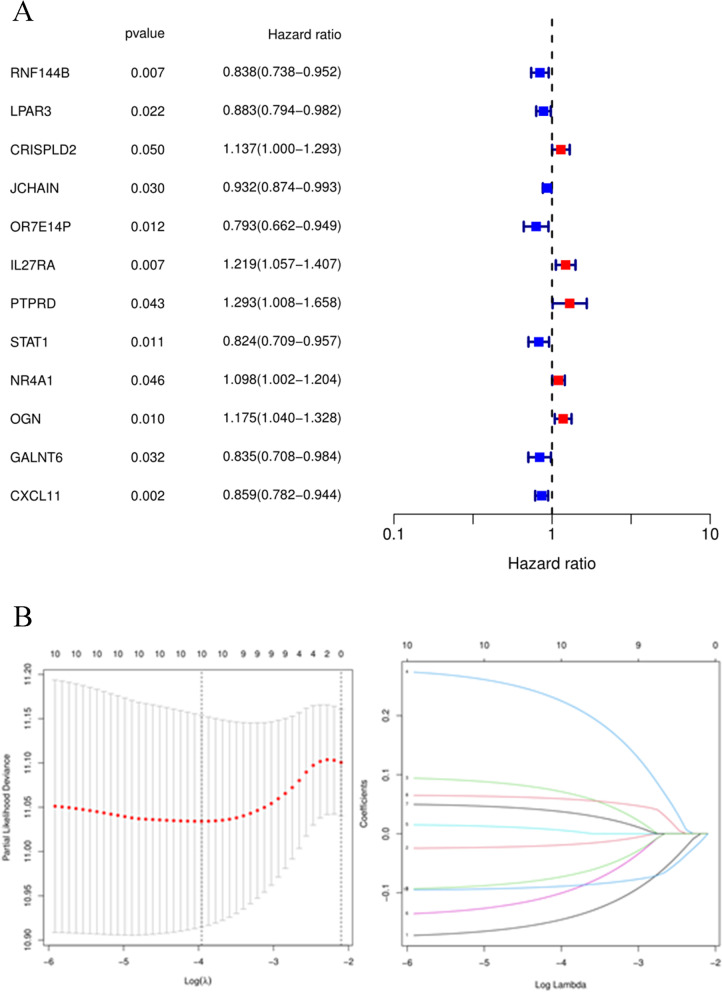
The 128 common DEGs were used to analyse the prognosis in OC patients based on the univariate Cox method. A total of twelve key genes were closely associated with the prognosis of OC patients: RNF144B, LPAR3, CRISPLD2, JCHAIN, OR7E14P, IL27RA, PTPRD, STAT1, NR4A1, OGN, GALNT6 and CXCL11 (Fig. 2A). Then, we used these expression profiles to construct the prognostic model. The following risk score formula was developed: Risk score = RNF144B*(-0.1441) + LPAR3*(-0.0187) + CRISPLD2*0.0701 + IL27RA*0.2226 + PTPRD*0.0055 + STAT1*(-0.0988) + NR4A1*0.0369 + OGN*0.0590 + GALNT6*(-0.0718) + CXCL11*(-0.0886). Next, we divided these OC patients into high-risk and low-risk groups with the median risk score based on the risk score formula (Fig. 2B).
Fig. 2.
Key gene prognostic values. A Prognostic values of 12 genes based on forest plots. B Prognostic signature construction based on LASSO Cox analysis
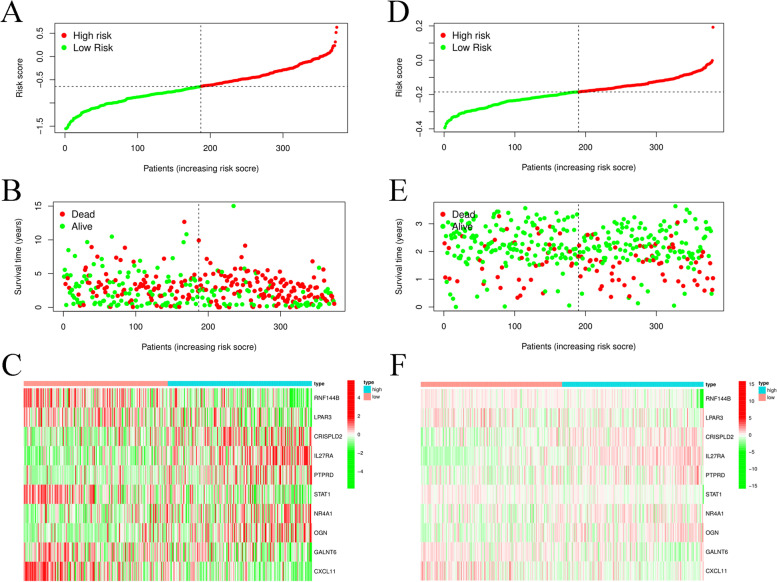
The survival score and status of the two groups in the training cohort based on TCGA database OC datasets are shown in Fig. 3A&B. These twelve key gene expression profiles are shown in the heatmap (Fig. 3C). Moreover, we used the GSE140082 dataset as a test cohort to validate the risk score formula, and the survival score and status of the high-risk and low-risk groups are shown in Fig. 3D&E. These key gene expression files in the GSE140082 dataset were also visualized by a heatmap (Fig. 3F).
Fig. 3.
12 Prognostic index of OC patients. A The PI distribution of patients in the training dataset. B OC patient survival in the training dataset. C The expression profiles of 12 key genes in the training dataset. D The PI distribution of patients in the test dataset. E.OC patient survival in the test dataset. F The expression profiles of 12 key genes in the test dataset
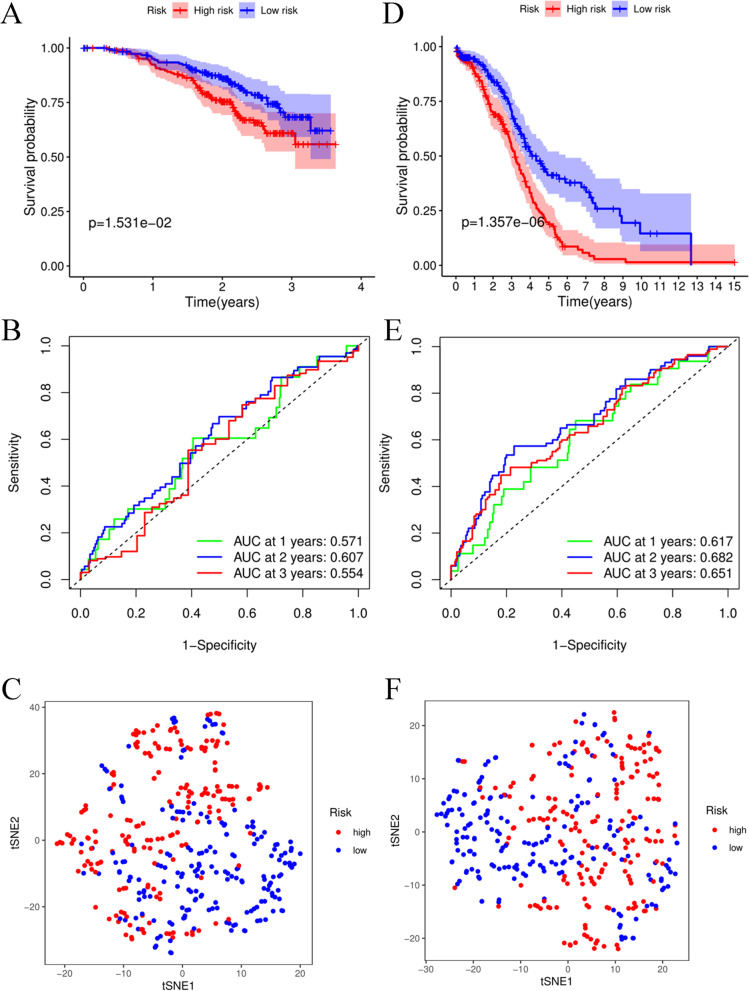
In the training cohort, the survival time and rate were significantly decreased as the risk score increased (Fig. 4A). The AUCs at 1, 2, and 3 years under the ROC curve were 0.571, 0.607, and 0.554, respectively, indicating that a moderate incubation period could be utilized as a prognostic marker of twelve key gene expression profiles in survival monitoring (Fig. 4B). However, t-SNE analysis showed that OC patients in different risk groups were not distributed in the two groups based on the TCGA database (Fig. 4C). To validate the efficiency of the prognostic model constructed from the TCGA-OC cohort, we used the median value of the training cohort to divide the OC patients from the GSE140082 cohort into high-risk and low-risk groups. Similar to the results of the training cohort, OC patients with high risk had a poor prognosis compared to other OC patients in the low-risk group (Fig. 4D). The AUC values at 1, 2, and 3 years were 0.617, 0.682, and 0.651, respectively, in the test cohort (Fig. 4E). In addition, t-SNE analysis results were similar to those noted for the training cohort (Fig. 4F), suggesting that the 12-gene signature could not be diagnostic markers for OC patients.
Fig. 4.
Prognostic analysis of the 12-gene signature model in the training cohort and test cohort. A Kaplan–Meier curves for the OS of patients in the high- and low-risk groups in the training cohort. B AUC time-dependent ROC curves for OS in the training cohort. C t-SNE analysis for OS in the training cohort. D Kaplan–Meier curves for the OS of patients in the high- and low-risk groups in the test cohort. E AUC time-dependent ROC curves for OS in the test cohort. F t-SNE analysis for OS in the test cohort
The ectopic expression and prognostic significance of the 12-gene signature in OC patients
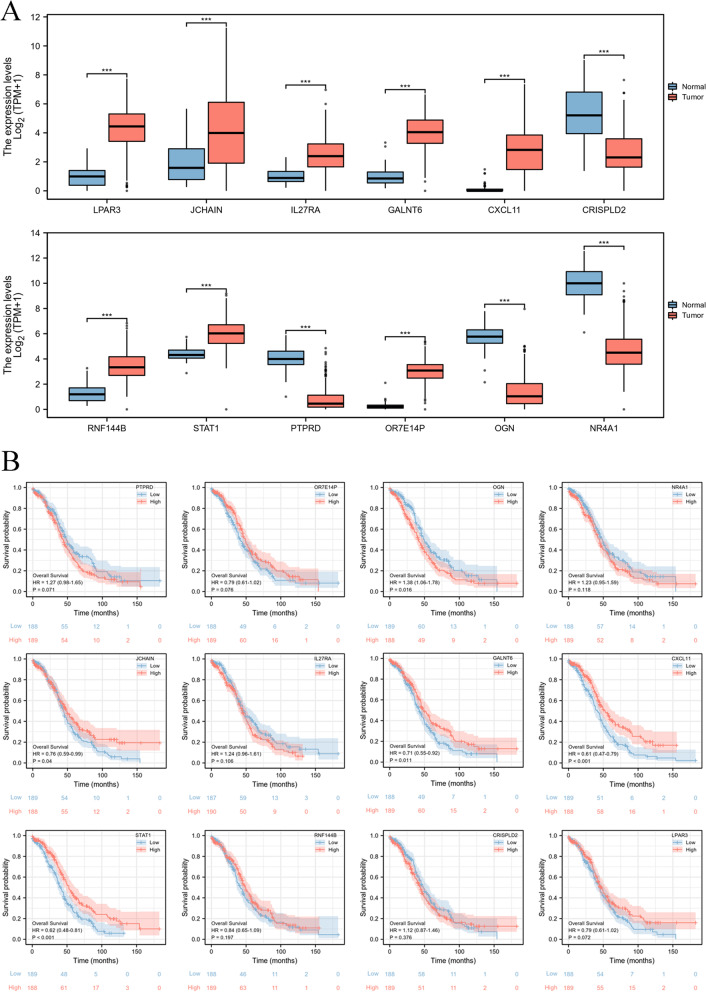
Next, we used a boxplot to visualize the mRNA levels of the 12-gene signature in OC samples, indicating that LPAR3, JCHAIN, IL27RA, GALNT6, CXCL11, RNF144B, STAT1, and OR7E14P were significantly increased in OC patients, but CRISPLD2, PTPRD, OGN, and NR4A1 were obviously decreased in OC patients (Fig. 5A). We also confirmed the overall survival rate of the 12-gene signature in OC patients from TCGA database. The results suggested that OGN was significantly and negatively correlated with OC patient prognosis, but JCHAIN, GALNT6, CXCL11, and STAT1 were significantly and positively correlated with OC patient prognosis (Fig. 5B). These results suggested that JCHAIN, GALNT6, CXCL11, STAT1, and OGN might play a key role in OC patient progression.
Fig. 5.
The expression and prognostic significance of the 12-gene signature. A The mRNA expression of the 12-gene signature based on TCGA database. B The prognostic significance of the 12-gene signature based on the TCGA database
DNA alteration and immune infiltration of 5 key genes in OC progression
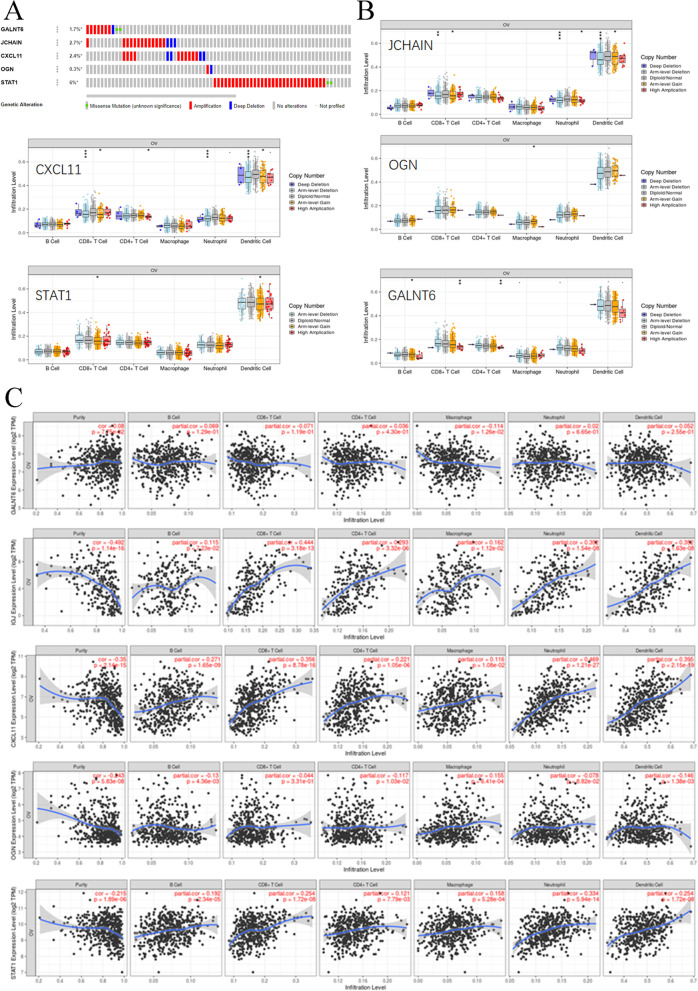
In Fig. 1F, we found that these common DEGs correlated with PCOS and OC and were significantly correlated with antigen processing and presentation, antigen processing and presentation of peptide antigens, antigen processing and presentation of peptide or polysaccharide antigens via MHC class II, and antigen processing and presentation of peptide antigens via MHC class II. These findings indicated that immune infiltration was closely associated with OC progression. We found that the 5 genes harboured genetic alterations, such as missense mutations, amplifications and deep deletions (Fig. 6A). Copy number variants (CNVs) of JCHAIN were significantly correlated with CD8 + T cells, neutrophils, and dendritic cells. CXCL11 CNVs were closely associated with CD8 + T cells, CD4 + T cells, neutrophils, and dendritic cells. The CNV level of OGN was markedly related to macrophages. STAT1 CNV levels were closely related to CD8 + T cells and dendritic cells. CNVs of GALNT6 were significantly associated with B cells, CD8 + T cells and CD4 + T cells (Fig. 6B). Furthermore, we found that GALNT6 mRNA expression was not obviously correlated with immune infiltration in any immune cell type. JCHAIN levels were closely associated with purity, CD8 + T cells, CD4 + T cells, neutrophils, and dendritic cells. CXCL11 expression was correlated with the infiltration of purity, B cells, CD8 + T cells, CD4 + T cells, neutrophils, and dendritic cells. The OGN level was significantly correlated with purity. STAT1 mRNA levels were closely related to purity, CD8 + T cells, neutrophils, and dendritic cells (Fig. 6C). Taken together, the expression and alteration of these 5 key genes were involved in the immune infiltration progression of OC.
Fig. 6.
DNA alterations in and immune infiltration associated with 5 key genes. A DNA alterations in 5 key genes. B CNVs of the 5 genes. C Cancer purity and immune infiltration associated with 5 key genes
Drug sensitivity analysis of the hub genes
We further used drug sensitivity analysis to confirm these 5 key genes. The results showed that OGN was closely correlated with chemotherapy resistance based on the GSCALite database (Supplementary Fig. S1). Therefore, OGN could represent a potential target in the treatment of OC or PCOS patients.
The characteristics of OGN in OC and PCOS
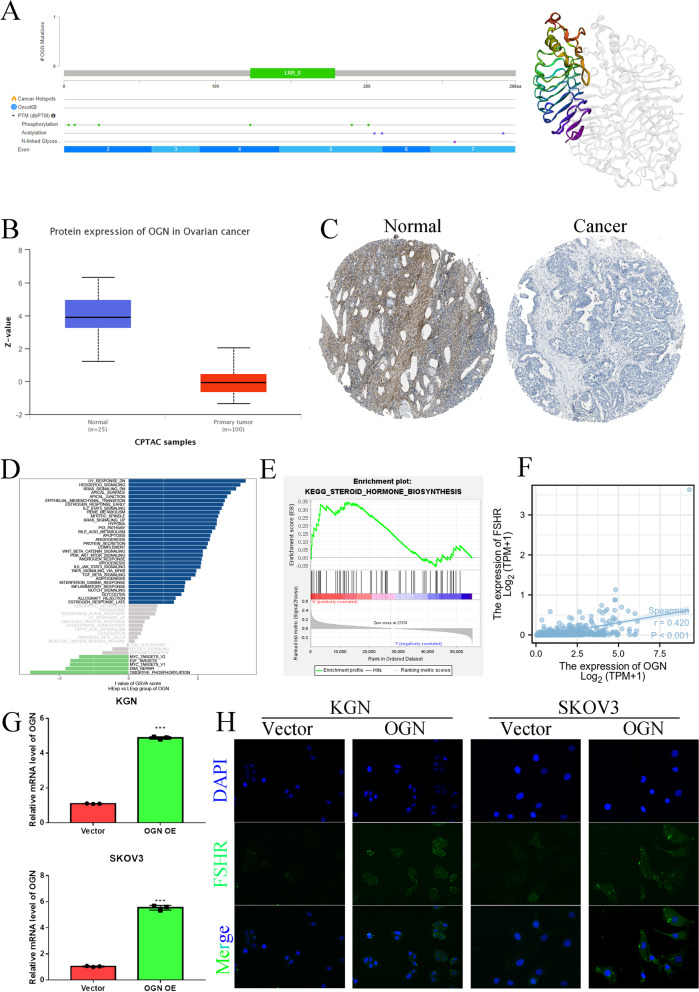
To elucidate the expression, function and structure of OGN, we used the PDB database to confirm the OGN structure, as shown in Fig. 7A. OGN has an LRR_8 domain and multiple phosphorylation, acetylation and N-linked glycosylation sites. OGN protein expression was significantly decreased in OC tissue samples compared to normal ovary samples (Fig. 7B&C). We further utilized GSVA and GSEA to predict the potential function of OGN, as shown in Fig. 7D&E. OGN might be involved in steroid hormone biosynthesis and the steroid hormone response. Furthermore, we found that OGN levels were significantly and positively correlated with the level of FSHR in OC (Fig. 7F). We overexpressed OGN in KGN and SKOV3 cell lines (Fig. 7G) and confirmed the effect of OGN on FSHR expression by IF (Fig. 7H). In a previous study, an FSHR inhibitor restrained OC carcinogenesis by inhibiting the expression levels of FSHR, which has definite oncogenic potential and is a probable candidate for oncogenesis [25]. However, FSHR inhibitors can trigger a PCOS-like state [26]. These results suggested that the OGN/FSHR axis might play a dual role in the progression of OC or PCOS.
Fig. 7.
OGN structure, expression and function. A OGN structure. B OGN protein expression in OC based on the CPTAC database. C OGN protein expression in OC based on the HPA database. D GSVA analysis of OGN. E GSEA for OGN. F OGN and FSHR correlation analysis in TCGA-OC dataset. G The mRNA levels in vector- and OGN-overexpressing KGN and SKOV3 cells. H The effect of OGN on FSHR as assessed by immunofluorescence
OGN levels are correlated with regulators of ferroptosis and m6A methylation in OC
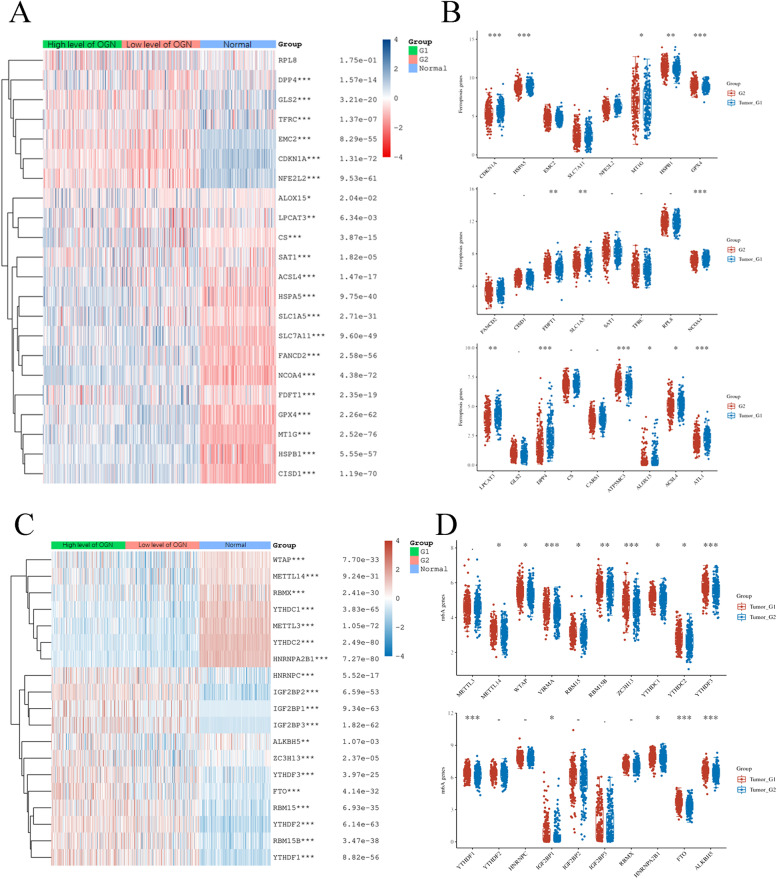
Ferroptosis and m6A methylation are involved in the development and progression of OC. We first used the TCGA database to analyse whether OGN levels are correlated with ferroptosis. We performed a correlation analysis between OGN expression and 25 ferroptosis genes in OC and ovarian tissue samples based on TCGA and GTEx databases (Fig. 8A). The results showed that the expression of 25 ferroptosis genes was significantly different between OC and normal ovaries. Furthermore, we also confirmed the correlation of ferroptosis genes with OGN in OC samples. We found that OGN levels were positively correlated with MT1G, HSPB1, GPX4, FDFT1 and ATP5MC3 but negatively correlated with CDKN1A, HSPA5, SLC1A5, NCOA4, LPCAT3, DPP4, ALOX15, ACSL4, and ATL1 (Fig. 8B). Then, we extracted the expression profiles for the 20 m6A methylation genes between OC and normal ovary samples based on TCGA and GTEx databases (Fig. 8C). The results indicated that these m6A methylation regulators played a key role in OC progression. We further performed a correlation analysis between these m6A regulators and OGN expression. The results showed that METTL14, WTAP, VIRMA, RBM15, RBM15B, ZC3H13, YTHDC1, YTHDC2, YTHDF3, YTHDF1, IGF2BP2, HNRNPA2B1, FTO, and ALKBH5 were positively and significantly associated with OGN expression in OC patients (Fig. 8D). Taken together, these results suggest that OGN might have another important function in OC ferroptosis and m6A methylation modifications.
Fig. 8.
Association of OGN levels with ferroptosis- and m6A methylation-related genes in OC. A Ferroptosis gene expression in OC with high or low levels of OGN and normal ovaries. B Ferroptosis gene expression in OC with high or low levels of OGN. C m6A methylation gene expression in OC with high or low levels of OGN and normal ovaries. D m6A methylation gene expression in OC with high or low levels of OGN
Discussion
OC is a lethal malignancy in gynaecological diseases and is a complex disease, and multiple metabolic enzymes and pathways are involved in its pathophysiology [27]. PCOS is a benign gynaecological disease with multisystem metabolic disorders that are characterized mainly by HA, IR, LH and FSH ratio imbalance; infertility; endometrial disorder; obesity, and polycystic ovaries [1]. We found that these MRGs, such as ENPP1, FH, CYP2E1, HPGDS, ADCY9, NDUFA5, ADH1B and PYGB, were involved in the development and progression of OC, which could be used to construct a prognostic model to predict the postoperative risk for OC patients [17]. Zhou et al. also supported this view, and they found that PYGB could promote the development of OC by activating the Wnt/β-catenin signalling pathway [28]. Moreover, many studies have suggested that alternative AR activating signals, including both ligand-dependent and ligand-independent signals, are involved in OC progression [29, 30]. Therefore, the underlying pathophysiological association between PCOS and OC might be a key mechanism to target to formulate a clinical treatment strategy for OC or PCOS.
In this study, we found 128 shared DEGs between PCOS and OC compared to corresponding normal tissue samples. These 128 genes were significantly enriched in cell adhesion molecule binding via GO and KEGG analysis. Twelve genes, including RNF144B, LPAR3, CRISPLD2, JCHAIN, OR7E14P, IL27RA, PTPRD, STAT1, NR4A1, OGN, GALNT6, and CXCL11, were validated as key genes related to the prognosis of OC patients. A prognostic score based on the twelve genes obviously classified OC patients into high-risk and low-risk groups. Moreover, we found that the high-risk group had a poor prognosis compared to the low-risk group. Given the underlying molecular mechanisms of these MRGs, studies on the functions and mechanisms of RNF144B, JCHAIN, OR7E14P, IL27RA, PTPRD, and OGN have not been confirmed in OC progression. However, an additional six genes have been elucidated in OC development: LPAR3, CRISPLD2, STAT1, NR4A1, GALNT6, and CXCL11. LPAR3 expression is significantly increased in OC tissue samples compared to normal ovary tissue samples, and this gene might play a role in the carcinogenesis of ovarian cancer [31]. High CRISPLD2 expression was correlated with worse prognosis in OC patients [32]. High STAT1 levels were associated with improved prognosis in OC patients, and this information might be useful for the development of new immunomodulatory drugs for OC treatment [33]. Ectopic expression of NR4A1 protein was significantly correlated with poor prognosis in OC patients [34], potentially modulating platinum resistance in OC [35]. GALNT6 could modify O-glycans on EGFR to increase its activation, which was able to significantly enhance OC cell viability, migration, and invasion [36]. Many studies have indicated that CXCL11 promotes OC progression by mediating angiogenesis [37], lymph node metastasis [38], and immune infiltration [39, 40]. Moreover, RNF144B, JCHAIN, OR7E14P, IL27RA, PTPRD, OGN, CRISPLD2, and GALNT6 have not been confirmed in PCOS progression. STAT1 interacts with the CD44-OPN adhesion complex, ERα, and NF-κB to formulate significant crosstalk, resulting in the modulation of endometrial receptivity [41]. Insulin enhances STAT1 and STAT3 expression to repress the levels of miR-27a-3p, which could decrease granule cell proliferation and apoptosis escape [42]. High androgen levels could mediate a series of important genes, including TFAP2A, ETS1, ELK1, ERG, FLI1 and SPI1, to increase NR4A1 levels in PCOS [43]. CXCL11 expression was significantly and obviously correlated with prolactin and 17-OH-progesterone levels in PCOS [44]. Based on previous studies and our study, we were able to obtain only limited information about the 12 key genes involved in OC patient survival and pathophysiological changes in PCOS patients.
To seek efficient therapeutic agents for the treatment of OC and PCOS, we further screened these 12 key genes based on expression, survival significance, immune infiltration, and drug sensitivity. Osteoglycin (OGN), a small proteoglycan with tandem leucine-rich repeats (LRR), is overexpressed in blood vessels and bone, modulating bone formation mediated by transforming growth factor beta [45]. OGN is involved in the progression of extracellular matrix and remodelling and tissue development [45, 46]. Katja Hummitzsch et al. found that OGN mRNA expression was significantly upregulated in the internal ovary theca compared to the stroma [47]. Hao and his colleagues further found that OGN protein expression was markedly associated with signalling pathways related to follicular development, especially the oestrogen, insulin, and PI3K-Akt signalling pathways [48]. We found that OGN mRNA and protein expression were significantly decreased in OC/PCOS compared to normal ovary tissues or granule cells from women without PCOS. Taken together, these results indicated that OGN might represent a significant factor in OC and PCOS progression. Furthermore, our GSVA and GSEA showed that highly expressed OGN could also enhance steroid hormone biosynthesis, and correlation analysis indicated that OGN was significantly associated with FSHR levels. Many studies have indicated that FSHR is a significant oncogene in OC development that can mediate cell proliferation [49, 50], metastasis [51], and apoptosis escape [52]. Moreover, FSHR levels are significantly decreased in PCOS granulosa cells compared to normal granulosa cells [53]. FSHR is critical for FSH-mediated follicle growth and development, and a decrease in the FSH/FSHR pathway might induce follicular growth arrest, promoting the progression of PCOS [54, 55]. Therefore, OGN might upregulate FSHR to sensitize the steroid hormone response, which could accelerate OC formation and progression but reverse PCOS progression. Low OGN expression is an important feature from PCOS to OC, indicating that PCOS patients with low levels of OGN may have a greater OC risk. Aberrant OGN activation is associated with high tumour invasiveness and poor prognosis in OC patients [56]. Moreover, the function of OGN in OC progression is closely related to m6A modification and ferroptosis. Ferroptosis is a novel recognized type of cell death induced by iron accumulation, lipid peroxidation and glutathione deprivation, indicating a connection with a variety of disorders and suggesting great potential in OC therapy [57]. The ectopic expression of m6A methylation regulators is involved in OC progression. Specifically, YTHDF1, YTHDF2, IGF2BP1, METTL3, ALKBH5, WTAP, and FZD10 were upregulated, whereas FTO was downregulated [58]. Taken together, these results suggest that OGN might regulate m6A methylation or ferroptosis to promote OC concurrence, development, and progression. In summary, we infer that OGN might represent a new risk marker for PCOS to OC; however, this assumption needs to be verified in further studies.
Conclusions
In conclusion, this study provided evidence about the association between PCOS and OC. Through the functional analysis of identified DEGs, we found that cell adhesion was significantly enriched in the PCOS and OC datasets. We also confirmed 12 key genes to construct a prognostic model that classified OC patients into high-risk and low-risk groups for prognostic prediction. Moreover, we found that OGN might represent a key biomarker, indicating a greater OC risk in PCOS patients. Nevertheless, further experimental verification is required.
Supplementary Information
Acknowledgements
Not applicable.
Abbreviations
- PCOS
Polycystic ovary syndrome
- HA
Hyperandrogenemia
- IR
Insulin resistance
- LH
Luteinizing hormone
- FSH
Follicle-stimulating hormone
- OC
Ovarian cancer
- TCGA
The Cancer Genome Atlas Gene
- GEO
Expression Omnibus
- EC
Endometrial cancer
- BC
Breast cancer
- MRGs
Metabolism related genes
- PPI
Protein–protein interactions
- OGN
Osteoglycin
Authors’ contributions
Conception and design: Yukun Li, Juan Zou and Nianchun Liao. Collection and assembly of data: Jue Liu, Qunfeng Zhang, and Jiao Xiao. Data analysis and interpretation: Yanhua Chen, Mengjie Wang, Kexin Chen, and Min Luo. Manuscript writing: Yukun Li and Juan Zou. Paper revision: Juan Zeng and Zhongcheng Mo. Final approval of manuscript: all authors.
Funding
The present study was supported by the Hunan Provincial Health Commission 2019 Annual Scientific Research (Grant No. C2019098).The present study was supported by the Hunan Provincial Health Commission 2019 Annual Scientific Research.,C2019098,Juan Zeng
Availability of data and material
The data used to support the findings of this study are available from the corresponding author upon request.
Declarations
Ethics approval and consent to participate
Not applicable.
Consent for publication
Not applicable.
Competing interests
The authors declare that they have no competing interests.
Footnotes
Publisher's Note
Springer Nature remains neutral with regard to jurisdictional claims in published maps and institutional affiliations.
Juan Zou, Yukun Li and Nianchun Liao contributed equally.
Contributor Information
Juan Zeng, Email: 1076006678@qq.com.
Zhongcheng Mo, Email: zhchmo@hotmail.com.
References
- 1.Li Y, et al. Multi-system reproductive metabolic disorder: significance for the pathogenesis and therapy of polycystic ovary syndrome (PCOS) Life Sci. 2019;228:167–175. doi: 10.1016/j.lfs.2019.04.046. [DOI] [PubMed] [Google Scholar]
- 2.Jiao J, et al. Genetic and epigenetic characteristics in ovarian tissues from polycystic ovary syndrome patients with irregular menstruation resemble those of ovarian cancer. BMC Endocr Disord. 2019;19(1):30. doi: 10.1186/s12902-019-0356-5. [DOI] [PMC free article] [PubMed] [Google Scholar]
- 3.Risch HA. Hormonal etiology of epithelial ovarian cancer, with a hypothesis concerning the role of androgens and progesterone. J Natl Cancer Inst. 1998;90(23):1774–1786. doi: 10.1093/jnci/90.23.1774. [DOI] [PubMed] [Google Scholar]
- 4.la Marca A, et al. Insulin-lowering treatment reduces aromatase activity in response to follicle-stimulating hormone in women with polycystic ovary syndrome. Fertil Steril. 2002;78(6):1234–1239. doi: 10.1016/s0015-0282(02)04346-7. [DOI] [PubMed] [Google Scholar]
- 5.Jonard S, Dewailly D. The follicular excess in polycystic ovaries, due to intra-ovarian hyperandrogenism, may be the main culprit for the follicular arrest. Hum Reprod Update. 2004;10(2):107–117. doi: 10.1093/humupd/dmh010. [DOI] [PubMed] [Google Scholar]
- 6.Heemers HV, Verhoeven G, Swinnen JV. Androgen activation of the sterol regulatory element-binding protein pathway: Current insights. Mol Endocrinol. 2006;20(10):2265–2277. doi: 10.1210/me.2005-0479. [DOI] [PubMed] [Google Scholar]
- 7.Holmäng A, Brzezinska Z, Björntorp P. Effects of hyperinsulinemia on muscle fiber composition and capitalization in rats. Diabetes. 1993;42(7):1073–1081. doi: 10.2337/diab.42.7.1073. [DOI] [PubMed] [Google Scholar]
- 8.Ryan KJ, Smith OW. BIOGENESIS OF STEROID HORMONES IN THE HUMAN OVARY. Recent Prog Horm Res. 1965;21:367–409. [PubMed] [Google Scholar]
- 9.Ruan X, et al. Effect of Diane-35, alone or in combination with orlistat or metformin in Chinese polycystic ovary syndrome patients. Arch Gynecol Obstet. 2018;297(6):1557–1563. doi: 10.1007/s00404-018-4762-0. [DOI] [PubMed] [Google Scholar]
- 10.Kollara A, et al. Increased androgen receptor levels and signaling in ovarian cancer cells by VEPH1 associated with suppression of SMAD3 and AKT activation. J Steroid Biochem Mol Biol. 2020;196:p 105498. doi: 10.1016/j.jsbmb.2019.105498. [DOI] [PubMed] [Google Scholar]
- 11.Craig ER, et al. Metabolic risk factors and mechanisms of disease in epithelial ovarian cancer: A review. Gynecol Oncol. 2016;143(3):674–683. doi: 10.1016/j.ygyno.2016.10.005. [DOI] [PMC free article] [PubMed] [Google Scholar]
- 12.Tomczak K, Czerwinska P, Wiznerowicz M. The Cancer Genome Atlas (TCGA): an immeasurable source of knowledge. Contemp Oncol (Pozn) 2015;19(1A):A68–77. doi: 10.5114/wo.2014.47136. [DOI] [PMC free article] [PubMed] [Google Scholar]
- 13.Barrett T, et al. NCBI GEO: archive for functional genomics data sets--update. Nucleic Acids Res. 2013;41:D991–5. doi: 10.1093/nar/gks1193. [DOI] [PMC free article] [PubMed] [Google Scholar]
- 14.Kaur S, et al. Differential gene expression in granulosa cells from polycystic ovary syndrome patients with and without insulin resistance: identification of susceptibility gene sets through network analysis. J Clin Endocrinol Metab. 2012;97(10):E2016–E2021. doi: 10.1210/jc.2011-3441. [DOI] [PMC free article] [PubMed] [Google Scholar]
- 15.Yang D, et al. Identification of Potential Biomarkers of Polycystic Ovary Syndrome via Integrated Bioinformatics Analysis. Reprod Sci. 2021;28(5):1353–1361. doi: 10.1007/s43032-020-00352-x. [DOI] [PubMed] [Google Scholar]
- 16.Yumiceba V, et al. Oncology and Pharmacogenomics Insights in Polycystic Ovary Syndrome: An Integrative Analysis. Front Endocrinol (Lausanne) 2020;11:585130. doi: 10.3389/fendo.2020.585130. [DOI] [PMC free article] [PubMed] [Google Scholar]
- 17.Zhang QF, et al. Identification and validation of a prognostic index based on a metabolic-genomic landscape analysis of ovarian cancer. Biosci Rep. 2020;40(9). [DOI] [PMC free article] [PubMed]
- 18.Yang D, et al. Integrated bioinformatics analysis for the screening of hub genes and therapeutic drugs in ovarian cancer. J Ovarian Res. 2020;13(1):10. doi: 10.1186/s13048-020-0613-2. [DOI] [PMC free article] [PubMed] [Google Scholar]
- 19.The Genotype-Tissue Expression (GTEx) project. Nat Genet. 2013;45(6):580-5. [DOI] [PMC free article] [PubMed]
- 20.Huang da W, B.T. Sherman, R.A. Lempicki. Systematic and integrative analysis of large gene lists using DAVID bioinformatics resources. Nat Protoc. 2009;4(1):p. 44–57. doi: 10.1038/nprot.2008.211. [DOI] [PubMed] [Google Scholar]
- 21.Warde-Farley D, et al. The GeneMANIA prediction server: biological network integration for gene prioritization and predicting gene function. Nucleic Acids Res. 2010;38:W214–20. doi: 10.1093/nar/gkq537. [DOI] [PMC free article] [PubMed] [Google Scholar]
- 22.Pontén F, Jirström K, Uhlen M. The Human Protein Atlas–a tool for pathology. J Pathol. 2008;216(4):387–393. doi: 10.1002/path.2440. [DOI] [PubMed] [Google Scholar]
- 23.Wu P, et al. Integration and Analysis of CPTAC Proteomics Data in the Context of Cancer Genomics in the cBioPortal. Mol Cell Proteomics. 2019;18(9):1893–1898. doi: 10.1074/mcp.TIR119.001673. [DOI] [PMC free article] [PubMed] [Google Scholar]
- 24.Li T, et al. TIMER2.0 for analysis of tumor-infiltrating immune cells. Nucleic Acids Res. 2020;48(W1):W509–w514. doi: 10.1093/nar/gkaa407. [DOI] [PMC free article] [PubMed] [Google Scholar]
- 25.Bose CK. Follicle stimulating hormone receptor in ovarian surface epithelium and epithelial ovarian cancer. Oncol Res. 2008;17(5):231–238. doi: 10.3727/096504008786111383. [DOI] [PubMed] [Google Scholar]
- 26.Waghu FH, et al. FSHR antagonists can trigger a PCOS-like state. Syst Biol Reprod Med. 2021:1–9. [DOI] [PubMed]
- 27.Thuwajit C, et al. The metabolic cross-talk between epithelial cancer cells and stromal fibroblasts in ovarian cancer progression: Autophagy plays a role. Med Res Rev. 2018;38(4):1235–1254. doi: 10.1002/med.21473. [DOI] [PMC free article] [PubMed] [Google Scholar]
- 28.Zhou Y, Jin Z, Wang C. Glycogen phosphorylase B promotes ovarian cancer progression via Wnt/β-catenin signaling and is regulated by miR-133a-3p. Biomed Pharmacother. 2019;120:109449. doi: 10.1016/j.biopha.2019.109449. [DOI] [PubMed] [Google Scholar]
- 29.Chung W.M., et al. Androgen/Androgen Receptor Signaling in Ovarian Cancer: Molecular Regulation and Therapeutic Potentials. Int J Mol Sci. 2021;22(14):7748. doi: 10.3390/ijms22147748. [DOI] [PMC free article] [PubMed] [Google Scholar]
- 30.Ling K, et al. Nanog interaction with the androgen receptor signaling axis induce ovarian cancer stem cell regulation: studies based on the CRISPR/Cas9 system. J Ovarian Res. 2018;11(1):36. doi: 10.1186/s13048-018-0403-2. [DOI] [PMC free article] [PubMed] [Google Scholar]
- 31.Yu X, Zhang Y, Chen H. LPA receptor 1 mediates LPA-induced ovarian cancer metastasis: an in vitro and in vivo study. BMC Cancer. 2016;16(1):846. doi: 10.1186/s12885-016-2865-1. [DOI] [PMC free article] [PubMed] [Google Scholar]
- 32.Chen J, et al. Identification of four hub genes as promising biomarkers to evaluate the prognosis of ovarian cancer in silico. Cancer Cell Int. 2020;20:270. doi: 10.1186/s12935-020-01361-1. [DOI] [PMC free article] [PubMed] [Google Scholar]
- 33.Josahkian JA, et al. Increased STAT1 Expression in High Grade Serous Ovarian Cancer Is Associated With a Better Outcome. Int J Gynecol Cancer. 2018;28(3):459–465. doi: 10.1097/IGC.0000000000001193. [DOI] [PubMed] [Google Scholar]
- 34.Delgado E, et al. High expression of orphan nuclear receptor NR4A1 in a subset of ovarian tumors with worse outcome. Gynecol Oncol. 2016;141(2):348–356. doi: 10.1016/j.ygyno.2016.02.030. [DOI] [PMC free article] [PubMed] [Google Scholar]
- 35.Wilson AJ, et al. TR3 modulates platinum resistance in ovarian cancer. Cancer Res. 2013;73(15):4758–4769. doi: 10.1158/0008-5472.CAN-12-4560. [DOI] [PMC free article] [PubMed] [Google Scholar]
- 36.Lin TC, et al. GALNT6 expression enhances aggressive phenotypes of ovarian cancer cells by regulating EGFR activity. Oncotarget. 2017;8(26):42588–42601. doi: 10.18632/oncotarget.16585. [DOI] [PMC free article] [PubMed] [Google Scholar]
- 37.Koo YJ, et al. CXCL11 mediates TWIST1-induced angiogenesis in epithelial ovarian cancer. Tumour Biol. 2017;39(5):1010428317706226. doi: 10.1177/1010428317706226. [DOI] [PubMed] [Google Scholar]
- 38.Lau TS, et al. Cancer cell-derived lymphotoxin mediates reciprocal tumour-stromal interactions in human ovarian cancer by inducing CXCL11 in fibroblasts. J Pathol. 2014;232(1):43–56. doi: 10.1002/path.4258. [DOI] [PubMed] [Google Scholar]
- 39.Yan S, et al. Comprehensive analysis of prognostic gene signatures based on immune infiltration of ovarian cancer. BMC Cancer. 2020;20(1):1205. doi: 10.1186/s12885-020-07695-3. [DOI] [PMC free article] [PubMed] [Google Scholar]
- 40.Budczies J, et al. Chromosome 9p copy number gains involving PD-L1 are associated with a specific proliferation and immune-modulating gene expression program active across major cancer types. BMC Med Genomics. 2017;10(1):74. doi: 10.1186/s12920-017-0308-8. [DOI] [PMC free article] [PubMed] [Google Scholar]
- 41.Paravati R, et al. Differential regulation of osteopontin and CD44 correlates with infertility status in PCOS patients. J Mol Med (Berl) 2020;98(12):1713–1725. doi: 10.1007/s00109-020-01985-w. [DOI] [PMC free article] [PubMed] [Google Scholar]
- 42.Wang M, et al. Functional Characterization of MicroRNA-27a-3p Expression in Human Polycystic Ovary Syndrome. Endocrinology. 2018;159(1):297–309. doi: 10.1210/en.2017-00219. [DOI] [PubMed] [Google Scholar]
- 43.Song J, et al. Androgen upregulates NR4A1 via the TFAP2A and ETS signaling networks. Int J Biochem Cell Biol. 2019;113:1–7. doi: 10.1016/j.biocel.2019.05.015. [DOI] [PubMed] [Google Scholar]
- 44.Hatziagelaki E, et al. Association between Biomarkers of Low-grade Inflammation and Sex Hormones in Women with Polycystic Ovary Syndrome. Exp Clin Endocrinol Diabetes. 2020;128(11):723–730. doi: 10.1055/a-0992-9114. [DOI] [PubMed] [Google Scholar]
- 45.Fernández B, et al. Osteoglycin expression and localization in rabbit tissues and atherosclerotic plaques. Mol Cell Biochem. 2003;246(1–2):3–11. [PubMed] [Google Scholar]
- 46.Hu X, et al. Osteoglycin-induced VEGF Inhibition Enhances T Lymphocytes Infiltrating in Colorectal Cancer. EBioMedicine. 2018;34:35–45. doi: 10.1016/j.ebiom.2018.07.021. [DOI] [PMC free article] [PubMed] [Google Scholar]
- 47.Hummitzsch K, et al. Transcriptome analyses of ovarian stroma: tunica albuginea, interstitium and theca interna. Reproduction. 2019;157(6):545–565. doi: 10.1530/REP-18-0323. [DOI] [PubMed] [Google Scholar]
- 48.Hao Q, et al. Proteomic characterization of bovine granulosa cells in dominant and subordinate follicles. Hereditas. 2019;156:21. doi: 10.1186/s41065-019-0097-5. [DOI] [PMC free article] [PubMed] [Google Scholar]
- 49.Song K, et al. Follicle-stimulating hormone promotes the proliferation of epithelial ovarian cancer cells by activating sphingosine kinase. Sci Rep. 2020;10(1):13834. doi: 10.1038/s41598-020-70896-0. [DOI] [PMC free article] [PubMed] [Google Scholar]
- 50.Chen J, et al. Gankyrin facilitates follicle-stimulating hormone-driven ovarian cancer cell proliferation through the PI3K/AKT/HIF-1α/cyclin D1 pathway. Oncogene. 2016;35(19):2506–2517. doi: 10.1038/onc.2015.316. [DOI] [PubMed] [Google Scholar]
- 51.Liu L, et al. OCT4 mediates FSH-induced epithelial-mesenchymal transition and invasion through the ERK1/2 signaling pathway in epithelial ovarian cancer. Biochem Biophys Res Commun. 2015;461(3):525–532. doi: 10.1016/j.bbrc.2015.04.061. [DOI] [PubMed] [Google Scholar]
- 52.Du X, et al. TGF-β signaling controls FSHR signaling-reduced ovarian granulosa cell apoptosis through the SMAD4/miR-143 axis. Cell Death Dis. 2016;7(11):e2476. doi: 10.1038/cddis.2016.379. [DOI] [PMC free article] [PubMed] [Google Scholar]
- 53.Owens LA, et al. Gene Expression in Granulosa Cells From Small Antral Follicles From Women With or Without Polycystic Ovaries. J Clin Endocrinol Metab. 2019;104(12):6182–6192. doi: 10.1210/jc.2019-00780. [DOI] [PMC free article] [PubMed] [Google Scholar]
- 54.Vendola KA, et al. Androgens stimulate early stages of follicular growth in the primate ovary. J Clin Invest. 1998;101(12):2622–2629. doi: 10.1172/JCI2081. [DOI] [PMC free article] [PubMed] [Google Scholar]
- 55.Laird M, et al. Androgen Stimulates Growth of Mouse Preantral Follicles In Vitro: Interaction With Follicle-Stimulating Hormone and With Growth Factors of the TGFβ Superfamily. Endocrinology. 2017;158(4):920–935. doi: 10.1210/en.2016-1538. [DOI] [PMC free article] [PubMed] [Google Scholar]
- 56.Chen H, Yang L, Sun W. Elevated OGN expression correlates with the EMT signature and poor prognosis in ovarian carcinoma. Int J Clin Exp Pathol. 2019;12(2):584–589. [PMC free article] [PubMed] [Google Scholar]
- 57.Li L, et al. Ferroptosis in Ovarian Cancer: A Novel Therapeutic Strategy. Front Oncol. 2021;11:665945. doi: 10.3389/fonc.2021.665945. [DOI] [PMC free article] [PubMed] [Google Scholar]
- 58.Chang LL, et al. Emerging role of m6A methylation modification in ovarian cancer. Cancer Cell Int. 2021;21(1):663. doi: 10.1186/s12935-021-02371-3. [DOI] [PMC free article] [PubMed] [Google Scholar]
Associated Data
This section collects any data citations, data availability statements, or supplementary materials included in this article.
Supplementary Materials
Data Availability Statement
The data used to support the findings of this study are available from the corresponding author upon request.


