

Abstract
Black South Africans accounted for 6.2 out of 6.4 million people living with HIV in South Africa in 2012, highlighting extreme racial disparities in HIV infection. These racial disparities are the result of structural and historical factors, specifically, the racist policies which were facilitated by segregation before, during, and after Apartheid. First, we describe the theoretical context of how racist policies and segregation are linked to HIV prevalence. Next, using data from a 2012 national survey of South Africans (SABSSM IV) and Statistics South Africa (StatsSA), we describe the race-specific geospatial distribution of HIV in South Africa, provide empirical evidence for the impact of Apartheid on important risk factors for HIV infection, and describe the relationship between these risk factors and HIV within racial groups. Using multilevel logistic regression, we find that segregation increases the odds of HIV infection among Black South Africans, even after adjusting for many covariates which are sometimes blamed, in place of structural factors, for a higher HIV prevalence in Black South Africans. We found that the estimated odds of infection in the most segregated municipality was 1.95 (95% CI: 1.15, 3.32) times the odds of infection in the least segregated municipality for Black South Africans. In addition to segregation, we also find other covariates to be differentially associated with HIV infection depending on race, such as gender, age, and sexual behavior. We also find that the HIV infection odds ratio comparing Black and Coloured (i.e., multiple ethnic groups with mixed ancestries from Africa, Asia, and Europe) South Africans varies over space. These results continue to build evidence of the influence of structural and historical factors on the modern geospatial and demographic distribution of HIV.
Keywords: HIV/AIDS, Medical Geography, South Africa, Apartheid, Segregation
INTRODUCTION
HIV prevalence among Black South Africans is much higher than in any other racial group. Historical and structural factors drive patterns of disease (Link & Phelan, 1995) and segregation is one such fundamental cause of disease that can be linked to adverse health outcomes (Williams & Collins, 2001). Residential segregation restricts individuals’ residences spatially (Reardon & O’Sullivan, 2004) and racist policies and practices facilitated by racial segregation can have effects that last for generations (McClure, 2019; White & Borrell, 2011; Landrine & Corral, 2009; Charasse-Pouélé & Fournier, 2006). In South Africa, policies before and during the years of Apartheid restricted access to vital resources through residential segregation by race (Feinberg 1993; Clark & Worger, 2016). Thus, an explanation of the distribution of HIV in South Africa demands the use of both spatial methods and race-specific analyses. This study investigates between- and within-race patterns of HIV using a geospatial approach to understand the impact of Apartheid and racist policy on HIV prevalence in post-Apartheid South Africa. We hypothesize that the legacies of Apartheid and racist policy in South Africa continue to shape the distributions of HIV at the nexus of race and space.
BACKGROUND
Racist policy in South Africa
South African Apartheid (1948–1994) was a racist system of subjugation, political exclusion, and material deprivation aided by institutionalized residential segregation by race. However, racist policies existed in South Africa before Apartheid. The Land Act of 1913 prevented Black South Africans outside of Cape Province from buying land outside of specified reserves, beginning the systemic isolation of Black South Africans (Feinberg, 1993). During Apartheid, the Population and Registration Act of 1950 formalized and reinforced a racial caste hierarchy, with White South Africans on top, followed by Asian (including people with ethnic backgrounds from India and other parts of Asia), then Coloured (i.e., multiple ethnic groups with mixed ancestries from Africa, Asia, and Europe), and Black South Africans on the bottom (Clark & Worger, 2016). To work in urban centers, Black South Africans required a pass and could be arrested if they were found without one or if they stayed past curfew. Further, Black and Coloured South Africans received a separate and unequal education and were barred from certain occupations (Clark & Worger, 2016). Through the Group Areas Act of 1950, South Africans were residentially segregated by race; Black South Africans were forced to live in “Bantustans,” which were largely rural areas containing no major economic centers (Clark & Worger, 2016). These racist policies, among others, have had lasting, wide-ranging impacts especially on Black and Coloured South Africans and created the structural foundations for racial disparities in health (Braveman, 2006) which persist today.
Linking racist policy and HIV
The Apartheid-era migrant labor system is key to understanding the legacy of Apartheid on the South African HIV epidemic (Vosloo, 2020). The system of migrant labor ensured a steady supply of cheap labor in the mines and cities by Black South Africans from “Bantustans,” while prohibiting them from permanently settling in what was designated as “Whites only” areas. This system resulted in a migration mode known as circular or oscillating migration, in which men leave behind their partners and families to work in the mines and cities while periodically returning home (Lurie, 2006). Migration is one major structural factor that has contributed to the South African HIV epidemic, both in urban and rural areas (Lurie et al., 2003). South African migrants in 1990, towards the end of the Apartheid era, tended to be at higher risk of HIV (Abdool Karim, 1992). Movement or mobility itself is not a risk factor; it is the conditions and structure of the migration process that makes people vulnerable to HIV infection. Circular or oscillating migration’s role in the spread of HIV is a result of men becoming infected while they are away from home and infecting their rural wives or regular partners when they return (Lurie, 2006). The migration labor system confined men to migrant labor hostels, some of which were later incorporated into black urban townships (Vosloo, 2020).
Access to anti-retroviral therapy is key in controlling HIV, as reducing viral load to undetectable levels essentially eliminates the probability of onward transmission (Cohen et al., 2016; Eisinger, 2019). To achieve this, individuals must be able to physically and financially access healthcare multiple times per year, i.e., healthcare must be relatively close and affordable. During Apartheid, the South African national government delegated responsibility for healthcare in Black areas to the “Bantustans.” Since Apartheid left Black communities with severely limited economic resources, they were unable to adequately fund their own healthcare (Scrubb, 2011). Doctors disproportionately cared for White patients because doctors were disproportionately White. Discrimination in medical training created a situation in 1985 where 88% of doctors were White and only 2.2% and 1.3% were Coloured and Black, respectively, even though over 70% of the population was Black (Baker, 2010). Though the racial distribution of doctors has since become more representative, in 2011, 40% of all South African healthcare professionals still worked solely in the private sector, from which care is cost-prohibitive for low-income South Africans (Baker, 2010; Scrubb, 2011). The consequences of segregation (e.g., greater geographic distance to adequate care) and racist policies (e.g., greater material deprivation) made these private healthcare options inaccessible to many Black and Coloured South Africans (Scrubb, 2011; Kon & Lackman, 2008). Though public healthcare access and HIV treatment are currently free in South Africa, a user fee limited public healthcare access until 1997 and HIV treatment was not free to patients until 2004 (Wilkinson et al., 2019). In 2009–10, affordability constraints on healthcare were still faced by 23% of South Africans, with a disproportionate number of Black South Africans reporting that healthcare was not available, affordable, or acceptable (Burger & Christian, 2020). Since healthcare is free, 73% of those affordability constraints are tied to travel costs (Burger & Christian, 2020). These barriers to healthcare access were a key structural factor that facilitated the spread of HIV and established a widespread, generalized epidemic in Black areas (Coovadia et al., 2009).
Racist policies which limited healthcare access were paired with policies that limited educational and occupational opportunities to maintain poverty in Black and Coloured areas. Poverty is often gendered, caused by the economic exclusion of women and the corresponding expectations for male partners to provide for families. Such dynamics have contributed to an increased frequency of transactional sex, age-disparate partnerships, and unequal power in relationships (Zembe et al., 2013; Hunter, 2007; Stoebenau et al., 2016; Muula, 2008). The link between transactional sex and poverty is a major reason for the disproportionately high rate of HIV infection in young women aged 15–24 (Zembe et al., 2013; Hunter, 2007; Wamoyi et al., 2016; Ranganathan et al., 2016). Alcohol dependency and binge drinking also correlate strongly with poverty and are tied to having unprotected sex, multiple sexual partners, and transactional sex. Therefore, alcohol abuse is a strong indicator of HIV infection (Magni et al., 2015; Norris et al., 2009). Poor mental health can maintain the cycles of poverty and can exacerbate or create substance use issues (Lund et al., 2011; Collins et al., 2006). The cycle continues when upon infection with HIV, the combined stigma of HIV and poverty can be strong enough to dissuade one from pursuing treatment (Tsai et al., 2013). Additionally, depression and stigma can reduce adherence to HIV treatment, which can cause viral loads to rebound and viruses to develop resistance (Collins et al., 2006; Tsai et al., 2013; Chesney et al., 2000).
Racial disparities in HIV
In 2012, an estimated 6.2 out of the 6.4 million South Africans estimated to be living with HIV were Black (Shisana et al., 2012). HIV prevalence increases down the racial hierarchy of Apartheid: 0.3% in White, 0.8% in Asian, 3.1% in Coloured, and 15.0% in Black South Africans (Shisana et al., 2012). Given that the distribution of HIV clearly correlates with the gradient of oppression institutionalized by Apartheid, this study investigates how race and racial segregation are related to patterns of HIV in South Africa. To understand racial disparities in health, structural factors must be considered; a primary focus on behavioral or biological risk factors without acknowledgement of structural factors is insufficient (Masanjala, 2007; McClure, 2020; Decoteau, 2008; Kon & Lackan, 2008).
Geospatial and within-race heterogeneity
The effects of Apartheid were heterogeneous within racial groups due to differences in ethnicities and local factors (Masanjala, 2007). Thus, the race-specific geospatial distributions of post-Apartheid HIV prevalence and the determinants of the observed distribution merit further attention (Jones, 2001; Decoteau, 2008; Hunter, 2007; Kon & Lackan, 2008; Masanjala, 2007; Robins, 2004; Wabiri & Taffa, 2013). In this analysis we measure the segregation which accompanied and facilitated racist policies to ascertain their reach in each geographic area.
DATA AND METHODS
Study design and participants
We use data from the 2012 South African National HIV Prevalence, Incidence, Behaviour and Communication Survey (Shisana et al., 2012; Zuma et al., 2016). The SABSSM survey is a nationally representative population-based cross-sectional survey that evaluates trends in the South African HIV epidemic, conducted every three to five years. Details of the survey methodology are described elsewhere (Zuma et al., 2016).
Our analysis was restricted to survey respondents aged 15 or older (n=30,607). Race was measured in the 2012 SABSSM cross-sectional survey using observer-report of the same pre-specified categories (Black, Coloured, Asian, White, Other) used during the Apartheid era. These racial categories are contested, complex, and biologically irrelevant, however, they do map well to social hierarchy, prejudice, and racial discrimination. In this analysis, individuals categorized as “Other” races were excluded due to small sample size (n=72) and generalizability concerns. Information on specific ethnic categorizations within the “Coloured” category were unavailable, so we were unable to distinguish between them in this analysis. Other covariates included in this analysis from the SABSSM survey were age, sex, male circumcision status, number of lifetime sexual partners, relationship status, level of education completed, employment status, age of first sexual experience (sexual debut), and travel during the last 12 months (yes/no). Travel was defined as being away from one’s usual residence for more than one month.
Municipality-level data and indices
Municipality-level residential segregation by race was calculated using the multigroup information theory index, also known as Theil’s H index. Theil’s H index is a decomposable measure with components representing diversity (also known as entropy) and inequality within a region (Reardon & Firebaugh, 2002; Theil, 1972). Diversity/entropy is defined as the extent to which multiple groups are present in a region and inequality refers to the spatial distribution of multiple groups within the region compared to the overall diversity of the region. The H index has been widely used to measure residential segregation (Bischoff, 2008; Farrell, 2008; Fischer, 2008; Parisi et al., 2011) due to its utility in incorporating more than two population groups and its decomposable properties. In this study, we used Theil’s H index to estimate residential segregation by race at the municipality level and we use the diversity/entropy component of the H index to estimate the racial diversity for each municipality. Formulae for calculating diversity/entropy and segregation are available in the appendix. Using race-specific population data from the 2011 census at the ward and municipality levels from Statistics South Africa (StatsSA), we calculated municipality-level and ward-level diversity/entropy using the specified formulae (2011 Statistics South Africa). Then, we calculated municipality-level segregation by comparing municipality-level diversity and ward-level diversity within that municipality. Segregation values vary between 0, where all wards have the same racial composition as the entire municipality, to 1, where all wards contain only one racial group (Reardon & O’Sullivan, 2004). Diversity has a minimum value of 0 (the area is made up of only one racial group) and an upper limit of 1.39 for the four groups (Black, White, Coloured, Asian), where all groups make up 25% of the population.
The South African Multi-Dimensional Poverty Index (SAMPI) at the municipality level for the year 2011 was also obtained from StatsSA. SAMPI is the product of two terms: the proportion of the population that is multidimensionally poor and the average deprivation each person experiences, which is calculated using indicators from four categories: education, health, standard of living, and economic activity (Fransman & Yu, 2019). SAMPI was converted into tertiles for this analysis.
Analyses
First, we construct a descriptive table, stratified by race and generalized to the South African population, displaying the racial distribution of HIV prevalence and our included covariates. Second, the geographic distribution of racial groups throughout South Africa was visually compared to maps of measures of poverty, segregation, and diversity. To condense municipality-level racial information into one map, a K-means clustering algorithm was implemented to categorize municipalities into four groups based on their racial makeup. K-means clustering is an unsupervised machine learning method which randomly chooses K centroids (K = the number of groups one desires) in an n-dimensional space, where “n” is the number of variables which determine the group characteristics. Third, the percentage makeup of a municipality population that was Black was compared to municipality-level poverty, segregation, and HIV prevalence using scatter plots and locally estimated scatterplot smoothing (LOESS) curves.
Next, a race-standardized map of HIV prevalence in South African municipalities was constructed, using indirect standardization. The indirect standardization method calculates a race-standardized HIV prevalence for each municipality by first calculating the observed number of HIV cases in a municipality divided by the expected number of cases given the racial distribution of the sample and the prevalence of HIV in each race nationally, and second by multiplying the national-level HIV prevalence by this fraction. Within-race differences over space are important as well, thus, the race-specific municipality-level HIV prevalence was also mapped. For these maps, only municipalities with at least 20 samples are shown.
To explore the role of race in determining HIV prevalence over space, a spatially varying odds ratio was calculated using generalized additive models and thin plate regression splines (Wood, 2003). Similar to how one can investigate effect measure modification by allowing the effect of one variable on an outcome to vary between strata of another variable, we allow two-dimensional space to modify the effect of race by fitting two dimensional splines over space for each race and then compute the odds ratio at each point. Confidence limit ratios (CLRs) were also calculated to provide a measure of precision. CLRs are commonly used as a measure of precision for ratio metrics, such as the odds ratio, where a higher CLR indicates lower precision. We decided to censor odds ratio estimates in areas where the associated CLR was greater than five, as these results might be insufficiently precise and visually misleading.
Finally, a logistic regression model was fit to investigate correlates of HIV infection. Separate regressions were run for each race, due to differences in the environments and lived experiences of racial groups due to structural consequences of Apartheid. Only individuals who had had sex were included in the regression, as we are attempting to uncover correlates of sexually transmitted HIV, the predominate mode of HIV transmission in South Africa. All analyses were conducted in R version 3.6.2 (R Core Team, 2019). Covariates included were age, age squared, sex and circumcision status, number of lifetime partners, relationship status, education level, employment status, sexual debut age, travel, SAMPI tertile, segregation index, diversity index, and the enumeration area geography type. The functional forms of these covariates were assessed through bivariate analyses before the regression was fit, and linear, second-degree polynomial, and restricted cubic spline forms were considered. Missing data were dealt with through complete case analysis. To account for the complex survey design, the svyglm() function from the survey package was used to add inverse-probability-of-sampling weights to the regression according to the survey design, potentially also addressing bias due to complete case analysis. As part of the sampling design, correlations within enumeration areas were accounted for but correlations within municipalities were not. Since we use municipality-level variables, like segregation, we did a sensitivity analysis with a mixed logistic regression model with random intercepts for both enumeration area and municipality, with the same weights used in svyglm().
Survey Weights
Survey weights were used in all aspects of this analysis. Weights provided with the dataset could be used to generalize results to the national or province level, for all survey participants and for all survey participants who received an HIV test, however, we were interested in calculating the HIV prevalence among only those 15 years or older. Additionally, in our municipality prevalence maps, we had to estimate prevalence at that geographic level. Further, in our regression models, we needed to restrict to individuals 15 years or older and a single race, conditional upon at least one sexual experience, and account for complete case analysis (individuals would not be included if they had any missing data in relevant covariates). For these two situations, we calculated new weights for the relevant subset of the survey participants using the survey package in R, accounting for the original survey design (Lumley, 2020).
RESULTS
Characteristics of study participants
Table 1 displays the prevalence of HIV and the characteristics of the South African population (aged 15 years or older), stratified by racial classification. HIV prevalence was highest in Black South Africans (20.54%), followed by Coloured (4.06%), Asian (0.90%), and White South Africans (0.37%). The distributions of measured covariates varied greatly between races. For example, Black South Africans were the youngest (median: 32), followed closely by Coloured South Africans (36) and Asian South Africans (37), while White South Africans (46) were older. Male circumcision was more common in Black South Africans than other racial groups and White and Asian South Africans were most likely to be married and employed. Black South Africans lived in poorer, more rural, less diverse municipalities than other groups. A few cells in the sample used to estimate these distributions had very small counts (less than 20): White South Africans with an education Grade 0–7 (n=12), White South Africans in urban informal areas (n=0), Asian South Africans in rural (n=9) or urban informal (n=1) areas, and Asian South Africans with a sexual debut age of less than 15 (n=13). Cell counts were below 20 for all races besides Black South Africans for “Other” relationships. Most importantly, only 7 sampled White South Africans and 33 sampled Asian South Africans were HIV positive.
Table 1:
Characteristics of South African Population Aged 15 Years or Older, Stratified by Race
| Black | Coloured | Asian | White | Total | |
|---|---|---|---|---|---|
| Estimated Total Population, Millions (95% CI) | 28.59 (25.81, 31.37) | 3.41 (2.95, 3.86) | 1.02 (0.82, 1.23) | 3.79 (3.19, 4.39) | 36.82 (34.12, 39.51) |
| HIV Prevalence (95% CI) | 20.54% (19.21%, 21.92%) | 4.06% (2.93%, 5.60%) | 0.90% (0.49%, 1.65%) | 0.37% (0.13%, 1.03%) | 16.39% (15.20%, 17.64%) |
| Median Age (IQR) | 32 (23, 45) | 36 (24, 48) | 37 (26, 51) | 46 (30, 59) | 34 (23, 47) |
| Percent Female (95% CI) | 52.69% (51.45%, 53.93%) | 52.78% (50.47%, 55.09%) | 50.31% (45.34%, 55.27%) | 52.70% (49.09%, 56.26%) | 52.64% (51.53%, 53.74%) |
| Male Circumcision Prevalence (95% CI) | 53.86% (51.00%, 56.69%) | 26.89% (23.12%, 31.03%) | 34.17% (26.11%, 43.25%) | 24.13% (19.36%, 29.65%) | 47.74% (45.41%, 50.07%) |
| Median Lifetime Partners (IQR) | 2 (1, 5) | 2 (1, 4) | 1 (1, 2) | 2 (1, 3) | 2 (1, 4) |
| Relationship Status Percent (95% CI) | |||||
| Married | 25.03% (23.56%, 26.56%) | 38.89% (35.88%, 41.98%) | 58.42% (54.31%, 62.43%) | 61.04% (56.86%, 65.07%) | 30.95% (29.38%, 32.58%) |
| Unmarried Relationship | 39.24% (37.70%, 40.81%) | 23.75% (21.18%, 26.51%) | 10.64% (8.42%, 13.36%) | 13.87% (11.58%, 16.54%) | 34.40% (32.94%, 35.88%) |
| Single | 25.59% (24.60, 27.16%) | 27.35% (24.94%, 29.91%) | 19.79% (16.83%, 23.13%) | 13.40% (11.21%, 16.19%) | 24.56% (23.50%, 25.65%) |
| Divorced/Widow ed | 9.08% (8.36%, 9.86%) | 9.27% (8.12%, 10.57%) | 9.82% (8.15%, 11.79%) | 11.13% (8.79%, 14.01%) | 9.33% (8.70%, 9.99%) |
| Other | 0.79% (0.60%, 1.04%) | 0.74% (0.39%, 1.40%) | 1.32% (0.55%, 3.14%) | 0.44% (0.19%, 1.02%) | 0.76% (0.60%, 0.97%) |
| Education Completed Percent (95% CI) | |||||
| Seventh Grade or Less | 21.12% (19.41%, 22.93%) | 16.81% (14.39%, 19.55%) | 5.42% (4.23%, 6.91%) | 0.51% (0.28%, 0.91%) | 18.01% (16.66%, 19.45%) |
| Eighth to Eleventh Grade | 44.68% (43.02%, 46.36%) | 44.74% (41.38%, 48.15%) | 31.16% (27.03%, 35.61%) | 20.81% (17.42%, 24.56%) | 41.73% (40.20%, 43.27%) |
| Twelfth Grade | 25.59% (23.99%, 27.26%) | 31.85% (28.42%, 35.49%) | 41.02% (36.76%, 45.41%) | 47.26% (42.30%, 52.28%) | 29.00% (27.55%, 30.49%) |
| Some Post-School Studies | 6.06% (4.97%, 7.37%) | 5.00% (3.63%, 6.85%) | 12.49% (9.50%, 16.25%) | 17.41% (14.42%, 20.88%) | 7.36% (6.40%, 8.47%) |
| Further Degrees Completed | 2.54% (1.84%, 3.51%) | 1.59% (0.95%, 2.64%) | 9.92% (6.99%, 13.91%) | 14.01% (10.49%, 18.46%) | 3.90% (3.01%, 5.03%) |
| Employment Percent (95% CI) | |||||
| Employed | 34.55% (32.46%, 36.69%) | 49.54% (46.60%, 52.49%) | 53.63% (49.57%, 57.64%) | 65.60% (62.05%, 68.98%) | 39.40% (37.57%, 41.25%) |
| Unemployed, Looking | 13.20% (12.25%, 14.21%) | 13.39% (11.83%, 15.13%) | 21.91% (17.43%, 27.16%) | 15.79% (13.59%, 18.26%) | 13.70% (12.89%, 14.56%) |
| Unemployed, Not Looking | 31.41% (30.02%, 32.83%) | 20.31% (17.77%, 23.12%) | 9.52% (7.40%, 12.16%) | 5.76% (3.99%, 8.24%) | 27.35% (26.08%, 28.65%) |
| Unable to Work | 2.77% (2.35%, 3.27%) | 4.55% (3.12%, 6.61%) | 3.58% (2.69%, 4.75%) | 1.11% (0.44%, 2.81%) | 2.80% (2.42%, 3.24%) |
| Student | 18.08% (17.01%, 19.19%) | 12.20% (10.47%, 14.16%) | 11.36% (8.84%, 14.48%) | 11.74% (9.43%, 14.54%) | 16.75% (15.85%, 17.69%) |
| Sexual Debut Age Percent (95% CI) | |||||
| Less than 15 | 6.08% (5.38%, 6.86%) | 5.39% (4.46%, 6.50%) | 1.86% (1.13%, 3.05%) | 2.93% (1.95%, 4.37%) | 5.57% (5.00%, 6.20%) |
| 15 to 24 | 75.77% (74.44%, 77.04%) | 74.11% (71.45%, 76.60%) | 66.02% (60.86%, 70.83%) | 74.42% (71.43%, 77.20%) | 75.19% (74.10%, 76.24%) |
| 25 or Older | 4.61% (4.01%, 5.29%) | 6.54% (5.13%, 8.30%) | 14.07% (10.51%, 18.58%) | 11.65% (9.41%, 14.35%) | 5.79% (5.21%, 6.42%) |
| Never | 13.55% (12.65%, 14.49%) | 13.96% (12.27%, 15.5%) | 18.05% (14.69%, 21.98%) | 11.00% (8.98%, 13.40%) | 13.46% (12.70%, 14.25%) |
| Percent Traveled in the Last 12 Months (95% CI) | 19.00% (17.47%, 20.41%) | 10.63% (8.99%, 12.54%) | 12.83% (9.80%, 16.63%) | 11.23% (9.00%, 13.92%) | 17.16% (15.98%, 18.40%) |
| Median Municipality-Level Multidimensional Poverty Index (IQR)* | 0.0285 (0.0188, 0.0484) | 0.0168 (0.0154, 0.0168) | 0.0281 (0.0183, 0.0281) | 0.0183 (0.0168, 0.0253) | 0.0278 (0.0169, 0.0422) |
| Median Municipality-Level S egregati on (IQR)** | 0.3948 (0.1928, 0.4524) | 0.4676 (0.3638, 0.4676) | 0.4439 (0.4163, 0.4439) | 0.4163 (0.4153, 0.4854) | 0.4163 (0.2370, 0.4658) |
| Median Municipality-Level Diversity (IQR)*** | 0.4575 (0.1074, 0.7209) | 1.0695 (0.8595, 1.1571) | 0.8126 (0.7209, 0.8126) | 0.7209 (0.6883, 0.9499) | 0.6179 (0.1527, 0.8116) |
| Enumeration Area Geography Type Percent (95% CI) | |||||
| Rural | 48.45% (43.04, 53.89%) | 10.94% (6.65%, 17.48%) | 1.23% (0.39%, 3.79%) | 14.92% (8.64%, 24.53%) | 40.21% (35.93%, 44.64%) |
| Urban Formal | 41.75% (36.20%, 47.51%) | 87.29% (80.77%, 91.82%) | 98.65% (96.18%, 99.53%) | 85.07% (75.46%, 91.35%) | 52.01% (47.50%, 56.48%) |
| Urban Informal | 9.81% (7.48%, 12.77%) | 1.77% (0.81%, 3.84%) | 0.12% (0.02%, 0.86%) | 0.01% (0.00%, 0.07%) | 7.79% (5.97%, 10.09%) |
Larger values imply greater poverty prevalence and intensity.
Larger values imply more segregation.
Larger values imply more diversity.
Racial distributions and associations with municipality-level variables
Figure 1 displays the distribution of racial classification throughout South Africa. Black South Africans predominately reside in the eastern portion of the country while Coloured individuals predominately reside in the western portion. White individuals represent a minority in most municipalities but are distributed broadly throughout the country while Asian South Africans reside mostly in KwaZulu-Natal (in and around Durban) and Gauteng. Figure 2 displays municipality-level diversity, segregation, and poverty, as well as a map which classifies municipalities based on racial make-up using a K-means clustering procedure. Demographic descriptions of these four clusters can be viewed in the supplementary materials. Diversity is higher in the western municipalities while segregation is higher in urban centers. Municipality-level poverty is highest in KwaZulu-Natal, the eastern portion of Eastern Cape, and the border of Northern Cape and North-West. Certain municipality-level variables vary greatly according to their racial make-up. Figure 3 displays how municipality-level poverty, segregation, and HIV prevalence correlate with municipality Black population percentage.
Figure 1:
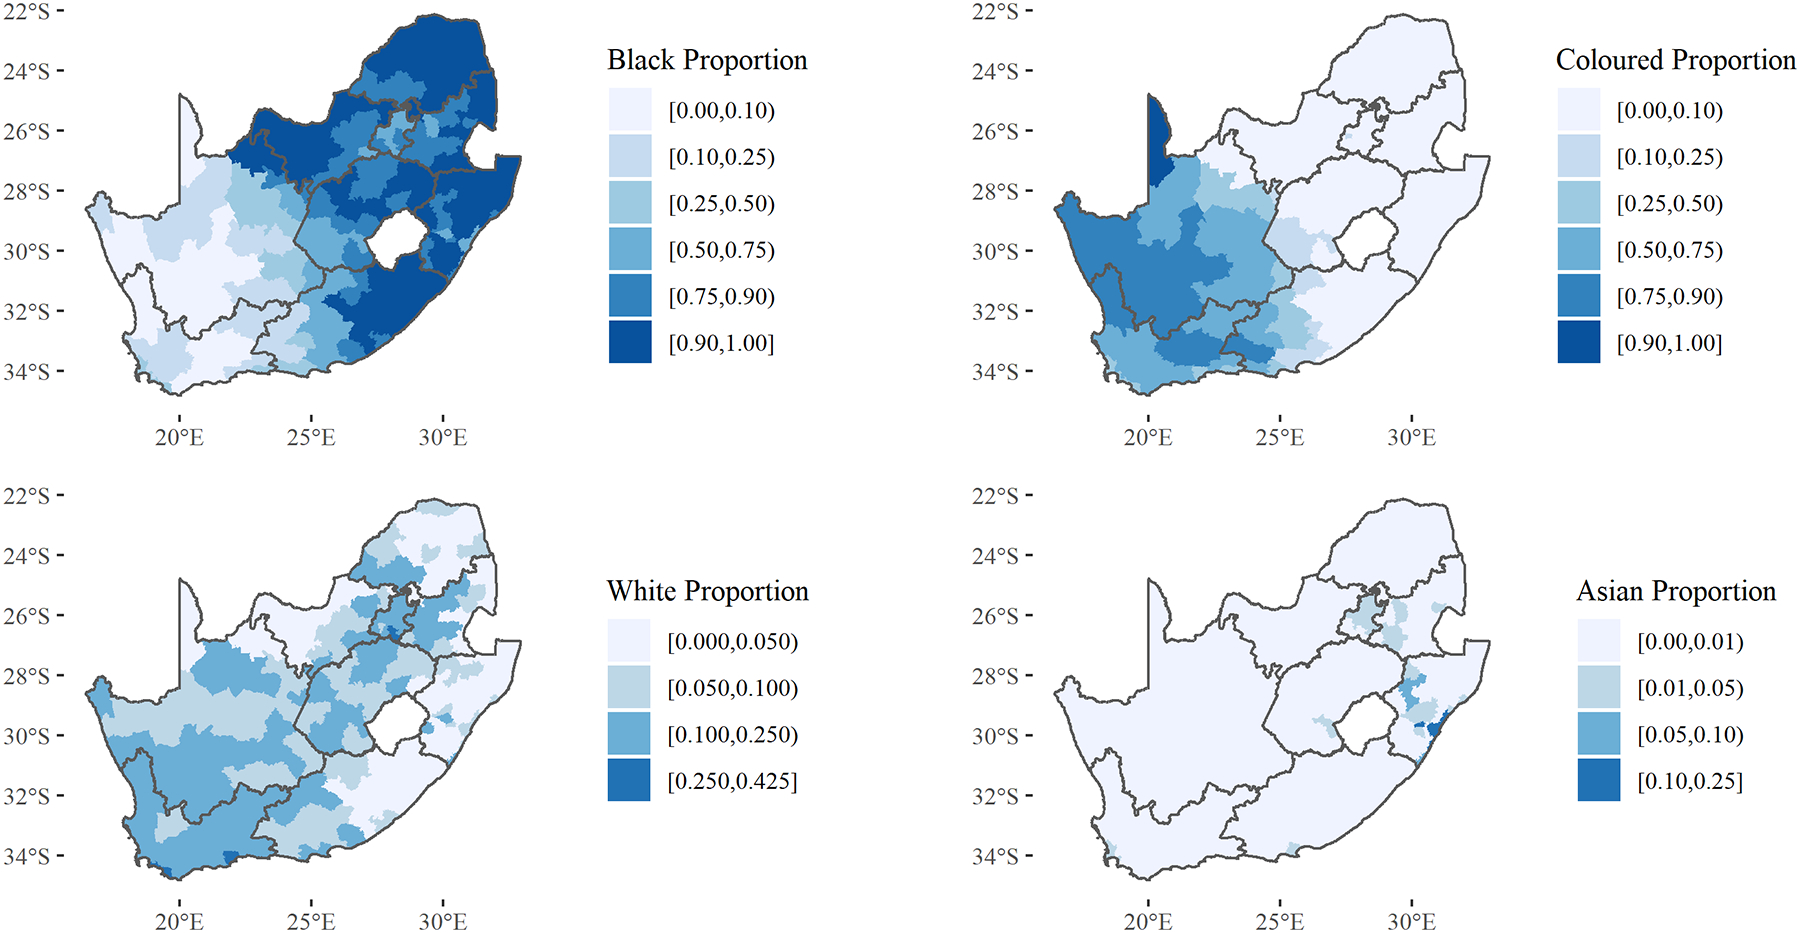
Racial Population Proportion by Municipality
Figure 2: Municipality-Level Diversity, Segregation, and Poverty.
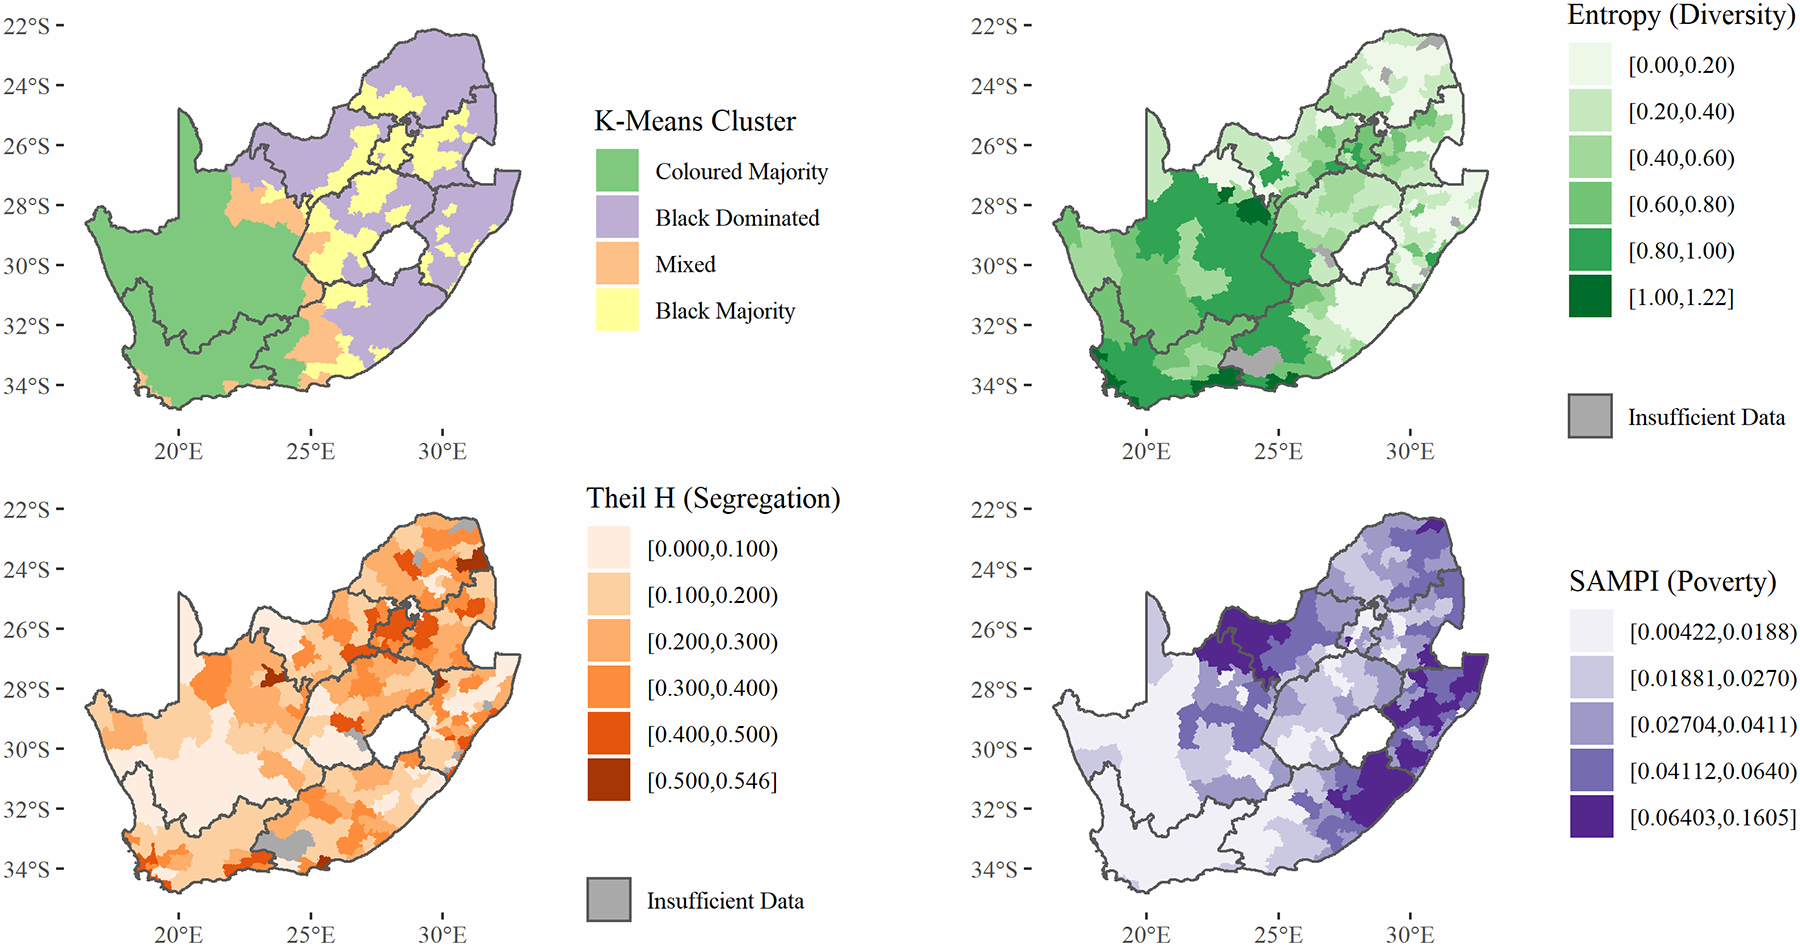
Segregation values vary between 0, when all wards have the same racial composition as the entire municipality, to 1, when all wards contain only one racial group (Reardon & O’Sullivan, 2004). Diversity has a minimum value of 0 (the area is made up of only one racial group) and has an upper limit of 1.39 for four groups (Black, White, Coloured, Asian), when all groups make up 25% of the population.
Figure 3:
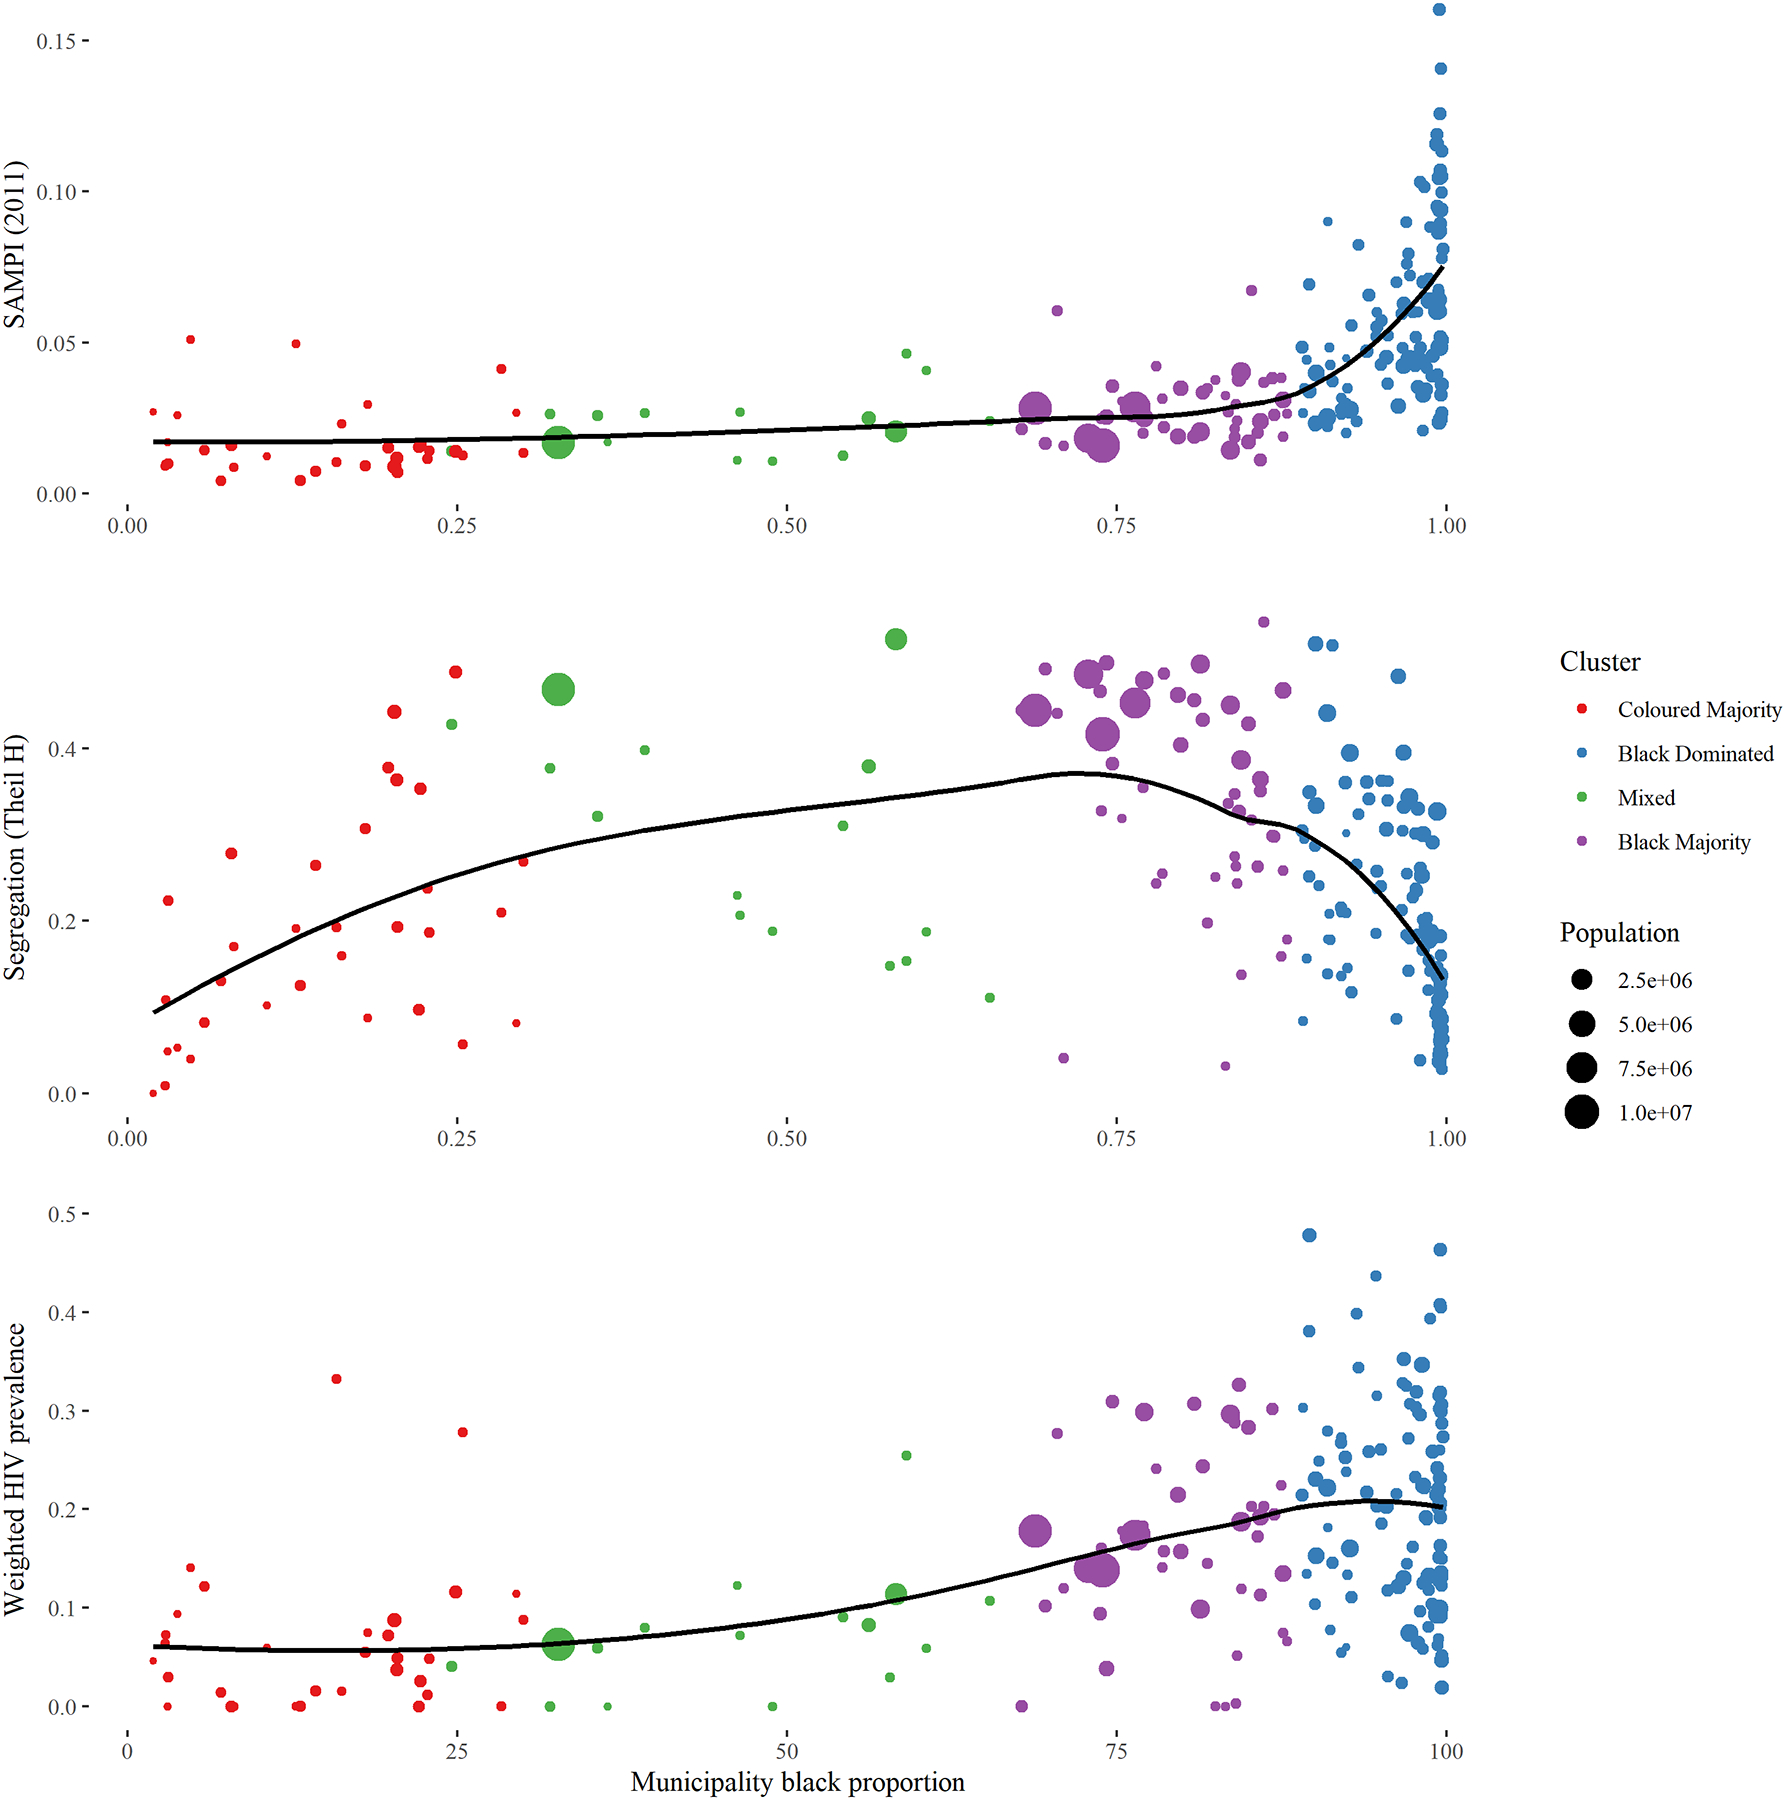
Municipality-Level Black Proportion Versus South African Municipality-Level Poverty Index (SAMPI), Segregation, and HIV Prevalence
Municipality-level prevalence of HIV
Figure 4 displays the unstandardized and race-standardized prevalences of HIV in South Africa at the municipality-level. For associated standard errors, please see Supplementary Figure 1. From the unstandardized map, HIV seems to be concentrated in the eastern part of the country, where the majority of Black South Africans live. The race-standardized controls for this racial distribution and uncovers other areas which have higher HIV prevalences than their racial distributions suggest. While the HIV prevalence is still heterogeneous in this standardized map, the eastern/western differences seem to fade. More can be learned from examining Figure 5, which displays the race-specific HIV prevalence for each municipality. For associated standard errors, please see Supplementary Figure 2. As suggested by the heterogeneity in the standardized map, race-specific prevalences of HIV are also heterogeneous. Black South Africans experience a high burden of HIV in Kwazulu-Natal and Mpumalanga, particularly near the borders of eSwatini. However, they also experience a high burden in places like Cape Town, Drakenstein, and on the border of Western and Eastern Cape. Coloured South Africans experience increased burdens in south-west Eastern Cape and Matjhabeng in Free State. In White and Asian South Africans, all municipalities had prevalences less than 5%.
Figure 4: Unstandardized and Race-Standardized* Municipality-Level HIV Prevalence.
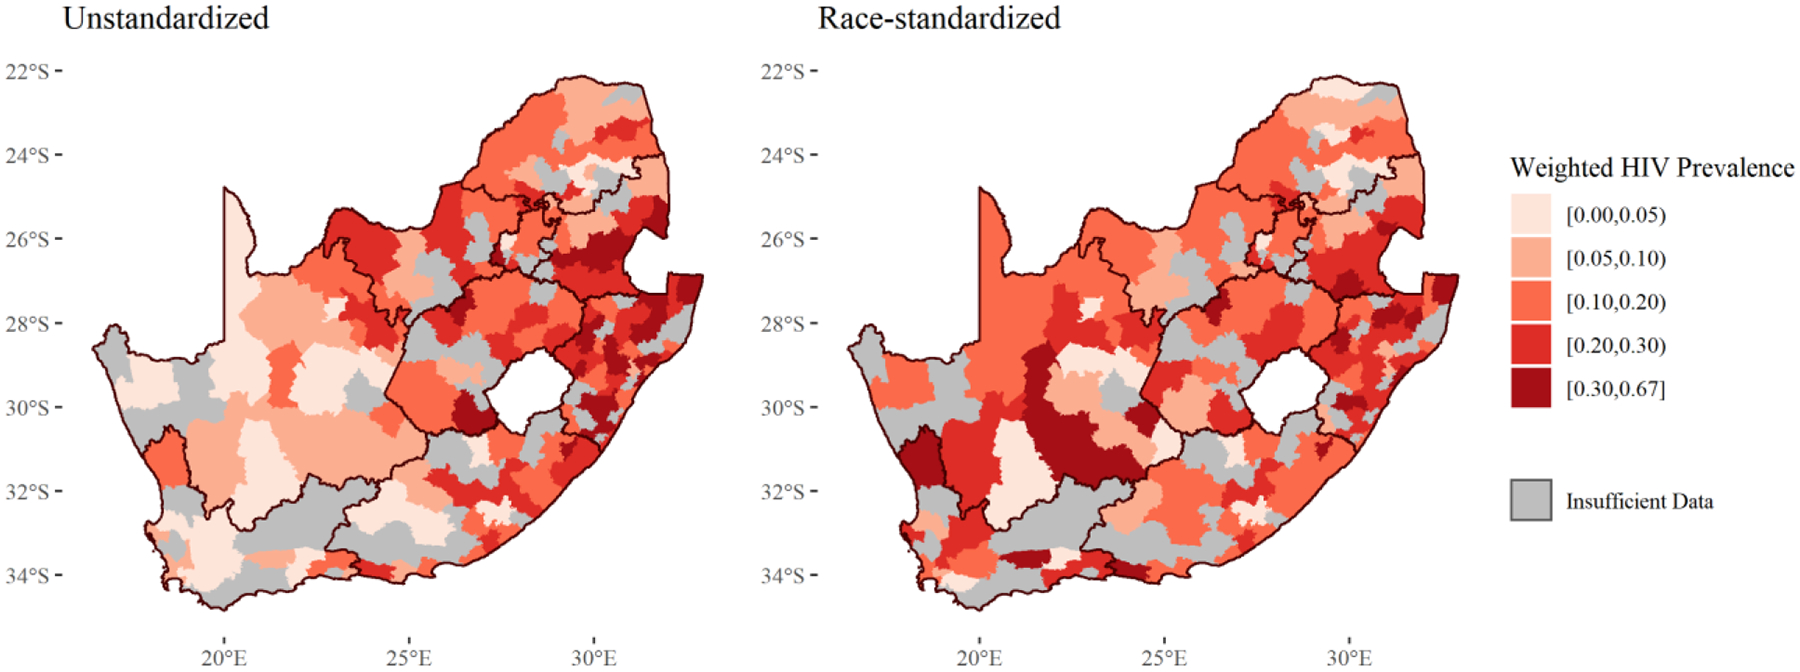
*Using indirect standardization
Figure 5:
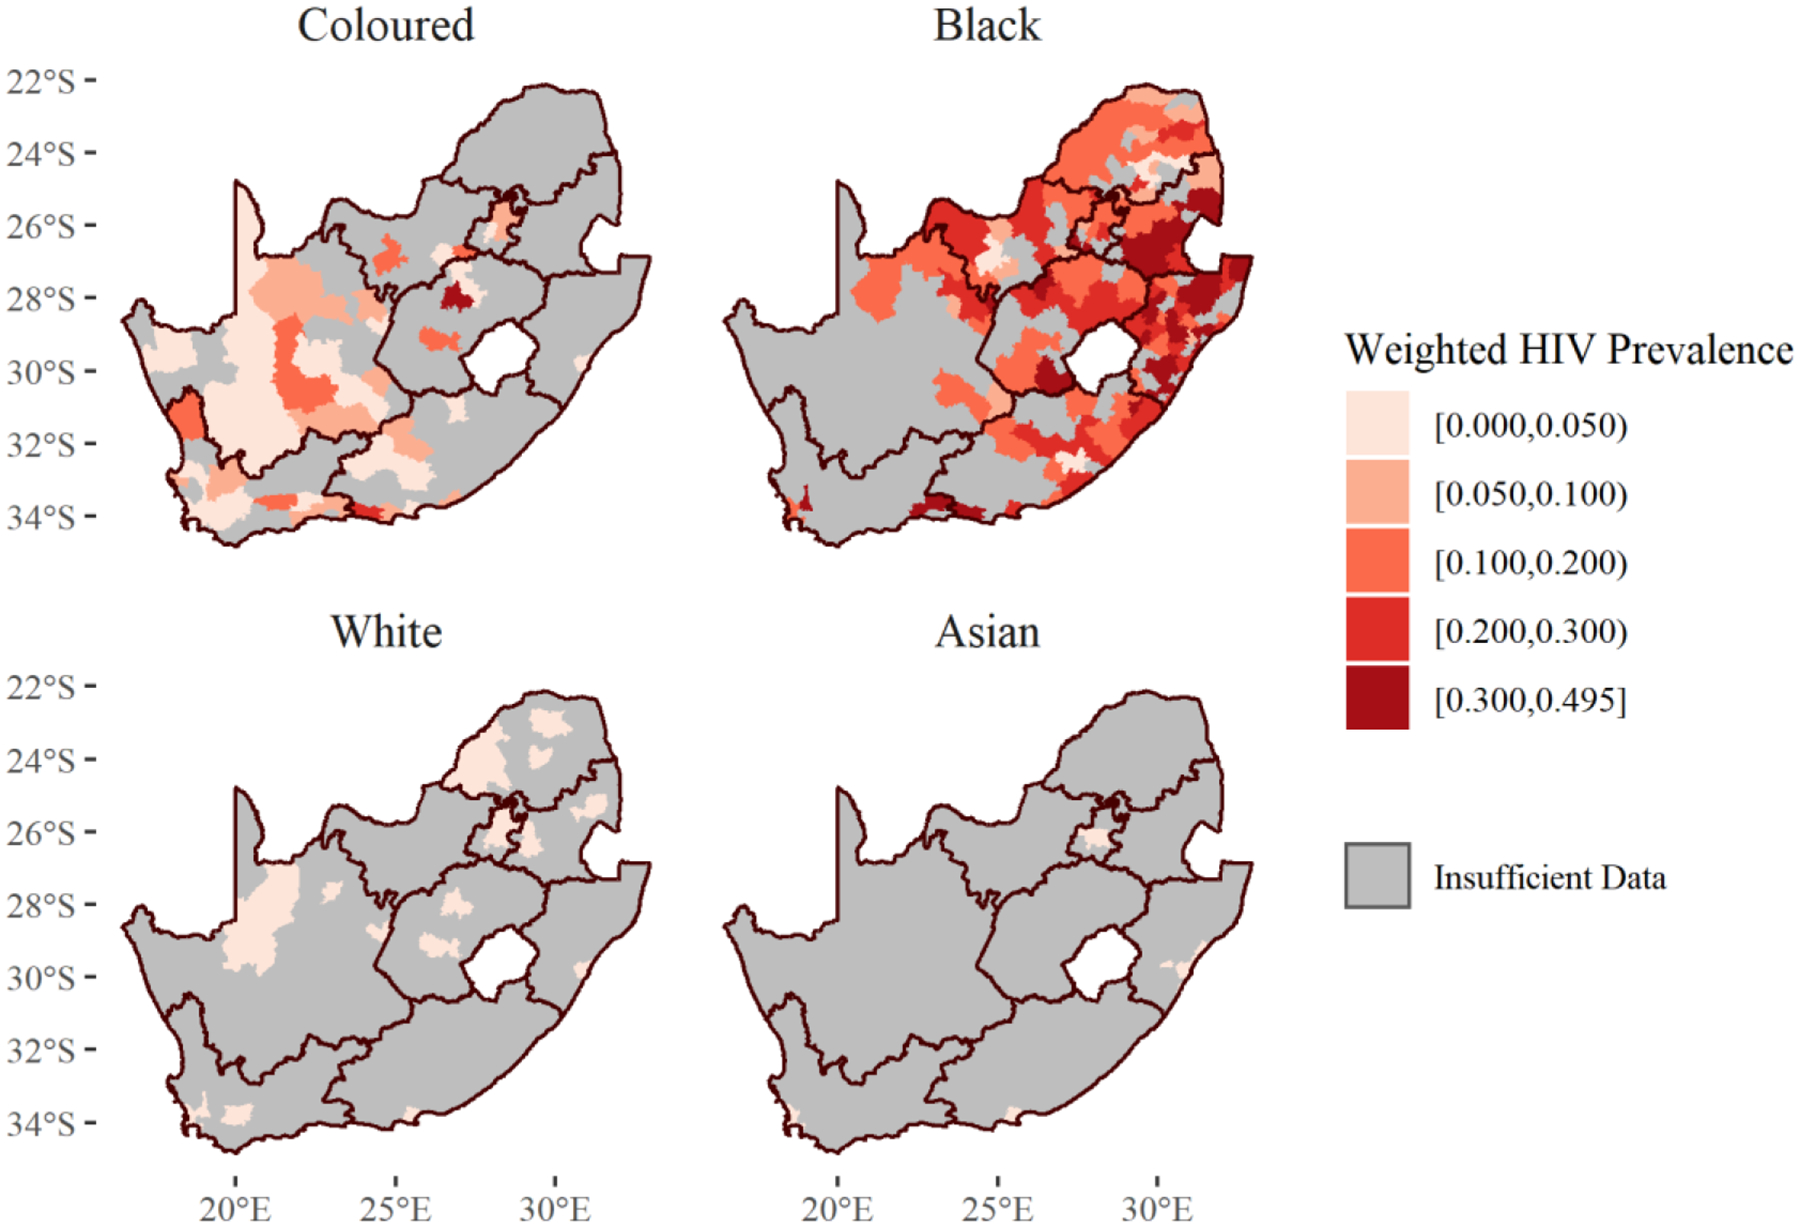
Race-Specific Municipality-Level HIV Prevalence
Spatially varying odds ratios
Since race-specific HIV prevalences vary spatially, it may also be true that comparisons between race-specific prevalences vary spatially. Figure 6 shows spatially varying odds ratios comparing HIV prevalences between Black and Coloured Africans, as well as the confidence limit ratios (CLRs) for those estimates. For Black versus Coloured South Africans, odds ratio point estimates were always greater than one (Black South Africans had greater odds of HIV infection everywhere). Odd ratios are higher near the Cape Town and Drakenstein municipalities in Western Cape province. They were also higher near the border of Western and Eastern Cape provinces. The odds ratios were between one and two in one region covering parts of Northern Cape, North West, and Free State provinces. White and Asian South Africans were not compared here as their HIV case counts were too low.
Figure 6: Spatially Varying HIV Prevalence Odds Ratios Comparing Black and Coloured South Africans and Associated Confidence Limit Ratios (CLRs)*.
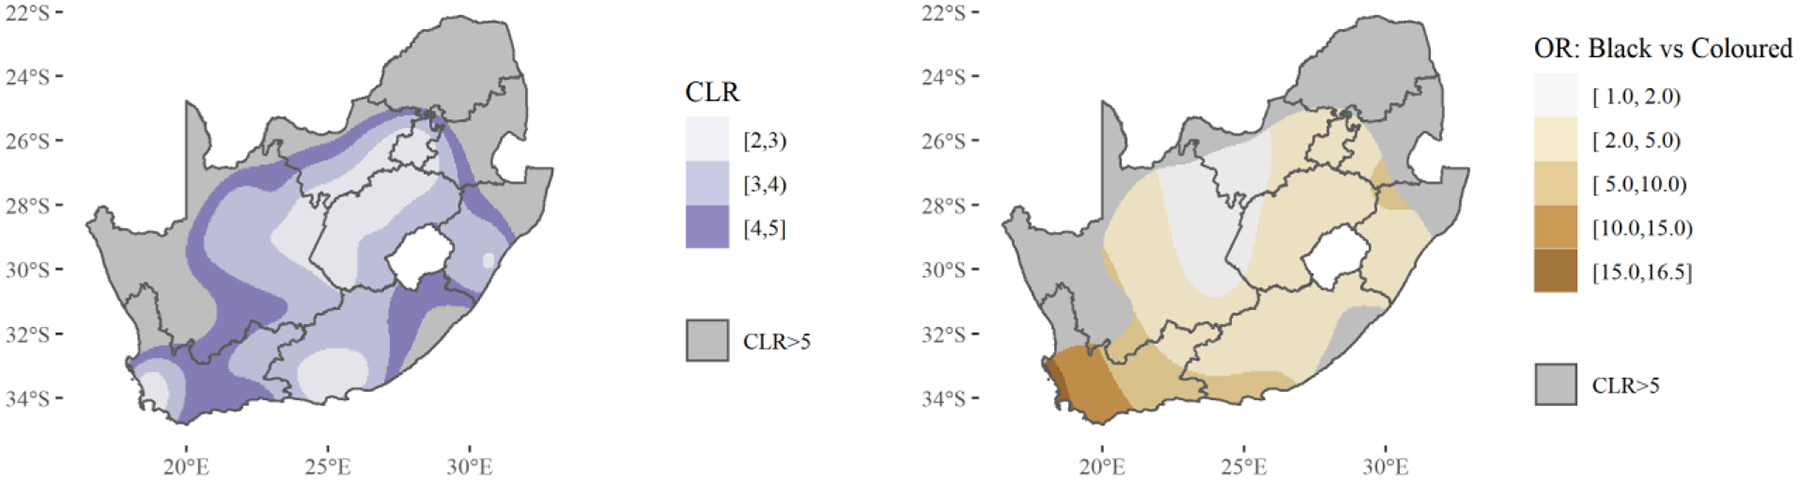
*Estimates with associated CLRs > 5 considered too imprecise to show.
Race-specific regressions
Regressions were run for Black and Coloured South Africans, but not Asian or White South Africans due to the small number of HIV cases in those groups. Table 2 displays the results of these race-specific regressions, weighted according to the survey design to be nationally representative. A graph of estimated odds ratios of each age compared to age 15 can be viewed in Supplementary Figure 3. The odds of HIV infection are flatter throughout the age distribution of Coloured South Africans, compared to Black South Africans who experience a higher peak around ages 35–40. Black women had 3.19 times the odds of HIV infection compared to circumcised Black men while uncircumcised Black men had 1.92 times the odds. Among Coloured South Africans, these effects were slightly higher: 4.56 for women and 2.31 for uncircumcised men. Number of lifetime partners displayed similar odds ratios for categories below ten partners for both Black and Coloured South Africans. However, there was a difference for those with ten or more partners: Black South Africans with ten or more partners had 2.10 times the odds of being HIV positive than those with one partner – and similar odds compared to the other categories - while Coloured South Africans had 4.79 times the odds compared to those with one partner.
Table 2:
Race-Specific Regression Outputs (Weighted According to Survey Design)
| Characteristic | Prevalence Odds Ratio (95% CI) | |
|---|---|---|
| Black (n = 6,657) | Coloured (n = 2,482) | |
| Age | Not interpretable* | Not interpretable* |
| Age Squared | Not interpretable* | Not interpretable* |
| Sex and Circumcision Status | ||
| Male Circumcised (Reference) | - | - |
| Male Uncircumcised | 1.92 (1.39, 2.66) | 2.31 (0.58, 9.26) |
| Female | 3.19 (2.41, 4.21) | 4.56 (1.07, 19.4) |
| Number of Lifetime Partners | ||
| One (Reference) | - | - |
| Two to Four | 1.77 (1.36, 2.29) | 1.84 (1.01, 3.35) |
| Five to Nine | 1.93 (1.32, 2.82) | 1.67 (0.68, 4.10) |
| Ten or More | 2.10 (1.40, 3.14) | 4.79 (1.88, 12.2) |
| Relationship Status | ||
| Married (Reference) | - | - |
| Unmarried Relationship | 2.54 (1.87, 3.45) | 2.60 (0.95, 7.13) |
| Single | 2.16 (1.49, 3.45) | 3.51 (1.37, 9.00) |
| Divorced/Widowed | 1.74 (1.11, 2.74) | 2.58 (1.16, 5.76) |
| Other | 1.43 (0.48, 4.28) | 51.7 (7.92, 337.0) |
| Education Completed | ||
| Seventh Grade or Less (Reference) | - | - |
| Eighth to Eleventh Grade | 1.00 (0.77, 1.30) | 0.64 (0.33, 1.24) |
| Twelfth Grade | 0.75 (0.56, 1.02) | 0.30 (0.11, 0.82) |
| Some Post-School Studies | 0.43 (0.25, 0.76) | 0.21 (0.05, 0.91) |
| Further Degrees Completed | 0.24 (0.10, 0.58) | 0.06 (0.00, 0.65) |
| Employment | ||
| Employed (Reference) | - | - |
| Unemployed, Looking | 0.99 (0.71, 1.38) | 1.21 (0.53, 2.77) |
| Unemployed, Not Looking | 1.15 (0.91, 1.45) | 1.15 (0.63, 2.12) |
| Unable to Work | 1.43 (0.82, 2.51) | 5.61 (2.16, 14.5) |
| Student | 0.48 (0.28, 0.80) | 0.20 (0.04. 1.04) |
| Sexual Debut Age | ||
| Less than 15 | 1.65 (0.82, 3.31) | 4.81 (0.75, 31.0) |
| 15 to 24 | 1.30 (0.60, 2.83) | 3.15 (0.93, 10.7) |
| 25 or Older (Reference) | - | - |
| Travel (Last 12 Months) | ||
| No (Reference) | - | - |
| Yes | 1.24 (0.98, 1.56) | 1.39 (0.64, 3.00) |
| South African Multidimensional Poverty Index (SAMPI) of Participant’s Municipality | ||
| Richest Tertile (Reference) | - | - |
| Middle Tertile | 1.19 (0.86, 1.65) | 0.83 (0.29. 2.40) |
| Poorest Tertile | 1.24 (0.86, 1.79) | 0.83 (0.25, 2.73) |
| Municipality Segregation (Theil H) | ||
| No Segregation (0) to Maximum Measured Segregation in South Africa (0.55) | 1.95 (1.15, 3.32) | 0.54 (0.09, 3.13) |
| Municipality Diversity (Entropy) | ||
| No Entropy (0) to Maximum Measured Entropy in South Africa (1.22) | 0.42 (0.22, 0.81) | 0.16 (0.02, 1.43) |
| Enumeration Area Geography Type | ||
| Rural (Reference) | - | - |
| Urban Formal | 1.11 (0.81, 1.52) | 0.95 (0.41, 2.18) |
| Urban Informal | 1.54 (1.09, 2.17) | 3.21 (0.96, 10.7) |
Not interpretable as a single number, but results can be viewed in Supplementary Figure 1.
For Black South Africans, the odds of HIV infection almost doubled when moving from the least segregated municipality in South Africa (Theil H of 0) to the most segregated (0.55): OR 1.95 (95% CI: 1.15, 3.32). Our sensitivity analysis which incorporates a random effect for municipality to account clustering at that level found a similar result: (OR: 1.92, 95% CI: 1.05, 3.58). For Coloured South Africans, this odds ratio was 0.54 (0.09, 3.13), suggesting a protective effect but with a wide interval which includes potential for harm. In terms of municipality-level diversity, increased diversity was protective against HIV for both groups: moving from the least diverse municipality (entropy of 0) to the most diverse municipality (1.22) resulted in an odds ratio of 0.42 (0.22, 0.81) in Black South Africans and 0.16 (0.02, 1.43) in Coloured South Africans. Lastly, HIV prevalence in Black South Africans seemed to be highest in urban informal areas (OR: 1.54 versus rural), followed by urban formal areas and rural areas, which were about equal. For Coloured South Africans, living in an urban informal neighborhood was associated with 3.21 times the odds of HIV infection compared to rural neighborhoods, with urban formal neighborhoods being about equal to rural neighborhoods.
DISCUSSION
Municipality-level segregation was positively associated with HIV infection in Black South Africans, even after controlling for individual and structural factors (i.e., education, employment, municipal-level poverty, urbanicity, and sexual history) which are on the pathway between racist policy and HIV (Burgard, S.A. & Lee-Rife, S.) but are often blamed, in place of racist policy, for increased HIV risk (Kenyon et al., 2013). These results suggest quantitatively what we know qualitatively and intuitively: that racist policies created a system which limited Black South Africans’ access to key resources, and the more effective that system was at segregating and subsequently depriving Black South Africans, the more devastating it is for their health. It is important to distinguish that it is not the segregation or separation itself which causes this deprivation, but racist policies which are tied to and facilitated by segregation (Williams et al., 2019; Williams & Jackson, 2005). A potential follow-up question might be: is the higher prevalence in Black and Coloured South Africans simply due to disparities in infection that occurred during Apartheid? An ad-hoc follow-up analysis where we restricted the regression to Black South Africans who reached age 15 post-Apartheid (33 years old or younger in 2012) suggests that this disparity continued: a positive association between segregation and HIV infection was observed using this subset, and it was even slightly increased (OR 2.25). Furthermore, given the potential effect of gender-specific policy impacts, an ad-hoc sensitivity analysis further stratified by gender. This analysis found a slightly larger impact of segregation on Black women (OR: 2.13) than on Black men (OR 1.77).
For other races, the links between segregation and HIV were less definitive. For Coloured South Africans, the point estimate for segregation indicated a protective effect against HIV, but the 95% confidence interval included potential for harm. These effects were not computed for Asian or White South Africans, as there were only 7 HIV cases in White South Africans and 33 in Asian South Africans.
To our knowledge, this is the first analysis to quantitatively link residential segregation to HIV prevalence in Black South Africans throughout the country. However, other studies have noted that Apartheid and racist policies are linked to HIV through poverty (Burger & Christian, 2020; Cunha, 2007; Mansanjala, 2007; Phatlane, 2010), gender inequality (Cunha, 2007; Hunter, 2007; Kalipeni et al., 2007; Mabaso et al., 2019; Magni et al., 2015; Ranganathan et al., 2016; Shisana et al., 2010; Wamoyi et al., 2016; Zembe et al., 2013) alcohol use (Magni et al., 2015; Norris et al., 2009), and healthcare access (Baker, 2010; Burger et al., 2012; Coovadia et al., 2009; Gilson & McIntyre, 2007; Scrubb, 2011). In the United States, a few analyses have specifically linked residential segregation to HIV, similarly finding a positive correlation between the two (Buot et al., 2014; Ibragimov et al., 2019). Many studies have linked segregation to poorer health outcomes, but have found effects to be more pronounced for more oppressed groups – which we also find in this analysis (Williams et al., 2019; Williams, 2018)
The observed racial differences in the correlation between segregation and HIV likely exists because the racist policies accompanying segregation were more oppressive for Black South Africans than for other racial groups. Apartheid placed Black South Africans below Coloured South Africans on the race hierarchy, and one of the clearest consequences of this can be seen in the amount of municipality-level poverty. When examining the relationship between racial makeup and poverty at the municipality level, the poorest municipalities are almost solely those which are 90% Black or more. This area-level deprivation occurred because Black South Africans were specifically targeted by policies which limited the quality of their education and the jobs. Racist policies also harmed Black South Africans to a greater degree than Coloured South Africans in terms of healthcare access. In a 2009–10 study, Coloured South Africans were almost as likely as White South Africans to say that healthcare was “available” and were significantly more likely to say healthcare was “affordable” and “acceptable” compared to Black South Africans (Burger & Christian, 2019). Finally, simply existing at the bottom of a social hierarchy exposes one to everyday experiences of racism and discrimination (Williams et al., 2019).
Compared to other races, HIV prevalence is higher for Black South Africans in essentially every municipality where enough data exists to make such a comparison. In this analysis, we look deeper by examining a race-stratified map, which revealed the within-race heterogeneity in the distribution of the virus. Past and present racist policies clearly play a role in the measured distribution, as revealed by our race-specific regression, however other factors likely contribute as well. Among Black South Africans, there is a clear gender disparity (women are at increased odds) and circumcised men are somewhat protected. Another analysis of this same data source found that Black women with an older partner (>=5 years difference) had 51.8% HIV prevalence, suggesting a portion of this gender disparity can be explained by gendered power dynamics in sexual relationships (Mabaso et al., 2019). Employed and educated individuals are at a lower odds of HIV, a result that has been echoed in many studies (Hunter, 2007; Levinhson et al., 2011; Nattrass, 2008). However, the relationship between employment and HIV can change if the employing industry requires mobility/migration (Grabowski, 2020; Ramjee & Gouws, 2002; Campbell, 1997). These examples and caveats begin to suggest that fully explaining the distribution of HIV in South Africa would require detailed examinations of complex local dynamics (Webb, 1997).
For Coloured South Africans, much of the heterogeneity in HIV prevalence is likely explained by the differential forces acting upon the varied ethnicities which make up the Coloured racial category (Martin, 1998). For example, HIV prevalence is quite low near Cape Town, possibly due to a lower HIV prevalence in the Cape Malay and Cape Coloured communities compared to other ethnicities. Likely related to ethnicity but also likely independently important, the odds ratio of HIV infection in urban informal areas compared to rural areas was 3.21, a fairly large difference. Those in urban formal areas had the lowest odds of HIV of the three neighborhood types. Poor conditions in urban informal areas are likely driving this relationship (WHO, UN-Habitat, 2010). Interestingly, number of lifetime partners in Coloured South Africans seemed to be more associated with HIV than in Black South Africans, suggesting that the epidemic is less generalized among Coloured individuals. Our analysis has shown that focusing on Black areas will be necessary but not sufficient: Black South Africans everywhere are at increased odds of HIV and all must be protected. That said, we have also shown that increased attention on areas most heavily affected by racist policies, aided by segregation, is warranted. However, policies need to consider the intersections between gender, class, and race, otherwise, they will not be fully effective (Kraut-Becher et al., 2008; Williams & Purdie-Vaughns, 2016; Kawachi et al., 2005; Charasse-Pouélé & Fournier, 2006). Some policies to reduce racial disparities have already been implemented, but often suffer from the neglecting the considerations above (Patel & Graham, 2012; Horwitz & Jain, 2011). For example, the original Black Economic Empowerment (BEE) program often prioritized wealthy Black South Africans and focused on integration rather than reversing material deprivation (Patel & Graham, 2012; Horwitz & Jain, 2011).
The study has some limitations. The primary threat to the validity of these results is that of missing data. Though response rates to the general SABSSM survey were high, the proportion of participants who agreed to an HIV test were much lower and varied based on race. Specifically, HIV test response ratios were higher in Black and Coloured South Africans compared to Asian and White South Africans. If a missing HIV test was dependent on the result of that test (had it been measured) the results may be biased, most notably the regression analysis which utilizes only complete cases, though we somewhat address this through our use of inverse probability weights. Further, the regression analysis includes both age and sexual debut age. While both variables are potentially important to address confounding, interpretation of their parameter values is potentially problematic in certain instances, as an estimate for the odds of HIV infection for a 17-year-old with a sexual debut age of “25 or older” is invalid. It should also be noted that our study only had data on HIV prevalence, rather than incidence, thus some of the observed associations between HIV and our covariates could be due to reverse causation. Though we have controlled for multiple confounders, depending on the relationship of interest, our regression outputs represent conditional associations and should not be interpreted as measures of causal effects. Finally, we lack ethnicity data, which is most consequential for those in the “Coloured” category. Multiple ethnic groups make up the “Coloured” category, with “Cape Coloured,” “Malay,” “Griqua,” and “Other Coloured” being the subcategories that existed during Apartheid. The legacy of Apartheid is likely somewhat different for each of these groups, though they share a spot on Apartheid’s social hierarchy above Black South Africans and below White and Asian South Africans.
This study also has several strengths. First, the data are from a large geographically diverse population which aimed to provide a nationally representative sample. Second, we had detailed geographic information which allowed us to calculate valuable geospatial covariates at high resolution. Finally, the focus on Apartheid and racist policy as structural influences allowed us to conduct race-specific analyses and identify how racist policy continues to have enduring consequences in terms of HIV infection. Further studies could improve upon this analysis by more clearly specifying the spatial impact of specific racist policies and linking those impacts to HIV prevalence or incidence.
Conclusions
This paper has linked racist policy, enduring segregation, and HIV, and demonstrated the link between segregation and HIV for Black South Africans. Though we cannot, and did not aim, to separate the past effects of racist policy and the current effects of segregation, the results continue to build evidence for the influence of structural and historical factors, including segregation, on the current spatial and demographic distribution of HIV in South Africa.
Supplementary Material
Supplementary Figure 1: Standard Error Estimates for Unstandardized Municipality-Level HIV Prevalence
Supplementary Figure 2: Standard Error Estimates for Race-Specific Municipality-Level HIV Prevalence
Supplementary Figure 3: Odds Ratios of HIV Infection at Various Ages Compared to Age 15, Stratified Results from Separate Regressions
Highlights.
HIV prevalence was 21% in Black South Africans in 2012.
HIV prevalence varied across South African municipalities.
The geospatial heterogeneity in HIV prevalence remained after stratifying by race.
Segregation was positively associated with HIV in Black South Africans.
The legacy of Apartheid continues to drive the distribution of HIV infections.
ACKNOWLEDGEMENTS
We would like to thank Dr. Brady West for his assistance in using survey methodology to estimate municipality-level prevalences and conduct weighted regressions.
APPENDIX
Diversity/Entropy and Segregation (Theil’s H Index) Formulae
T = Total population, B = Black proportion, C = Coloured proportion, WH = White proportion, I = Asian Proportion, MN = Municipality level, WD = Ward level, WD_i = Ward i
K-means cluster category means:
Black Dominated: 96.4% Black, 0.6% Coloured, 2.4% White, 0.3% Asian
Black Majority: 79.7% Black, 4.6% Coloured, 13.1% White, 2.2% Asian
Coloured Majority: 13.4% Black, 72.5% Coloured, 13.2% White, 0.3% Asian
Mixed: 46.1% Black, 36.7% Coloured, 15.4% White, 0.4% Asian
Footnotes
GB: Conceptualization, Methodology, Software, Validation, Formal Analysis, Investigation, Data Curation, Writing - Original Draft, Writing - Review & Editing, Visualization, Project administration
JN: Conceptualization, Methodology, Investigation, Data Curation, Writing - Original Draft, Writing - Review & Editing, Supervision, Project administration
AS: Software, Validation, Investigation, Data Curation, Writing - Original Draft, Writing - Review & Editing
VG: Conceptualization, Methodology, Software, Validation, Formal Analysis, Investigation, Writing - Original Draft, Writing - Review & Editing, Supervision
KZ: Conceptualization, Investigation, Writing - Original Draft, Writing - Review & Editing
ME: Conceptualization, Writing - Original Draft, Writing - Review & Editing, Supervision
Publisher's Disclaimer: This is a PDF file of an unedited manuscript that has been accepted for publication. As a service to our customers we are providing this early version of the manuscript. The manuscript will undergo copyediting, typesetting, and review of the resulting proof before it is published in its final form. Please note that during the production process errors may be discovered which could affect the content, and all legal disclaimers that apply to the journal pertain.
REFERENCES
- 1.Link BG, & Phelan J (1995). Social conditions as fundamental causes of disease. Journal of Health and Social Behavior, Spec No, 80–94. [PubMed] [Google Scholar]
- 2.Williams DR, & Collins C (2001). Racial residential segregation: A fundamental cause of racial disparities in health. Public Health Reports (Washington, D.C.: 1974), 116(5), 404–416. 10.1093/phr/116.5.404 [DOI] [PMC free article] [PubMed] [Google Scholar]
- 3.Reardon SF, & O’Sullivan D (2004). Measures of Spatial Segregation. Sociological Methodology, 34(1), 121–162. 10.1111/j.0081-1750.2004.00150.x [DOI] [Google Scholar]
- 4.McClure E, Feinstein L, Cordoba E, Douglas C, Emch M, Robinson W, Galea S, & Aiello AE (2019). The legacy of redlining in the effect of foreclosures on Detroit residents’ self-rated health. Health & Place, 55, 9–19. 10.1016/j.healthplace.2018.10.004 [DOI] [PMC free article] [PubMed] [Google Scholar]
- 5.White K, & Borrell LN (2011). Racial/ethnic residential segregation: framing the context of health risk and health disparities. Health & place, 17(2), 438–448. [DOI] [PMC free article] [PubMed] [Google Scholar]
- 6.Landrine H, & Corral I (2009). Separate and unequal: residential segregation and black health disparities. Ethnicity & disease, 19(2), 179. [PubMed] [Google Scholar]
- 7.Charasse-Pouélé C, & Fournier M (2006). Health disparities between racial groups in South Africa: A decomposition analysis. Social science & medicine, 62(11), 2897–2914. [DOI] [PubMed] [Google Scholar]
- 8.Feinberg HM (1993). The 1913 Natives Land Act in South Africa: Politics, Race, and Segregation in the Early 20th Century. The International Journal of African Historical Studies, 26(1), 65–109. 10.2307/219187 [DOI] [Google Scholar]
- 9.Clark NL, & Worger WH (2016). South Africa: The Rise and Fall of Apartheid. Routledge. [Google Scholar]
- 10.Braveman P (2006). Health disparities and health equity: concepts and measurement. Annu. Rev. Public Health, 27, 167–194. [DOI] [PubMed] [Google Scholar]
- 11.Vosloo C (2020). Extreme apartheid: The South African system of migrant labour and its hostels. Image & Text, 34, 1–33. 10.17159/2617-3255/2020/n34a1 [DOI] [Google Scholar]
- 12.Lurie MN (2006). The Epidemiology of Migration and HIV/AIDS in South Africa. Journal of Ethnic and Migration Studies, 32(4), 649–666. 10.1080/13691830600610056 [DOI] [Google Scholar]
- 13.Lurie MN, Williams BG, Zuma K, Mkaya-Mwamburi D, Garnett G, Sturm AW, Sweat MD, Gittelsohn J, & Abdool Karim SS (2003). The impact of migration on HIV-1 transmission in South Africa: A study of migrant and nonmigrant men and their partners. Sexually Transmitted Diseases, 30(2), 149–156. 10.1097/00007435-200302000-00011 [DOI] [PubMed] [Google Scholar]
- 14.Abdool Karim Q, Abdool Karim SS, Singh B, Short R, & Ngxongo S (1992). Seroprevalence of HIV infection in rural South Africa. AIDS (London, England), 6(12), 1535–1539. 10.1097/00002030-199212000-00018 [DOI] [PubMed] [Google Scholar]
- 15.Cohen MS, Chen YQ, McCauley M, Gamble T, Hosseinipour MC, Kumarasamy N, Hakim JG, Kumwenda J, Grinsztejn B, Pilotto JHS, Godbole SV, Chariyalertsak S, Santos BR, Mayer KH, Hoffman IF, Eshleman SH, Piwowar-Manning E, Cottle L, Zhang XC, … Fleming TR (2016). Antiretroviral Therapy for the Prevention of HIV-1 Transmission. New England Journal of Medicine, 375(9), 830–839. 10.1056/NEJMoa1600693 [DOI] [PMC free article] [PubMed] [Google Scholar]
- 16.Eisinger RW, Dieffenbach CW, & Fauci AS (2019). HIV Viral Load and Transmissibility of HIV Infection: Undetectable Equals Untransmittable. JAMA, 321(5), 451–452. 10.1001/jama.2018.21167 [DOI] [PubMed] [Google Scholar]
- 17.Scrubb V (2011). Political Systems and Health Inequity: Connecting Apartheid Policies to the HIV/AIDS Epidemic in South Africa. The Columbia Journal of Global Health, 1(1), 6–8. 10.7916/thejgh.v1i1.4925 [DOI] [Google Scholar]
- 18.Baker PA (2010). From Apartheid to Neoliberalism: Health Equity in Post-Apartheid South Africa. International Journal of Health Services, 40(1), 79–95. 10.2190/HS.40.1.e [DOI] [PubMed] [Google Scholar]
- 19.Kon ZR, & Lackan N (2008). Ethnic Disparities in Access to Care in Post-Apartheid South Africa. American Journal of Public Health, 98(12), 2272–2277. 10.2105/AJPH.2007.127829 [DOI] [PMC free article] [PubMed] [Google Scholar]
- 20.Wilkinson E, Junqueira DM, Lessells R, Engelbrecht S, van Zyl G, de Oliveira T, & Salemi M (2019). The effect of interventions on the transmission and spread of HIV in South Africa: A phylodynamic analysis. Scientific Reports, 9(1), 2640. 10.1038/s41598-018-37749-3 [DOI] [PMC free article] [PubMed] [Google Scholar]
- 21.Burger R, & Christian C (2020). Access to health care in post-apartheid South Africa: Availability, affordability, acceptability. Health Economics, Policy and Law, 15(1), 43–55. 10.1017/S1744133118000300 [DOI] [PubMed] [Google Scholar]
- 22.Coovadia H, Jewkes R, Barron P, Sanders D, & McIntyre D (2009). The health and health system of South Africa: Historical roots of current public health challenges. The Lancet, 374(9692), 817–834. 10.1016/S0140-6736(09)60951-X [DOI] [PubMed] [Google Scholar]
- 23.Zembe YZ, Townsend L, Thorson A, & Ekström AM (2013). “Money talks, bullshit walks” interrogating notions of consumption and survival sex among young women engaging in transactional sex in post-apartheid South Africa: A qualitative enquiry. Globalization and Health, 9(1), 28. 10.1186/1744-8603-9-28 [DOI] [PMC free article] [PubMed] [Google Scholar]
- 24.Hunter M (2007). The changing political economy of sex in South Africa: The significance of unemployment and inequalities to the scale of the AIDS pandemic. Social Science & Medicine, 64(3), 689–700. 10.1016/j.socscimed.2006.09.015 [DOI] [PubMed] [Google Scholar]
- 25.Stoebenau K, Heise L, Wamoyi J, & Bobrova N (2016). Revisiting the understanding of “transactional sex” in sub-Saharan Africa: A review and synthesis of the literature. Social Science & Medicine, 168, 186–197. 10.1016/j.socscimed.2016.09.023 [DOI] [PubMed] [Google Scholar]
- 26.Muula AS (2008). HIV Infection and AIDS Among Young Women in South Africa. Croatian Medical Journal, 49(3), 423–435. 10.3325/cmj.2008.3.423 [DOI] [PMC free article] [PubMed] [Google Scholar]
- 27.Wamoyi J, Stobeanau K, Bobrova N, Abramsky T, & Watts C (2016). Transactional sex and risk for HIV infection in sub-Saharan Africa: A systematic review and meta-analysis. Journal of the International AIDS Society, 19(1), 20992. 10.7448/IAS.19.1.20992 [DOI] [PMC free article] [PubMed] [Google Scholar]
- 28.Ranganathan M, Heise L, Pettifor A, Silverwood RJ, Selin A, MacPhail C, Delany-Moretlwe S, Kahn K, Gómez-Olivé FX, Hughes JP, Piwowar-Manning E, Laeyendecker O, & Watts C (2016). Transactional sex among young women in rural South Africa: Prevalence, mediators and association with HIV infection. Journal of the International AIDS Society, 19(1), 20749. 10.7448/IAS.19.1.20749 [DOI] [PMC free article] [PubMed] [Google Scholar]
- 29.Magni S, Christofides N, Johnson S, & Weiner R (2015). Alcohol Use and Transactional Sex among Women in South Africa: Results from a Nationally Representative Survey. PLOS ONE, 10(12), e0145326. 10.1371/journal.pone.0145326 [DOI] [PMC free article] [PubMed] [Google Scholar]
- 30.Norris AH, Kitali AJ, & Worby E (2009). Alcohol and transactional sex: How risky is the mix? Social Science & Medicine, 69(8), 1167–1176. 10.1016/j.socscimed.2009.07.015 [DOI] [PubMed] [Google Scholar]
- 31.Lund C, De Silva M, Plagerson S, Cooper S, Chisholm D, Das J, Knapp M, & Patel V (2011). Poverty and mental disorders: Breaking the cycle in low-income and middle-income countries. The Lancet, 378(9801), 1502–1514. 10.1016/S0140-6736(11)60754-X [DOI] [PubMed] [Google Scholar]
- 32.Collins PY, Holman AR, Freeman MC, & Patel V (2006). What is the relevance of mental health to HIV/AIDS care and treatment programs in developing countries? A systematic review. AIDS (London, England), 20(12), 1571. 10.1097/01.aids.0000238402.70379.d4 [DOI] [PMC free article] [PubMed] [Google Scholar]
- 33.Tsai AC, Bangsberg DR, & Weiser SD (2013). Harnessing Poverty Alleviation to Reduce the Stigma of HIV in Sub-Saharan Africa. PLOS Medicine, 10(11), e1001557. 10.1371/journal.pmed.1001557 [DOI] [PMC free article] [PubMed] [Google Scholar]
- 34.Chesney MA, Morin M, & Sherr L (2000). Adherence to HIV combination therapy. Social Science & Medicine, 50(11), 1599–1605. 10.1016/S0277-9536(99)00468-29536(99)00468-2 [DOI] [PubMed] [Google Scholar]
- 35.Shisana O, Rice K, Zungu N, & Zuma K (2010). Gender and Poverty in South Africa in the Era of HIV/AIDS: A Quantitative Study. Journal of Women’s Health, 19(1), 39–46. 10.1089/jwh.2008.1200 [DOI] [PubMed] [Google Scholar]
- 36.Masanjala W (2007). The poverty-HIV/AIDS nexus in Africa: A livelihood approach. Social Science & Medicine, 64(5), 1032–1041. 10.1016/j.socscimed.2006.10.009 [DOI] [PubMed] [Google Scholar]
- 37.McClure ES, Vasudevan P, Bailey Z, Patel S, & Robinson WR (2020). Racial Capitalism Within Public Health—How Occupational Settings Drive COVID-19 Disparities. American Journal of Epidemiology, 189(11), 1244–1253. 10.1093/aje/kwaa126 [DOI] [PMC free article] [PubMed] [Google Scholar]
- 38.Decoteau CL (2008). The Bio-Politics of HIV/AIDS in Post-Apartheid South Africa. 490.
- 39.Jones TT (2001). South Africa in Crisis on HIV/AIDS Treatment. Science, 292(5526), 2431–2432. 10.1126/science.292.5526.2431b [DOI] [PubMed] [Google Scholar]
- 40.Robins S (2004). “Long live Zackie, long live”: AIDS activism, science and citizenship after apartheid. Journal of Southern African Studies, 30(3), 651–672. 10.1080/0305707042000254146 [DOI] [Google Scholar]
- 41.Wabiri N, & Taffa N (2013). Socio-economic inequality and HIV in South Africa. BMC Public Health, 13(1), 1037. 10.1186/1471-2458-13-1037 [DOI] [PMC free article] [PubMed] [Google Scholar]
- 42.Zuma K, Shisana O, Rehle TM, Simbayi LC, Jooste S, Zungu N, Labadarios D, Onoya D, Evans M, Moyo S, & Abdullah F (2016). New insights into HIV epidemic in South Africa: Key findings from the National HIV Prevalence, Incidence and Behaviour Survey, 2012. African Journal of AIDS Research, 15(1), 67–75. 10.2989/16085906.2016.1153491 [DOI] [PubMed] [Google Scholar]
- 43.Fransman T, & Yu D (2019). Multidimensional poverty in South Africa in 2001–16. Development Southern Africa, 36(1), 50–79. 10.1080/0376835X.2018.1469971 [DOI] [Google Scholar]
- 44.Reardon SF, & Firebaugh G (2002). Measures of Multigroup Segregation. Sociological Methodology, 32, 33–67. [Google Scholar]
- 45.Theil H (1972). Statistical decomposition analysis: With applications in the social and administrative sciences. Amsterdam: North-Holland Pub. Co. [Google Scholar]
- 46.Wood SN (2003). Thin plate regression splines. Journal of the Royal Statistical Society: Series B (Statistical Methodology), 65(1), 95–114. 10.1111/1467-9868.003749868.00374 [DOI] [Google Scholar]
- 47.R Core Team (2019). R: A language and environment for statistical computing. R Foundation for Statistical Computing, Vienna, Austria. URL http://www.R-project.org/. [Google Scholar]
- 48.Lumley T (2020) “survey: analysis of complex survey samples”. R package version 4.0 [Google Scholar]
- 49.Bischoff K (2008). School District Fragmentation and Racial Residential Segregation: How Do Boundaries Matter? Urban Affairs Review, 44(2), 182–217. 10.1177/1078087408320651 [DOI] [Google Scholar]
- 50.Farrell CR (2008). Bifurcation, Fragmentation or Integration? The Racial and Geographical Structure of US Metropolitan Segregation, 1990—2000. Urban Studies, 45(3), 467–499. 10.1177/0042098007087332 [DOI] [Google Scholar]
- 51.Fischer MJ (2008). Shifting Geographies: Examining the Role of Suburbanization in Blacks’ Declining Segregation. Urban Affairs Review, 43(4), 475–496. 10.1177/1078087407305499 [DOI] [Google Scholar]
- 52.Parisi D, Lichter DT, & Taquino MC (2011). Multi-Scale Residential Segregation: Black Exceptionalism and America’s Changing Color Line. Social Forces, 89(3), 829–852. 10.1353/sof.2011.0013 [DOI] [Google Scholar]
- 53.2011 Census | Statistics South Africa. (n.d.). Retrieved June 3, 2021, from http://www.statssa.gov.za/?page_id=3839
- 54.Reardon SF, & O’Sullivan D (2004). Measures of Spatial Segregation. Sociological Methodology, 34(1), 121–162. 10.1111/j.0081-1750.2004.00150.x [DOI] [Google Scholar]
- 55.Burgard Sarah A., and Susan Lee-Rife. “Community Characteristics, Sexual Initiation, and Condom Use among Young Black South Africans.” Journal of Health and Social Behavior 50(3): 293–309. [DOI] [PubMed] [Google Scholar]
- 56.Kenyon C, Buyze J, & Colebunders R (2013). HIV Prevalence by Race Co-Varies Closely with Concurrency and Number of Sex Partners in South Africa. PLOS ONE, 8(5), e64080. 10.1371/journal.pone.0064080 [DOI] [PMC free article] [PubMed] [Google Scholar]
- 57.Williams DR, Lawrence JA, & Davis BA (2019). Racism and Health: Evidence and Needed Research. Annual Review of Public Health, 40(1), 105–125. 10.1146/annurev-publhealth-040218-043750 [DOI] [PMC free article] [PubMed] [Google Scholar]
- 58.Williams DR, & Jackson PB (2005). Social sources of racial disparities in health. Health affairs, 24(2), 325–334. [DOI] [PubMed] [Google Scholar]
- 59.Cunha M (2007). South African Politics, Inequalities, and HIV/AIDS: Applications for Public Health Education. Journal of Developing Societies, 23(1–2), 207–219. 10.1177/0169796X0602300212 [DOI] [Google Scholar]
- 60.Phatlane SN (2010). Poverty and HIV/AIDS in Apartheid South Africa. Social Identities. 10.1080/1350463032000075344 [DOI] [Google Scholar]
- 61.Kalipeni E, Oppong J, & Zerai A (2007). HIV/AIDS, gender, agency and empowerment issues in Africa. Social Science & Medicine, 64(5), 1015–1018. 10.1016/j.socscimed.2006.10.010 [DOI] [PubMed] [Google Scholar]
- 62.Mabaso M, Makola L, Naidoo I, Mlangeni LL, Jooste S, & Simbayi L (2019). HIV prevalence in South Africa through gender and racial lenses: Results from the 2012 population-based national household survey. International Journal for Equity in Health, 18(1), 167. 10.1186/s12939-019-1055-6 [DOI] [PMC free article] [PubMed] [Google Scholar]
- 63.Shisana O, Rice K, Zungu N, & Zuma K (2010). Gender and Poverty in South Africa in the Era of HIV/AIDS: A Quantitative Study. Journal of Women’s Health, 19(1), 39–46. 10.1089/jwh.2008.1200 [DOI] [PubMed] [Google Scholar]
- 64.Burger R, Bredenkamp C, Grobler C, & van der Berg S. (2012). Have public health spending and access in South Africa become more equitable since the end of apartheid? Development Southern Africa, 29(5), 681–703. 10.1080/0376835X.2012.730971 [DOI] [Google Scholar]
- 65.Gilson L, & McIntyre D (2007). Post-Apartheid Challenges: Household Access and Use of Health Care in South Africa. International Journal of Health Services, 37(4), 673–691. 10.2190/HS.37.4.f [DOI] [PubMed] [Google Scholar]
- 66.Buot M-LG, Docena JP, Ratemo BK, Bittner MJ, Burlew JT, Nuritdinov AR, & Robbins JR (2014). Beyond Race and Place: Distal Sociological Determinants of HIV Disparities. PLOS ONE, 9(4), e91711. 10.1371/journal.pone.0091711 [DOI] [PMC free article] [PubMed] [Google Scholar]
- 67.Ibragimov U, Beane S, Adimora AA, Friedman SR, Williams L, Tempalski B, Stall R, Wingood G, Hall HI, Johnson AS, & Cooper HLF (2019). Relationship of Racial Residential Segregation to Newly Diagnosed Cases of HIV among Black Heterosexuals in US Metropolitan Areas, 2008–2015. Journal of Urban Health, 96(6), 856–867. 10.1007/s11524-018-0303-1 [DOI] [PMC free article] [PubMed] [Google Scholar]
- 68.Williams AD, Wallace M, Nobles C, & Mendola P (2018). Racial residential segregation and racial disparities in stillbirth in the United States. Health & Place, 51, 208–216. 10.1016/j.healthplace.2018.04.005 [DOI] [PMC free article] [PubMed] [Google Scholar]
- 69.Levinsohn JA, McLaren Z, Shisana O, & Zuma K (2011). HIV Status and Labor Market Participation in South Africa (No. w16901). National Bureau of Economic Research. 10.3386/w16901 [DOI] [Google Scholar]
- 70.Nattrass N (2008). AIDS and the Scientific Governance of Medicine in Post-Apartheid South Africa. African Affairs, 107(427), 157–176. 10.1093/afraf/adm087 [DOI] [Google Scholar]
- 71.Kate Grabowski M, Lessler J, Bazaale J, Nabukalu D, Nankinga J, Nantume B, Ssekasanvu J, Reynolds SJ, Ssekubugu R, Nalugoda F, Kigozi G, Kagaayi J, Santelli JS, Kennedy C, Wawer MJ, Serwadda D, Chang LW, & Gray RH (2020). Migration, hotspots, and dispersal of HIV infection in Rakai, Uganda. Nature Communications, 11(1), 976. 10.1038/s41467-020-14636-y [DOI] [PMC free article] [PubMed] [Google Scholar]
- 72.Ramjee G, & Gouws, and E. (2002). Prevalence of HIV Among Truck Drivers Visiting Sex Workers in KwaZulu-Natal, South Africa. Sexually Transmitted Diseases, 29(1), 44–49. [DOI] [PubMed] [Google Scholar]
- 73.Campbell C (1997). Migrancy, masculine identities and AIDS: The psychosocial context of HIV transmission on the South African gold mines. Social Science & Medicine, 45(2), 273–281. 10.1016/S0277-9536(96)00343-7 [DOI] [PubMed] [Google Scholar]
- 74.Webb D (1997). HIV and AIDS in Africa.
- 75.Martin D-C (1998). What’s in the Name “Coloured”? Social Identities, 4(3), 523–540. 10.1080/13504639851753 [DOI] [Google Scholar]
- 76.Organization, W. H., & Programme, U. N. H. S. (2010). Hidden cities: Unmasking and overcoming health inequities in urban settings. World Health Organization. https://apps.who.int/iris/handle/10665/44439 [Google Scholar]
- 77.Kraut-Becher J, Eisenberg M, Voyek C, Brown T, Metzger DS, Aral S (2008). Examining Racial Disparities in HIV: Lessons from Sexually Transmitted Infections Research. Journal of Acquired Immune Deficiency Syndrome, 47, S20–S27. 10.1097/QAI.0b013e3181605b95 [DOI] [PubMed] [Google Scholar]
- 78.Williams DR, & Purdie-Vaughns V (2016). Needed interventions to reduce racial/ethnic disparities in health. Journal of health politics, policy and law, 41(4), 627–651. [DOI] [PubMed] [Google Scholar]
- 79.Kawachi I, Daniels N, & Robinson DE (2005). Health disparities by race and class: why both matter. Health Affairs, 24(2), 343–352. [DOI] [PubMed] [Google Scholar]
- 80.Patel L, & Graham L (2012). Broad-Based Black Economic Empowerment Act. Development Southern Africa - DEV SOUTH AFR, 29, 193–207. 10.1080/0376835X.2012.675692 [DOI] [Google Scholar]
- 81.Horwitz FM, & Jain H (2011). An assessment of employment equity and Broad Based Black Economic Empowerment developments in South Africa. Equality, Diversity and Inclusion: An International Journal, 30(4), 297–317. 10.1108/02610151111135750 [DOI] [Google Scholar]
- 82.Kerrigan DL, Fonner VA, Stromdahl S, & Kennedy CE (2013). Community Empowerment Among Female Sex Workers is an Effective HIV Prevention Intervention: A Systematic Review of the Peer-Reviewed Evidence from Low- and Middle-Income Countries. AIDS and Behavior, 17(6), 1926–1940. 10.1007/s10461-013-0458-40458-4 [DOI] [PubMed] [Google Scholar]
- 83.Wirtz AL, Pretorius C, Beyrer C, Baral S, Decker MR, Sherman SG, Sweat M, Poteat T, Butler J, Oelrichs R, Semini I, & Kerrigan D (2014). Epidemic Impacts of a Community Empowerment Intervention for HIV Prevention among Female Sex Workers in Generalized and Concentrated Epidemics. PLOS ONE, 9(2), e88047. 10.1371/journal.pone.0088047 [DOI] [PMC free article] [PubMed] [Google Scholar]
- 84.Kalanda B (2010). Empowering Young Sex Workers for Safer Sex in Dowa and Lilongwe Districts of Malawi. Malawi Medical Journal, 22(1). 10.4314/mmj.v22i1.55900 [DOI] [PMC free article] [PubMed] [Google Scholar]
- 85.Vandormael A, Akullian A, Siedner M, de Oliveira T, Bärnighausen T, & Tanser F (2019). Declines in HIV incidence among men and women in a South African population-based cohort. Nature Communications, 10(1), 5482. 10.1038/s41467-019-13473-y [DOI] [PMC free article] [PubMed] [Google Scholar]
Associated Data
This section collects any data citations, data availability statements, or supplementary materials included in this article.
Supplementary Materials
Supplementary Figure 1: Standard Error Estimates for Unstandardized Municipality-Level HIV Prevalence
Supplementary Figure 2: Standard Error Estimates for Race-Specific Municipality-Level HIV Prevalence
Supplementary Figure 3: Odds Ratios of HIV Infection at Various Ages Compared to Age 15, Stratified Results from Separate Regressions