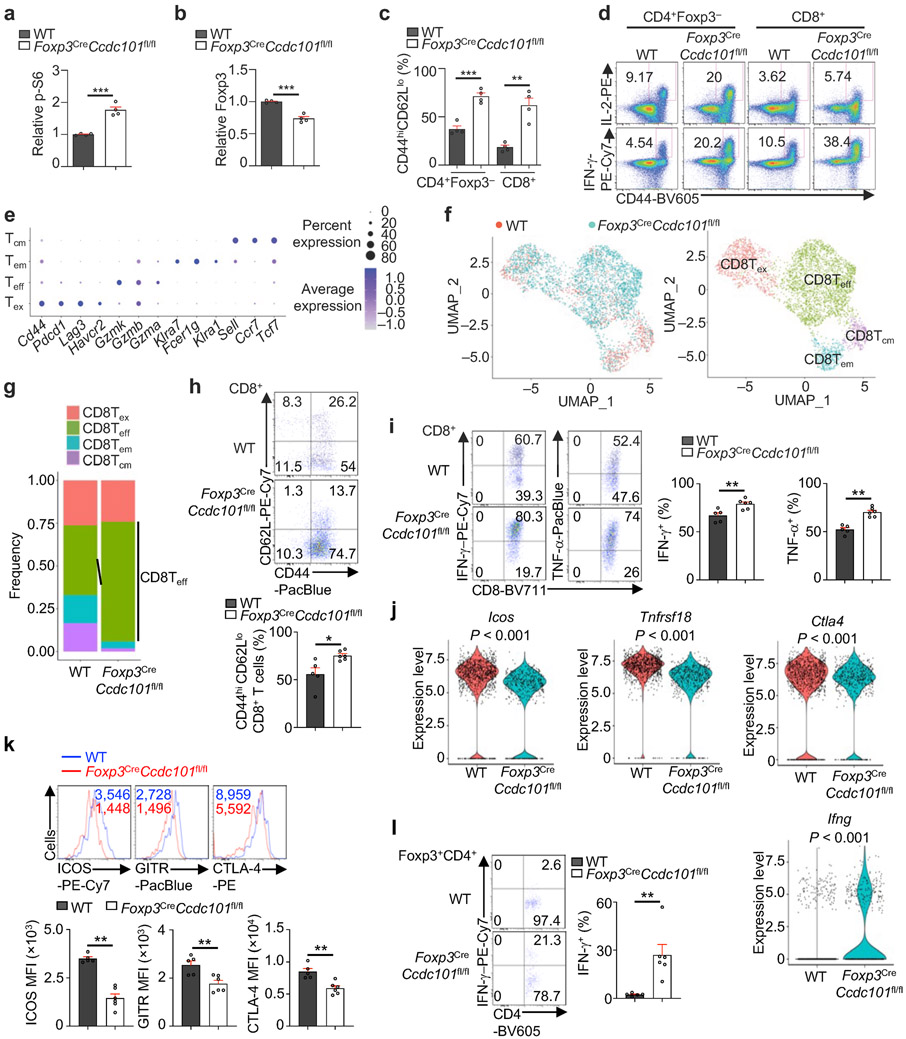
Extended Data Figure 11 (to Figure 5). Treg-specific deletion of Ccdc101 disrupts immune homeostasis and boosts antitumour response.
(a) Quantification of relative p-S6 level in splenic CD4+Foxp3+ cells from WT and Foxp3CreCcdc101fl/fl (~8 weeks old) mice (n = 4 mice per group). (b) Quantification of relative Foxp3 expression (gated on splenic Foxp3+CD4+ T cells) from WT and Foxp3CreCcdc101fl/fl mice (n = 4 mice per group). (c) Quantification of percentages of effector/memory (CD44hiCD62Llo) subsets in splenic CD4+Foxp3− and CD8+ T cells from WT and Foxp3CreCcdc101fl/fl (~8 weeks old) mice (n = 4 mice each group). (d) Representative flow cytometry analysis of IL-2+ or IFN-γ+ population of splenic CD4+Foxp3− and CD8+ T cells from WT and Foxp3CreCcdc101fl/fl (~8 weeks old) mice. (e–g) WT and Foxp3CreCcdc101fl/fl mice were inoculated with MC38 colon adenocarcinoma cells. Treg cells (CD45+CD4+YFP+), non-Treg immune cells (CD45+YFP−CD11b−) and myeloid cells (CD45+CD11b+) were isolated and sorted from tumours, and mixed at a 1:2:1 ratio for scRNA-seq analysis (2 biological replicates, pooled from 3-4 mice each, per group) at 19 d after tumour inoculation. Dot plot showing the differentially expressed marker genes for 4 subclusters of CD8+ T cells in the MC38 tumours (e; see Methods for details). UMAP embeddings of CD8+ T cells grouped by genotype (f, left) and indicated subclusters (f, right). Frequencies of the indicated subclusters were quantified for each genotype (g). Teff-like, effector-like CD8+ T cells; Tex-like, exhaustion-like CD8+ T cells; Tcm-like, central memory-like CD8+ T cells; Tem-like, effector/memory-like CD8+ T cells. (h) Flow cytometry analysis and quantification of the percentages of CD44hiCD62Llo intratumoural CD8+ T cells from WT and Foxp3CreCcdc101fl/fl mice (n ≥ 5 per group). (i) Flow cytometry analysis and quantification of IFN-γ+ and TNF-α+ cells among intratumoural CD8+ T cells from WT and Foxp3CreCcdc101fl/fl mice (n ≥ 5 per group). (j) Violin plots of scRNA-seq data depicting Icos, Tnfrsf18, Ctla4 and Ifng expression in intratumoural Treg cells. (k) Flow cytometry analysis and quantification of ICOS, GITR and CTLA-4 for intratumoural Treg cells from WT and Foxp3CreCcdc101fl/fl mice (n ≥ 5 per group). (l) Flow cytometry analysis and quantification of IFN-γ expression in intratumoural Treg cells from WT and Foxp3CreCcdc101fl/fl mice (n ≥ 5 per group). Mean ± s.e.m. (a–c, h, i, k, l). *P < 0.05; **P < 0.01; ***P < 0.001; two-tailed unpaired Student’s t-test (a–c, h, i, k, l); Two-sided Wilcoxon rank sum test in j. Data are representative of one (e–l) or two (d), or pooled from two (a–c) experiments.

