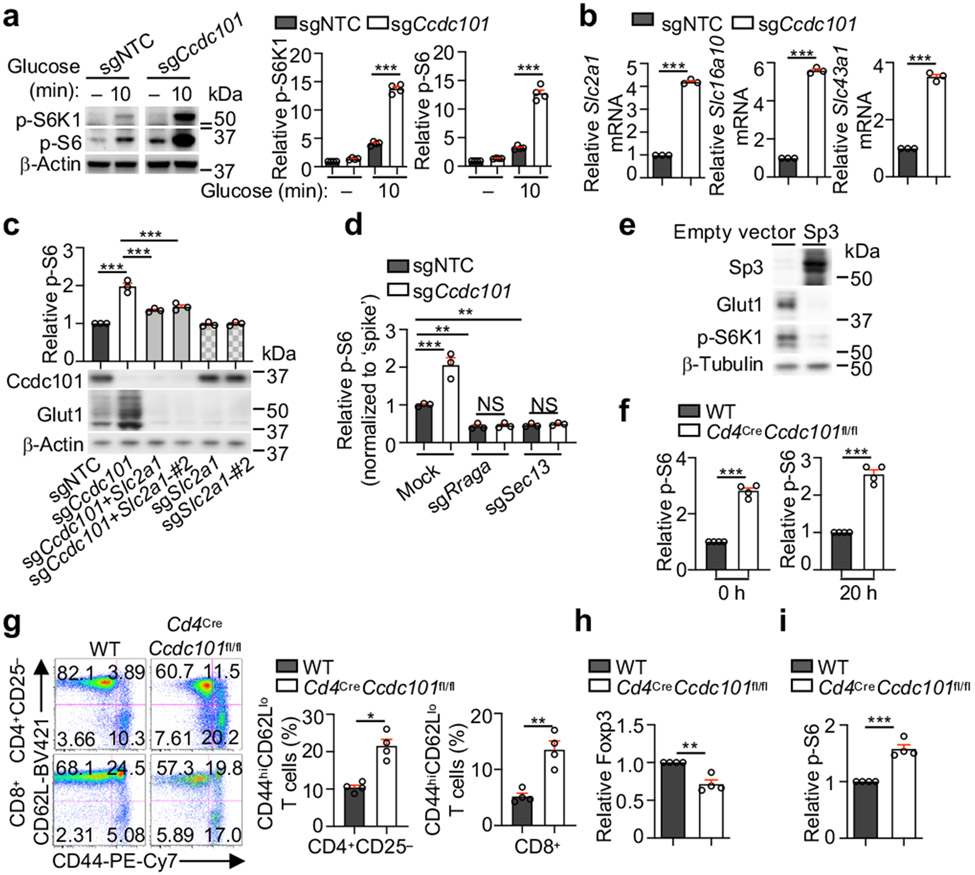
Figure 4. SAGA complex suppresses nutrient transporter expression and mTORC1 activation.
(a) Immunoblot analysis and quantification of relative p-S6K1 and p-S6 in sgNTC- or sgCcdc101-transduced cells after glucose stimulation (n = 4 samples each group). (b) Slc2a1, Slc16a10 or Slc43a1 mRNA expression in sgNTC- and sgCcdc101-transduced cells after α-CD3/CD28 stimulation for 20 h (n = 3 samples each group). (c) Indicated sgRNA-transduced cells were stimulated with TCR for 3 h to quantify relative p-S6 level. Lower, immunoblot analysis of Ccdc101 and Glut1 expression (n = 3 samples each group). (d) sgNTC- or sgCcdc101 (both Ametrine+)-transduced cells were co-transduced with sgRraga or sgSec13 (both GFP+), mixed with sgNTC (mCherry+; ‘spike’)-transduced cells, and stimulated with TCR for 3 h to examine relative p-S6 level (n = 3 samples each group). (e) Immunoblot analysis of indicated protein expression in induced Treg cells transduced with indicated retrovirus. (f) Quantification of relative p-S6 level in freshly-isolated naïve (0 h) or α-CD3/CD28-stimulated (20 h) WT and Ccdc101-deficient CD4+ T cells (n = 4 mice per group). (g) Flow cytometry analysis and quantification of frequencies of effector/memory (CD44hiCD62Llo) subsets in splenic CD4+Foxp3− and CD8+ T cells from indicated mice (n = 4 mice per group). (h, i) Quantification of relative Foxp3 expression (h) or p-S6 levels (i) in splenic CD4+Foxp3+ Treg cells from indicated mice (n = 4 mice per group). Mean ± s.e.m. (a–d, f–i). NS, not significant; *P < 0.05; **P < 0.01; ***P < 0.001; two-tailed unpaired Student’s t-test (b, f–i) or one-way ANOVA (a, c, d). Data are representative of two (b–e), or pooled from two (a) or three (f–i) experiments.

