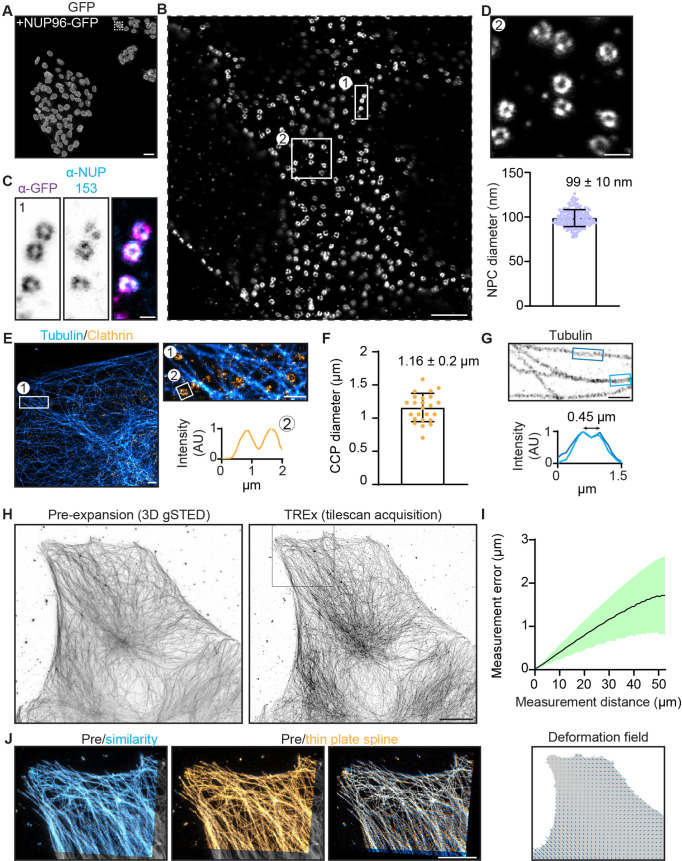
Figure 3. Characterization of expansion isotropy using Ten-fold Robust Expansion Microscopy (TREx).
(A) U2OS knock-in cells with homozygous NUP96-GFP, amplified with anti-GFP antibodies. (B) One nucleus from boxed region of (A), imaged by confocal microscopy after TREx. (C) High-resolution view of several nuclear pores from boxed region (1) of panel (B), showing both anti-GFP (magenta) and anti-NUP153 (endogenous nuclear pore protein, cyan) staining. (D) High-resolution view of several nuclear pores from boxed region (2) of panel (B) (top). Distribution of diameters of individual nuclear pores (bottom), corrected for the macroscopic expansion factor of 9.5×. N = 60 nuclear pore complexes (NPCs) from three spatially separated cells. (E) U2OS cells stained for clathrin heavy chain and tubulin, representative line scan over clathrin-coated pit (CCP) showing central null. (F) Quantification of CCP diameter. Plotted mean ± SD (1.16 ± 0.2 µm) of 25 CCPs from five cells (two independent experiments). (G) High-resolution view of microtubules in extracted COS7 cell and corresponding line scans with mean peak-to-peak distance indicated. (H) Maximum projection of pre-expansion 3D gSTED acquisition (left) and maximum projection of tilescan acquisition (42 tiles, post-expansion size ~750 × 650 µm) of the same cell post-expansion (right). (I) Post-expansion single field of view, as indicated with magenta box in (D), aligned with the pre-expansion image (gray) by similarity transformation (cyan) or thin plate spline elastic transformation (orange). Right shows overlay of similarity and elastic transformation to illustrate local deformations. (J) Quantification of measurement errors of the stitched dataset due to nonuniform expansion. Mean error for a given measurement length (black line) ± SD (shaded region). The residual elastic deformation field is shown below. Scale bars (corrected to indicate pre-expansion dimensions): (A) 50 µm, (B) ~1 µm, (C) ~100 nm, (D) ~200 nm, (E) (overview) ~1 µm, zooms (E) and (G) ~500 nm, (H) ~10 µm, (J) ~5 µm.

