Abstract
Background
The first-in-class treatment PF-06480605 targets the tumor necrosis factor-like ligand 1A (TL1A) molecule in humans. Results from the phase 2a TUSCANY trial highlighted the safety and efficacy of PF-06480605 in ulcerative colitis. Preclinical and in vitro models have identified a role for TL1A in both innate and adaptive immune responses, but the mechanisms underlying the efficacy of anti-TL1A treatment in inflammatory bowel disease (IBD) are not known.
Methods
Here, we provide analysis of tissue transcriptomic, peripheral blood proteomic, and fecal metagenomic data from the recently completed phase 2a TUSCANY trial and demonstrate endoscopic improvement post-treatment with PF-06480605 in participants with ulcerative colitis.
Results
Our results revealed robust TL1A target engagement in colonic tissue and a distinct colonic transcriptional response reflecting a reduction in inflammatory T helper 17 cell, macrophage, and fibrosis pathways in patients with endoscopic improvement. Proteomic analysis of peripheral blood revealed a corresponding decrease in inflammatory T-cell cytokines. Finally, microbiome analysis showed significant changes in IBD-associated pathobionts, Streptococcus salivarius, S. parasanguinis, and Haemophilus parainfluenzae post-therapy.
Conclusions
The ability of PF-06480605 to engage and inhibit colonic TL1A, targeting inflammatory T cell and fibrosis pathways, provides the first-in-human mechanistic data to guide anti-TL1A therapy for the treatment of IBD.
Keywords: TL1A inhibition, transcriptional response, inflammatory bowel disease, ulcerative colitis
Graphical Abstract
Graphical Abstract.
Introduction
Ulcerative colitis (UC) is a chronic inflammatory disease of the large intestine, characterized by diffuse mucosal inflammation. The underlying pathophysiology of this disease results from the interplay of genetic susceptibility in immune mediators and alterations in the gut microbiome.1 Current treatments for UC, including nonselective medicines such as corticosteroids, mesalamine, thiopurines, selective biologic agents (antitumor necrosis factor [TNF]-α, anti-α4β7, and anti-interleukin [IL]-12/23), and small molecule Janus kinase inhibitors, target immune cell activation.2,3 Despite this ever-expanding armamentarium, many patients still ultimately develop refractory disease.3 Therefore, there is an urgent need to develop novel therapeutics that drive mucosal healing and a need to define tissue, blood, and microbiome biomarkers to help guide treatment.
Genome-wide association studies have identified more than 200 genes associated with inflammatory bowel disease (IBD), with many of these genes associated with underlying dysregulated immunoregulatory functions.4 One of the strongest genetic variants associated with IBD exists in the tumor necrosis factor superfamily member 15 (TNFSF15) locus.5 In Crohn’s disease, TNFSF15 variants confer a higher risk for more aggressive, penetrating, fibrostenotic, and perianal disease complications.6 The TNFSF15 gene, also known as TNF-like ligand 1A (TL1A), has been linked to the pathogenesis of several autoimmune diseases—including psoriasis, rheumatoid arthritis, and multiple sclerosis—implicating its broad role in human inflammatory diseases. The TL1A is highly expressed in human colonic tissue during active colitis,7 but the functional implications of TL1A in UC remain largely unknown.
Preclinical studies have revealed a central, yet pleiotropic, role for TL1A in augmenting the immune response during inflammation, which highlighted the potential for therapeutic targeting in IBD. Although early studies have shown a pathogenic role for TL1A overexpression in driving inflammatory T helper 1 (Th1), Th17, Th9, and group 2 innate lymphoid cell (ILC2) responses,8,9 more recent reports in mouse models of acute colitis and ileitis have revealed a contrasting protective role for endogenous TL1A in supporting anti-inflammatory T regulatory cells and group 3 innate lymphoid cell (ILC3) function.10,11 In addition to the impact on lymphoid cells, TL1A acts in synergy with nucleotide-binding oligomerization domain 2 ligands to regulate macrophage production of inflammatory cytokines.12 This ability of TL1A to act broadly as a costimulator in augmenting cytokine secretion highlights its central role in regulating inflammatory response.13 Moreover, mouse models of colitis have revealed a key role for TL1A in intestinal fibrosis.14 Collectively, the central role for TL1A in augmenting both innate and adaptive immune pathways critical for IBD and intestinal fibrosis identified the potential for therapeutic targeting, but no studies to date have assessed the mechanisms underlying the potential efficacy of TL1A inhibition in humans.
We recently completed a phase 2a trial, TUSCANY, in which participants with moderate to severe UC were treated with PF-06480605, an anti-TL1A antibody, every 2 weeks for 7 doses and demonstrated significant endoscopic improvement15. Here, we provide an analysis of tissue transcriptomic, peripheral blood proteomic, and fecal metagenomic data from this study. The results identify selective reduction in tissue Th17 and fibrosis pathways as targets of anti-TL1A treatment in participants achieving endoscopic improvement. Correlative changes in the blood proteome reflect tissue and systemic changes in participants achieving endoscopic improvement. Although the overall structure of the microbiome is unchanged, anti-TL1A treatment reduces the abundance of key pathobionts associated with intestinal inflammation. These results provide the first mechanistic insights underlying the efficacy of therapeutically blocking TL1A in human UC and may inform a precision medicine approach for the clinical management of patients with UC treated with anti-TL1A treatment.
Materials and Methods
This multicenter, single-arm, open-label study evaluated the safety, tolerability, efficacy, pharmacokinetics, and immunogenicity of PF-06480605 (clinicaltrials.gov: NCT02840721).
As described in a separate article including the clinical results,15 the study design of this study evaluated PF-06480605 in a total of 50 treated participants who had a diagnosis of moderately to severely active UC for ≥4 months. Participants intravenously received 500 mg of PF-06480605 every 2 weeks and received 7 doses in total, followed by a 3-month follow-up period. The primary safety and efficacy end points were the incidence of adverse events and week-14 endoscopic improvement (EI; Mayo endoscopic subscore of 0 or 1), respectively. In this study, secondary end points included total soluble TL1A (free/drug-bound), PF-06480605 concentrations, the incidence of antidrug and neutralizing antibodies, and changes in fecal calprotectin and high-sensitivity C-reactive protein. Histology was also assessed at week 14.
Samples
Colonic mucosal biopsies were collected from participants during each colonoscopy at screening, at week 14, and at early withdrawal; each was placed into separate sample collection tubes. During each procedure, 12 to 15 biopsies were taken from abnormally inflamed colonic mucosa, and 3 biopsies were taken from normal-appearing mucosa, excluding frankly ulcerated areas. If 15 to 18 biopsies could not be collected, samples from inflamed tissues were prioritized.
Pretreatment biopsies were obtained from the most affected area 15 to 30 cm from the anal verge. Post-treatment samples were obtained from approximately the same anatomical location as the baseline assessment, and the approximate distance from the anal verge was recorded.
A total of 8 biopsies for exploratory tissue protein biomarkers, mRNA, and microbiome analysis were collected during each colonoscopy to assess RNA transcripts and proteins associated with IBD, fibrosis, inflammation, and the mechanism of drug activity. The remaining biopsies were analyzed to assess histology.
Tissue sample requirements were established to enable assessments of protein TL1A (5 inflamed tissue samples); mRNA (1 inflamed tissue sample and 1 normal-appearing mucosa sample); and microbiome analysis (1 inflamed tissue sample).
Serum samples to measure serum TL1A were collected longitudinally15. Baseline and week-14 results are presented in this article.
Bioanalytical Methods
An immunoprecipitation liquid chromatography-tandem mass spectrometry (LC-MS/MS) assay has been developed and validated to measure total soluble TL1A in human serum.16
An immunoprecipitation LC-MS/MS assay was developed and validated to measure free soluble TL1A in human colon tissue. Tissue samples were homogenized using a BioSpec BeadBeater, and free TL1A was isolated from human colon tissue using immuno-enrichment technology. The samples were incubated and shaken with a biotinylated DcR3 capture reagent at 4°C overnight. Dynabeads T1 streptavidin-coupled magnetic beads were added to each sample and incubated at room temperature for 1 hour to extract TL1A bound to biotinylated DcR3capture reagent. The beads were then washed 3 times, followed by elution of free soluble TL1A from the beads under acidic conditions. After the addition of the extended-sequence, stable, isotope-labeled peptide (internal standard) to each sample, trypsin digestion was performed at 37°C overnight. All sample processing was performed in a 96-well format on an automated liquid handling robot (Microlab STAR, Hamilton, Bonaduz, Switzerland). A 120-µL sample extract was injected onto a 3-dimensional Dionex UltiMate 3000 nano-LC system comprising a conventional flow immunoaffinity capture with a custom 2.1-mm inner diameter (ID) antipeptide antibody column, in addition to an elution to a 300-µm ID C18 trap column and a 75-µm ID nano-LC column. The signature peptide was eluted from the nano-LC column with a mobile phase gradient at a flow rate of 0.6 µL/min. A Thermo Scientific Vantage Triple Quadrupole mass spectrometer, with a Thermo Scientific EASY-Spray ionization source, was used for MS/MS analysis. One selected transition for the signature peptide was used to quantify TL1A in the positive ion mode, and all data were normalized to the internal standard response. The validated analytical range was 10 to 400 pg/mL. The tissue assay was qualified and was precise and accurate with an interbatch imprecision of <14.6% and interbatch inaccuracy of –0.8% to 6.0% at all concentrations investigated during assay validation. Samples with low but valid values were used in the final analyses. For the samples that were below the level of quantification (BLQ), sample values were rescued by testing whether the total protein levels of these samples were accurately measured; and if the total protein of these samples was measured with confidence, the imputed values of the BLQ/√2 were used in the association analyses. Otherwise, the samples were labeled as missing.
Transcriptomic profiling of gut biopsies from participants with UC was evaluated using RNA sequencing technology. All samples were extracted from blood and tissue, and the library was prepared by BGI Americas Corporation using a GLOBINclear+TrueSeq Stranded mRNA sample preparation kit. Next generation sequencing was performed using the Illumina HiSeq4000 with a read length of 100 PE, resulting in 40 million reads.
Transcriptomic analysis was performed by estimating the fold change (FC) for the comparisons of inflamed and noninflamed tissue at baseline and change from baseline under the general framework for linear models using limma and voom packages.17 The P values from the paired t test were adjusted for multiple hypotheses using the Benjamini-Hochberg procedure, which controls for the false discovery rate (FDR).18 Differences in baseline gene expression between inflamed and noninflamed biopsies were calculated. The change from baseline in responders and nonresponders was calculated using a linear mixed-effect model using time, tissue, and response (defined as responder and nonresponder) as factors. This analysis was then used to correlate transcriptomic changes with clinical response. The primary efficacy end point was the endoscopic index at week 14, defined by a Mayo endoscopic subscore of 0 or 1 without friability. To ensure objective and consistent assessment of the primary end point, the Mayo endoscopic subscore was determined through blinded, centrally read colonoscopy images with built-in adjudications.
Enrichment analyses using Ingenuity Pathway Analysis (IPA; QIAGEN, Silicon Valley, California) were performed using treatment-modulated genes that passed a significance cutoff to further explore the potential mechanisms underlying the findings. The P values were calculated using a right-tailed Fisher exact test to determine statistically significant over-representation of genes in enriched pathways. The z scores as reported by IPA predict the activation (positive z score) or inhibition (negative z score) of pathways based on the observed gene expression changes and the underlying knowledge in the database. A P value of < .05 and a z score >2 were established as significant cutoffs for pathway enrichment.
Cell-type Deconvolution
Sample-level estimation of cell-type contributions to the measured expression were inferred from bulk gene expression data using a computational deconvolution procedure (CytoReason Inc, Tel Aviv, Israel). Briefly, a manually curated compendium of approximately 9000 RNA-seq and Affymetrix expression arrays comprising sorted cells from different tissues, conditions, and single-cell data sets collected from select peer-reviewed publications and proprietary sources were used in a machine-learning framework to build tissue-specific signatures, allowing the simultaneous capture of information about the contribution of multiple cell types to the measured bulk expression in the tissue. The machine-learning framework splits the data into training, testing, and validation sets and iteratively fine-tunes the signatures so that they are both sensitive and specific enough for each predefined cell type. This signature generation pipeline is run separately by tissue with a mean overlap per cell type of signature genes across tissues of approximately 30%. Flow cytometry comparison with deconvolved estimates of whole blood gene expression data sets (ImmPort Id: SDY112, SDY315, and SDY478) yielded high correlations compared with gating statistics when run on blood samples using a signature generated specifically for blood (bi-weight mid-correlation across cell types = X – Y; Supplementary Figure 1) and also performed robustly for estimating immune cells using a gut-tailored signature (bi-weight mid-correlation = X − Y). To ensure a high performance of signatures in both statistical and biological aspects for cases in which flow cytometry data are not available (eg, nonimmune gut cells such as fibroblasts and epithelial cells) or performance vs manual gating appears low, cell signatures must pass at least 2 out of 3 independent tests: first, for correlations between cell contributions and known markers typically used for cell-type identification, signature was tested across multiple held-out gene expression data sets of bulk tissue and comparatively across cell types; second, signature was tested via in-silico simulations of complex tissues generated from single- and sorted-cell experiments; third, signature was tested against a held-out compendium of data sets across different disease and tissue conditions, for which there is a predefined contrast (ie, known biological expectation). Supplementary Table 1 contains individual cell-type performance.
Differential cell-type abundance analyses were performed based on the sample-level estimation of cell-type abundances. A nonparametric Wilcoxon rank-sum test was performed to compare the estimated cell-type abundances between pre- and post-treatment samples from 4 groups: inflamed tissues within responders, noninflamed tissues within responders, inflamed tissues within nonresponders, and noninflamed tissues within nonresponders. Multiple hypothesis correction across all 37 cell types was applied per group using FDR. In addition, we fitted linear models of cell-type contributions at week 14 to the Mayo endoscopic subscore at week 14 to detect correlations. All P values were adjusted using the Benjamini-Hochberg FDR procedure for all 37 cell types considered.
Protein Analysis
Protein profiling from blood samples was analyzed using Myriad/RBM lab menu and Myriad/RBM Simoa services. There was a total of 63 proteins in the panel after removing proteins with a high rate of missing values (>50%). A total of 52 out of 63 proteins qualified for downstream analysis, and 10 out of 63 proteins were measured by Myriad/RBM Simoa services. A linear mixed-effect model was used to analyze the differences of log2 transformed protein levels in blood samples between baseline and weeks 2, 8, and 14 in the responder and nonresponder cohorts, respectively (the model takes participants as a random effect, duration of treatment as a fixed effect, and adjusts age, gender, and smoker status as covariates). All P values were adjusted for multiple hypotheses using the Benjamini-Hochberg procedure, which controls for FDR.
Metagenomics Sample Collection and Processing
Stool samples were stored with a preservative buffer for stability of microbial content, followed by DNA extraction following Enterome standards and quality control.19 Next, whole metagenome sequencing was performed using Illumina platforms to achieve at least 40 million reads/sample. The quality of raw data in the fastq files was assessed using FastQC.20 The raw sequence was used for taxonomy classification by GOTTCHA 1.0c21 using the v20150825 bacterial database (GOTTCHA_BACTERIA_c4937_k24_u30_xHUMAN3x.species.tar.gz). The extracted results were normalized against the library size, and differential abundance analysis was processed using a linear mixed-effect model with the lme function in the R package, nlme v3.1–143. The P value was adjusted by the Benjamini-Hochberg FDR procedure.
The beta diversity was estimated using 162 identified bacterial species. The bray.part function in the R package, betapart,22 was used to calculate the Bray-Curtis dissimilarity among all samples.
The betadisper function in the R package, vegan,23 was used to assess the beta diversity using a test for the homogeneity of variances of the samples based on the dissimilarities. The P value was calculated from the analysis of variance model of pre- and post-treatment samples.
Ethical Considerations
The final protocol and any amendments were reviewed and approved by institutional review boards/independent ethics committees at each participating center. The study was conducted in compliance with the Declaration of Helsinki and with all International Council for Harmonisation Good Clinical Practice guidelines. All participants provided written, informed consent to participate.
Results
Target Engagement of Anti-TL1A in Colonic Tissue Downregulates Inflammatory Th17, Th1, and Fibrotic Pathways in PF-06480605 Treatment Responders
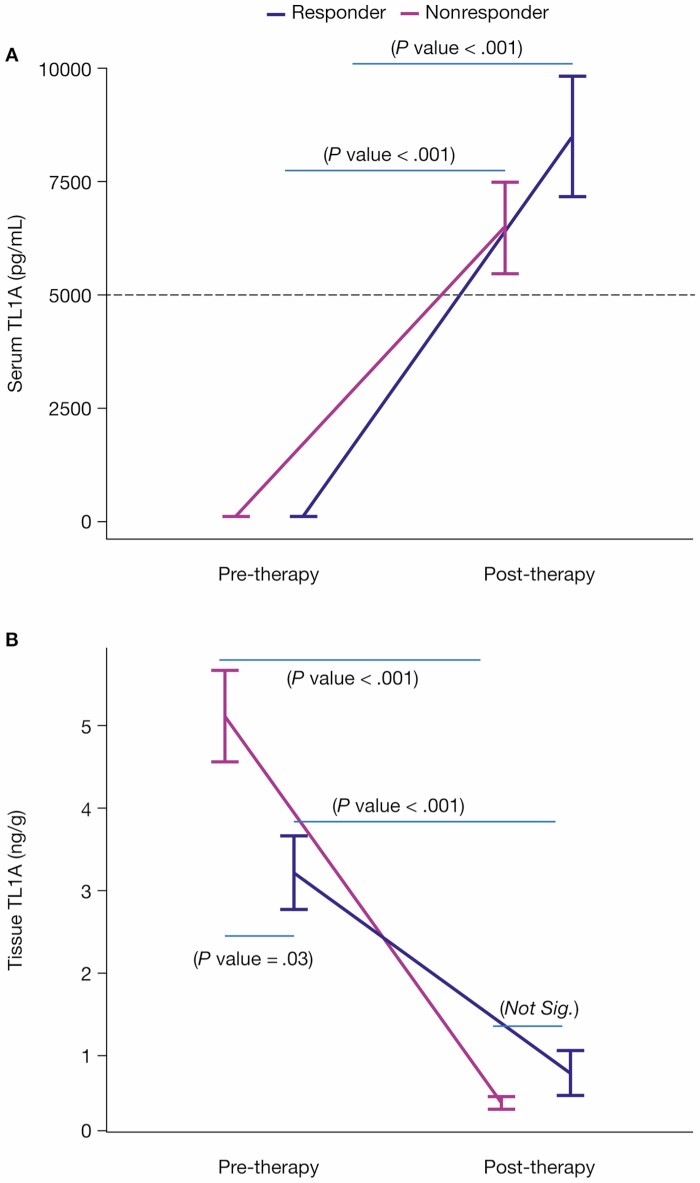
Given the clinical efficacy of the anti-TL1A PF-06480605 to achieve endoscopic improvement in the treatment of refractory UC, we sought to evaluate the underlying biomarkers of this effect in intestinal tissue15. First, we validated the target engagement of anti-TL1A binding in vivo by longitudinally measuring total TL1A (TL1Afree + TL1APF-06480605-bound) in serum pre- and post-treatment. The increase in serum total TL1A (Figure 1A) reflects the target engagement and stabilization of TL1A by PF-06480605 (5544.1% in responders, 6651.7% in nonresponders). Next, we assessed the impact of PF-06480605 in the intestine by measuring free soluble TL1A (Figure 1B) levels in colon tissue pre- and post-treatment at week 14. The significant reduction in free TL1A (75.3% in responders, 91.5% in nonresponders) validates the efficacy of PF-06480605 in targeting tissue TL1A.
Figure 1.
Anti-TL1A demonstrates target engagement in serum and tissue. A, Serum total TL1A levels were measured at baseline in endoscopic improvement responders (n = 18) and nonresponders (n = 32) and at week 14 in endoscopic improvement responders (n = 18) and nonresponders (n = 29). Serum total TL1A increased post-treatment in both endoscopic improvement responders (P < .001) and nonresponders (P < .001). Serum total TL1A was not significantly different between responders and nonresponders at both pre-treatment (P = .14) and post-treatment (P = .23). B, Tissue TL1A levels were measured at baseline in endoscopic improvement responders (n = 18) and nonresponders (n = 32) and at week 14 in endoscopic improvement responders (n = 16) and nonresponders (n = 30). Tissue TL1A decreased post-treatment in both endoscopic improvement responders (P < .001) and nonresponders (P < .001). Tissue TL1A was significantly different between responders and nonresponders pretreatment (P = .03) and was not significantly different post-treatment (P = 1). The responders and nonresponders with averages and standard errors were intentionally displayed side by side for both serum and tissue TL1A measured pre- and post-treatment to provide easy and clear comparison. Abbreviation: TL1A, tumor necrosis factor-like ligand 1A.
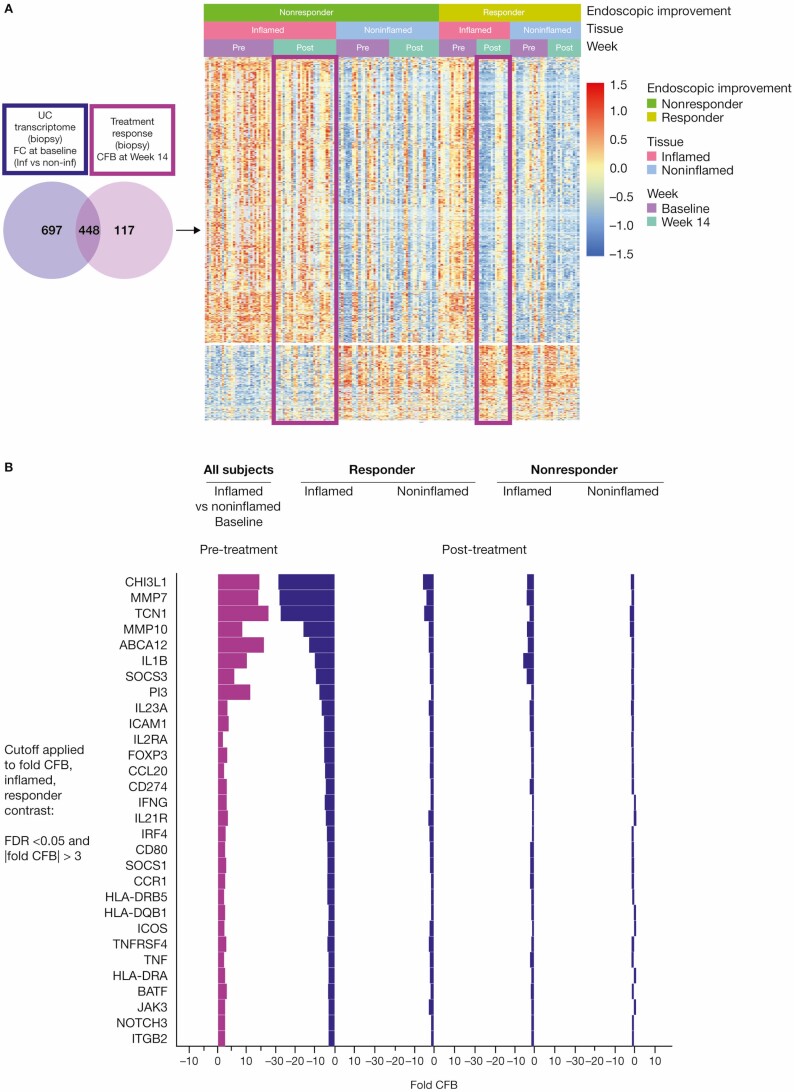
Given the efficacy of PF-06480605 in targeting tissue TL1A, we next sought to identify genes that were modulated after anti-TL1A treatment by performing RNA sequencing of biopsies from both inflamed and noninflamed colon tissue. We defined differentially regulated gene sets based on disease activity (pretreatment inflamed vs noninflamed; UC transcriptome) and gene changes after anti-TL1A treatment (pre- vs post-treatment inflamed intestine [FC >2, FDR <0.05]; TL1A treatment transcriptome; Figure 2A, left). Of the 565 differentially regulated genes identified in the TL1A treatment transcriptome, we identified 448 overlapping genes with the UC transcriptome (UC-TL1A treatment transcriptome).
Figure 2.
Anti-TL1A transcriptomics demonstrates colonic molecular disease resolution. A, Left: the UC transcriptome shown in purple represents the FC of inflamed vs noninflamed biopsies at baseline; a total of 1115 genes were identified. The anti-TL1A transcriptome shows the genes that are modulated post-treatment (light purple) and represents the CFB at week 14 in the biopsy; a total of 565 genes were identified. In total, 448 disease-specific anti-TL1A treatment-modulated genes were identified. The genes represented in the Venn diagram met a significant cutoff FDR < 0.05 and |FC| >2. Right: a heatmap of differential genes identified in the Venn diagram is presented in clusters by endoscopic improvement responders and nonresponders in inflamed and noninflamed biopsies pre- and post-treatment. B, Shows that mechanistic and cellular pathways impacting inflammation and fibrosis genes were associated with anti-TL1A treatment in tissue. Significant genes in mechanistic and cellular pathways that were modulated in endoscopic improvement inflamed biopsies post-treatment with anti-TL1A were identified by CFB with FDR <0.05 and |FC| >3. Abbreviations: CFB, change from baseline; FC, fold change; FDR, false discovery rate; IL, interleukin; TL1A, tumor necrosis factor-like ligand 1A; UC, ulcerative colitis.
Within this overlapping set of differentially regulated genes, we identified gene sets indicative of mechanistic and cellular pathways associated with response to TL1A inhibition with PF-06480605 in colonic tissue. In particular, the transcriptomic results in responders showed significant downregulation of IL-1B, IL-23A, IFNG, IL-12RB1, IL-21R, IRF4, and BATF (Figure 2B), highlighting the potential impact of TL1A inhibition on recruitment, survival, expansion, and/or tissue Th17 and Th1 cell differentiation.24 The effect may result from reducing the costimulatory effect of TL1A on cytokine production or the feedback effect on antigen-presenting cells in tissue. Supporting the latter, CD80/86, HLA-DRB5/DQB1/DRB1, HLA-DRA, CD40, and ICOS were significantly downregulated in responders, implicating a potential role for TL1A in modulating antigen-presenting cells in situ. Finally, these data highlight a set of genes, including MMP7, MMP10, and CHI3L, associated with the remodeling of the extracellular matrix and fibrosis that were significantly downregulated in responders.
Figure 2A (right) depicts the global pattern of expression data with respect to initial disease status, treatment effect, and remaining overall expression, stratified by response. Anti-TL1A treatment elicits a clear pattern of inverse regulation of disease genes under treatment and a residual signature commensurate with response status (Supplementary Figure 2).
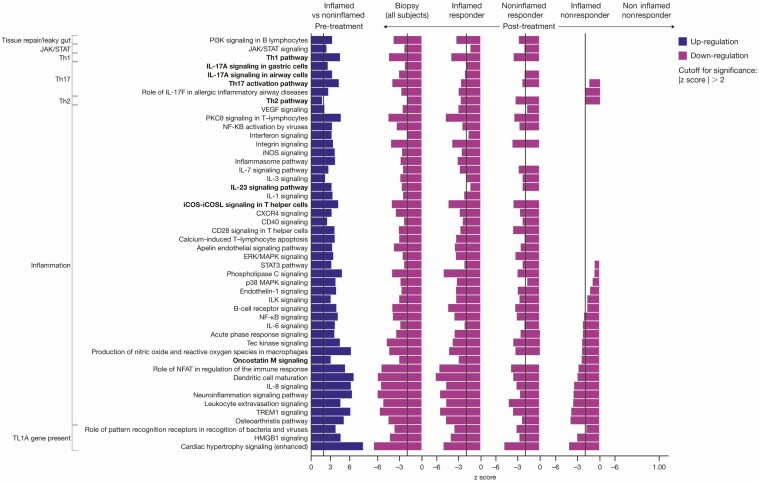
Using the set of 448 differentially expressed genes in the treatment response, pathway analysis was performed using IPA, which identified the downregulation of signaling pathways (z score ≤ −2) that target IL-17/IL-23, Th1, PI3K, NF-kB, and ERK/MAPK (Figure 3). In addition, macrophage-reactive oxygen species, dendritic cell (DC) maturation, and oncostatin M signaling pathways were significantly reduced in participants with and without endoscopic improvement.
Figure 3.
The Th1, Th2, and IL-23 pathway downregulation was enriched in responders post-treatment with TL1A. Pathway analysis was performed using IPA with a significance cutoff |z score| >2. Abbreviations: IL, interleukin; IPA, Ingenuity Pathway Analysis; TL1A, tumor necrosis factor-like ligand 1A.
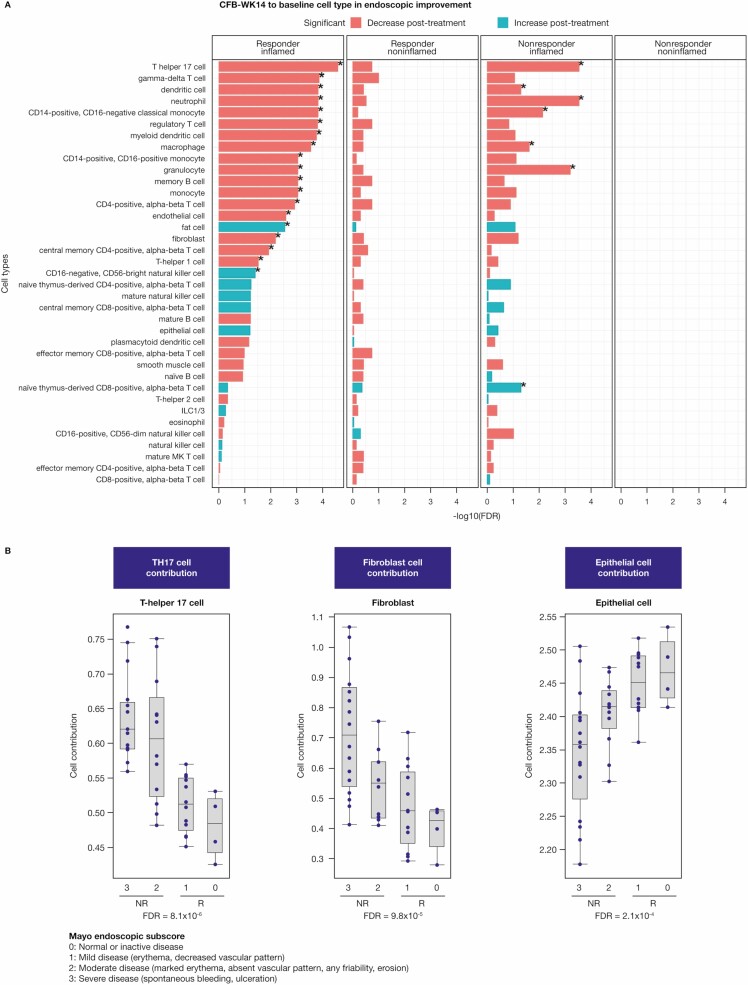
Finally, deconvolution in bulk expression data was done to obtain estimates of differential cell-type abundance under treatment. Consistent with gene and pathway analysis, we identified a significant decrease in Th17 cell (FDR = 2.55E-5), monocyte (FDR = 0.0009), DC (FDR = 0.0001), macrophage (FDR = 0.0002), and memory B cell (FDR = 0.0009) abundance with endoscopic improvement after anti-TL1A treatment (Figure 4A). Notably, lower Th17 cell and fibroblast estimates were significantly associated with better clinical outcomes (measured by Mayo endoscopic subscore) at week 14, whereas higher epithelial cell estimates correlated better with clinical outcome (Figure 4B). All cell types deconvolved and analyzed in Figure 4 passed the cell signature quality assessment (Supplementary Table 1).
Figure 4.
Deconvolution of biopsy transcriptomics identifies adaptive and innate cellular components after anti-TL1A treatment. A, Cell-type estimation of the CFB at week 14 in inflamed and noninflamed biopsies using bulk RNA sequencing in endoscopic improvement responders and nonresponders using the CytoReason deconvolution method. Cell types shown with (*) have an FDR <0.05. B, Strong correlation of lower Th17 and fibroblast cell-type estimates with better clinical outcomes measured by Mayo endoscopic subscore at week 14. Higher epithelial cell estimates also show a corresponding correlation. The FDR was based on a linear model of cell-type estimates at week 14 with endoscopic subscores and was adjusted for all 37 estimated cell types. All cell types deconvolved and analyzed in Figure 4 passed the cell signature quality assessment (Supplementary Table 1). Abbreviations: CFB, change from baseline; FDR, false discovery rate; ILC, innate lymphoid cell; TL1A, tumor necrosis factor-like ligand 1A.
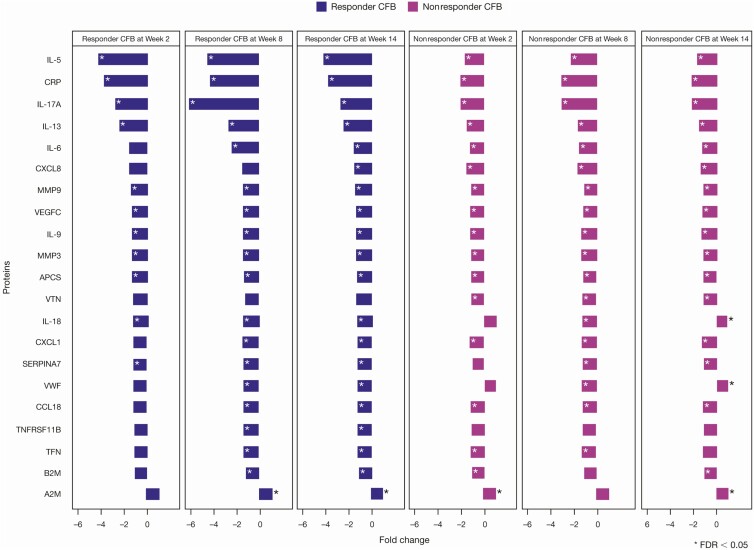
Given the impact of anti-TL1A on tissue, we sought to evaluate the potential for an immune biomarker of endoscopic improvement in the peripheral blood. We performed a proteomic differential analysis of weeks 2, 8, and 14 from baseline and identified a total of 20 out of 52 proteins with FDR <0.05 in participants with endoscopic improvement after anti-TL1A treatment (Figure 5). Concordant with the tissue transcriptomic results, proteomic analysis showed a significant decrease in IL-17A both in participants with endoscopic improvement (FDR = 4.51E-11) and in participants with no endoscopic improvement (FDR = 9.23E-08) but with a greater reduction in participants with endoscopic improvement after anti-TL1A treatment (P = .017). Furthermore, responders had significant changes in 11 of the 52 proteins compared with nonresponders at week 14 with P < .05 (Supplementary Figure 3). In addition, peripheral blood analysis showed a robust reduction in type 2–associated cytokines, IL-5, and IL-13, which was not reflected in the tissue transcriptional response. These results highlight the potential for peripheral blood markers to reflect a tissue transcriptional response signature of reduced Th17 cell activation and a reduction in a systemic type 2 response that corresponds with endoscopic improvement.
Figure 5.
Proteomics identified inflammatory blood biomarkers of endoscopic improvement. A total of 52 out of 63 proteins were evaluated and significant proteins were selected based on the CFB at week 14 in endoscopic improvement responders with FDR <0.05. All proteins with (*) have an FDR <0.05. Abbreviations: CFB, change from baseline; FDR, false discovery rate; IL, interleukin.
Fecal Metagenomics Define Microbiome Changes Following Anti-TL1A (PF-06480605) Treatment
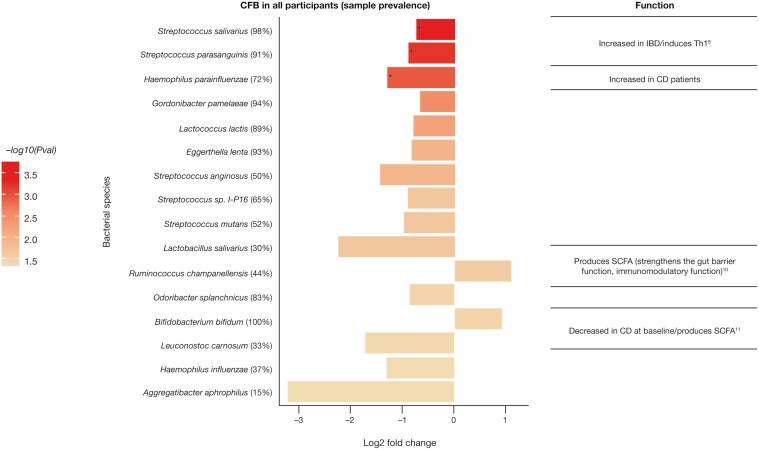
Distinct changes exist in the active UC microbiome, characterized by reduced diversity and an expansion in IBD-associated pathobionts. To characterize the bacterial species in the intestinal microbiome that are modulated in response to anti-TL1A treatment, we performed metagenomic sequencing of fecal DNA samples pre- and post-treatment (Supplementary Figure 4). Principal coordinate analysis based on Bray-Curtis dissimilarities of samples from pre- and post-treatment showed no significant change with a P value of .53 using a test for the homogeneity of variances between pre- and post-treatment with anti-TL1A (Supplementary Figure 4). However, longitudinal abundance analysis revealed a significant change in bacterial species post-treatment (Supplementary Figure 5); there was no evidence of a difference in bacterial species between responders and nonresponders using species-level data (data not shown). We analyzed the differential abundance of taxa in all participants pre- and post-treatment and identified a significant decrease in the abundance of Streptococcus salivarius (FDR = 0.02), S. parasanguinis (FDR = 0.02), and Haemophilus parainfluenzae (FDR = 0.035; Figure 6). In contrast, an increase in short-chain fatty acid-producing Ruminococcus and Bifidobacterium bifidum (nominal P values of .022 and .028, respectively) occurred post-treatment (Figure 6).
Figure 6.
Reduction in the intestinal pathobiont post-treatment with anti-TL1A. Bacterial species identified that the CFB (P value ≤ .05), –log10(P value) = 1.3 in fecal samples in all participants. The top 3 bacterial species (*) are based on the threshold using FDR ≤0.05. Abbreviations: CFB, change from baseline; FDR, false discovery rate; TL1A, tumor necrosis factor-like ligand 1A.
Discussion
Tumor necrosis factor-like ligand 1A has emerged as a central target for IBD treatment, with pleiotropic effects in regulating both adaptive and innate immunity in preclinical models. However, the underlying mechanistic basis for anti-TL1A treatment in human IBD remains unknown. Our findings demonstrate that anti-TL1A treatment results in downregulated tissue Th17 and Th1 cytokine response. Concordant with in vitro and animal model data,7,8 the results reveal a robust and selective effect of TL1A inhibition on Th17-regulated genes in human colonic tissue. Note that the reason nonresponders do not respond to anti-TL1A treatment may be because their disease is not caused by factors in the TL1A pathway despite the pharmacological effect of PF-06480605 both in the serum and tissue.
Our results reveal that anti-TL1A treatment also regulates innate myeloid cell immunity in humans. These findings are consistent with previous studies revealing a critical role for TL1A in human macrophage and osteoclast differentiation.25–27 In particular, the data show that IL-1B is a significant transcriptional target of anti-TL1A treatment. These findings are concordant with mechanistic in vitro data, in which autocrine TL1A signaling in macrophages regulates noncanonical IL-1B.12 Moreover, CytoReason deconvolution cell-type analyses highlight tissue macrophages and DCs as a central target of anti-TL1A treatment. Further work will be needed to determine if these cells represent a significant target of anti-TL1A treatment or modulate therapeutic response.
Recent studies have highlighted the impact of TL1A signaling in ILCs, particularly ILC2 and ILC3.28,29 Type 2 cytokines (including IL-5 and IL-13) have been identified as targets of constitutive TL1A overexpression and may reflect the ILC2 tissue source in the small intestine or the lung.30 Similarly, a reduction in peripheral blood IL-9 may reflect a link between TL1A and allergic Th9 disease.31 TL1A-driven activation of ILC2-produced IL-13 drives intestinal inflammation in animal models.32 In addition, TL1A regulates ILC3 effector function, including IL-22, granulocyte-macrophage colony-stimulating factor, and OX40L regulation of Th1.11 Although our colonic tissue analysis did not identify a specific impact on ILCs, the robust reduction of IL-5 and IL-13 in peripheral blood may reflect systemic ILC2 or Th2 effects of anti-TL1A treatment. This will be relevant for IBD and other allergic and inflammatory diseases. Additional high-resolution studies are needed to define the impact of anti-TL1A treatment in situ.
Fibrotic complications remain a major clinical challenge in IBD, and our data support the potential role for anti-TL1A treatment in reducing tissue fibrosis. The TL1A expression is associated with fibrostenosing Crohn’s disease and can activate fibroblasts directly to promote fibrosis associated with inflammation.32–34 Anti-TL1A inhibition in preclinical studies reversed established fibrosis14 and blocked the progression of fibrosis in a transfer T-cell colitis model.35 Stromal responses to TL1A induced by bacterial challenge in murine models can promote mesothelial fibrosis.36 Although our study was too short to determine the clinical impact on intestinal fibrosis, the reduced expression of genes associated with the remodeling of the extracellular matrix and fibrosis following anti-TL1A treatment seen here provide the first-in-human data consistent with these findings. In addition, a significant reduction in IL-13 in peripheral blood may reflect the ability of anti-TL1A treatment to target IL-13-dependent inflammation seen in preclinical models.30 Future studies should include tissue immunohistochemical analysis to assess collagen deposition in UC and Crohn’s disease.
Inflammatory bowel disease is associated with distinct changes in the intestinal microbiome. Studies show that both adherent-invasive Escherichia coli and H. parainfluenzae are increased in participants with active IBD and may contribute mechanistically to the inflammatory response.37 In addition, oral microbes including Haemophilus38 and Streptococcus subspecies show increased colonization during IBD and may contribute to an inflammatory immune response.39 In contrast, strict anaerobic metabolism is reflected in the pathways of bacteria, including Ruminococcus and Bifidobacterium, associated with health, such as the production of short-chain fatty acids.40 Higher relative abundance of the anaerobes Faecalibacterium and Ruminococcaceae is seen in participants in remission after week 6 of ustekinumab treatment compared with participants with active disease.41 Our results highlight a reduction in the opportunist pathobionts associated with IBD, including S. salivarius, S. parasanguinis, and H. parainfluenzae following anti-TL1A treatment, with FDRs of 0.02, 0.02, and 0.035, respectively. Further studies are needed to assess the taxonomic and functional metabolic consequences of these responses to aid in diagnosis and treatment.
Our results highlight the potential role for peripheral blood biomarkers in monitoring endoscopic improvement. In particular, peripheral IL-17A cytokine reduction post-treatment correlates with anti-TL1A efficacy, evidenced by a significant difference between change from baseline in responders vs nonresponders (P = .017), which also reflects the mechanism underlying the tissue transcriptional reduction in the expression of Th17-related genes.
Conclusion
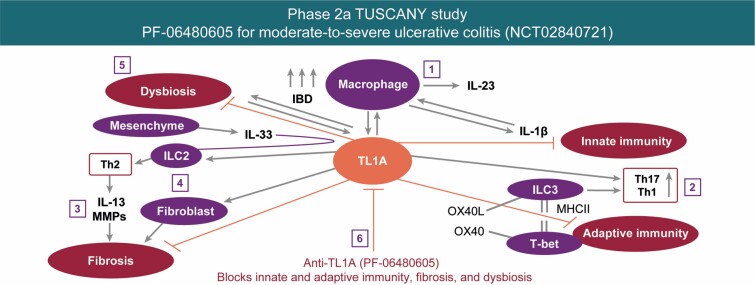
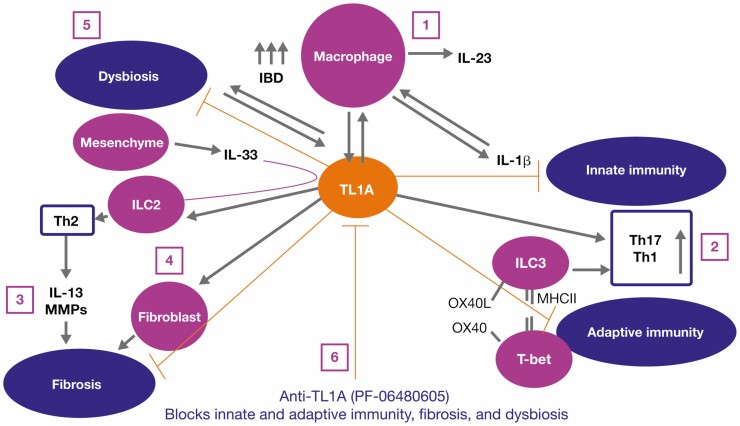
Collectively, these findings provide the first-in-human data defining a potential mechanism of action for anti-TL1A treatment in UC. Taken together, these findings support the proposed mechanism of action for PF-06480605 (Figure 7). This mechanistic insight may potentially help to design tests to effectively stratify and enhance treatment in patients.
Figure 7.
Precision medicine proposed mechanism of action for PF-06480605. We hypothesize the following mechanisms of action for PF-06480605: (1) inflammatory MΦ are increased in IBD and produce IL-23, IL-1B, and TL1A. Interleukin-1B can feed back in an autocrine fashion to promote cytokine production. (2) TL1A stimulates pathogenic Th17 and mediates ILC3 and regulates Th1 through either OX40/OX40L or via the transitioning of ILC3 to ILC1 and the production of interferon gamma. (3) Additionally, TL1A and IL-33 regulate ILC2, which contributes to the Th2-driven IL-13 response, matrix metalloproteinase activation, tissue remodeling, and fibrosis. (4) TL1A stimulates fibroblast proliferation and contributes to fibrosis. (5) By blocking TL1A, we inhibit inflammation, inflammatory macrophage requirement, and fibrosis. Abbreviations: IBD, inflammatory bowel disease; IL, interleukin; ILC, innate lymphoid cell; Inf, inflamed; MΦ, macrophages; TL1A, tumor necrosis factor-like ligand 1A.
Supplementary Material
Acknowledgments
We would like to thank the TL1A clinical team members, Gang Li (clinical Statistician), Christopher Banfield (clin Pharm) for important scientific discussion, Natalie Rath, Anne Marie Gregg, and Carol McCormick for their highly appreciated assistance with operation and biomarker samples. We thank the scientific team at CytoReason for collaborative work on cell estimates. Medical writing support, under the guidance of the authors, was provided by Neil Cockburn, BSc, CMC Connect, McCann Health Medical Communications, and was funded by Pfizer Inc, New York, NY, USA in accordance with Good Publication Practice (GPP3) guidelines (Ann Intern Med. 2015;163:461–64).
Author Contributions
Conceptualization, M.H.Z., F.K., E.J.S., C.L., J.R., S.D., U.S., M.S.V., and K.E.H.; methodology, M.H.Z., L.X., C.L.H., J.Q., D.Z., C.L., J.Z., and K.E.H.; validation, J.Q.; formal analysis, M.H.Z., Z.Y., L.X., M.L.B., X.L., C.L.H., J.Q., M.K., S.D., R.L., and K.E.H.; investigation, J.Q., J.R.A, J.R., E.J.S., M.K., S.D., and K.E.H.; writing—original draft, M.H.Z., D.Z., E.J.S., and K.E.H.; writing—review and editing, M.H.Z., Z.Y., L.X., M.L.B., X.L., C.L.H., J.Z., N.R., F.K., J.Q., D.Z., S.N., C.L., J.R.A, J.R., E.J.S., M.K., S.D., D.E.C., U.S., M.S.V., R.L., and K.E.H.; funding acquisition, U.S. and M.S.V.; resources, J.Q. and U.S.; data curation, N.R., S.N., and J.R.A.; visualization, Z.Y., L.X., J.Q., and S.D.; supervision, M.H.Z., C.L.H., D.Z., J.R., M.K., D.E.C., U.S., and M.S.V.
Funding
This study was sponsored by Pfizer Inc. Employees of the sponsor were involved in study conception, design, and conduct, and in data collection and analysis.
Conflicts of Interest
M.H.Z., Z.Y., L.X., M.L.B., X.L., C.L.H., J.Z., N.R., F.K., J.Q., D.Z., S.N., C.L., D.E.C., U.S., M.S.V., and K.E.H. are employees and stockholders of Pfizer Inc. J.R.A has received consultancy fees from Finch Therapeutics, Janssen, Pfizer Inc, Merck, and Takeda; has received grants from Merck; has served as a site Principal Investigator for Pfizer Inc for this trial. J.R. has no conflicts of interest to declare. E.J.S. has received grants from Abbott (AbbVie), AstraZeneca, Crohn’s and Colitis Foundation of America (CCFA), Celgene, Genentech, Janssen Research & Development, Johns Hopkins University, National Institute of Diabetes and Digestive and Kidney, National Institute of Health, New York Crohn’s Foundation, Pfizer Inc, Seres Therapeutics, UCB, and UCSF-CCFA Clinical Research Alliance; has received corporation consultant/advisory board fees from AbbVie, CCFA, Entera Health, Evidera, GI Health Foundation, Janssen, Protagonist Therapeutics, Seres Health, and Takeda Pharmaceuticals; holds stock in Gilead; has received honoraria from GI Health Foundation and Janssen for nonbranded speaker’s bureau. M.K. has received lecture fees from Alfa-Sigma, Ferring Pharmaceuticals, Janssen, Pharmabest, and Takeda; has received travel/accommodation/meeting expenses from Alfa-Sigma, Ferring Pharmaceuticals, Janssen, Pharmabest, Polish Foundation for Gastroenterology, and Takeda. S.D. has received consultancy fees from AbbVie, Allergan, Amgen, AstraZeneca, Biogen, Boehringer Ingelheim, Celgene, Celltrion, Ely Lilly, Enthera, Ferring Pharmaceuticals, Gilead, Hospira, Janssen, Johnson & Johnson, MSD, Mundipharma, Mylan, Pfizer Inc, Roche, Sandoz, Sublimity Therapeutics, Takeda, TiGenix, UCB, and Vifor. R.L. has received consultancy fees from Janssen, Pfizer Inc, and Takeda.
Data Availability
Upon request, and subject to certain criteria, conditions, and exceptions (see https://www.pfizer.com/science/clinical-trials/trial-data-and-results for more information), Pfizer will provide access to individual de-identified participant data from Pfizer-sponsored global interventional clinical studies conducted for medicines, vaccines, and medical devices (1) for indications that have been approved in the US and/or EU or (2) in programs that have been terminated (ie, development for all indications has been discontinued). Pfizer will also consider requests for the protocol, data dictionary, and statistical analysis plan. Data may be requested from Pfizer trials 24 months after study completion. The de-identified participant data will be made available to researchers whose proposals meet the research criteria and other conditions and for which an exception does not apply, via a secure portal. To gain access, data requestors must enter into a data access agreement with Pfizer.
References
- 1. Plichta DR, Graham DB, Subramanian S, Xavier RJ. Therapeutic opportunities in inflammatory bowel disease: mechanistic dissection of host-microbiome relationships. Cell. 2019;178:1041–1056. [DOI] [PMC free article] [PubMed] [Google Scholar]
- 2. Kashani A, Schwartz DA. The expanding role of anti-IL-12 and/or anti-IL-23 antibodies in the treatment of inflammatory bowel disease. Gastroenterol Hepatol (N Y). 2019;15:255–265. [PMC free article] [PubMed] [Google Scholar]
- 3. Rubin DT, Ananthakrishnan AN, Siegel CA, et al. ACG clinical guideline: ulcerative colitis in adults. Am J Gastroenterol. 2019;114:384–413. [DOI] [PubMed] [Google Scholar]
- 4. de Lange KM, Moutsianas L, Lee JC, et al. Genome-wide association study implicates immune activation of multiple integrin genes in inflammatory bowel disease. Nat Genet. 2017;49:256–261. [DOI] [PMC free article] [PubMed] [Google Scholar]
- 5. Siakavellas SI, Bamias G. Tumor necrosis factor-like cytokine TL1A and Its receptors DR3 and DcR3: important new factors in mucosal homeostasis and inflammation. Inflamm Bowel Dis. 2015;21:2441–2452. [DOI] [PubMed] [Google Scholar]
- 6. Yang DH, Yang SK, Song K, et al. TNFSF15 is an independent predictor for the development of Crohn’s disease-related complications in Koreans. J Crohns Colitis. 2014;8:1315–1326. [DOI] [PubMed] [Google Scholar]
- 7. Bamias G, Jia LG, Cominelli F. The tumor necrosis factor-like cytokine 1A/death receptor 3 cytokine system in intestinal inflammation. Curr Opin Gastroenterol. 2013;29:597–602. [DOI] [PubMed] [Google Scholar]
- 8. Prehn JL, Mehdizadeh S, Landers CJ, et al. Potential role for TL1A, the new TNF-family member and potent costimulator of IFN-gamma, in mucosal inflammation. Clin Immunol. 2004;112:66–77. [DOI] [PubMed] [Google Scholar]
- 9. Zheng L, Zhang X, Chen J, et al. Sustained TL1A (TNFSF15) expression on both lymphoid and myeloid cells leads to mild spontaneous intestinal inflammation and fibrosis. Eur J Microbiol Immunol (Bp). 2013;3:11–20. [DOI] [PMC free article] [PubMed] [Google Scholar]
- 10. Jia LG, Bamias G, Arseneau KO, et al. A novel role for TL1A/DR3 in protection against intestinal injury and infection. J Immunol. 2016;197:377–386. [DOI] [PMC free article] [PubMed] [Google Scholar]
- 11. Castellanos JG, Woo V, Viladomiu M, et al. Microbiota-induced TNF-like ligand 1A drives group 3 innate lymphoid cell-mediated barrier protection and intestinal T cell activation during colitis. Immunity. 2018;49:1077–1089.e5. [DOI] [PMC free article] [PubMed] [Google Scholar]
- 12. Hedl M, Abraham C. A TNFSF15 disease-risk polymorphism increases pattern-recognition receptor-induced signaling through caspase-8-induced IL-1. Proc Natl Acad Sci U S A. 2014;111:13451–13456. [DOI] [PMC free article] [PubMed] [Google Scholar]
- 13. Valatas V, Kolios G, Bamias G. TL1A (TNFSF15) and DR3 (TNFRSF25): a costimulatory system of cytokines with diverse functions in gut mucosal immunity. Front Immunol. 2019;10:583. [DOI] [PMC free article] [PubMed] [Google Scholar]
- 14. Shih DQ, Zheng L, Zhang X, et al. Inhibition of a novel fibrogenic factor Tl1a reverses established colonic fibrosis. Mucosal Immunol. 2014;7:1492–1503. [DOI] [PMC free article] [PubMed] [Google Scholar]
- 15. Danese S, Klopocka M, Scherl EJ, et al. Anti-TL1A antibody PF-06480605 safety and efficacy for ulcerative colitis: a phase 2a single-arm study. Clin Gastroenterol Hepatol. 2021. doi: 10.1016/j.cgh.2021.06.011 [DOI] [PubMed] [Google Scholar]
- 16. Banfield C, Rudin D, Bhattacharya I, et al. First-in-human, randomized dose-escalation study of the safety, tolerability, pharmacokinetics, pharmacodynamics and immunogenicity of PF-06480605 in healthy subjects. Br J Clin Pharmacol. 2020;86:812–824. [DOI] [PMC free article] [PubMed] [Google Scholar]
- 17. Law CW, Chen Y, Shi W, Smyth GK. Voom: precision weights unlock linear model analysis tools for RNA-seq read counts. Genome Biol. 2014;15:R29. [DOI] [PMC free article] [PubMed] [Google Scholar]
- 18. Benjamini Y, Hochberg Y. Controlling the false discovery rate: a practical and powerful approach to multiple testing. J R Statist Soc B. 1995;57:289–300. [Google Scholar]
- 19. Thomas V, Clark J, Doré J. Fecal microbiota analysis: an overview of sample collection methods and sequencing strategies. Future Microbiol. 2015;10:1485–1504. [DOI] [PubMed] [Google Scholar]
- 20.Andrews S. FastQC: a quality control tool for high throughput sequence data. Accessed May 13, 2020. http://www.bioinformatics.babraham.ac.uk/projects/fastqc [Google Scholar]
- 21. Freitas TA, Li PE, Scholz MB, Chain PS. Accurate read-based metagenome characterization using a hierarchical suite of unique signatures. Nucleic Acids Res. 2015;43:e69. [DOI] [PMC free article] [PubMed] [Google Scholar]
- 22. Baselga A. Separating the two components of abundance-based dissimilarity: balanced changes in abundance vs. abundance gradients. Methods Ecol Evol. 2013;4:552–557. [Google Scholar]
- 23. Anderson MJ. Distance-based tests for homogeneity of multivariate dispersions. Biometrics. 2006;62:245–253. [DOI] [PubMed] [Google Scholar]
- 24. Ciofani M, Madar A, Galan C, et al. A validated regulatory network for Th17 cell specification. Cell. 2012;151:289–303. [DOI] [PMC free article] [PubMed] [Google Scholar]
- 25. Bull MJ, Williams AS, Mecklenburgh Z, et al. The death receptor 3-TNF-like protein 1A pathway drives adverse bone pathology in inflammatory arthritis. J Exp Med. 2008;205:2457–2464. [DOI] [PMC free article] [PubMed] [Google Scholar]
- 26. McLaren JE, Calder CJ, McSharry BP, et al. The TNF-like protein 1A-death receptor 3 pathway promotes macrophage foam cell formation in vitro. J Immunol. 2010;184:5827–5834. [DOI] [PMC free article] [PubMed] [Google Scholar]
- 27. Collins FL, Williams JO, Bloom AC, et al. CCL3 and MMP-9 are induced by TL1A during death receptor 3 (TNFRSF25)-dependent osteoclast function and systemic bone loss. Bone. 2017;97:94–104. [DOI] [PMC free article] [PubMed] [Google Scholar]
- 28. Meylan F, Hawley ET, Barron L, et al. The TNF-family cytokine TL1A promotes allergic immunopathology through group 2 innate lymphoid cells. Mucosal Immunol. 2014;7:958–968. [DOI] [PMC free article] [PubMed] [Google Scholar]
- 29. Castellanos JG, Longman RS. The balance of power: innate lymphoid cells in tissue inflammation and repair. J Clin Invest. 2019;129:2640–2650. [DOI] [PMC free article] [PubMed] [Google Scholar]
- 30. Meylan F, Richard AC, Siegel RM. TL1A and DR3, a TNF family ligand-receptor pair that promotes lymphocyte costimulation, mucosal hyperplasia, and autoimmune inflammation. Immunol Rev. 2011;244:188–196. [DOI] [PMC free article] [PubMed] [Google Scholar]
- 31. Richard AC, Tan C, Hawley ET, et al. The TNF-family ligand TL1A and its receptor DR3 promote T cell-mediated allergic immunopathology by enhancing differentiation and pathogenicity of IL-9-producing T cells. J Immunol. 2015;194:3567–3582. [DOI] [PMC free article] [PubMed] [Google Scholar]
- 32. Meylan F, Song YJ, Fuss I, et al. The TNF-family cytokine TL1A drives IL-13-dependent small intestinal inflammation. Mucosal Immunol. 2011;4:172–185. [DOI] [PMC free article] [PubMed] [Google Scholar]
- 33. Shih DQ, Barrett R, Zhang X, et al. Constitutive TL1A (TNFSF15) expression on lymphoid or myeloid cells leads to mild intestinal inflammation and fibrosis. PLoS One. 2011;6:e16090. [DOI] [PMC free article] [PubMed] [Google Scholar]
- 34. Taraban VY, Slebioda TJ, Willoughby JE, et al. Sustained TL1A expression modulates effector and regulatory T-cell responses and drives intestinal goblet cell hyperplasia. Mucosal Immunol. 2011;4:186–196. [DOI] [PMC free article] [PubMed] [Google Scholar]
- 35. Li H, Song J, Niu G, et al. TL1A blocking ameliorates intestinal fibrosis in the T cell transfer model of chronic colitis in mice. Pathol Res Pract. 2018;214:217–227. [DOI] [PubMed] [Google Scholar]
- 36. Perks WV, Singh RK, Jones GW, et al. Death receptor 3 promotes chemokine-directed leukocyte recruitment in acute resolving inflammation and is essential for pathological development of mesothelial fibrosis in chronic disease. Am J Pathol. 2016;186:2813–2823. [DOI] [PMC free article] [PubMed] [Google Scholar]
- 37. Gevers D, Kugathasan S, Denson LA, et al. The treatment-naive microbiome in new-onset Crohn’s disease. Cell Host Microbe. 2014;15:382–392. [DOI] [PMC free article] [PubMed] [Google Scholar]
- 38. Said C, Coleiro B, Zarb Adami M, et al. Cost effectiveness of TNF-α inhibitors in rheumatoid arthritis. Int J Inflam. 2013;2013:581409. [DOI] [PMC free article] [PubMed] [Google Scholar]
- 39. Atarashi K, Suda W, Luo C, et al. Ectopic colonization of oral bacteria in the intestine drives TH1 cell induction and inflammation. Science. 2017;358:359–365. [DOI] [PMC free article] [PubMed] [Google Scholar]
- 40. Morgan XC, Tickle TL, Sokol H, et al. Dysfunction of the intestinal microbiome in inflammatory bowel disease and treatment. Genome Biol. 2012;13:R79. [DOI] [PMC free article] [PubMed] [Google Scholar]
- 41. Doherty MK, Ding T, Koumpouras C, et al. Fecal microbiota signatures are associated with response to ustekinumab therapy among Crohn’s disease patients. mBio. 2018;9:e02120-17. [DOI] [PMC free article] [PubMed] [Google Scholar]
Associated Data
This section collects any data citations, data availability statements, or supplementary materials included in this article.
Supplementary Materials
Data Availability Statement
Upon request, and subject to certain criteria, conditions, and exceptions (see https://www.pfizer.com/science/clinical-trials/trial-data-and-results for more information), Pfizer will provide access to individual de-identified participant data from Pfizer-sponsored global interventional clinical studies conducted for medicines, vaccines, and medical devices (1) for indications that have been approved in the US and/or EU or (2) in programs that have been terminated (ie, development for all indications has been discontinued). Pfizer will also consider requests for the protocol, data dictionary, and statistical analysis plan. Data may be requested from Pfizer trials 24 months after study completion. The de-identified participant data will be made available to researchers whose proposals meet the research criteria and other conditions and for which an exception does not apply, via a secure portal. To gain access, data requestors must enter into a data access agreement with Pfizer.


