

Summary
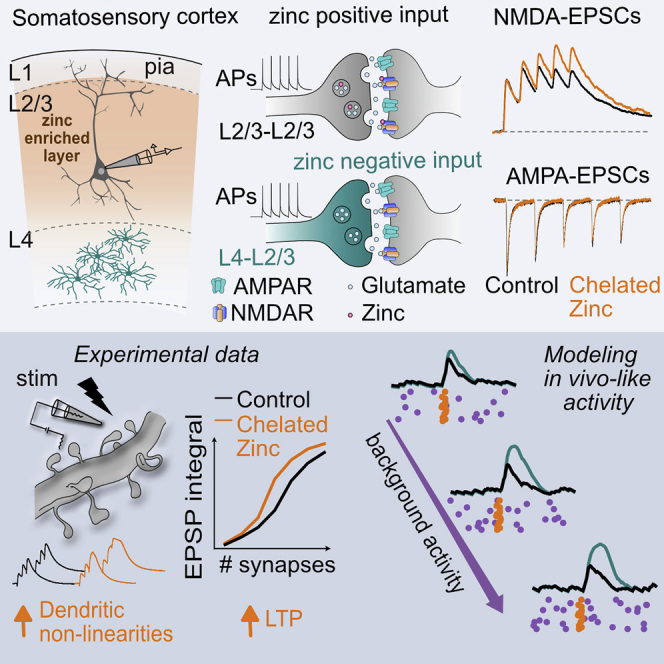
NMDA receptors (NMDARs) have been proposed to control single-neuron computations in vivo. However, whether specific mechanisms regulate the function of such receptors and modulate input-output transformations performed by cortical neurons under in vivo-like conditions is understudied. Here, we report that in layer 2/3 pyramidal neurons (L2/3 PNs), repeated synaptic stimulation results in an activity-dependent decrease in NMDAR function by vesicular zinc. Such a mechanism shifts the threshold for dendritic non-linearities and strongly reduces LTP. Modulation of NMDARs is cell and pathway specific, being present selectively in L2/3-L2/3 connections but absent in inputs originating from L4 neurons. Numerical simulations highlight that activity-dependent modulation of NMDARs influences dendritic computations, endowing L2/3 PN dendrites with the ability to sustain non-linear integrations constant across different regimes of synaptic activity like those found in vivo. Our results unveil vesicular zinc as an important endogenous modulator of dendritic function in cortical PNs.
Keywords: vesicular zinc, NMDA receptors, synapses, dendritic integration, sensory processing
Graphical abstract
Highlights
-
•
Vesicular zinc release downregulates function of synaptic NMDARs in cortical neurons
-
•
Zinc modulation of NMDARs is activity dependent, pathway and cell specific
-
•
Endogenous zinc controls dendritic non-linearities and synaptic plasticity in L2/3 PNs
-
•
Modulation of NMDARs normalizes dendritic function during ongoing synaptic activity
Morabito et al. show that vesicular zinc selectively inhibits synaptic NMDARs in an activity-dependent manner in layer 2/3 pyramidal neurons. Removing zinc modulation of NMDARs alters dendritic computations as well as LTP induction. Modeling suggests that such a mechanism can maintain dendritic integration constant across different regimes of neuronal activity.
Introduction
A fundamental computation performed by individual neurons in the brain involves the transformation of incoming synaptic information into an output firing pattern (Brunel et al., 2014; Silver, 2010). Synaptic inputs arrive primarily on the dendritic tree of neurons where a diversity of postsynaptic dendritic mechanisms is known to shape input-output relationships. These include synaptic saturation (Abrahamsson et al., 2012; Vervaeke et al., 2012) and dendritic spikes (Häusser et al., 2000; Smith et al., 2013), as well as NMDAR non-linearities (Major et al., 2013). However, how such dendritic mechanisms are actually recruited in vivo is much less understood.
In sensory cortices of awake mice spontaneous firing of single neurons can vary between low-firing (<0.1 Hz) to considerably higher-firing regimes (∼10 Hz) depending on the behavioral and physiological state of the animal (McGinley et al., 2015; Vinck et al., 2015; Zerlaut et al., 2019). Theoretical studies suggest that such periods of increased spontaneous synaptic activity might facilitate recruitment of NMDARs and thus result in supralinear dendritic integration (Farinella et al., 2014; Ujfalussy et al., 2018). The increased activation of NMDARs is explained by their slow kinetics (half-decay 40–70 ms) that effectively summate over relatively long times integrating recent history of synaptic activity. However, in vivo activity patterns are likely to engage modulatory mechanisms (e.g., synaptic plasticity, firing adaptation, release of neuromodulators). Whether such modulatory mechanisms specifically apply to NMDAR function altering dendritic operations in cortical neurons is currently unknown. NMDARs are known to be particularly susceptible to regulation (Raman et al., 1996; Tong et al., 1995) and an eventual activity-dependent plasticity of synaptic NMDARs is expected to considerably impact integrative properties of single neurons working under in vivo-like conditions.
Zinc is a metal ion that, in the brain, has the particularity of being co-stored together with glutamate inside synaptic vesicles of glutamatergic terminals through the action of a dedicated vesicular transporter (ZnT3) (Palmiter et al., 1996). During synaptic activity vesicular zinc is released into the extracellular space and has been shown to efficiently modulate synaptic NMDAR (Anderson et al., 2015, 2017; Assaf and Chung, 1984; Erreger and Traynelis, 2005; Howell et al., 1984; Pan et al., 2011; Paoletti et al., 2009; Sensi et al., 2009; Vergnano et al., 2014; Vogt et al., 2000). Such a modulatory system seems thus particularly well positioned to control NMDAR function during periods of increased network dynamics. Despite clear behavior alterations associated with manipulation of zinc signaling (Adlard et al., 2010; Anderson et al., 2017; McAllister and Dyck, 2017; Patrick Wu and Dyck, 2018), the mechanisms and computational role of vesicular zinc action in cortical circuits is understudied.
Here, we combined two-photon (2P) imaging, slice electrophysiology, glutamate uncaging, and numerical simulations to reveal that: (1) zinc release modulates NMDAR in an activity-dependent and pathway-specific manner controlling dendritic integration in PNs in the primary somatosensory cortex (S1); (2) zinc inhibition of NMDARs renders the recruitment of dendritic non-linearities particularly insensitive to previous history of synaptic activation. These results provide a new perspective for the role of zinc-containing neurons in brain microcircuits and reveal a mechanism by which neurons are able to normalize dendritic integration across different activity regimes often associated with the cortical states of wakefulness.
Results
Synaptic zinc is an endogenous neuromodulator of NMDAR function in L2/3 PNs
We hypothesized that a possible activity-dependent modulation of NMDARs might have important consequences in computational properties of cortical neurons. To test this, we focused our study in L2/3 PNs, known to express important NMDAR-dependent dendritic computations (Branco and Häusser, 2011; Major et al., 2013; Schiller et al., 2000) and to be particularly enriched in vesicular zinc, an endogenous negative modulator of NMDAR function (Figure 1A). We started by testing if synaptic NMDA-EPSCs were modulated during repeated synaptic activation. Interestingly, bath application of the zinc chelators tricine (10 mM) (Paoletti et al., 1997) or ZX1 (100 μM) (Anderson et al., 2015) revealed a use-dependent inhibition of NMDARs during trains of synaptic stimulation without noticeable effect in the amplitude of the first NMDA-EPSC (ratio peak amplitude fifth/first pulse; control: 1.09 ± 0.05; tricine: 1.30 ± 0.05, n = 7, p = 0.008; control: 1.10 ± 0.03; ZX1: 1.30 ± 0.06, n = 10; p = 0.009, Wilcoxon matched-pairs signed rank test; Figures 1B, 1C, and S1A). Importantly, at the concentrations used, both chelators can rapidly interfere with fast extracellular zinc elevations (Anderson et al., 2015; Paoletti et al., 2009; Vergnano et al., 2014) without affecting intracellular zinc levels (Figures S1B and S1C; STAR Methods). Zinc modulation was also present at lower frequencies of stimulation (3 Hz) in agreement with slow dissociation from bound NMDARs (Figure S1D) (Paoletti et al., 1997). The action of zinc chelators was absent in slices from ZnT3 KO mice that lack vesicular zinc (Figure S1E) (Palmiter et al., 1996). Moreover zinc chelators had no effect in AMPAR-EPSCs, indicating that, as observed in hippocampal synapses (Vergnano et al., 2014), zinc effect is selective to NMDARs (Figures S1F and S1G). These results suggest that, during trains of synaptic activity, vesicular zinc specifically downregulates NMDAR function in L2/3 PNs.
Figure 1.

Zinc is an endogenous modulator of NMDAR function in S1
(A) Timm's staining (left) and corresponding densitometric profile (right).
(B) Schematic representation of experimental conditions used to stimulate local excitatory connections and record NMDA-EPSCs in L2/3 PN.
(C) Representative traces and summary plot of normalized NMDA-EPSCs peak amplitude during a train of synaptic stimulation (5 pulses at 20 Hz) obtained in control conditions (black) and after bath application of zinc chelators tricine (red) and ZX1 (orange) in L2/3 PNs. Values are presented as mean ± SEM, ∗p < 0.05, paired Wilcoxon matched-pairs test.
(D) Illustration of recording configuration used to record unitary NMDA-EPSCs between L2/3 PNs. Presynaptic cell was stimulated with a train of 5 action potentials (APs) (20 Hz).
(E) Representative traces of uNMDARs-EPSCs recorded in a postsynaptic L2/3 PN held at +30 mV. Single repetitions (30 sweeps) are in faint gray, average is in full color.
(F) Superimposed average uNMDARs-EPSCs obtained in control (black) and in the presence of zinc chelator (dark cyan).
(G) Summary plot of effect of chelating extracellular zinc in the charge transfer carried by a train (5 APs at 20 Hz) of uNMDARs-EPSCs. ∗p < 0.05, Wilcoxon matched-pairs signed rank test. Boxes represent interquartile ranges with the horizontal bars showing the medians.
(H) Schematic representation of experimental conditions used to stimulate axonal inputs from layer 4 and record NMDA-EPSCs in L2/3 PN.
(I) Up: representative traces of normalized NMDA-EPSCs obtained in control conditions (black line) and after bath application of zinc chelator tricine (red) in L2/3 PNs. Bottom: application of the zinc chelator tricine does not modulate NMDA-EPSCs in the vertical input from L4 to L2/3. Values are presented as mean ± SEM (ratio peak amplitude fifth/first pulse, ctrl: 0.87 ± 0.07, tricine: 0.88 ± 0.06, p = 0.69, paired Wilcoxon matched-pairs test).
(J) Effect on exogenous zinc (300 nM) application on NMDA-EPSCs while stimulating different excitatory inputs in S1. Color code represents the different synapses studied: L2/3-L2/3 (black), L4-L2/3 (dark cyan), L4-L4 (red).
(K) Time course of normalized amplitude of NMDA-EPSCs amplitude during exogenous zinc application. Maximum percentage of inhibition: layer 2/3 to 2/3 (n = 4; 56% ± 0.05%), L4-L2/3 (n = 4; 53% ± 0.04%), L4-L4 (n = 3; 56% ± 0.12%).
L2/3 PNs receive inputs from local L2/3 and L4 neurons as well as from long-range connections from other cortical regions. To measure the impact of zinc modulation at single synapses, we performed dual whole-cell recordings from synaptically connected L2/3 PNs (Figure 1D). In eight tested pairs, chelating extracellular zinc significantly increased the total charge transfer carried by the train of NMDA-EPSCs by almost 50% (control: median = 2.17 pC; mean = 2.61 ± 0.7 pC; chelator: median = 2.96 pC; mean = 3.38 ± 0.7 pC; p = 0.023, Wilcoxon matched-pairs signed rank test; Figures 1D–1G). This effect was substantially larger than the effect obtained with extracellular stimulation compatible with the expected heterogeneous recruitment of zinc-positive and zinc-negative fibers with electrical stimulation. Again, zinc chelators did not alter charge transfer measured only during the first NMDA-EPSC in the train (control: median = 0.37 pC; mean = 0.45 ± 0.13 pC; chelator: median = 0.45 pC; mean: 0.48 ± 0.11 pC; p = 0.15, Wilcoxon matched-pair signed rank test; Figures 1D–1G), arguing for a phasic and not tonic action of synaptic zinc in L2/3 PN NMDARs. Altogether these results indicate that zinc is an effective modulator of NMDARs at L2/3-L2/3 PN synapses.
Cell- and pathway-specific actions of vesicular zinc in S1
The heterogeneous labeling of free zinc in the neocortex (Figure 1A) raised the question about the potential variability of the observed activity-dependent modulation of NMDARs across synaptic inputs. To evaluate such a possibility, we placed the stimulation electrode in L4, a cortical layer almost devoid of zinc staining, while recording NMDAR-EPSCs in L2/3 PNs (Figure 1H). Short-term depression was particularly evident when compared with local L2/3 stimulation (Figure 1C). This observation is compatible with the high-release probability previously reported at L4-L2/3 synapses (Feldmeyer et al., 2002; Silver et al., 2003). Interestingly, under these experimental conditions, zinc chelators did not modify amplitude nor the short-term plasticity of recorded NMDAR-EPSCs (Figures 1I and S1A). This effect was not due to a different sensitivity of postsynaptic NMDARs across the two inputs as exogenous zinc application (300 nM) produced similar degree of inhibition while evoking NMDA-EPSCs in L2/3 or L4 (Figures 1J and 1K). These results indicate that activity-dependent modulation of NMDARs across synaptic inputs is heterogeneous, potentially altering their contribution to synaptic integration and plasticity.
In addition to the variability between presynaptic inputs, we further investigated if modulation of NMDARs could also differ between postsynaptic targets. L2/3 PNs axons contact L2/3 PNs as well as other local interneurons (INs). For that we tested the impact of zinc chelators in uNMDARs-EPSCs recorded in somatostatin-positive (SST+)- or parvalbumin-positive (PV+)-INs (Figure 2). Extracellular zinc chelation significantly increased charge transfer carried by NMDARs in synapses between L2/3 PNs and SST+-INs (control: median = 1.49; mean = 1.89 ± 0.55 pC; chelator: median = 1.86, mean = 2.73 ± 0.65 pC, n = 11; p = 0.002, Wilcoxon matched-pairs signed rank test; Figures 2A–2C and 2G). Surprisingly, the same was not observed for synapses into PV-INs (Figures 2D–2G). Unexpectedly in PV-INs, the lack of effect was associated with a reduced sensitivity of postsynaptic NMDARs to exogenous zinc application (Figures 2H–2J). The underlying cellular mechanism behind such a difference in zinc sensitivity is at present unclear but is likely associated with variation in the subunit composition of synaptic NMDARs that can affect the sensitivity of synaptic NMDARs to zinc inhibition (Garst-Orozco et al., 2020; Paoletti, 2011).
Figure 2.

Effect of vesicular zinc in NMDA-EPSCs is synapse specific in L2/3 PNs neurons
(A) Illustration of recording configuration used to probe unitary connections between L2/3 PNs and SST+-INs. Presynaptic cells were stimulated with a train of 5–9 APs (20 Hz).
(B) Representative traces of uNMDARs-EPSCs recorded in a postsynaptic L2/3 SST+-IN held at +30 mV. Application of the zinc chelator (green) induced a potentiation of uNMDARs-EPSCs. Single repetitions (30 sweeps) are in faint gray, average is in full color.
(C) Summary plot of effect of chelating extracellular zinc in the charge transfer carried by a train of uNMDARs-EPSCs. ∗∗p < 0.001, Wilcoxon matched-pairs signed rank test. Boxes represent interquartile ranges with the horizontal bars showing the medians.
(D) Same as (A) but for unitary connections between L2/3 PNs and PV+-INs.
(E and F) Same as (B) and (C) but for uNMDARs-EPSCs recorded in a postsynaptic L2/3 PV+-INs (first pulse charge [median]: control = 0.43 pC; chelator: 0.37 pC, n = 8 11; p = 0.74 pC; total charge control [median]: 2.18 pC; chelator: 1.93 pC, n = 8; p = 0.74, Wilcoxon matched-pairs signed rank test).
(G) Summary plot of the effect of zinc chelators in charge transfer carried by a train of NMDAR-EPSCs at synapses between L2/3 PN and different postsynaptic targets (Pyr median: 40.45%; SST: 36.76%; PV: 16.47%. Pyr: p = 0.026; SST: p = 0.013; PV: p = 0.90, Kruskal-Wallis test compared with no effect).
(H) Representative traces of uNMDARs-EPSCs recorded in an L2/3 SST+-IN and PV+-IN held at +30 mV in control (black) and in the presence of ZnCl2 300 nM (green for SST-INs and dark pink for PV-INs). ZnCl2 application induced a decrease in the charge transfer of the recorded train of uNMDARs-EPSCs in SST+-INs but not in PV+-INs. Note that, as expected the inhibition by exogenous zinc application is observed already in the first pulse.
(I) Summary plot of the effect of exogenous zinc (300 nM) application in charge transfer of NMDA-EPSCs in L2/3 PN-SST-INs synapses. Data are represented as boxplot and quartiles. First pulse charge ctrl: 0.11; ZnCl2: 0.08, n = 12, p = 0.01; total charge ctrl: 2.89; ZnCl2: 1.94, n = 12, p = 0.006, Wilcoxon matched-pairs signed rank test.
(J) Same as (I) but for connections between L2/3 PNs and PV+-INs. First peak charge ctrl (median): 0.43 pC; ZnCl2: 0.42 pC, n = 7, p = 0.58; total charge ctrl (median): 1.80 pC; ZnCl2: 2.89 pC, n = 7, p = 0.29, Wilcoxon matched-pairs signed rank test.
Overall, our results reveal that vesicular zinc is a powerful pathway- and cell-specific modulator of NMDAR function in neocortical microcircuits.
Vesicular zinc is an endogenous modulator of dendritic integration
Having established that synaptic NMDARs are modulated by activity we tested the relevance of such a mechanism in dendritic computations of L2/3 PNs. For that, we patch-clamped L2/3 PNs in the current-clamp configuration and used 2P imaging to position a stimulation pipette in the close proximity (5–7 μm) of basal dendrites (Figure 3A). Somatic excitatory postsynaptic potentials (EPSPs) were recorded in response to extracellular stimulation consisting of a train of 3 stimuli at 50 Hz (Figure 3B). Focal stimulation was validated using dendritic 2P-calcium (Ca2+) imaging (Figures S3A–S3C; STAR Methods). Progressive increase in the number of activated synapses led to the appearance of a slow component in recorded EPSPs that resulted in a supralinear relationship between the intensity of stimulation and the integral of the last EPSP (Figures 3B–3D). Interestingly, interfering with the activity-dependent modulation of synaptic NMDARs through zinc chelation resulted in a shift of the response curve toward low intensities. For the same intensity of stimulation, depolarizations were increased in the presence of ZX1 (control: 0.75 ± 0.12 mV.s; ZX1: 1.21 ± 0.17 mV.s; n = 11, p = 0.01, Wilcoxon matched-pairs signed rank test; Figures 3B–3F) without noticeable alteration in the amplitude of the first EPSP (Figure 3E). D-AP5 (50 μM) application eliminated the supralinearity, as expected for an NMDAR-dependent process (Branco and Häusser, 2011; Palmer et al., 2014; Polsky et al., 2009) (Figures 3B–3F).
Figure 3.

Synaptic zinc release impacts dendritic non-linearities in basal dendrites of L2/3 PNs
(A) Two-photon laser scanning microscopy (2PLSM) image (maximum-intensity projection, MIP) of L2/3 PN. White dotted line: the location of the theta glass pipette used for focal dendritic stimulation.
(B) Representative traces of recorded EPSPs for increasing (left, average of 6) intensity of stimulation in control (black), with ZX1 (100 μM) and after addition of the NMDAR antagonist D-AP5 (50 μM).
(C) Plot of EPSP integral (third pulse) in function of stimulus intensity obtained from the experiment illustrated in (B). Dotted lines represent linear regression to the stimulation intensity values before occurrence of non-linear EPSPs.
(D) Recorded EPSPs (six individual sweeps) for conditions listed in (B) with constant stimulation intensity.
(E) Left: summary plot of integral of synaptically evoked EPSPs (third pulse) at the stimulus intensity defined as the minimum value needed to induce non-linear dendritic behavior (in zinc chelated) in control conditions and in the presence of ZX1. ∗p < 0.05. Right: the first peak amplitude is not affected by the application of the zinc chelator (ctrl: 7.82 ± 0.83 mV; ZX1: 7.97 ± 0.70 mV; n = 11 p = 0.68, Wilcoxon matched-pairs signed rank test).
(F) Chelating extracellular zinc induces a shift to the left of the stimulus current-voltage relationship. Stimulation intensity is shown relative to the maximum value used in control for each cell defined as 1 (n = 11, ∗p < 0.01, Wilcoxon matched-pairs signed rank test).
(G) 2PLSM image of a basal dendrite from an L2/3 PN with nine selected glutamate uncaging locations (orange).
(H) Photolysis-evoked EPSPs (pEPSPs) in response to increasing number of laser spot locations in control conditions and in the presence of the zinc chelator ZX1. Right: algebraic sum of individual pEPSPs.
(I) Subthreshold input-output relationship of pEPSPs obtained in control conditions (black) and in the presence of ZX1 (orange) for dendrite illustrated in (G) and (H) (upper left).
(J) Summary plot of supralinearity for control conditions and after ZX1 application.
(K) Biophysical model of NMDA zinc modulation at single synapse (see STAR Methods). Zinc binding (bZn) is modeled by an increment-and-decay dynamics following glutamatergic events. At a given synaptic event, the current level of zinc binding (bZn, black curve) sets the zinc modulation level (mZn, piecewise function in orange) that reduces NMDA conductance according to the factor (1–αZn·mZn), where αZn accounts for the efficacy of zinc inhibition at full binding (see STAR Methods).
(L) Morphological reconstruction of layer 2/3 PN used for the model (Jiang et al., 2015). The orange dot indicates the location of the synaptic stimulation used to obtain the traces in (M).
(M) Membrane potential (top) and conductance (bottom) traces obtained following the activation of an increasing number of recruited synapses (Nsyn) for free-zinc (black), chelated-zinc (green), and AMPA-only (blue) conditions.
(N) Summary plot of the integral of the third EPSP in the traces obtained during simulations shown in (M).
(O) Left: considering multiple locations of synaptic stimulation over the basal dendrite dendritic tree (n = 25 locations, color-coded). Right: half-activation level (Nsyn1/2) and respective third pulse integral measured in zinc-free (black) or in zinc-chelated (green) conditions obtained for the point of stimulation reported (left). ∗∗∗p < 0.0001, Wilcoxon matched-pairs signed rank test.
The observed modulation of NMDARs by synaptic stimulation would predict no effect of ZX1 in dendritic function if synaptic release is not engaged. To test such prediction, we studied dendritic integration properties of L2/3 PN using 2P-glutamate uncaging. We observed that the EPSP peak amplitude increased with the number of activated synapses closely following a sigmoid function in agreement with the non-linear integration properties of L2/3 PN dendrites (Figures 3G–3J) (Branco and Häusser, 2011). Under these experimental conditions application of ZX1 did not alter the non-linear behavior of the dendrites tested (Figure 3J, control: 22.8% ± 4.4%; ZX1: 21.8% ± 3.8%, n = 6; p = 0.56, Wilcoxon matched-pairs signed rank test) or the threshold estimated as the number of inputs required to reach half of the maximum EPSP amplitude (ctrl: 4.33 ± 0.49 inputs; ZX1: 4.50 ± 0.56 inputs; n = 6, p > 0.99, Wilcoxon matched-pairs signed rank test). In contrast, application of the NMDAR blockers, D-AP5 (50 μM) and MK-801 (50 μM), completely abolished non-linear integration in L2/3 PN dendrites, confirming that NMDARs are essential for this particular dendritic property (Figures S3D–S3E). These results argue that, during synaptic activation, the engagement of endogenous modulatory mechanisms selective for NMDAR function can alter dendritic integration properties of L2/3 PNs.
To further test if modulation of NMDARs could be indeed at the origin of the observed alteration in dendritic activity during ZX1 application we derived a theoretical description of zinc activity-dependent action on NMDARs (Figure 3K; STAR Methods) that we incorporated into numerical simulations of a morphologically detailed L2/3 PN model (Figure 3L; STAR Methods). Parameters were constrained on experimental measurements (see STAR Methods; Table S1; Figures S3F–S3G). To study how modulation of NMDARs by zinc-affected dendritic integration, we stimulated synapses with a train of three pulses to mimic the experiment of Figures 3B–3D and progressively increased the number of activated synapses. In agreement with previous reports and with our own experimental data, model simulation revealed that increased numbers of activated synapses results in a non-linear NMDAR-dependent increase in measured somatic voltage (Figures 3L–3N). Incorporating zinc modulation of NMDARs induced a shift in the input-output curve toward higher stimulus levels (number of synapses needed to reach half-activation voltage, Nsyn1/2 = 5.9 ± 1.0 control versus Nsyn1/2 in zinc free = 7.0 ± 1.2, p = 5e−8, n = 25 locations, Wilcoxon matched-pairs signed rank test; Figures 3L–3O). In parallel, we observed a decrease in the somatically measured depolarization (Vm) for a given level of synaptic recruitment (third pulse integral at Nsyn1/2 of the “chelated” condition was 1.4 ± 0.3 mV.s for the chelated-zinc condition versus 0.9 ± 0.2 mV.s for the free-zinc condition, p = 5e−8, n = 25 locations, Wilcoxon matched-pair signed rank test; Figures 3M–3O).
Altogether, experimental and numerical analysis highlight that endogenous modulation of synaptic NMDARs during repeated synaptic activation regulates dendritic integrative properties of single neurons.
Activity-dependent modulation of NMDARs and relevance for synaptic plasticity
Activation of NMDARs has long been associated with plasticity of glutamatergic inputs in neuronal networks. In addition, in L2/3 PNs the recruitment of NMDAR-dependent dendritic non-linearities have been shown to play an important role in synaptic plasticity both in vivo and in vitro (Gambino et al., 2014; Williams and Holtmaat, 2019). We thus hypothesized that the segregation of zinc modulation of NMDARs in cortical microcircuits would result in heterogeneity in dendritic integration with the consequent modification of plasticity rules among L2/3 PNs inputs. To test this hypothesis, we applied a high-frequency stimulation protocol, adapted from in vivo recordings (see STAR Methods), to either L4 or L2/3 inputs and recorded the subsequent effect in amplitude of evoked EPSPs in L2/3 PNs. As previously reported, LTP was clearly observed at L4 inputs (Figures 4A–4C) (Williams and Holtmaat, 2019), an effect that was abolished in the presence of the NMDAR antagonist D-AP5. In contrast, the same protocol was ineffective in inducing LTP when local L2/3 axons were stimulated (Figures 4D–4F). As a control we observed statistically insignificant variation in the amplitude of evoked EPSPs during a 30 min recording period for both L4-L2/3 and L2/3-L2/3 synapses (Figure S4). To test if removing endogenous modulation of NMDARs by zinc could render L2/3 synapses sensitive to such LTP protocols we repeated experiments in the presence of the zinc chelator ZX1 or in ZnT3 KO slices. Interestingly, a clear NMDAR-dependent LTP could now be observed in L2/3 pathway (Figures 4E–4I). The present results thus reveal that the segregation of vesicular zinc across cortical inputs results in differential recruitment of NMDARs during repetitive synaptic stimulation generating heterogeneity in plasticity induction rules between inputs.
Figure 4.

Zinc-mediated reduction of synaptic cooperativity controls LTP induction in a pathway-specific manner in S1
(A) Schematic representation of experimental conditions used to stimulate L4-L2/3 connections.
(B) Representative traces (up) and amplitude time course (down) of recorded EPSPs in L2/3 PN baseline and after LTP induction while stimulating L4 inputs.
(C) Left: summary plot of EPSPs amplitude, pre- and post-LTP induction in L4-L2/3 connections. Right: same as left but in the presence of D-AP5 (50 μM). Data are presented as mean ± SEM (layer 4 to 2/3, baseline: 2.44 ± 0.22 mV; post. ind.: 3.94 ± 0.60 mV, p = 0.001; layer 4 to 2/3 D-AP5, baseline: 3.31 ± 0.65 mV; post. ind.: 3.03 ± 0.71 mV, p = 0.12; ∗∗p < 0.01, Wilcoxon matched-pairs signed rank test).
(D) Same as (B) but with LTP protocol applied locally in L2/3-L2/3 connections.
(E) Same as (D) but for a cell recorded in the presence of ZX1.
(F) Summary plot of average EPSPs amplitudes for total experiments listed in (D) and (E) (layer 2/3 to 2/3, baseline: 3.72 ± 0.28 mV; post. ind.: 4.57 ± 0.47 mV, p = 0.07; layer 2/3 to 2/3 ZX1, baseline: 2.97 ± 0.37 mV; post. ind.: 7.24 ± 1.2 mV, p = 0.01, Wilcoxon matched-pairs signed rank test).
(G) Example traces and time course of amplitude of recorded EPSPs pre- and post-LTP induction in L2/3 PNs from slices of ZnT3 KO mice.
(H) Same as (G), but for experiments performed in the WT mice in the presence of ZX1 and NMDA blockers (MK-801 and D-AP5).
(I) Summary of plots of average EPSPs amplitudes for the different cells recorded under the conditions described in (G) and (H). Results are presented as mean ± SEM (in ZX1+NMDA blockers, baseline: 4.03 ± 0.47 mV; post. ind.: 3.87 ± 0.51 mV, n = 6, p = 0.22, Wilcoxon matched-pairs signed rank test; in ZNT3 KO mice, baseline: 3.30 ± 0.27 mV; post. ind.: 6.03 ± 1.02 mV, n = 8, p = 0.04, Wilcoxon matched-pairs signed rank test).
Zinc modulation acts as an NMDAR-specific adaptation mechanism for dendritic integration of multiple stimuli
We next investigated theoretically the physiological relevance of the uncovered pathway-specific activity-dependent modulation of NMDARs by zinc in terms of synaptic processing in cortical circuits. In vivo, neurons process signals transmitted by groups of synapses that can be either overlapping or different across stimuli. Single dendritic branches are known to be particularly sensitive to temporally contiguous stimuli. The supralinear integration of coincident inputs is particularly evident in distal dendrites and is strictly dependent on NMDAR activation (Branco and Häusser, 2011). However, it is unknown if dendrites can differently integrate stimuli involving overlapping versus non-overlapping synaptic patterns. We reasoned that vesicular zinc, as an activity-dependent modulator of NMDAR function, might result in different processing of the two types of stimuli. To test the zinc effect on the processing of successive overlapping versus non-overlapping stimuli (Figure 5), we calibrated zinc modulation in the model on our experimental data obtained from unitary connections and we simulated passive and active cellular integration (see STAR Methods; Table S1). We first considered two clusters of ten closely located synapses (< 20 μm) in a given dendritic branch. For such nearby locations and in the absence of zinc modulation, the voltage-mediated recruitment of NMDAR shaping single-neuron response was comparable for overlapping and non-overlapping stimuli (green traces in Figure 5B, the NMDAR-involvement is demonstrated by the large difference with the AMPA-only case in blue). On the other hand, repeated stimulation on zinc-modulated synapses exhibited a strong suppression following the second pattern in terms of depolarization level (black curves Figure 5B) allowing prevention of spike generation (insets of Figure 5B). We characterized this suppression phenomenon more systematically by analyzing its parameter dependence and by averaging over n = 10 dendritic branches (with two clusters in each). We varied the number of synapses per cluster as well as the inter-pattern delay between the successive patterns and we computed the difference between peak depolarization level in the presence or absence of the zinc modulation of NMDAR (Figures 5B and 5C). Consistent with its dependence on NMDAR recruitment, the zinc effect appeared at lower inputs for short delays (∼5 synapses at 10 ms delays, bottom left part in Figure 5C) and higher inputs for longer delays (∼15 synapses for ∼200 ms delays, note the diagonal shape in Figure 5C). The absence of effect for high inputs and short delays (top left area in Figure 5C) resulted from the saturation of the NMDAR-mediated depolarization where zinc inhibition becomes negligible (visible in Figure 3N). Overall, zinc modulation resulted in a marked difference of peak depolarization (7.1 ± 1.8 mV, p = 6e−8, n = 25 dendritic branches, two-sample Wilcoxon test between free-zinc and chelated-zinc conditions) at intermediate synaptic levels and latencies (maximum peak observed for Nsyn = 9.7 ± 1.5 and Tdelay = 71.3 ± 24.2 ms). We conclude that zinc modulation of NMDARs in the L2/3-to-L2/3 pathway decreases responses to stimuli that engaged previously active synapses and might therefore increase the saliency of stimuli involving newly recruited synapses.
Figure 5.

Zinc modulation is an NMDAR-specific adaptation mechanism for overlapping synaptic patterns during multi-input integration
(A) L2/3 pyramidal cell morphology with two clusters of ten synapses each closely located on a dendritic branch.
(B) Example simulations of two-pattern integration in the presence (black) or absence (green dashed curve) of zinc-mediated inhibition of NMDAR and in the AMPA-only case (blue curve). From the two clusters of (A), we build two stimulation patterns by drawing spikes from a Gaussian distribution (5 ms width). We show the responses to the two individual patterns (left plots) and to the different combinations of the successive patterns separated by 50 ms in the non-overlapping (middle plots) and overlapping stimulation cases (right plots). In the insets, we show the same situation simulated with active properties (see STAR Methods).
(C) Reduction of the stimulus-evoked peak depolarization level due to the zinc inhibition for different number of synapses per pattern (y axis) and delays (x axis) between the two successive patterns. This was obtained by computing the absolute difference between peak depolarizations in the chelated-zinc and free-zinc (dashed green versus black curves, respectively) in (B) after averaging over n = 25 different dendritic branches.
Zinc modulation of NMDAR implements a background-invariant encoding of synaptic activation under in vivo-like activity
Under in vivo conditions periods of increased spontaneous synaptic activity have been suggested to facilitate the recruitment of NMDARs and thus result in supralinear dendritic integration (Farinella et al., 2014; Ujfalussy et al., 2018). Our simulations indicate that zinc modulation is expected to be effective in active synapses potentially counteracting such a facilitatory effect of spontaneous activity. We thus analyzed how zinc modulation affects the coincidence detection properties of single dendritic branches under different levels of background activity as observed in vivo (Figure 6A–6C). We simulated passive and active cellular integration in response to increasing quasi-simultaneous synaptic recruitment (Nsyn) under different background activity levels (vbg). Coincidence detection was quantified by the integrated amount of Vm depolarization (PSP integral, Figure 6D) and spike probability (Figure 6E) following the synaptic activation pattern. Both Vm and spiking output were strongly influenced by NMDAR activation (Figure 6; note the difference with the “AMPA-only” setting). When NMDAR function was simulated without zinc modulation as found in the L4-2/3 connections, coincidence detection was facilitated by increasing levels of background activity (Farinella et al., 2014). Both the Vm response and the spiking output exhibited a strong shift toward a lower number of synapses required to reach a similar depolarization/spiking value (Figures 6D and 6E). The dependency of the threshold crossing level Nsynthres (see STAR Methods) was indeed strongly modulated by the background activity level (Figure 6F) both for the Vm response (Nsynthres/vbg = 1.8 ± 0.3 Hz−1, Figure 6D) and the spiking output (Nsynthres/vbg = 1.5 ± 0.2 Hz−1; Figure 6E). Strikingly, this facilitation effect disappeared when simulating a zinc-containing pathway like the L2/3-L2/3 connections. Both the Vm response and the spiking output lost their strong dependency to the background activity level (Vm: Nsynthres/vbg = 0.3 ± 0.2 Hz−1; p = 2e−3, Wilcoxon matched-pair signed rank test with zinc-independent condition; Figures 6D and 6F; spiking: Nsynthres/vbg = 0.3 ± 0.3 Hz−1, p = 0.002; Figures 6E and 6F). We therefore addressed the impact in terms of encoding properties of such a phenomenon. We built a decoder of stimulus intensity from the single-trial PSP waveform (see STAR Methods). This analysis revealed that the background-facilitation had a confounding effect in the zinc-independent pathway, where a given PSP response could be attributed to different Nsyn level due the background modulation of evoked activity (e.g., a PSP at Nsyn = 14 and vbg = 3 Hz can be confounded with a PSP at Nsyn = 12 and vbg = 4 Hz; see Figure 6F), leading to an overall decoding accuracy of 37.48% ± 4.86%. This confounding effect disappeared in the putative L2/3-to-L2/3 pathway, the zinc modulation maintained the input-output relationship invariant across background levels led to a strong and significantly increased decoding accuracy (62.71% ± 2.40%, p = 1.7e−6, Wilcoxon matched-pairs signed rank test). We conclude that vesicular zinc release confers unique integrative properties in L2/3-L2/3 synapses, they benefit from the high NMDAR-mediated sensitivity allowing coincidence detection for a few synaptic inputs together with the zinc-mediated NMDAR inhibition that preserves stimulus sensitivity across background activity levels (Figures 6D–6F).
Figure 6.

Activity-dependent modulation of NMDARs by vesicular zinc confers unique integrative properties to the L2/3 intralaminar pathway: background-invariant coincidence detection under in vivo-like regimes
(A) Schematic illustration of zinc-positive (zinc+) and zinc-negative (zinc−) input pathways into L2/3 PNs. L2/3-to-L2/3 connections have strong zinc modulation (black) while L4-to-L2/3 synapses display no zinc modulation (green).
(B) Examples of single-trial somatic Vm traces for subthreshold integration (i.e., simulating passive + synaptic properties only, see STAR Methods) of different numbers of coincidently active synapses Nsyn (orange, increasing from left to right) at different levels of ongoing synaptic activity νbg (increasing from top to bottom). Synapses with zinc modulation of NMDARs (zinc-positive, black), synapses without zinc modulation of NMDARs (zinc-negative, green), and synapses without NMDARs (AMPA-only, blue) were simulated.
(C) Same as (B) but with active conductances added to the model (see STAR Methods).
(D) Integral of PSP responses as a function of synaptic stimulation (Nsyn) for the different levels of ongoing synaptic activity (color coded) at a given synaptic location (response averaged over n = 10 different background activity realization and n = 3 patterns of synaptic stimulations). Data points (dots) were fitted with a sigmoid curve (plain lines). In the L2/3-to-L2/3 and L4-to-L2/3 cases, we highlight the shift of the Nsyn level Nsyntthresh corresponding to a threshold level “thresh” (thresh = 1.5 mV.s) with dashed lines (color code matching νbg level).
(E) Spiking probability response as a function of synaptic stimulation (Nsyn) for the different levels of ongoing synaptic activity (color coded) at a given synaptic location (the spiking probability is computed by averaging over n = 10 with different background activity realization and n = 3 patterns of synaptic stimulations). Data points (dots) were fitted with a sigmoid curve (plain lines). We highlight the shift of the Nsyn level Nsynthresh corresponding to the threshold level “thresh” (thresh = 0.5) with dashed lines (color code matching νbg level).
(F) Left: average gain of the spiking responses for the AMPA-only (blue), L2/3-to-L2/3 (gray) and L4-to-L2/3 (green) synaptic properties, showing mean ± SEM over n = 10 synaptic locations after averaging over the different background activity levels (the n = 5 νbg levels) shown in (D). Middle: slope of the relationship between Nsynthresh and the background activity level (i.e., the slope of the linear relationship) shown in the insets of (D) and (E). Showing mean ± SEM over n = 10 synaptic locations for the L2/3-to-L2/3 (black) and L4-to-L2/3 (green) synaptic properties. Right: performance of a nearest-neighbor decoder (see STAR Methods) inferring the synaptic stimulation level Nsyn from single-trial PSP waveforms for the L2/3-to-L2/3 (gray) and L4-to-L2/3 (green) synaptic properties. Nsyn is varied from 0 to 18 in steps of two synapses (i.e., 10 steps; see D and E) resulting in a chance level of 10% (red bottom line). Showing mean ± SEM over n = 10 synaptic locations and n = 3 stimulation patterns (n = 30).
Discussion
Synaptic inputs into single cortical neurons exhibit substantial heterogeneity in both structural and functional features. Such a diversity is thought to contribute to the brain's remarkable information-processing capabilities through mechanisms that are still under investigation. We now report that the heterogeneous distribution of vesicular zinc across cortical inputs results in pathway- and cell-specific modulation of NMDARs by synaptic activity. The activity-dependent inhibition of NMDARs shapes dendritic integration properties of cortical neurons and gates synaptic plasticity in an input selective manner. Moreover, experimentally constrained numerical simulations highlighted a previously unnoticed role of NMDAR plasticity in controlling dendritic integration in L2/3 PNs during periods of spontaneous activity like those observed in vivo. Inhibition of NMDARs by endogenous zinc normalized dendritic integration by preserving input-output responses for different levels of background activity. Furthermore, simulations also revealed that the activity-dependent downregulation of NMDAR function by zinc decreases the contribution of previously active synapses to dendritic non-linearities favoring saliency of newly activated synapses.
In the neocortex, neurons process information on a varying background of ongoing activity that is associated with the different cortical states (McCormick et al., 2020; Zerlaut et al., 2019). Our numerical simulations suggest that incorporation of spontaneous activity, as observed in awake animals, facilitates dendritic integration of quasi-synchronous inputs (Figure 6). These observations are in agreement with previous reports (Farinella et al., 2014; Ujfalussy et al., 2018) and are largely mediated by increased activation of NMDARs. Facilitated recruitment of NMDA-dependent dendritic non-linearities is particularly evident for distal inputs and is thought to allow closely activated distal synapses to overcome their relative electrotonic disadvantage compared with proximal synapses (Branco and Häusser, 2011). Yet, inputs in vivo display heterogeneous spontaneous firing rates and the facilitated recruitment of NMDARs is expected to result in a decreased ability of cortical neurons to extract relevant information from inputs displaying lower spontaneous activity (Abbott, 1997). The now reported activity-dependent modulation of NMDARs by vesicular zinc counteracts such effects and contributes to a normalization of synaptic NMDARs participating in dendritic integration across different spontaneous activity regimes. We hypothesize that such a finding might allow neurons to establish a dynamic gain control mechanism of dendritic non-linearities in face of a heterogeneous background activity.
Computationally, synaptic depression of intracortical synapses induces a frequency-dependent adjustment of synaptic weights allowing to equalize postsynaptic responses across varying levels of afferent firing (Abbott et al., 1997). Such observations suggested that the depression-mediated normalization of synaptic gain might be a general property of cortical neurons (Carandini and Heeger, 2012). Interestingly, L4-L2/3 PN synapses display pronounced short-term depression and do not have zinc-dependent modulation of NMDARs. In contrast, L2/3-L2/3 PN synapses have modest synaptic depression (Figures S2A and S2B) but show clear zinc modulation of NMDAR conductances. Future work should investigate the functional impact on gain control of this singular L2/3-L2/3- and NMDAR-specific depression mechanism conferred by vesicular zinc release.
In addition to the direct influence in the input-output transformations performed by single neurons, dendritic operations are also known to control plasticity of synaptic inputs (Gambino et al., 2014; Losonczy et al., 2008). In S1, rhythmic sensory whisker stimulation efficiently induces LTP in L2/3 PNs that depends on the occurrence of NMDAR-dependent dendritic non-linearities (Gambino et al., 2014). In parallel, both in vivo and in vitro approaches have observed reduced LTP at horizontal connections across barrel columns in naive mice (Gambino and Holtmaat, 2012; Glazewski et al., 1998; Hardingham et al., 2011). Feedforward inhibitory mechanisms have been proposed to explain such a difference in plasticity rules (Gambino and Holtmaat, 2012). However, the now observed pathway-specific modulation of NMDARs with the consequent increase in threshold for local dendritic non-linearities renders lateral L2/3-L2/3 inputs less sensitive to plasticity protocols when compared with the bottom up L4-L2/3 connections. Such a mechanism is thus expected to reduce LTP at trans-columnar horizontal L2/3-to-L2/3 projections thus contributing to the topographical organization of the barrel cortex by limiting experience-dependent modifications of synaptic strength to the barrel associated with the stimulated whisker.
Since the initial discovery of vesicular zinc (Frederickson et al., 2000; Haug, 1967; Maske, 1955) the activity-dependent release of this metal ion is thought to shape neuronal activity. However, the impact of zinc-containing neurons in the function of neuronal networks remains unclear and poorly understood. An important challenge faced over the years when studying zinc actions in the brain has been the identification of the downstream target(s) of synaptic zinc release. The recent development of a transgenic mouse model carrying a selective impairment in the high-affinity zinc-binding site of the GluN2A NMDAR subunit (Nozaki et al., 2011), revealed that postsynaptic NMDARs are a major target of endogenous vesicular zinc in the hippocampus (Vergnano et al., 2014). Our results in neocortical synapses extend this observation and suggest that, at glutamatergic synapses, NMDARs are most likely the main target for synaptic zinc release. A striking property of the zinc-containing axons is its heterogeneous distribution across the brain (Brown and Dyck, 2004; Frederickson et al., 2000). We now report that such a variability results in input-specific alterations in plasticity rules. In addition, our paired recordings between L2/3 PN and local PV interneurons suggest that zinc modulation of NMDARs can also be adjusted in a postsynaptic manner revealing the modularity of such a mechanism. The underlying cellular mechanism behind the reduced sensitivity of NMDAR in PV-INs is at present unclear but is likely associated with variation in the subunit composition of synaptic NMDARs that can affect the sensitivity of synaptic NMDARs to zinc inhibition (Paoletti, 2011).
Finally, both experimental and numerical analysis provide a new perspective on how zinc shapes neuronal computations. Through an activity-dependent inhibition of NMDARs, vesicular zinc controls dendritic integration in cortical microcircuits and could represent the cellular basis for the altered sensory discrimination observed in ZnT3 KO mice (Patrick Wu and Dyck, 2018).
Limitations of the study
In this study, we report that vesicular zinc is an activity-dependent inhibitor of synaptic NMDARs in cortical PNs. Such a modulation controls dendritic integration in L2/3 PNs in vitro and numerical simulations reveal that zinc release can maintain dendritic non-linear integrations constant across different regimes of synaptic activity, such as those found in vivo. However, we do not provide direct experimental evidence for such a prediction. Such a demonstration would require measuring dendritic activity in vivo and test the effect of selectively interfering with zinc modulation of NMDARs. In addition, we focused most of our work on the basal dendrites and it is unclear if such a mechanism is homogeneously distributed all along the dendritic tree of L2/3 PNs. Especially because apical tufts of L2/3 PNs receive long-range cortico-cortical feedback as well as thalamo-cortical inputs for which is unclear the presence of presynaptic vesicular zinc. Finally, we mainly investigated single-neuron dynamics and the role of vesicular zinc in neocortical networks, which requires future studies. Our experimental data suggest that zinc modulation can affect multiple different players of recurrent cortical dynamics, including somatostatin interneurons, rendering non-trivial the prediction of its functional role at the network level.
STAR★Methods
Key resources table
| REAGENT or RESOURCE | SOURCE | IDENTIFIER |
|---|---|---|
| Chemicals, peptides, and recombinant proteins | ||
| D-AP5 | Hello Bio | HB0225 |
| NBQX disodium salt | Tocris | Cat. No. 1044 |
| Picrotoxin | Abcam | Ab120315 |
| 2{[Bis(2pyridinylmethyl)amino] ethylamino}benzenesulfonic acid hydrate sodium salt ZX1 |
Strem Chemicals | 07–0350 |
| fluo-5F, pentapotassium salt | invitrogen | F14221 |
| Zinc Chloride | Sigma-Aldrich | 229997 |
| Tricine | Sigma-Aldrich | T0377 |
| Alexa Fluor 594 hydrazide, sodium salt | invitrogen | A10438 |
| MNI-caged-L-Glutamate | Tocris | Cat. No. 1490 |
| (+)-MK 801 maleate | Hello Bio | HB0004 |
| Experimental models: Organisms/strains | ||
| C57BL/6NRj | Janvier Labs | N/A |
| Ssttm2.1(cre)Zjh/J (SST-IRES-Cre) | Jackson Laboratory | JAX 013044 |
| Pvalbtm1(cre)Arbr/J (PV-Cre) | Jackson Laboratory | JAX 008069 |
| B6.Cg-Gt(ROSA)26Sortm9(CAG-tdTomato)Hze/J (td-tomato) | Jackson Laboratory | JAX007909 |
| ZnT3KO | Richard Palmiter (Palmiter et al., 1996) | N/A |
| Software and algorithms | ||
| pClamp | Molecular Devices | SCR_011323 |
| IGOR Pro 8 | WaveMetrics | RRID: SCR_000325 |
| Fiji | ImageJ | RRID: SCR_003070 |
| GraphPad Prism 9 | https://www.graphpad.com | RRID: SCR_002798 |
| Affinity Designer | https://affinity.serif.com/fr/designer/ | RRID: SCR_016952 |
| Prairie View 5.4 | Bruker | RRID: SCR_017142 |
| Python Programming Language | https://www.python.org/ | RRID: SCR_008394 |
| Brian2 | https://brian2.readthedocs.io/ | RRID: SCR_002998 |
| Scipy | https://scipy.org/ | RRID: SCR_008058 |
| Scikit-learn | https://scikit-learn.org/ | RRID: SCR_002577 |
| Neo | https://neo.readthedocs.io/ | RRID: SCR_000634 |
| Simulation code | https://zenodo.org/record/5905537 | https://doi.org/10.5281/zenodo.5905537 |
Resource availability
Lead contact
Further information and requests for resources and reagents should be directed to and will be fulfilled by the lead contact, Nelson Rebola (Nelson.Rebola@Icm-Institute.org).
Materials availability
This study did not generate new unique reagents.
Experimental model and subject details
Mice
Animals (C57BL/6 WT postnatal day 25–35 mice) were housed in the Paris Brain Institute animal facility accredited by the French Ministry of Agriculture for performing experiments on live rodents under normal light/dark cycles. Work on animals was performed in compliance with French and European regulations on care and protection of laboratory animals (EC Directive 2010/63, French Law 2013–118, February 6th, 2013). All experiments were approved by local the Ethics Committee #005 and by French Ministry of Research and Innovation. Experimental data was obtained from adult (P21-P41) mice. Both male and female mice were used with the following genotypes: SST-IRES-Cre (SSTtm2.1(cre)Zjh/J; JAX 013044) X Ai9 (Gt(ROSA)26Sortm9(CAG-tdTomato); JAX 007909); PV-Cre ( Pvalbtm1(cre)Arbr/J; JAX 008069) X Ai9 (Gt(ROSA)26Sortm9(CAG-tdTomato); JAX 007909); ZNT3-KO (Palmiter et al., 1996). Animals were maintained on a 12-h light/dark cycles with food and water provided ad libitum.
Method details
Timm staining
C57BL/6 WT postnatal day (25–35) mice were deeply anesthetized using a ketamine/xylazine mix and transcardially perfused with a perfusate solution prepared by mixing components of the FD Rapid Timm Staining Kit (FD Neurotech). The staining protocol followed the producer protocol with minimum modifications. Modifications: 1) Mice (15–20 gr) were perfused with 50 mL of perfusate solution; 2) Brain sections were dehydrated using 50%, 75%, 90%, 100% ethanol for 1 min each followed by 3 baths of 1 min in xylene; 3) Sections were then mounted using resinous mounting medium (Eukitt) and glass coverslips.
The slides were scanned using a ZEISS Axio Scan.Z1 device controlled with the ZEISS Software Zen Blue edition. Images were then converted to BigTIFF format and processed with a software programmed in Python 3 using the following libraries: OpenCV, Numpy, Math, Matplotlib, Tkinter. The software detected pixels for which the values match a defined range of colors, thus defining the pixels considered as positive for the staining. Considering the fact that the upper limit of staining has lower RGB values than the lower limit, the use of native pixel values was irrelevant for analysis. Thus the densitometry analysis was achieved by inverting the image's colors and the boundaries of detection (each RGB values were redefined by subtracting it from the maximum possible value), putting this new image to grayscale and retrieving the gray value of positive pixels (the value of negative pixels was considered as 0).
Slice preparation
Acute parasagittal slices (320 μm) were prepared from adult C57BL6J mice, starting from postnatal days 25–35. For layer 2/3 recordings mice were deeply anesthetized with a mix of ketamine/xylazine (mix of i.p. ketamine [100 mg/kg] and xylazine [13 mg/kg]) and perfused transcardially with ice-cold cutting solution containing the following (in mM): 220 Sucrose, 11 Glucose, 2.5 KCl,1.25 NaH2PO4, 25 NaHCO3, 7 MgSO4, 0.5 CaCl2. After perfusion the brain was quickly removed and slices prepared using a vibratome (Leica VT1200S). Slices containing S1 barrel field were transferred to ACSF solution at 34°C containing (in mM): 125 NaCl, 2.5 KCl, 2 CaCl2, 1 MgCl2, 1.25 NaH2PO4, 25 NaHCO3, 15 Glucose for 15–20 min. After the period of incubation, slices were kept at room temperature for a period of 6 h.
Electrophysiology
Whole-cell patch-clamp recordings were performed close to physiological temperature (33–35°C) using a Multiclamp 700B amplifier (Molecular Devices) and fire-polished thick-walled glass patch electrodes (1.85 mm OD, 0.84 mm ID, World Precision Instruments); 3.5–5 MOhm tip resistance. For voltage-clamp recordings, cells were whole-cell patched using following intracellular solution (in mM): 90 Cs-MeSO3, 10 EGTA, 40 HEPES, 4 MgCl2, 5 QX-314, 2.5 CaCl2,10 Na2Phosphocreatine, 0.3 MgGTP, 4 Na2ATP (300 mOsm pH adjusted to 7.3 using CsOH). Extracellular synaptic stimulation was achieved by applying voltage pulses (20 μs, 5–50 V; Digitimer Ltd, UK) via a second patch pipette filled with ACSF and placed 20–40 μm from soma. For L4 stimulation, a bipolar concentric stimulator electrode was placed in the “barrel” [visually identified using differential interference contrast (DIC) imaging] below the recorded cell. For current clamp experiments patch pipettes were filled with the following intracellular solution (in mM): 135 K-gluconate, 5 KCl, 10 HEPES, 0.01 EGTA, 10 Na2phosphocreatine, 4 MgATP, 0.3 NaGTP (295 mOsm, pH adjusted to 7.3 using KOH). The membrane potential (Vm) was recorded in current clamp mode (Multiclamp700B amplifier) and held at −70 mV (experimentally estimated RMP = −70.49 ± 1.33 mV, n = 23, PNs) if necessary, using small current injection (typically in a range between −50 pA and 200 pA). Recordings were not corrected for liquid junction potential. Series resistance was compensated online by balancing the bridge and compensating pipette capacitance. APs were initiated by brief current injection ranging from 1200–2000 pA and 2–5 ms duration. For calcium imaging experiments Alexa 594 (20 μM) and the calcium sensitive dye Fluo-5F (300 μM) were added to the intracellular solution daily. For all experiments data were discarded if series resistance, measured with a −5 mV pulse in voltage clamp configuration, was >20 ΜΩ or changed by more than 20% across the course of an experiment. For current clamp experiment cells were excluded if input resistance varied by more than 25% of the initial value. AMPA-EPSCs were recorded at −70 mV in the presence of the GABAA blocker picrotoxin (100 μM, Abcam). To record NMDA-EPSCs, NBQX (10 μM, Tocris) was added to the ASCF and the resting membrane potential changed to +30 mV. All recordings were low-pass filtered at 10 kHz and digitized at 100 kHz using an analog-to-digital converter (model NI USB 6259, National Instruments, Austin, TX, USA) and acquired with Nclamp software (Rothman and Silver, 2018) running in Igor PRO (Wavemetrics, Lake Oswego, OR, USA).
Paired recordings
For L2/3-L2/3 PN recordings, neurons were identified using DIC imaging. For L2/3-PV-INs and L2/3-SST-INs paired recordings cortical interneurons were identified using PV-Cre and SST-cre mice crossed with the reporter mouse line (Ai9, (ROSA)26Sortm9(CAG-tdTomato)Hze/Jt; JAX 007909). The intracellular solution used for presynaptic cell was (in mM): 130 K-MeSO3, 4 MgCl2,10 HEPES, 0.01 EGTA, 4 Na2ATP, 0.3 NaGTP (300 mOsm, pH 7.3 adjusted with NaOH). For the postsynaptic cell the same solution as described above for voltage clamp was used. Connections were probed using a train of 5/9 action potentials at frequency of 20 Hz. After a clear identification of synaptic connection (mean of 30 sweeps with clear AMPA current), post-synaptic cell membrane potential was brought from the initial−70 mV membrane potential to +30 mV to record the NMDAR-EPSCs in the presence of blockers as described before. Exogenous zinc application was obtained using a tricine (10 mM) buffered ACSF. At pH 7.3 and with 10 mM tricine, calculations show that there is a linear relation, [Zn]f = [Zn]t/200 for [Zn]f <1 μM (Fayyazuddin et al., 2000; Paoletti et al., 1997; Vergnano et al., 2014). A concentration of 60 μM zinc chloride was added to the solutions to obtain 300 nM of free zinc.
LTP protocol
After entering whole-cell configuration a 5 min period of evoked (frequency: 0.1 Hz) excitatory postsynaptic potentials (EPSPs) was recorded as baseline. LTP induction protocol consisted of 3 pulses at 100 Hz repeated 160 times with an inter stimulus interval of 2.5 Hz for a total duration of 1.2 min. This protocol was based on the previous observation that rhythmic whisker stimulation (duration of 1 min) induces LTP of glutamatergic L4 inputs into L2/3 cells both in vitro and vivo. The 3 pulses at 100 Hz were chosen to mimic the train of action potentials (1–3 APs) at high frequency (200–400 Hz) observed in L4 neurons in response to whisker stimulation (Yu et al., 2019). Synaptic EPSPs were recorded for an additional 30 min after LTP induction. LTP experiments were performed in the presence of the GABA A receptor blocker picrotoxin. To assure reliable quantification of LTP, experiments were terminated if membrane potential changed by more than 5 mV, which occurred with equal probability during baseline or after LTP induction. In all cells showing a 30 min recording period after LTP protocol, input resistance did not vary by more than 25% from the initial value. For the statistical analysis the average of the EPSPs over the baseline period of 5 min (baseline) was compared with mean obtained in the final 5 min of the 30 min recording after the induction (post-induction).
TFLZn experiments
In contrast to tricine, for which there is substantial evidence to be membrane impermeable, information about the membrane permeability of ZX1 was missing. Such information is essential for the interpretation of potential ZX1 effects. Especially to make claims about the involvement of extracellular vs intracellular zinc. We thus developed an assay to test for the membrane permeability of both tricine and ZX1 at concentrations normally used to chelate extracellular zinc. For that, we labeled intracellular zinc using the cell-permeable fluorescent probe, TFLZN, in a brain region particularly abundant in zinc, the mossy fiber system in the hippocampus. The idea being, as the probe is bound to intracellular zinc, extracellular zinc chelators that are not membrane permeable should not compete for intracellular zinc and thus should not alter TFLZN fluorescence. For these imaging experiments, 21–28 days old C57BL6/J mice (Charles River) were used. After deep anesthesia using isoflurane (Iso-Vet), mice were decapitated and the brain was rapidly removed and transferred in a slicing chamber filled with a cold (4°C) slicing solution containing sucrose (230 mM), glucose (25 mM), KCl (2.50 mM), NaH2PO4.H2O (1.25 mM), NaHCO3 (26 mM), CaCl2 (0.8 mM), MgCl2 (8 mM) and bubbled with 95% O2 and 5% CO2. Coronal brain slices 320 μm thick were obtained using a vibratome (Campden Instruments 7000 SMZ2). Slices were then immediately transferred in a chamber containing artificial cerebrospinal fluid (ACSF) at 31–33°C and recovered 1 h before use. ACSF classically contained NaCl (125 mM), KCl (2.5 mM), NaH2PO4.H2O (1.25 mM), NaHCO3 (26 mM), CaCl2 (2 mM), MgCl2 (1 mM) and was bubbled with 95% O2 and 5% CO2. In order to stain for vesicular zinc, brain slices were incubated for 1 h at room temperature in a solution containing ACSF, TFLZn K+ salt (250 μM, TEFLabs) and bubbled with 95% O2 and 5% CO2. Slices were then transferred in the experimental chamber and continuously perfused with a solution at 31–33°C containing oxygenated ACSF, bicuculline methochloride (10 μM, Hello Bio), tetrodotoxin (0.2 μM, Tocris) and either TPEN (25 μM or 125 μM, Sigma-aldrich), tricine (10 mM, Sigma-aldrich), or ZX1 (100 μM or 500 μM, Strem Chemicals). Excitation was provided by a UV pulse using a 365 nm LED (Thorlabs). UV illumination was concomitant to image acquisition, lasting 700 ms. Frequency acquisition was set at 1 frame per minute. Emitted fluorescence (510 nm) was collected and recorded using an Orca-FLASH4.0 camera (Hamamatsu) mounted on an upright microscope (Scientifica) equipped with a 10x water immersion objective (Olympus). The entire hippocampus was imaged using a motorized stage (Scientifica) controlled by Micromanager software (v1.4). Images were analyzed using ImageJ software (v 1.52n). Mean fluorescence intensities were measured for each image of a data set after defining a region of interest consisting of a representative area the stratum lucidum.
2P Ca2+ imaging
Cells were identified and whole-cell patch-clamped using infrared Dodt contrast (Luigs and Neumann, Ratingen, Germany) and a frame transfer CCD camera (Infinity-Lumenera). Two-photon fluorescence imaging was performed with a femtosecond pulsed Ti:Sapphire laser (Cameleon Ultra II, Coherent) tuned to 840 nm coupled into an Ultima laser scanning head (Ultima scanning head, Bruker), mounted on an Olympus BX61WI microscope, and equipped with a water-immersion objective (60X, 1.1 numerical aperture, Olympus Optical, Tokyo, Japan). Cell morphology was visualized using fluorescence imaging of patch-loaded Alexa 594 (20 μM). Ca2+ transients induced by focal synaptic stimulation were recorded using the calcium indicator Fluo-5F (300 nM) and rapid line scan imaging (0.76 ms per line). Total laser illumination per sweep lasted 400–600 ms. Fluorescence recordings started at least 25 min after establishing whole cell configuration for layer 2/3 cells (Figure S3), to allow dye equilibration. 7–10 linescans were recorded per dendrite (Layer 2/3 PNs) or with an intersweep frequency of 0.33 Hz. Recordings were discarded if red signal decreased/increased by ±20% of the initial value indicating incomplete initial dye equilibration. Fluorescence light was separated from the excitation path through a long pass dichroic (660dcxr; Chroma, USA), split into green and red channels with a second long pass dichroic (575dcxr; Chroma, USA), and cleaned up with band pass filters (hq525/70 and hq607/45; Chroma, USA). Fluorescence was detected using both proximal epi-fluorescence and substage photomultiplier tubes: multi-alkali (R3896, Hamamatsu, Japan) and gallium arsenide phosphide (H7422PA-40 SEL, Hamamatsu) for the red and green channels, respectively.
Focal dendritic stimulation
Focal two-photon guided synaptic stimulation in basal dendrites of L2/3 PNs was performed using a theta-glass pipette (series resistance 6–7 MegaOhm). Theta glass pipette filled with extracellular solution was placed in close proximity to the visual identified dendritic segment (5-7micrometer). Experiments were performed in the absence of pharmacological blockers and in the presence of D-Serine (100 μM). Synaptic responses were evoked (20 μs, 0–3 A; Digitimer Ltd, UK) using a short burst of 3 pulses at 50 Hz. The local stimulation was increased (20 μA per step) until a clear slow component of the EPSP, classically associated with the recruitment of NMDA conductances (NMDA spike) was observed. In a subset of experiments, a simultaneous calcium imaging experiment was used to test focal stimulation (see above). Somatically recorded EPSPs were highly correlated with calcium transients imaged in the dendrite close to the stimulation pipette. The threshold for NMDA spike was defined as the stimulating intensity that resulted in the presence of the slow EPSP decay in 50% of trials.
Glutamate uncaging
L2/3 PN morphology was visualized using fluorescence imaging of patch-loaded Alexa 594 (20 μM). The output of two pulsed Ti:Sapphire (DeepSee, Spectra Physics) lasers were independently modulated to combine uncaging of MNI-glutamate and Alexa 594 imaging. The imaging laser beam was tuned to 840 nm and modulated using a Pockels cell (Conoptics, Danbury, CT). For uncaging, the intensity and duration (500 μs) of illumination of the second Ti:Sapphire laser tuned to 720 nm was modulated using an acousto-optic modulator (AA Opto-Electronic, France). MNI-caged-L-glutamate (20 mM) was dissolved in a solution containing (in mM): NaCl 125, glucose 15, KCl 2.5, HEPES 10, CaCl2 2 and MgCl2 1 (pH 7.3) and constantly puffed applied using a glass pipette (res 2–2.5 MOhm) placed in the proximity of a selected dendrite. Multiple uncaging locations (6–8) were placed adjacent (1 μm) to visually identified spines and not closer than 2 μm to avoid glutamate spillover between locations. Laser intensity was adjusted to obtain individual pEPSP with amplitude between 0.2 and 0.9 mV (mean = 0.67 ± 0.06 mV). Photolysis laser powers, estimated at the exit of the objective were <20 mW. Interstimulus interval varied between 100 and 250 ms (isolated pEPSPs) and quasi-simultaneous activation (120 μsec between locations) The arithmetic sum (corrected for not perfect simultaneous spine activation) was used to compare the value obtained (expected) versus the recorded EPSP elicited by a increasing number of spines recruited by glutamate uncaging. An input-output curve was obtained by plotting the amplitude of the expected EPSP versus the amplitude of recorded EPSP. Non-linearity was calculated as previously described (Schmidt-Hieber C. et al., 2017):
Where n is the maximal number of synapses activated, Mi is the amplitude of the measured EPSP, Li is the amplitude of the EPSP constructed by the linear summation of the single synapses taking into account the relative timing of stimulation.
Quantification and statistical analysis
Analysis Ca2+ imaging
Calcium transients were extracted from linescan images. The fluorescence as a function of time was averaged over visually identified pixels corresponding to width of the dendrite and then averaged over individual trials, resulting in a single fluorescence trace as a function of time (Fdendrite(t)). The background fluorescence (Fback(t)) was estimated similarly (identical spatial line length), but from a location not on a labeled structure and the average value subtracted from Fdendrite(t). Changes in fluorescence were then quantified from the background corrected traces as: ΔG/R(t) = (Fgreen(t)-Frest,green)/(Fred) where Fgreen(t) is the green fluorescence signal as a function of time, Frest, green is the green fluorescence before stimulation and Fred is the average fluorescence of the red indicator (Alexa 594).
Statistical analysis
Data analysis was performed using IGOR Pro (Wave Metrics). All the statistical analysis was performed and graphs were created using Prism 8 (GraphPad). Most data are represented as mean ± SEM or using box and scatterplots depicting the median, the interquartile ranges as well as individual values. For statistical analysis normal distribution was not assumed and the following non-parametric tests were used: Wilcoxon matched-pair signed rank test for paired samples, Mann-Whitney test for unpaired, Kruskal Wallis test followed by Dunn's test to correct for multiple comparison if necessary. Significance was conventionally set as ∗∗∗p < 0.001, ∗∗p < 0.01 and ∗p < 0.05.
Computational model of L2/3 pyramidal cell
We performed numerical simulations of single cell integration on morphologically-detailed L2/3 pyramidal cell (ID ″L23pyr-j150407a" from the publicly available morphology dataset from Jiang et al., 2015, see Figure 3F). Single cell integration was simulated using the cable equation (Koch, 1984; Rall, 1962):
where the membrane current im and the input currents iI are linear density of currents. The cable equation parameters are derived from the membrane parameters of Table S1 by applying the radial symmetry (for a segment of diameter D: rm = 1/(D·GL), cm = π·D·Cm,ri=(4·Ri)/(π·D2). Additional point currents (synaptic inputs and/or "voltage-clamp"-currents) are inserted in a segment through the iI term (as iI =Ipoint/lS for a current Ipoint and a segment of length lS). For voltage-clamp protocols, the leak conductance gL was decreased by a factor 5 to reproduce the Cesium block, an additional point current Iclamp= gclamp·(Vcmd-Vm) of clamping conductance 1 μS was inserted at the soma, an additional 200 ms were added prior to stimulation to reach stationary "clamp" conditions (initialized at Vcmd) and we report the Iclamp quantity after those 200 ms (see Figure S3F). The simulations were implemented using the Brian2 simulator (Stimberg et al., 2019). Numerical integration was performed with an "exponential Euler" integration scheme and a time step of 0.025 ms.
Synaptic currents
We considered 2 types of synaptic transmission: NMDA and AMPA. For both synaptic types, the temporal profile of the synaptically-evoked conductance variations was made of a double exponential waveform (Destexhe et al., 1998; Koch, 2004; Zerlaut and Destexhe, 2017).
where τsynrise and τsyndecay are the rise and a decay time constant respectively. The waveform was normalized to peak level with the factor:
For an AMPA synapse activated by a set of events {tk} located at position i (of membrane potential Vmi), the synaptic current Isyni reads:
where qsyn is the conductance quantal of the synaptic release (setting the peak conductance level) and H(t) is the Heaviside (step) function. We relied on our experimental measurements to determine the ratio of NMDA to AMPA conductances. We found the ratio of NMDA to AMPA peak currents to be 2.7 ± 1.5 (n = 10 cells), similar to previous reports (Branco and Häusser, 2011). 'This value was used to set the ratio between the NMDA to AMPA quantal conductances (see Table S1).
For NMDA synapses, we add a voltage-dependency due to the Magnesium block captured by an exponential function (reviewed in Koch, 2004) and a zinc-binding dependency (detailed in the next section):
The synaptic parameters are summarized on Table S1.
Modeling zinc-modulation of NMDAR signaling
We derive a model of the zinc modulation of NMDAR signaling based on our experimental observations and previous studies (Vergnano et al., 2014). Our modeling approach aimed at describing the modulation in the form of a minimal phenomenological description at the single synapse level. The reasoning guiding the derivation of the model is the following (illustrated in Figure 3K). Glutamatergic events are associated with a release of zinc in the synaptic cleft. zinc has a high affinity for binding and does not accumulate in the cleft (the cleft is free of zinc in less than 2 ms), so the dynamics is led by the binding-unbinding phenomenon. zinc binding is modeled by a variable bZn varying between 0 (no binding) and 1 (full binding). zinc binding is approximated as instantaneous and fully saturating the binding site at every single synaptic release event, i.e. it is updated to fully-bound level bZn = 1 at each glutamatergic event. zinc unbinding has a decay time constant τZndecay. The dynamics of zinc binding bZn therefore follows the equation:
At the time of a synaptic release, the current level of zinc binding will determine the magnitude of the reduction of NMDA conductance due to the zinc modulation. The factor modulating the NMDA conductance mZn(t) is a piecewise time-varying function updated to the bZn level at every synaptic release. Therefore, for a set of glutamatergic events {tk}, the time-varying factor mZn is defined by the piecewise function:
Finally, a parameter αZn captures the inhibitory efficacy of zinc binding on NMDAR conductance. At full binding (bZn = 1), the NMDA conductance has a factor 1-αZn. The zinc modulation is therefore summarized by the factor 1 – αZn·mZn(t) (see previous section). The dynamics of the bZn and mZn variables following synaptic events and their impact on the time-varying conductance gNMDA(t) is illustrated on Figure 3K and we describe the model behavior over different Vm ranges in Figure 3K.
Synaptic locations on the basal dendrites
To host the synaptic stimulation, we looked for n = 25 locations (set of segments) distributed over the basal dendrite. The criteria to include a location was that the set of segment should be contiguous over the dendritic tree (i.e. not spread over multiple branches) and the starting point should at least 50 μm far from the soma (as excitatory synapses tend to avoid perisomatic locations). We looped over random starting segments in the dendritic tree, a location was considered as the starting segment with the next 20 following segments. The location was included if the criteria was matched and the loop was stopped when we found n = 25 locations. The resulting set of the synaptic locations is shown in Figure 3O. We then spread one synapse per segment. From this set of locations, we can therefore recruit up to 20 synapses (see Figure 3O or Figure 6).
Model calibration: parameter fitting
The parameters of the model were fitted in successive steps.
Passive properties
To calibrate the passive properties of the model, i.e. the membrane leak conductance GL and the membrane capacitance Cm (see Table S1), we used our set of current-clamp experimental recordings to determine the input resistance and capacitance at the soma. The experimental values were found to be Rsoma = 137.5 ± 50.2 MΩ, Csoma = 208.1 ± 43.0 pF (n = 27 cells). In the model, we varied the passive parameters and computed the input resistance and capacitance at the soma. This was achieved by fitting the Vm response to the single compartment response following a 200 pA current step. The range for the parameter variation was GL in [0.02,2.0] pS/μm2 and Cm in [0.5,2.0] μF/cm2 on a [30 × 30] regular grid. The joint minimization (via the product of the normalized square residual) of the somatic Rsoma and Csoma in the model led to the parameters GL = 0.29 pS/μm2 and Cm = 0.91 μF/cm2, similar to previous analysis of layer 2/3 pyramidal cell in mice sensory cortex (Branco and Häusser, 2011; Palmer et al., 2014).
Biophysical parameters of zinc modulation
We used our set of voltage-clamp recordings with extracellular stimulation at 20 Hz and 3 Hz in L2/3 (data of Figures 1B and 1C) to constraint the zinc-dependent NMDAR model. We optimized the product of the normalized residual traces at 20 Hz and 3 Hz between model and experiment. The experimental data was a "grand-average" over cells after trial-averaging (see "data" in Figure S3G). The first step consisted in using the "chelated-zinc" condition to evaluate the NMDAR kinetics (τdecayNMDA) and to find the correlate in the model of the extracellular stimulation protocol. We described the electrical stimulation as a number of activated synapses Nsyn decreasing with stimulation time (to capture the decreasing efficacy of the electrical stimulation in the control case, see Figure S3G): Nsyn(t)= (Nsyn0- Nsyn∞)·exp(-t/τN)+Nsyn∞. We varied the parameters in the range τdecayNMDA in [60,120]ms, Nsyn0 in [3, 11] synapses, Nsyn∞ in [2, 10] synapses and τN in [30,70]ms on a [7x5x5x4] linear grid. The best fit model was found for: τdecayNMDA = 70.0 ms, Nsyn0 = 7 synapses, Nsyn∞ = 2 synapses and τN = 56.7 ms (see “chelated-zinc” in Figure S3G). In a second step, we used the "free-zinc condition" to determine the zinc-modulation parameters of the NMDAR model introduced (αZn and τdecayZn). We varied the zinc parameters in the range αZn in [0.1,0.6] and τdecayZn in [100,1300] ms on a [30 × 30] linear grid. The best fit model was found for: αZn = 0.19 and τdecayZn = 638.0 ms.
Pathway specificity of zinc modulation
To estimate the parameters of zinc modulation corresponding to each synaptic pathway, we first computed the relationship in the model between zinc efficacy αZn and the level of charge increase under zinc chelation (i.e. with respect to the αZn = 0 setting) in the fifth pulse following a 5 pulse stimulation at 20 Hz (see Figure 1 and S3F). We then inverted this relationship to relate an experimental observation to a model setting. For the L4-to-L2/3 pathway, the zinc chelation effect following extracellular stimulation in L4 was non-significantly deviating from 0 (Figures 1H and 1I) so the corresponding zinc efficacy was set to αZn = 0. For the L23-to-L23 pathway, zinc chelation increased charge by 47 ± 16% in paired intracellular recordings (Figures 1E and 1F) and the corresponding level of zinc efficacy in the model was found to be αZn = 0.45.
Model of background and stimulus-evoked synaptic activity
Background synaptic activity was adapted from a previous study (Zerlaut and Destexhe, 2017). At each synapse, a given rate value νbg was converted into a presynaptic pattern thanks to an homogeneous Poisson point process. All simulations were repeated over n = 10 different realisations of the background activity. Stimulus-evoked activity was designed as follows. For a stimulation at time t with a level of synaptic recruitment Nsyn, we randomly chose Nsyn synapses over the 20 synapses available at each synaptic location (see above) and the event of each of the Nsyn synapse was drawn from a uniform distribution of 20 ms width centered at t. The simulations were repeated over different realisations of the stimulus pattern. Example of the background and stimulus-evoked synaptic events for single trials are shown on Figures 6B and 6C.
Active membrane currents
We analyzed the impact of active cellular mechanisms (Figures 5 and Figure 6) by adding the following currents in the single cell model: "Na"-current, "Kv"-current, "T"-current, "Ca"-current, "M"-current, "H"-current, "KCa"-current and a decay dynamics for the Calcium concentration (reviewed in Koch, 2004). The currents and their densities in the different compartments are listed Table S1.
Decoding synaptic stimulation level from single trial Vm responses
We built a decoder of the stimulus intensity classifying single-trial somatic Vm responses in the [-100,300] ms interval surrounding stimulus onset (Figure 4). The waveforms were baseline-subtracted (estimated from the [-100,0] ms interval) to remove the influence of the relationship between background activity and baseline level. The training set was defined as the set of the trial-averaged response (averaging over n = 10 background realisations for each synaptic location and stimulus seed) and the test set was the set of single trial responses for a given synaptic location and stimulus seed. The decoder was implemented using the NearestNeighbors function of sklearn (Pedregosa et al., 2011) and we used the euclidean metric to evaluate distance between response waveforms.
Acknowledgments
This study was supported by the Centre National de la Recherche Scientifique, the European Research Council (ANR-20-CE16-0009-02, NARSAD young investigator grant no. 27653, and ERC-STG- 678250 to N.R.; ERC-ADV-693021 to P.P.), the Paris Brain Institute, “Investissements d'avenir” (ANR-10-IAIHU-06), and the Fondation pour la Recherche Médicale (FRM) (fellowship ARF 201909009117 to Y.Z. and fellowship FDT201805005817 to B.S.). We thank Dr. Alberto Bacci for critical reading of the manuscript and Dr. Richard Palmiter (University of Washington, USA) for providing the ZnT3-KO mouse line. We would also like to thank the Paris Brain Institute core facilities, namely HISTOMICS and ICMice phenopark animal core facility. Schematic drawings in the graphical abstract were adopted from https://scidraw.io/ under a creative commons license (CC-BY).
Author contributions
Conceptualization, A.M., Y.Z., and N.R.; electrophysiology, calcium imaging experiments acquisition, and analysis, A.M.; computational modeling and simulations, Y.Z.; Timm's staining and analysis, R.S.; TFLZn imaging and analysis, B.S. and P.P.; writing – original draft, A.M., Y.Z., P.P., and N.R.; writing – review & editing, A.M., Y.Z., B.S., R.S., P.P., and N.R.; supervision, N.R.; funding acquisition, P.P., Y.Z., B.S., and N.R.
Declaration of interests
The authors declare no competing interests.
Published: February 22, 2022
Footnotes
Supplemental information can be found online at https://doi.org/10.1016/j.celrep.2022.110415.
Supplemental information
Data and code availability
-
•
All data reported in this paper will be shared by the lead contact upon request.
-
•
All original code has been deposited at https://doi.org/10.5281/zenodo.5905537 and is publicly available as of the date of publication.
-
•
Any additional information required to reanalyze the data reported in this paper is available from the lead contact upon request.
References
- Abbott L.F. Synaptic depression and cortical gain control. Science. 1997;275:221–224. doi: 10.1126/science.275.5297.221. [DOI] [PubMed] [Google Scholar]
- Abbott L.F., Varela J.A., Sen K., Nelson S.B. Synaptic depression and cortical gain control. Science. 1997;275:220–224. doi: 10.1126/science.275.5297.221. [DOI] [PubMed] [Google Scholar]
- Abrahamsson T., Cathala L., Matsui K., Shigemoto R., DiGregorio D.A. Thin dendrites of cerebellar interneurons confer sublinear synaptic integration and a gradient of short-term plasticity. Neuron. 2012;73:1159–1172. doi: 10.1016/j.neuron.2012.01.027. [DOI] [PubMed] [Google Scholar]
- Adlard P.A., Parncutt J.M., Finkelstein D.I., Bush A.I. Cognitive loss in zinc transporter-3 knock-out mice: a phenocopy for the synaptic and memory deficits of Alzheimer’s disease? J. Neurosci. 2010;30:1631–1636. doi: 10.1523/JNEUROSCI.5255-09.2010. [DOI] [PMC free article] [PubMed] [Google Scholar]
- Anderson C.T., Radford R.J., Zastrow M.L., Zhang D.Y., Apfel U.-P., Lippard S.J., Tzounopoulos T. Modulation of extrasynaptic NMDA receptors by synaptic and tonic zinc. Proc. Natl. Acad. Sci. 2015;112:E2705–E2714. doi: 10.1073/pnas.1503348112. [DOI] [PMC free article] [PubMed] [Google Scholar]
- Anderson C.T., Kumar M., Xiong S., Tzounopoulos T. Cell-specific gain modulation by synaptically released zinc in cortical circuits of audition. ELife. 2017;6:e29893. doi: 10.7554/eLife.29893. [DOI] [PMC free article] [PubMed] [Google Scholar]
- Assaf S.Y., Chung S.H. Release of endogenous Zn2+ from brain tissue during activity. Nature. 1984;308:734–736. doi: 10.1038/308734a0. [DOI] [PubMed] [Google Scholar]
- Branco T., Häusser M. Synaptic integration gradients in single cortical pyramidal cell dendrites. Neuron. 2011;69:885–892. doi: 10.1016/j.neuron.2011.02.006. [DOI] [PMC free article] [PubMed] [Google Scholar]
- Brown C.E., Dyck R.H. Distribution of zincergic neurons in the mouse forebrain. J. Comp. Neurol. 2004;479:156–167. doi: 10.1002/cne.20308. [DOI] [PubMed] [Google Scholar]
- Brunel N., Hakim V., Richardson M.J. Single neuron dynamics and computation. Curr. Opin. Neurobiol. 2014;25:149–155. doi: 10.1016/j.conb.2014.01.005. [DOI] [PubMed] [Google Scholar]
- Carandini M., Heeger D.J. Normalization as a canonical neural computation. Nat. Rev. Neurosci. 2012;13:51–62. doi: 10.1038/nrn3136. [DOI] [PMC free article] [PubMed] [Google Scholar]
- Destexhe A., Mainen Z.F., Sejnowski T.J. In: Koch C., Segev I., editors. Vol. 26. MIT Press; 1998. Kinetic models of synaptic transmission. (Methods in Neuronal Modeling). [Google Scholar]
- Erreger K., Traynelis S.F. Allosteric interaction between zinc and glutamate binding domains on NR2A causes desensitization of NMDA receptors: zinc-dependent desensitization of NMDA receptors. J. Physiol. 2005;569:381–393. doi: 10.1113/jphysiol.2005.095497. [DOI] [PMC free article] [PubMed] [Google Scholar]
- Farinella M., Ruedt D.T., Gleeson P., Lanore F., Silver R.A. Glutamate-bound NMDARs arising from in vivo-like network activity extend spatio-temporal integration in a L5 cortical pyramidal cell model. PLoS Comput. Biol. 2014;10:e1003590. doi: 10.1371/journal.pcbi.1003590. [DOI] [PMC free article] [PubMed] [Google Scholar]
- Fayyazuddin A., Villarroel A., Le Goff A., Lerma J., Neyton J. Four residues of the extracellular N-terminal domain of the NR2A subunit control high-affinity Zn2+ binding to NMDA receptors. Neuron. 2000;25:683–694. doi: 10.1016/s0896-6273(00)81070-3. [DOI] [PubMed] [Google Scholar]
- Feldmeyer D., Lübke J., Silver R.A., Sakmann B. Synaptic connections between layer 4 spiny neurone- layer 2/3 pyramidal cell pairs in juvenile rat barrel cortex: physiology and anatomy of interlaminar signalling within a cortical column. J. Physiol. 2002;538:803–822. doi: 10.1113/jphysiol.2001.012959. [DOI] [PMC free article] [PubMed] [Google Scholar]
- Frederickson C.J., Suh S.W., Silva D., Frederickson C.J., Thompson R.B. Importance of zinc in the central nervous system: the zinc-containing neuron. J. Nutr. 2000;130:1471S–1483S. doi: 10.1093/jn/130.5.1471S. [DOI] [PubMed] [Google Scholar]
- Gambino F., Holtmaat A. Spike-timing-dependent potentiation of sensory surround in the somatosensory cortex is facilitated by deprivation-mediated disinhibition. Neuron. 2012;75:490–502. doi: 10.1016/j.neuron.2012.05.020. [DOI] [PubMed] [Google Scholar]
- Gambino F., Pagès S., Kehayas V., Baptista D., Tatti R., Carleton A., Holtmaat A. Sensory-evoked LTP driven by dendritic plateau potentials in vivo. Nature. 2014;515:116–119. doi: 10.1038/nature13664. [DOI] [PubMed] [Google Scholar]
- Garst-Orozco J., Malik R., Lanz T.A., Weber M.L., Xi H., Arion D., Enwright J.F., Lewis D.A., O’Donnell P., Sohal V.S., et al. GluN2D-mediated excitatory drive onto medial prefrontal cortical PV+ fast-spiking inhibitory interneurons. PLoS One. 2020;15:e0233895. doi: 10.1371/journal.pone.0233895. [DOI] [PMC free article] [PubMed] [Google Scholar]
- Glazewski S., Herman C., McKenna M., Chapman P.F., Fox K. Long-term potentiation in vivo in layers II/III of rat barrel cortex. Neuropharmacology. 1998;37:581–592. doi: 10.1016/s0028-3908(98)00039-2. [DOI] [PubMed] [Google Scholar]
- Hardingham N.R., Gould T., Fox K. Anatomical and sensory experiential determinants of synaptic plasticity in layer 2/3 pyramidal neurons of mouse barrel cortex. J. Comp. Neurol. 2011;519:2090–2124. doi: 10.1002/cne.22583. [DOI] [PubMed] [Google Scholar]
- Haug F.M. Electron microscopical localization of the zinc in hippocampal mossy fibre synapses by a modified sulfide silver procedure. Histochemie. 1967;8:355–368. doi: 10.1007/BF00401978. [DOI] [PubMed] [Google Scholar]
- Häusser M., Spruston N., Stuart G.J. Diversity and dynamics of dendritic signaling. Science. 2000;290:739–744. doi: 10.1126/science.290.5492.739. [DOI] [PubMed] [Google Scholar]
- Howell G.A., Welch M.G., Frederickson C.J. Stimulation-induced uptake and release of zinc in hippocampal slices. Nature. 1984;308:736–738. doi: 10.1038/308736a0. [DOI] [PubMed] [Google Scholar]
- Jiang X., Shen S., Cadwell C.R., Berens P., Sinz F., Ecker A.S., Patel S., Tolias A.S. Principles of connectivity among morphologically defined cell types in adult neocortex. Science. 2015;350:aac9462. doi: 10.1126/science.aac9462. [DOI] [PMC free article] [PubMed] [Google Scholar]
- Koch C. Cable theory in neurons with active, linearized membranes. Biol. Cybern. 1984;50:15–33. doi: 10.1007/BF00317936. [DOI] [PubMed] [Google Scholar]
- Koch C. Oxford University Press; 2004. Biophysics of Computation: Information Processing in Single Neurons. [Google Scholar]
- Losonczy A., Makara J.K., Magee J.C. Compartmentalized dendritic plasticity and input feature storage in neurons. Nature. 2008;452:436–441. doi: 10.1038/nature06725. [DOI] [PubMed] [Google Scholar]
- Major G., Larkum M.E., Schiller J. Active properties of neocortical pyramidal neuron dendrites. Annu. Rev. Neurosci. 2013;36:1–24. doi: 10.1146/annurev-neuro-062111-150343. [DOI] [PubMed] [Google Scholar]
- Maske H. Über den topochemischen Nachweis von Zink im Ammonshorn verschiedener Säugetiere. Naturwissenschaften. 1955;42:424. [Google Scholar]
- McAllister B.B., Dyck R.H. Zinc transporter 3 (ZnT3) and vesicular zinc in central nervous system function. Neurosci. Biobehavioral Rev. 2017;80:329–350. doi: 10.1016/j.neubiorev.2017.06.006. [DOI] [PubMed] [Google Scholar]
- McCormick D.A., Nestvogel D.B., He B.J. Neuromodulation of brain state and behavior. Annu. Rev. Neurosci. 2020;43:391–415. doi: 10.1146/annurev-neuro-100219-105424. [DOI] [PMC free article] [PubMed] [Google Scholar]
- McGinley M.J., Vinck M., Reimer J., Batista-Brito R., Zagha E., Cadwell C.R., Tolias A.S., Cardin J.A., McCormick D.A. Waking state: rapid variations modulate neural and behavioral responses. Neuron. 2015;87:1143–1161. doi: 10.1016/j.neuron.2015.09.012. [DOI] [PMC free article] [PubMed] [Google Scholar]
- Nozaki C., Vergnano A.M., Filliol D., Ouagazzal A.-M., Le Goff A., Carvalho S., Reiss D., Gaveriaux-Ruff C., Neyton J., Paoletti P., et al. Zinc alleviates pain through high-affinity binding to the NMDA receptor NR2A subunit. Nat. Neurosci. 2011;14:1017–1022. doi: 10.1038/nn.2844. [DOI] [PMC free article] [PubMed] [Google Scholar]
- Palmer L.M., Shai A.S., Reeve J.E., Anderson H.L., Paulsen O., Larkum M.E. NMDA spikes enhance action potential generation during sensory input. Nat. Neurosci. 2014;17:383–390. doi: 10.1038/nn.3646. [DOI] [PubMed] [Google Scholar]
- Palmiter R.D., Cole T.B., Quaife C.J., Findley S.D. ZnT-3, a putative transporter of zinc into synaptic vesicles. Proc. Natl. Acad. Sci. 1996;93:14934–14939. doi: 10.1073/pnas.93.25.14934. [DOI] [PMC free article] [PubMed] [Google Scholar]
- Pan E., Zhang X., Huang Z., Krezel A., Zhao M., Tinberg C.E., Lippard S.J., McNamara J.O. Vesicular zinc promotes presynaptic and inhibits postsynaptic long-term potentiation of mossy fiber-CA3 synapse. Neuron. 2011;71:1116–1126. doi: 10.1016/j.neuron.2011.07.019. [DOI] [PMC free article] [PubMed] [Google Scholar]
- Paoletti P. Molecular basis of NMDA receptor functional diversity. Eur. J. Neurosci. 2011;33:1351–1365. doi: 10.1111/j.1460-9568.2011.07628.x. [DOI] [PubMed] [Google Scholar]
- Paoletti P., Ascher P., Neyton J. High-affinity zinc inhibition of NMDA NR1-NR2A receptors. J. Neurosci. 1997;17:5711–5725. doi: 10.1523/JNEUROSCI.17-15-05711.1997. [DOI] [PMC free article] [PubMed] [Google Scholar]
- Paoletti P., Vergnano A.M., Barbour B., Casado M. Zinc at glutamatergic synapses. Neuroscience. 2009;158:126–136. doi: 10.1016/j.neuroscience.2008.01.061. [DOI] [PubMed] [Google Scholar]
- Patrick Wu H.-P., Dyck R.H. Signaling by synaptic zinc is required for whisker-mediated, fine texture discrimination. Neuroscience. 2018;369:242–247. doi: 10.1016/j.neuroscience.2017.11.020. [DOI] [PubMed] [Google Scholar]
- Pedregosa F., Varoquaux G., Gramfort A., Michel V., Thirion B., Grisel O., Blondel M., Prettenhofer P., Weiss R., Dubourg V., et al. Scikit-learn: machine learning in Python. J. Machine Learn. Res. 2011;12:2825–2830. [Google Scholar]
- Polsky A., Mel B., Schiller J. Encoding and decoding bursts by NMDA spikes in basal dendrites of layer 5 pyramidal neurons. J. Neurosci. 2009;29:11891–11903. doi: 10.1523/JNEUROSCI.5250-08.2009. [DOI] [PMC free article] [PubMed] [Google Scholar]
- Rall W. Theory of physiological properties of dendrites. Ann. N. Y Acad. Sci. 1962;96:1071–1092. doi: 10.1111/j.1749-6632.1962.tb54120.x. [DOI] [PubMed] [Google Scholar]
- Raman I.M., Tong G., Jahr C.E. B-adrenergic regulation of synaptic NMDA receptors by cAMP-dependent protein kinase. Neuron. 1996;16:415–421. doi: 10.1016/s0896-6273(00)80059-8. [DOI] [PubMed] [Google Scholar]
- Rothman J.S., Silver R.A. NeuroMatic: an integrated open-source software toolkit for acquisition, analysis and simulation of electrophysiological data. Front. Neuroinformatics. 2018;12:14. doi: 10.3389/fninf.2018.00014. [DOI] [PMC free article] [PubMed] [Google Scholar]
- Schiller J., Major G., Koester H.J., Schiller Y. NMDA spikes in basal dendrites of cortical pyramidal neurons. Nature. 2000;404:285–289. doi: 10.1038/35005094. [DOI] [PubMed] [Google Scholar]
- Sensi S.L., Paoletti P., Bush A.I., Sekler I. Zinc in the physiology and pathology of the CNS. Nat. Rev. Neurosci. 2009;10:780–791. doi: 10.1038/nrn2734. [DOI] [PubMed] [Google Scholar]
- Silver R.A. Neuronal arithmetic. Nat. Rev. Neurosci. 2010;11:474–489. doi: 10.1038/nrn2864. [DOI] [PMC free article] [PubMed] [Google Scholar]
- Silver R.A., Lübke J., Sakmann B., Feldmeyer D. High-probability uniquantal transmission at excitatory synapses in barrel cortex. Science. 2003;302:1981–1984. doi: 10.1126/science.1087160. [DOI] [PubMed] [Google Scholar]
- Smith S.L., Smith I.T., Branco T., Häusser M. Dendritic spikes enhance stimulus selectivity in cortical neurons in vivo. Nature. 2013;503:115–120. doi: 10.1038/nature12600. [DOI] [PMC free article] [PubMed] [Google Scholar]
- Stimberg M., Brette R., Goodman D.F. Brian 2, an intuitive and efficient neural simulator. Elife. 2019;8:e47314. doi: 10.7554/eLife.47314. [DOI] [PMC free article] [PubMed] [Google Scholar]
- Tong G., Shepherd D., Jahr C. Synaptic desensitization of NMDA receptors by calcineurin. Science. 1995;267:1510–1512. doi: 10.1126/science.7878472. [DOI] [PubMed] [Google Scholar]
- Ujfalussy B.B., Makara J.K., Lengyel M., Branco T. Global and multiplexed dendritic computations under in vivo-like conditions. Neuron. 2018;100:579–592.e5. doi: 10.1016/j.neuron.2018.08.032. [DOI] [PMC free article] [PubMed] [Google Scholar]
- Vergnano A.M., Rebola N., Savtchenko L.P., Pinheiro P.S., Casado M., Kieffer B.L., Rusakov D.A., Mulle C., Paoletti P. Zinc dynamics and action at excitatory synapses. Neuron. 2014;82:1101–1114. doi: 10.1016/j.neuron.2014.04.034. [DOI] [PubMed] [Google Scholar]
- Vervaeke K., Lorincz A., Nusser Z., Silver R.A. Gap junctions compensate for sublinear dendritic integration in an inhibitory network. Science. 2012;335:1624–1628. doi: 10.1126/science.1215101. [DOI] [PMC free article] [PubMed] [Google Scholar]
- Vinck M., Batista-Brito R., Knoblich U., Cardin J.A. Arousal and locomotion make distinct contributions to cortical activity patterns and visual encoding. Neuron. 2015;86:740–754. doi: 10.1016/j.neuron.2015.03.028. [DOI] [PMC free article] [PubMed] [Google Scholar]
- Vogt K., Mellor J., Tong G., Nicoll R. The actions of synaptically released zinc at hippocampal mossy fiber synapses. Neuron. 2000;26:187–196. doi: 10.1016/s0896-6273(00)81149-6. [DOI] [PubMed] [Google Scholar]
- Williams L.E., Holtmaat A. Higher-order thalamocortical inputs gate synaptic long-term potentiation via disinhibition. Neuron. 2019;101:91–102.e4. doi: 10.1016/j.neuron.2018.10.049. [DOI] [PubMed] [Google Scholar]
- Yu J., Hu H., Agmon A., Svoboda K. Recruitment of GABAergic interneurons in the barrel cortex during active tactile behavior. Neuron. 2019;104:412–427.e4. doi: 10.1016/j.neuron.2019.07.027. [DOI] [PMC free article] [PubMed] [Google Scholar]
- Zerlaut Y., Destexhe A. Heterogeneous firing responses predict diverse couplings to presynaptic activity in mice layer V pyramidal neurons. PLoS Comput. Biol. 2017;13:e1005452. doi: 10.1371/journal.pcbi.1005452. [DOI] [PMC free article] [PubMed] [Google Scholar]
- Zerlaut Y., Zucca S., Panzeri S., Fellin T. The spectrum of asynchronous dynamics in spiking networks as a model for the diversity of non-rhythmic waking states in the neocortex. Cell Rep. 2019;27:1119–1132.e7. doi: 10.1016/j.celrep.2019.03.102. [DOI] [PMC free article] [PubMed] [Google Scholar]
Associated Data
This section collects any data citations, data availability statements, or supplementary materials included in this article.
Supplementary Materials
Data Availability Statement
-
•
All data reported in this paper will be shared by the lead contact upon request.
-
•
All original code has been deposited at https://doi.org/10.5281/zenodo.5905537 and is publicly available as of the date of publication.
-
•
Any additional information required to reanalyze the data reported in this paper is available from the lead contact upon request.